Article

False Positive Identification of Pesticides in Food Using the European Standard Method and LC-MS/MS Determination: Examples and Solutions from Routine Applications

1
Bálint Analitika Ltd., Fehérvári út 144, 1116 Budapest, Hungary
2
Mertcontrol Hungary Kft., Szabadság út 13, 2144 Kerepes, Hungary
*
Author to whom correspondence should be addressed.
Appl. Sci. 2022, 12(23), 12005; https://doi.org/10.3390/app122312005
Submission received: 29 October 2022 / Revised: 18 November 2022 / Accepted: 22 November 2022 / Published: 24 November 2022
(This article belongs to the Special Issue Innovative Technology in Food Analysis and Processing)

Abstract

:

Featured Application

This paper contains relevant information on the application of the standard method on pesticide analysis in food.

Abstract

The latest standard method for pesticides in food and feed (EN 15662:2018) is now generally used in control laboratories. However, routine analyses of the combination of hundreds of compounds and food matrices highlighted that false positive identification of pesticides in particular food matrices does occur. The aim of the study was to show relevant precedents when thorough investigation was necessary to make a decision on possibly compliant/non-compliant samples. Examples include the pesticide/commodity combination of atrazine-desethyl in date seed coffee, mepanipyrim in parsley root, myclobutanil in white peppercorn, primisulfuron-methyl in herb extract, propham in elderberry, quinoclamine in fennel and tebufenpyrad in dried ginger. These examples, which were presented for the first time, indicated that the identification criteria for some pesticides in certain food matrices, according to the SANTE/11312/2021 guideline, might fail: the general criteria as stable retention time and ion ratio could lead to an incorrect qualification of pesticides. Standard addition was useful not only in compensating for the background during mass spectrometric detection under the confirmatory analysis, but also in the identification process when negligible retention time difference was observed between the analytes and the interfering matrix compounds.

1. Introduction

Pesticides have been extensively used in agriculture that may lead to a considerable number of contaminated food samples [1,2,3]. These residues cause either acute or chronic toxicity depending on the dose and the length of time exposed [4,5,6]. Therefore, the EU and the third countries set maximum levels of certain pesticides in food matrices [7,8]. In the EU, the European Food Safety Authority (EFSA) assesses the safety for consumers based on the toxicity of the pesticide and proposes maximum residue limits (MRLs) in food [9]. The MRL concentrations for pesticides are summarized in regulation EC 396/2005 [7]. MRLs apply to more than 300 fresh products and to the same products after processing. Currently, the legislation covers more than 1000 pesticides worldwide.
The simultaneous analysis of such a high number of analytes in food requires both liquid chromatography and gas chromatography coupled to tandem mass spectrometric detection (LC-MS/MS and GC-MS/MS) [10,11,12,13,14,15,16,17]. Hence, the current standard method (EN 15662:2018) suggests the use of these techniques [18]. Analytical criteria for the analysis are laid down in SANTE/11312/2021 guideline [19], which are related to chromatographic retention time, peak shape and the intensity ratio of ion transitions scanned for target compounds (i.e., ion ratio (IR)). The retention time of the given analyte in the sample should not deviate from that one in the calibration within a tolerance limit of ±0.1 min. If the peak shape distortion is caused by the matrix and not by an interfering peak, a larger retention time shift may be acceptable in case the method includes the corresponding isotopically labelled internal standard whose peak shape is also distorted [19]. The IR is calculated as the response ratio of the qualifier (less intense ion trace) and the quantifier ion transitions. IR values from sample extracts should be within ±30% of the average of the calibration standards from the same sequence [19].
Even though the identification criteria listed above are appropriate, false identifications have been reported in certain cases [20,21,22,23]. This links to the high number of pesticide/commodity combinations. The analysis of hundreds of pesticides in foods with rather different matrices (hydrophilic/lipophilic) could lead to wrong qualification of certain pesticides using GC-MS or LC-MS detections. Using high resolution MS (HRMS) Malato et al. (2011) detected nine false positives per sample when employing LC-QTOF-MS (time-of-flight mass spectrometry) [20]. Mol et al. (2012) also addressed LC-HRMS to screen pesticides in food; when only the retention time (±30 s) and one diagnostic ion (mass accuracy tolerance of ±5 ppm) were used for identification, the number of false positives were between 19 (bell pepper) and 41 (white cabbage) [21]. Overall, 128 pesticides (e.g., diethyltoluamide, isoprocarb, metolcarb, pyrethrin I, and trimethacarb) were falsely detected in the total of 21 commodities. The relative response thresholds or the second diagnostic ion could improve the identification. As for the secondary ion, the A + 1 or A + 2 isotope for chlorinated and brominated pesticides may all be suitable options [21]. Schürmann et al. (2009) reported the false identification of sebuthylazine in a tarragon sample by LC-MS/MS (triple quadrupole) technique using two ion transitions and their IR for identification at the expected retention time of sebuthylazine [22]. The application of a third ion transition for MS/MS detection, GC-MS analysis and LC-TOF-MS could appropriately show that the identified compound was actually nepellitorine [22]. In 2015, a collaborative study on LC-MS/MS identification reported that it is indeed not supported to apply relative tolerances for retention time values, and to set different tolerances for ion ratios depending on the relative abundance of the two measured product ions. Absolut retention time shift of ±0.1 min is acceptable and IR deviations are typically within ±20% (relative). This was concluded from as many as 135,000 manually verified chromatograms [23]. False identification with GC-MS was also published recently. Earlier, delta-hexachlorocyclohexane was detected in tobacco [11], and only multidimensional (that is, more expensive) separation could verify that this analyte was not present in the sample over the limit of detection.
In our laboratory, we address the LC-MS/MS technique on a daily basis to cover 480 pesticides in various foods of plant origin [24] accredited to EN 15662:2018 [18]. These food matrices include mainly everyday fruits and vegetables, but also some less common foods, such as date seed coffee, dried ginger, elderberry, herb extracts, peppercorn and fennel. The adequate separation of 480 compounds in highly different food samples results in such particular chromatograms from which certain compounds’ appropriate identification could not be carried out on the basis of the SANTE/11312/2021 guideline [19]. The goal of our study was to summarize cases where screening analysis, without relevant confirmatory analysis, can lead to false positive identification. The following examples are from routine applications and such investigations have not been published so far.

2. Materials and Methods

2.1. Reagents, Instruments and Samples

Analytical standards were obtained from LGC Standards (Teddington, Middlesex, UK). Stock solutions (1 mg/mL) were prepared and stored according to pesticide databases [25]. A working standard mixture solution containing 480 pesticides for calibration and spiking purpose was prepared at 10 µg/mL in acetonitrile and was stored at −20 °C for half a year. For screening purposes, a 100 ng/mL working standard mixture was freshly diluted in acetonitrile.
Methanol, acetonitrile, ammonium formate (either LC-MS or HPLC grade), and the Ascentis Express C18 HPLC column (100 mm × 3 mm, 2.7 µm) were purchased from the Merck-Sigma group (Schnelldorf, Germany). EN 15662:2018 QuEChERS (Quick Easy Cheap Effective Rugged Safe) extraction salt was obtained from Agilent Technologies (Waldbronn, Germany; containing 4.0 g MgSO4, 1.0 g NaCl, 1.0 g Na-citrate × 2H2O, and 0.5 g Na-hydrogencitrate sesquihydrate). HPLC gradient grade water was obtained from VWR International Ltd. (Debrecen, Hungary). HPLC pre-column holders and C18 pre-column cartridges (4 mm × 3 mm; 5 µm), dispersive solid-phase extraction (dSPE) cartridges and graphitized carbon black (GCB) were obtained from Phenomenex (Torrance, CA, USA).
LC-MS/MS analyses were carried out on a Shimadzu Nexera LC-30AD liquid chromatographic system (Shimadzu Corporation, Kyoto, Japan), coupled to a QTRAP 6500+ triple quad MS detector equipped with an IonDrive Turbo V Source (Sciex; Warrington, Cheshire, UK). Data acquisition and evaluation were performed with the Analyst software version 1.7.1 and MultiQuant software version 3.0.3, respectively (Sciex).
Proficiency test samples were purchased from FAPAS (Food Analysis Performance Assessment Scheme, Fera Science Ltd., Sand Hutton, York, UK) and from Test Veritas S.r.l. (Test Veritas s.r.l., Via Svizzera, Padova, Italia). They included blueberry purée (FAPAS, sample: FCPM2-FRU31, proficiency test: 19258), virgin olive oil (FAPAS, sample: FCPM2-OIL34, proficiency test: 5147), apple purée (FAPAS, sample: FCPM2-FRU2, proficiency test: 19307), green bean purée (FAPAS, sample: FCPM2-VEG106, proficiency test: 19310), milk powder (FAPAS, sample: FCPX10-DRY14, proficiency test: 05161) and lettuce (Test Veritas s.r.l., sample: VF1700, proficiency test: VF1700P).
Customer-derived samples were received for pesticide screening analysis with the EN 15662:2018 standard method and they comprised of date seed coffee (Coffea Phoenix dactylifera), white peppercorn (Piper nigrum), herb extract (1.0 mL of the ethanolic herb extract (1:5) contained 80.0 mg Epilobium parviflorum Schreb, herba and 53.4 mg Urtica dioica L. and Urtica urens L.; folium, 40.0 mg Urtica dioica L. and Urtica urens L.; radix, and 40.0 mg Solidago canadensis L. et Solidago gigantea Ait., herba, and 13.4 mg Foeniculum vulgare miller subsp. vulgare var. dulce (Miller) Thellung, fructus), elderberry (Sambucus), dried ginger (Zingiber officinale) and fennel (Foeniculum vulgare).
The validated sample matrices included cereals, olive oil, carrot, peas, lettuce, tomato and bell pepper that were either purchased in local stores or were formerly received for analysis.

2.2. Sample Preparation

Samples were prepared according to EN 15662:2018 [18]. Briefly, 2.0–10.0 g sample and 0–10.0 mL water (both depending on the water content of the sample) were placed into polypropylene (PP) centrifuge tubes and 10 mL acetonitrile was added to the sample. The tubes were capped and manually shaken for 3 min. Then, QuEChERS extraction salts were added to the samples; the tubes were capped and manually shaken for 3 min. This was followed by centrifuging the samples for 5 min at 3000× g (Jouan B4i centrifuge, Thermo Fisher Scientific, Waltham, MA, USA). The upper layer was subjected to clean-up procedures (e.g., dSPE) according to EN 15662:2018. Sample extracts with high fat, wax and sugar content were stored overnight in a freezer (−18 °C; “freezing-out step”). For samples with high fat content, a mixture of PSA (primer- and secondary amine) and C18 were used. For samples with high carotenoid or chlorophyll content, mixture of PSA and GCB were used for purification. For other matrix types, dSPE containing PSA only was applied.

2.3. LC-MS/MS Separation for Screening

The LC-MS/MS separation was carried out on an Ascentis Express C18 HPLC column equipped with C18 guard column (4 mm × 3 mm, 5 µm). Binary gradient elution mode was utilized. Solvent A contained 5 mM ammonium formate in water and solvent B consisted of 5 mM ammonium formate in methanol. The mobile phase gradient program was the following: 10% B at 0 min; 10% B at 1.0 min; 62% B at 5.5 min; 100% B at 14 min; 100% B at 17 min; 10% B at 17.1 min; 10% B at 22.0 min (stop time); flow rate was set to 0.5 mL/min. The column thermostat and autosampler were maintained at 30 °C and at 15 °C, respectively. The volume of injection was 1 µL. Compounds were detected using scheduled multiple reaction monitoring (sMRM) scan mode. Positive ionization was employed only. Ion transitions for 480 compounds were listed in the study of Tóth et al. [24]. The MRM time window was 120 s and the cycle time was 0.4 s. ESI ion source parameters were as follows: curtain gas, 40 unit; gas1, 50 unit; gas2, 65 unit; drying gas temperature, 300 °C; ion spray voltage, 4500 V; interface heater; ‘on’. The HPLC effluent entered the ion source only in the retention time window between 1.5–15 min.
A standard mixture (100 ng/mL) was injected to check the system suitability and to make decision on samples whether they contain any target compounds above the screening detection limits (SDL, 0.005–0.050 mg/kg). SDL is the lowest concentration of a pesticide in the sample that can be detected with the screening method.

2.4. LC-MS/MS Separation for Confirmation

The same LC-MS/MS system, analytical column, eluents and flow rate were used as detailed above, but the gradient elution was shortened and the MS/MS instrument was used in multiple reaction monitoring (MRM) mode. The MRM table contained only those ion transitions for which the standard addition was applied. The mobile phase gradient consisted of 10% B at 0 min; 10% B at 1.0 min; 100% B at 7 min; 100% B at 9 min; 10% B at 9.1 min; 10% B at 12.0 min (stop time). Accordingly, retention time differences between screening and confirmatory analyses were present.
Samples assigned for the further quantification analyses were quantified using an at least three-point standard addition process at spiking levels that are proportional to the residue levels estimated with the help of the screening method. Generally, the spiking levels used for standard addition were 0.5×; 1×; 1.5×; 2× and 5× of the concentration detected under screening analysis.

2.5. Standard Method Verification

2.5.1. Screening

In the case of screening verification, previously analyzed blank samples (cereals, olive oil, carrot, peas, lettuce, tomato and bell pepper samples) were spiked at 0.005, 0.010, 0.020 and 0.050 mg/kg levels with five replicates before sample preparation. The method contains 480 compounds now, however only 415 pesticides were involved in the method when the screening analysis was done in the past. The evaluation was based on the distinction of blanks and fortified samples at certain levels according to SANTE/11312/2021 [19], so appropriate quantification, recovery and precision calculation were not necessary. The SDL values were established for 415 compounds (Supplementary Table S1) at the levels where the compounds’ signals could be appropriately distinguished from the noise. All the 415 compounds were evaluated at their corresponding retention time windows. The distinction was based on the presence of the corresponding ion transitions with the signal-to-noise ratio (SNR) higher than 3.0. Also, the IR shall be within the ±30% tolerance limit.

2.5.2. Confirmation

The confirmatory verification was carried out for cereals, olive oil, carrot, peas, lettuce, tomato and bell pepper samples. In total, 23 compounds from different pesticide groups were evaluated (Supplementary Table S2). When the confirmatory analysis was performed, the method included only 213 compounds, so approximately 10% of the analytes were evaluated in line with the SANTE/11312/2021 guideline [19]. Five replicates were obtained at each level for all sample matrices and measurements were repeated on another day. In total, 10 samples were prepared at each spiking level over two days for all samples. Recovery and within-laboratory precision were calculated at 0.010 mg/kg and 0.100 mg/kg spiking levels for the selected compounds (Supplementary Table S2). Matrix-matched calibration levels were as follows: 0.005, 0.010, 0.025, 0.100, 0.250 and 0.500 mg/kg.

3. Results and Discussion

3.1. Method Evaluation

In this study, the focus has been given on validation data (Supplementary Tables S1 and S2) at least from one matrix along with proficiency test (PT) results evaluated in accordance with ISO 17,043 standard (Table 1, Table 2, Table 3, Table 4, Table 5 and Table 6) to emphasize the actually successful introduction of the standard method. The presented matrix is the olive oil sample as it was one of the most complex matrices validated and for which PT results could be shown. The screening validation was performed later than the confirmatory validation. The screening validation was carried out with 425 compounds from which 415 compounds could be detected at or below 0.050 mg/kg (Supplementary Table S1). The aim of screening validation was to establish the detection capability of the standard method using our instrument setup. The SDL levels in olive oil are detailed in Supplementary Table S1 and varied between 0.005 to 0.05 mg/kg.
In accordance with SANTE/11312/2021 [19], recovery and precision were calculated for 10% of the analyzed compounds (Supplementary Table S2) under confirmatory validation. Linearity was evaluated by the regression coefficient of the six-points matrix-matched calibration curve (R2 > 0.9950). All results met the following performance criteria during validation: precision, <20 RSD%; recovery, 70–110%. The participation in several PTs is also part of the method evaluation. The PT results are detailed in Table 1, Table 2, Table 3, Table 4 and Table 5. The PT is satisfactory if the z-score calculated for a compound is between −2 and 2. So far, only two compounds were out of this range, namely kresoxim-methyl and boscalid. These were evaluated as questionable.

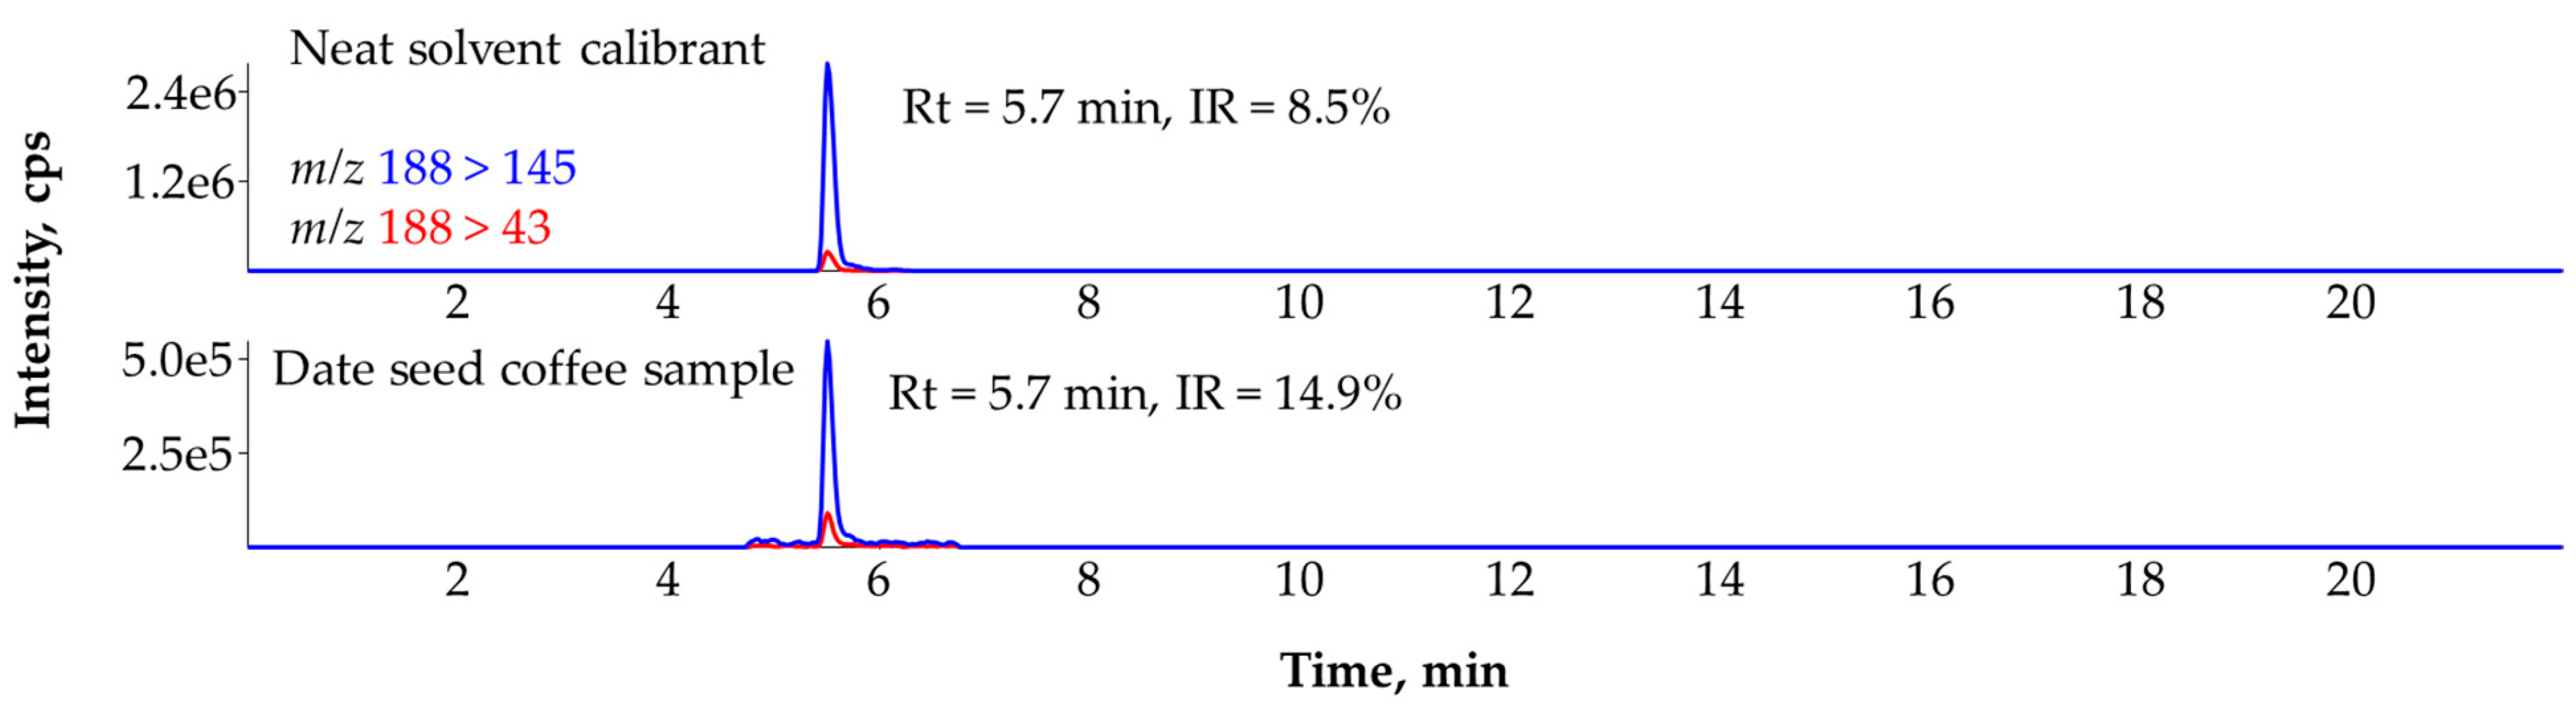
3.2. Ruling Out the False Identification of Atrazine-Desethyl in a Date Seed Coffee (Coffea Phoenix dactylifera) Sample with the Help of IR

A date seed coffee sample was screened for 480 pesticides including atrazine-desethyl, the metabolite of atrazine. Unlike atrazine, atrazine-desethyl has no MRL or default MRL (0.01 mg/kg) in food, but our laboratory routinely analyses this compound in water [24], so the screening method contains the ion transition of atrazine-desethyl as well. In the chromatogram of atrazine-desethyl in the date seed coffee sample we observed signals at the same retention time on both scanned ion transitions of atrazine-desethyl under screening analysis (Figure 1). The IR calculated in neat standard solution was 8.5%, so the ±30% tolerance limit set in SANTE guideline gave an acceptable range between 6.0% and 11.1% for IR [19]. The IR for atrazine-desethyl in the coffee sample was 14.9%, so the identification did not meet the criteria and the sample was compliant. In this case the SANTE criteria appropriately excluded the presence of atrazine-desethyl in the sample [19]. Also, atrazine could not be detected in the sample.

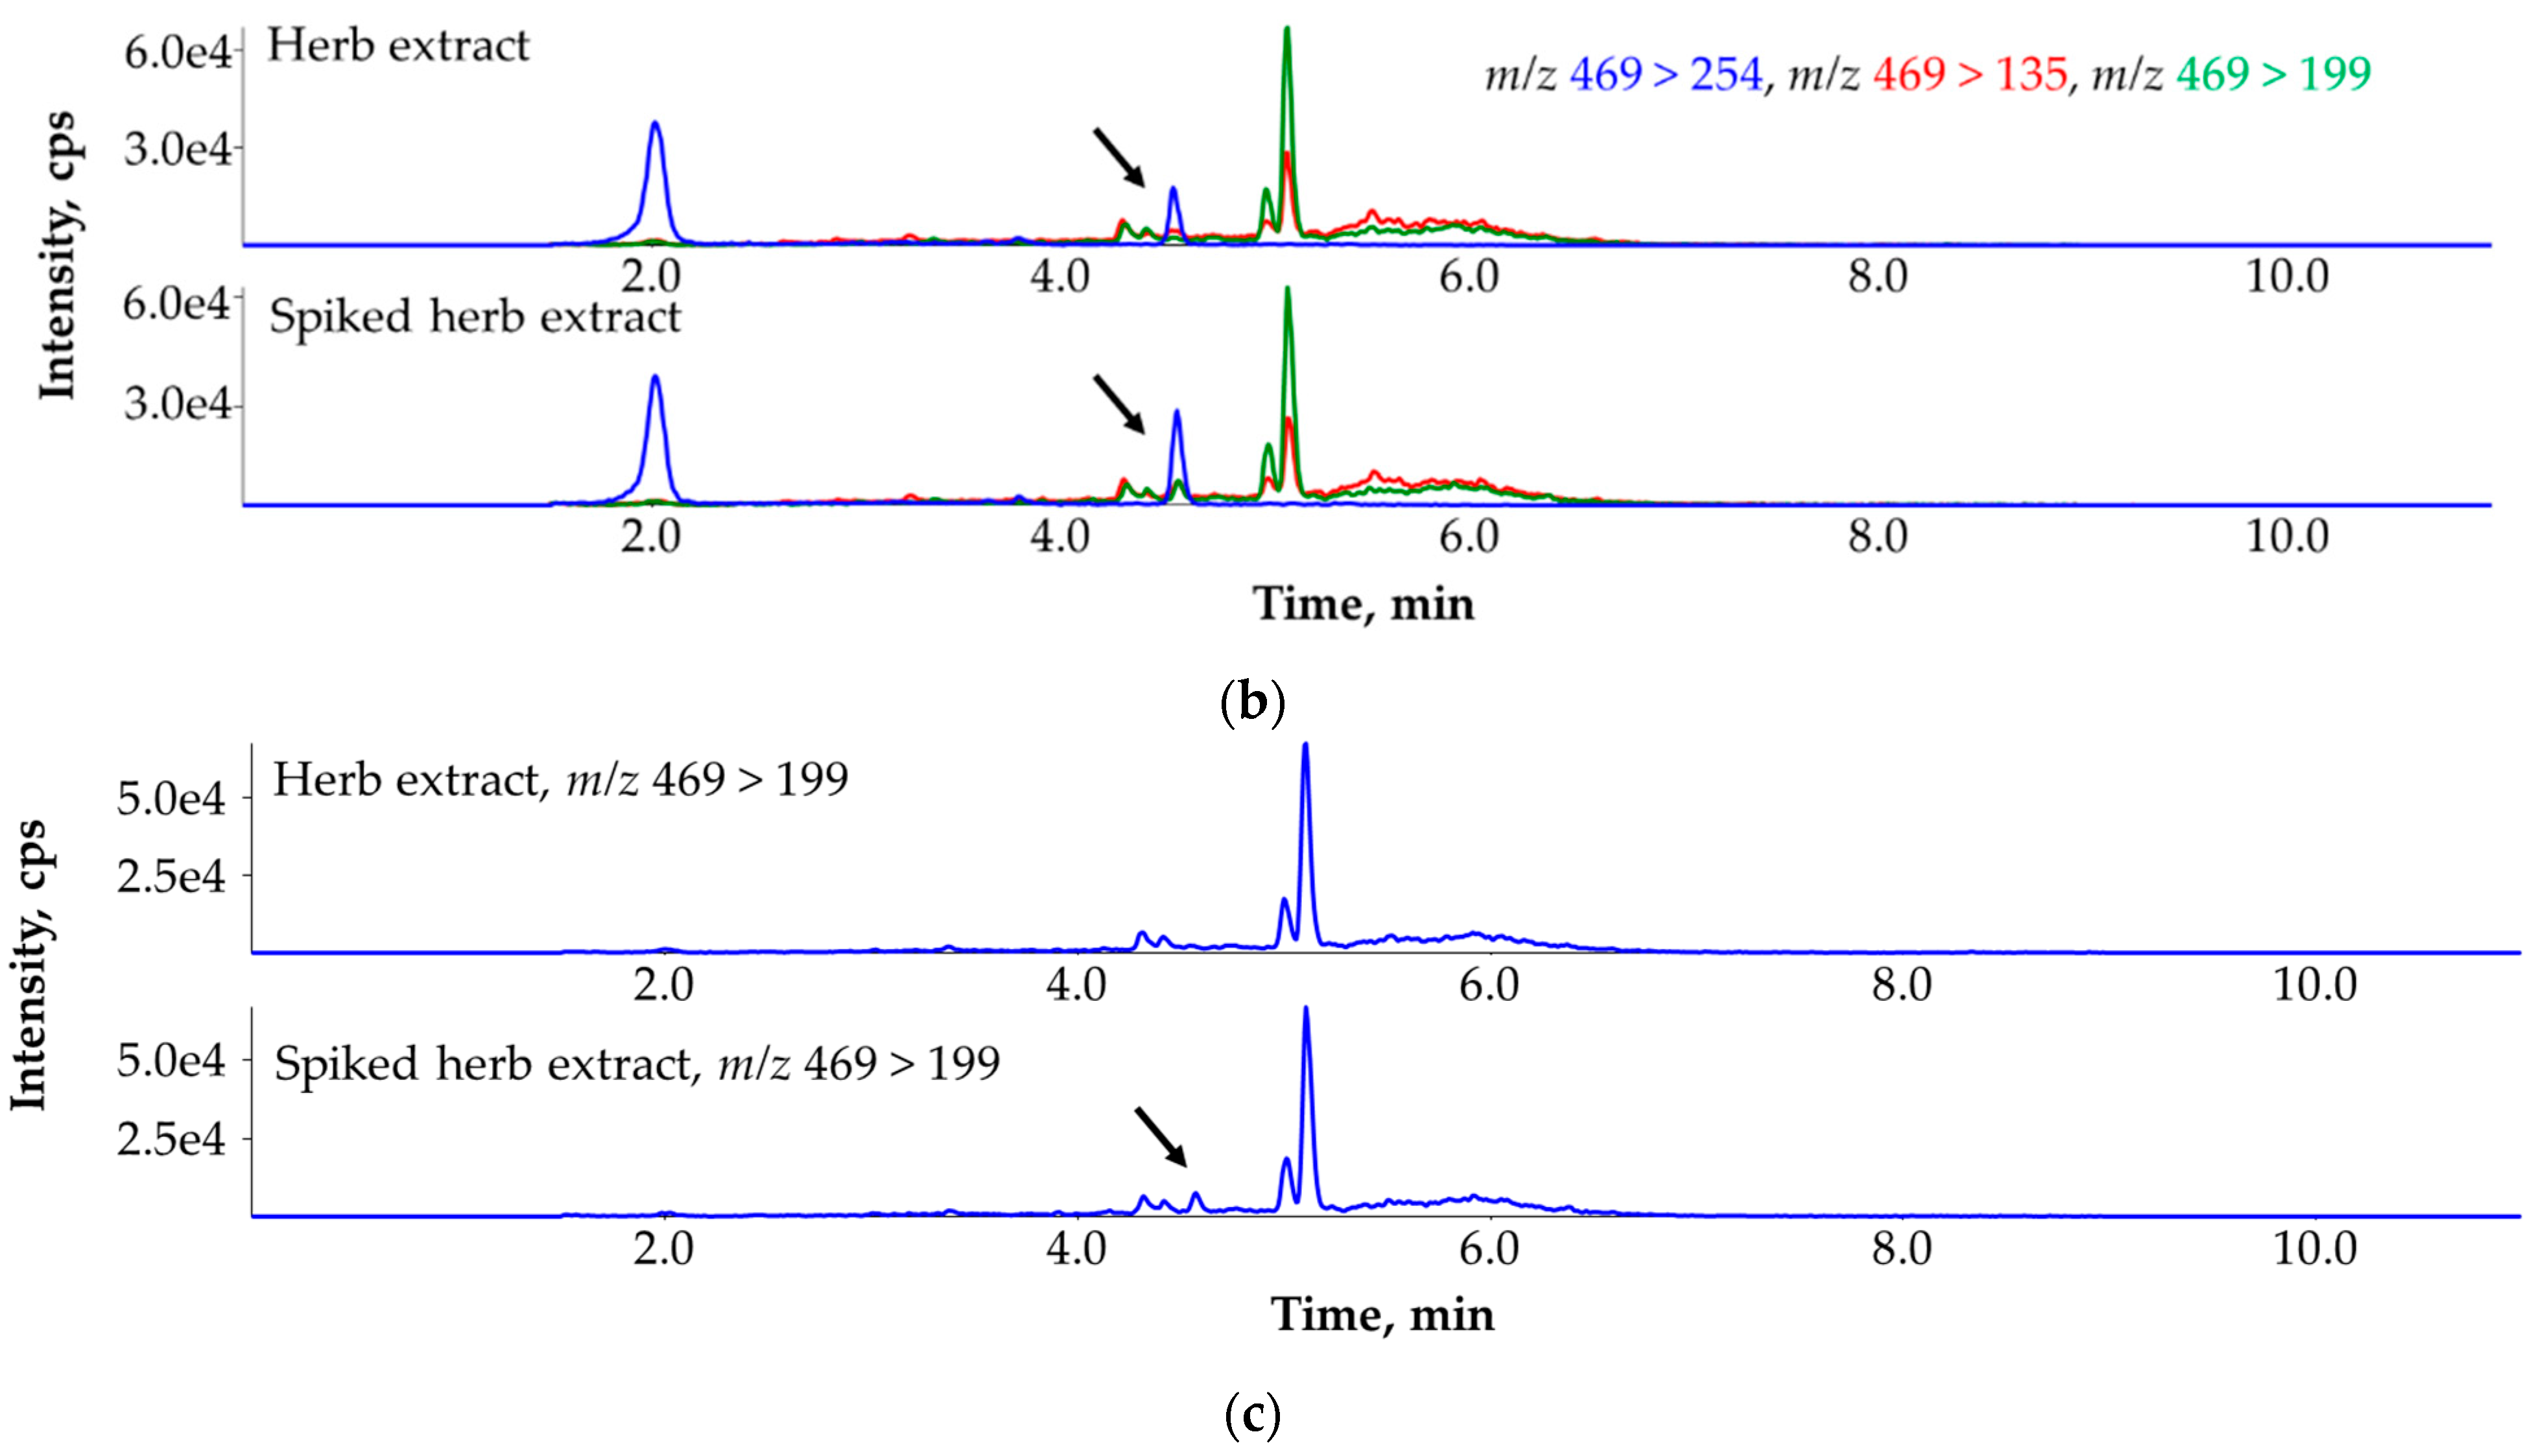
3.3. Ruling Out the False Identification of Primisulfuron-Methyl in a Herb Extract Sample with the Help of the Third MRM Transition

During the screening analysis of an ethanolic herb extract, the positive identification of primisulfuron-methyl was evaluated based on the retention time (±0.1 min) and IR (±30%) criteria. The IR (m/z 469 > 254 and m/z 469 > 135) of primisulfuron-methyl in standard solution was 15.7%, while the IR of the appearing peak at the same retention time in the sample was 14.7% (Figure 2a). The secondary ion trace (m/z 469 > 135) showed high background noise, so the decision on whether this qualifier ion transition should be considered was made with the confirmatory method (Figure 2b,c). Furthermore, a third ion transition (m/z 469 > 199) was also set for the target compound.
Under the confirmatory analysis, the noise level of secondary ion trace decreased. The IR of m/z 469 > 254 and m/z 469 > 135 ion transitions in the spiked samples were between 19.8% and 20.1%, so the compound could still be identified as primisulfuron-methyl. However, no peak appeared in the non-fortified samples on the third ion transition (m/z 469 > 199); only the sample spiked at 0.010 mg/kg (Figure 2b,c) showed this trace. In this case, involving a third MRM transition was required to make a correct evaluation, similarly to what Schürmann et al. presented in their study [22].

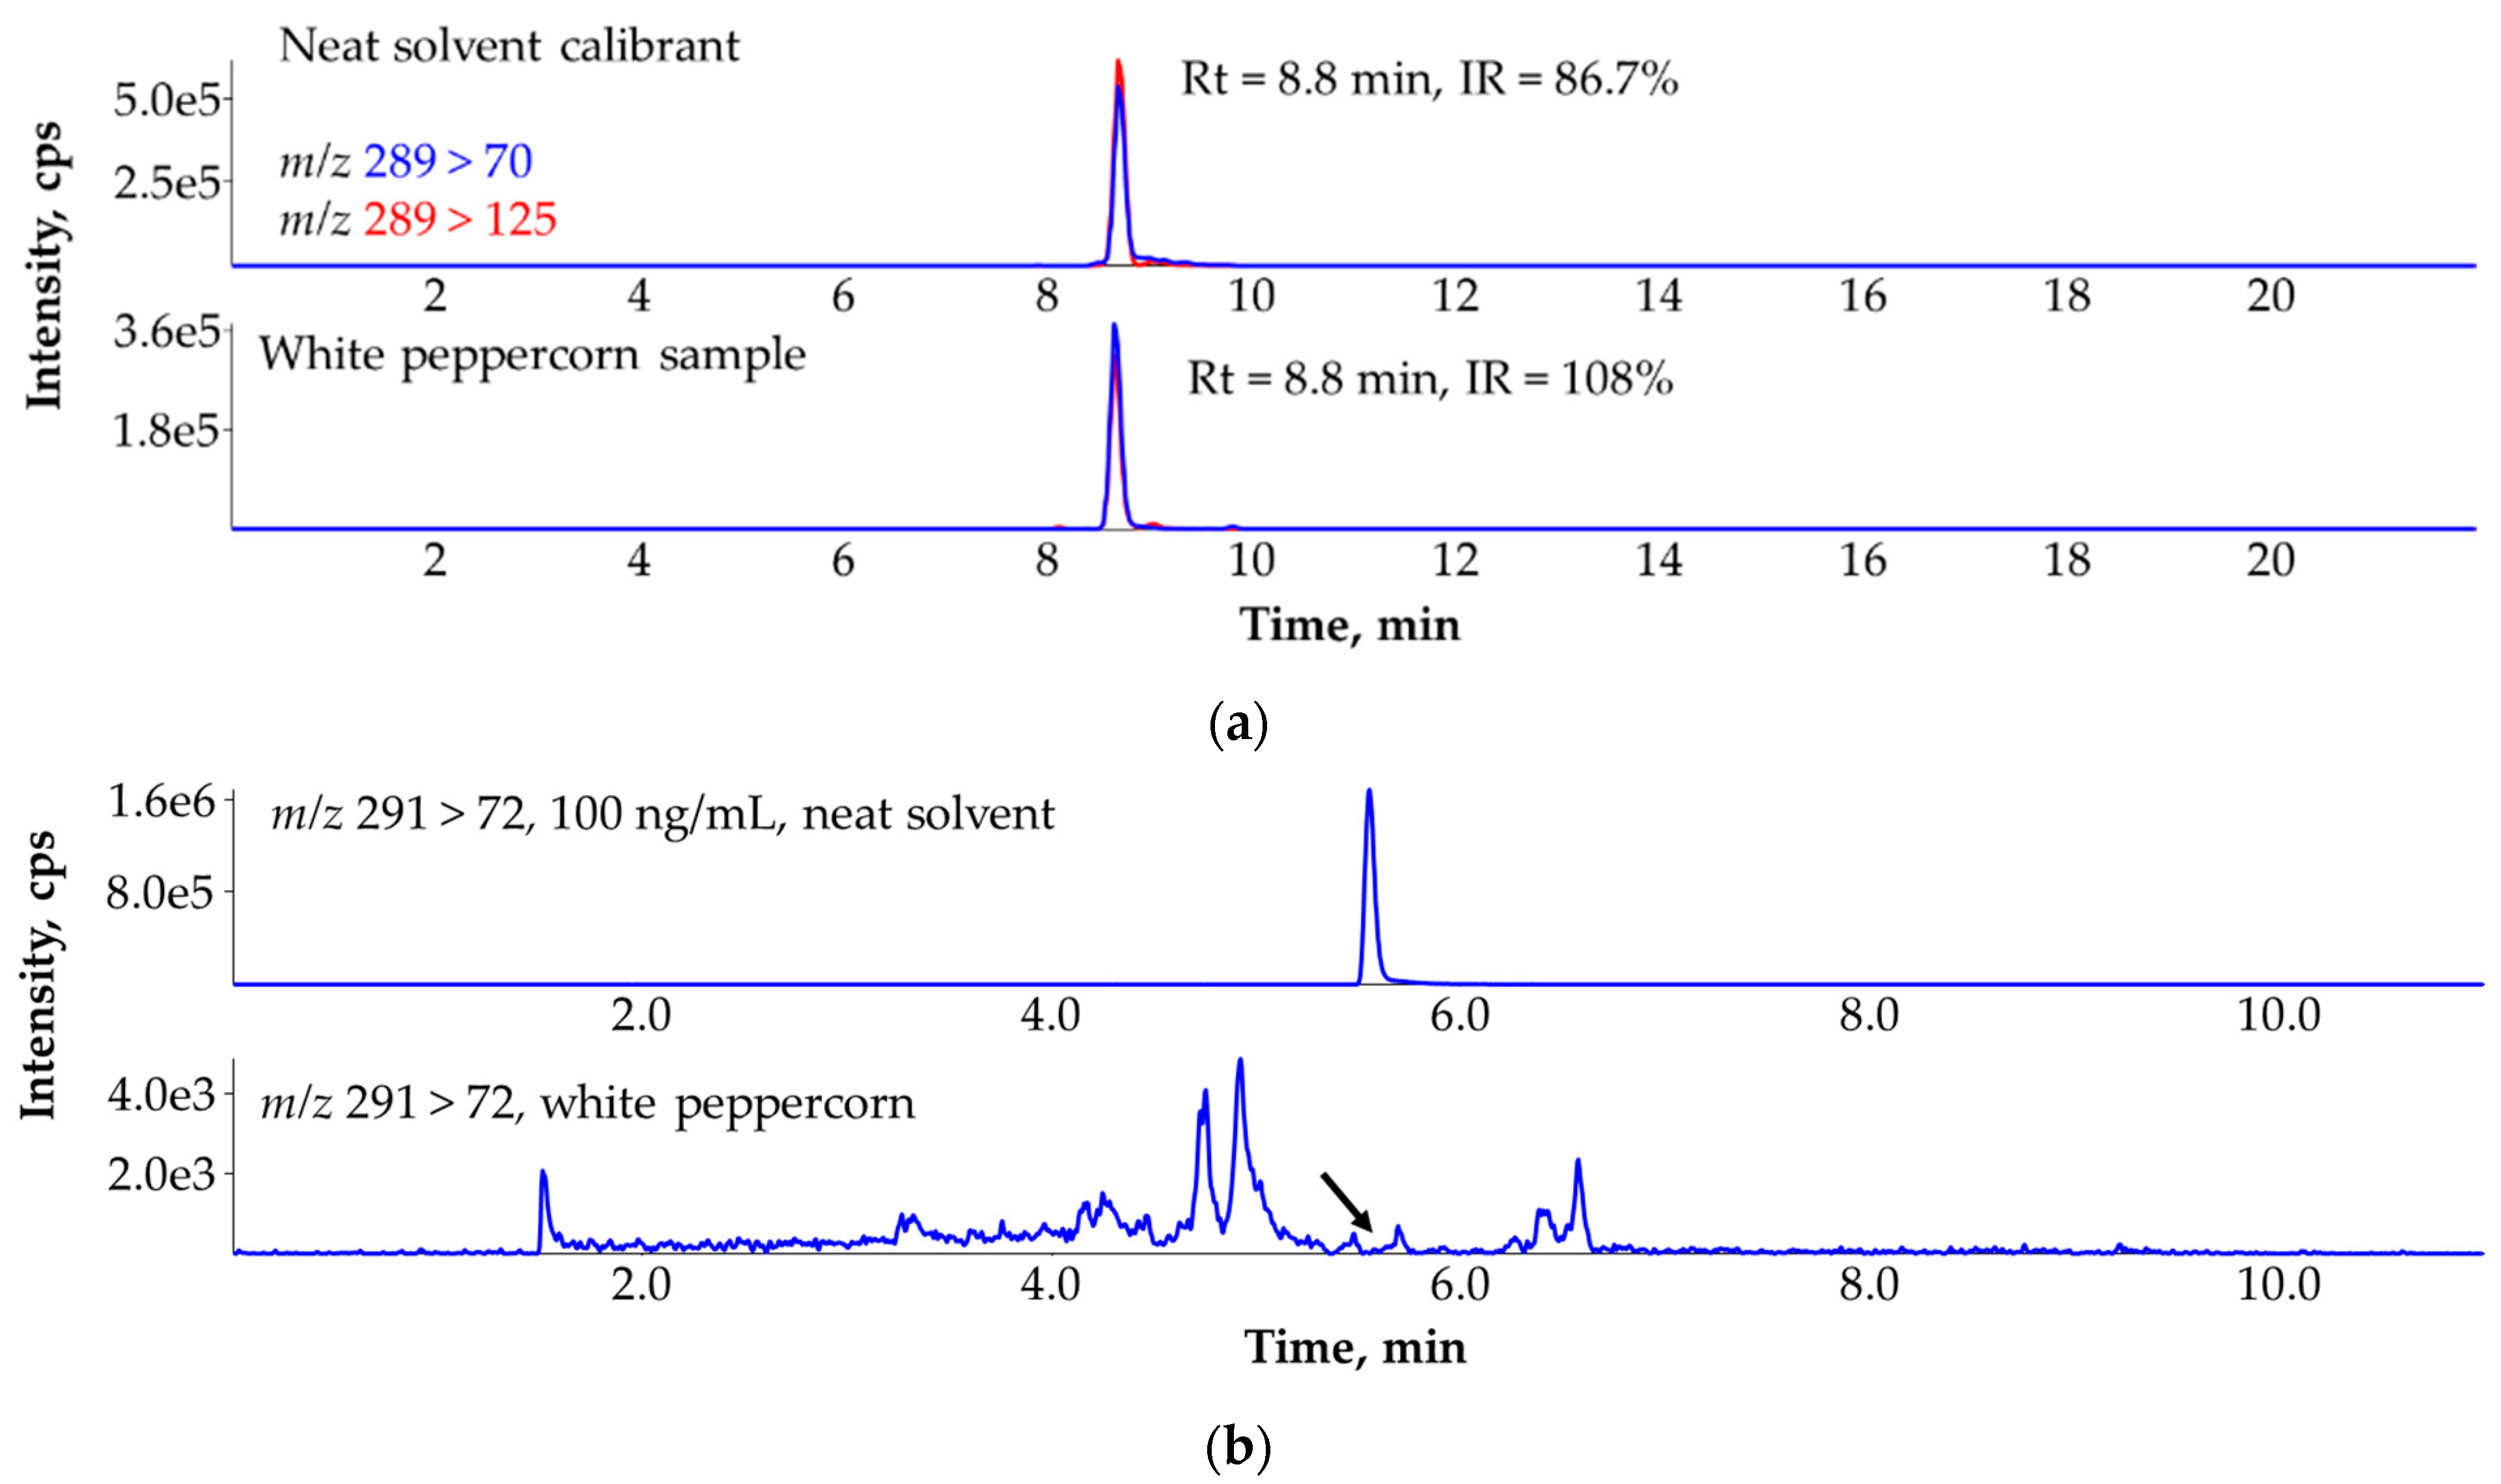
3.4. Ruling Out the False Identification of Myclobutanil in White Peppercorn (Piper nigrum) Sample with the Help of the A + 2 Isotopologue Based MRM Transition

The screening analysis of a white peppercorn sample showed positive identification for myclobutanil. Both ion transitions (m/z 289 > 70 and m/z 289 >125) in the same retention time of myclobutanil gave signals with an IR of 108% (Figure 3a). The relevant IR obtained in the standard solution was 86.7% (intensity ratio of m/z 289 > 125 to m/z 289 > 70), hence the IR was within the 30% tolerance range. The other six ion transitions were further monitored for myclobutanil in the MS/MS instrument during the confirmatory analysis. Myclobutanil is a chlorinated compound, so the A + 1 ion transitions (m/z 290 > 70, m/z 290 > 71, m/z 290 > 125, m/z 290 > 126) and A + 2 ion transitions (m/z 291 > 72, m/z 291 > 127) could also be scanned and in total of eight ion traces were used for its detection. In the chromatogram obtained from confirmatory analysis, six out of eight ion transitions appeared, but the A + 2 related transitions were missing (Figure 3b). Therefore, the presence of myclobutanil could be excluded. Indeed, the interfering matrix compound was either not chlorinated or the m/z 290 ion was its A + 2 ion. In this case, the isotopologue pattern of the chlorinated target compound could be addressed for the identification, as recommended by Mol et al. [21,23].

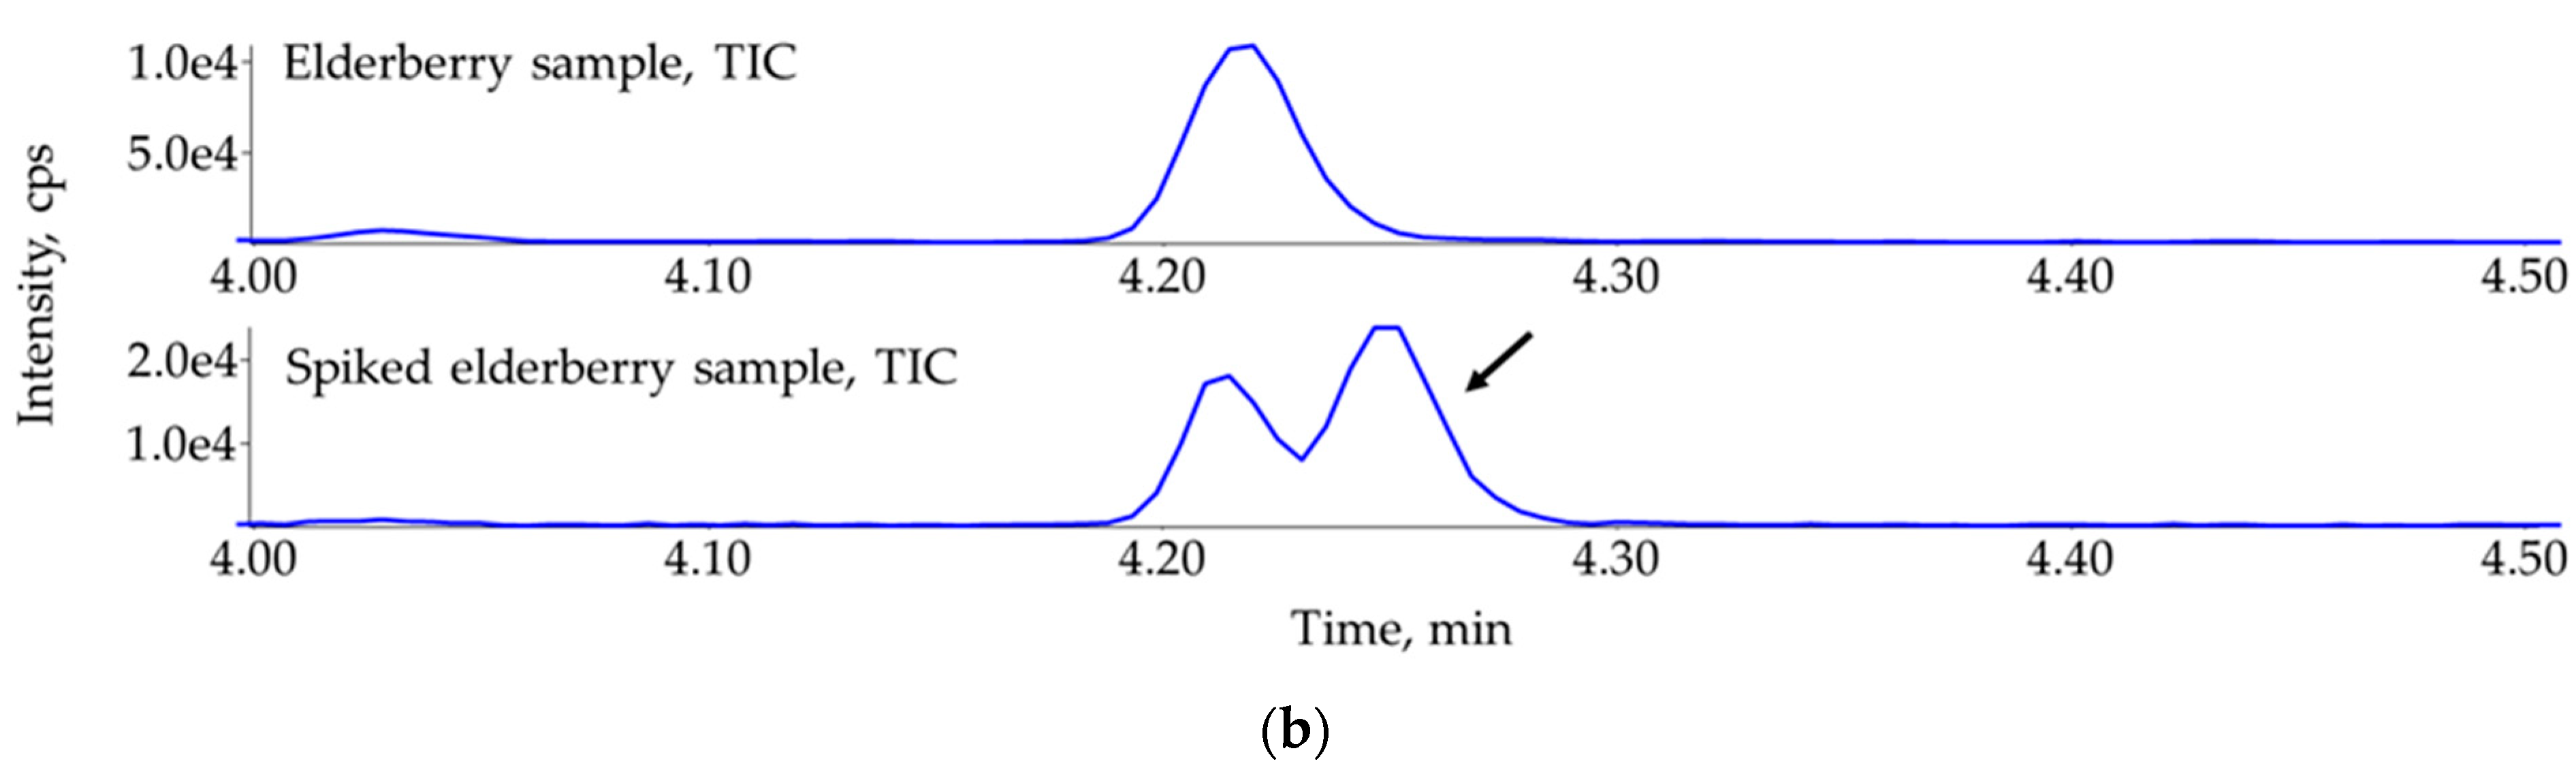
3.5. Ruling Out the False Identification of Propham in Elderberry (Sambucus nigra) Sample with the Help of Standard Addition

Elderberry derived sample extracts are highly concentrated in interfering matrix compounds, even after PSA and dSPE clean-up, as presented in [18]. On the ion transitions of propham (m/z 180 > 138 and m/z 180 > 120) distinct peaks appeared with a tolerable retention time shift (Δ 0.01 min) and Δ IR during the screening analysis (Figure 4a). The relevant IRs in the neat solvent and the elderberry extract were 73.2% and 79.6%, respectively.
During the confirmatory analysis, the standard addition clearly showed that this elderberry sample did not contain propham over the detection limit (Figure 4b). In the chromatogram of the fortified sample, the retention time difference between the interfering matrix peak and propham became more pronounced (Δ 0.04 min). Indeed, the appropriate identification could not have been performed without the standard addition process. The higher retention time difference between compounds under the confirmatory analysis was caused by the steep gradient elution and by the different MRM dwell time settings. In this case, the appropriate identification was supported by the standard addition quantification. As a matter of fact, the SANTE guideline allows for the quantification through neat solvent calibration [19]. However, if calibrants in neat solvent had been used, the retention time difference between the interfering matrix compound and propham would not have been observed. Therefore, the use of standard addition is necessary if the corresponding isotopically labelled analogue as ISTD is not included in the method.

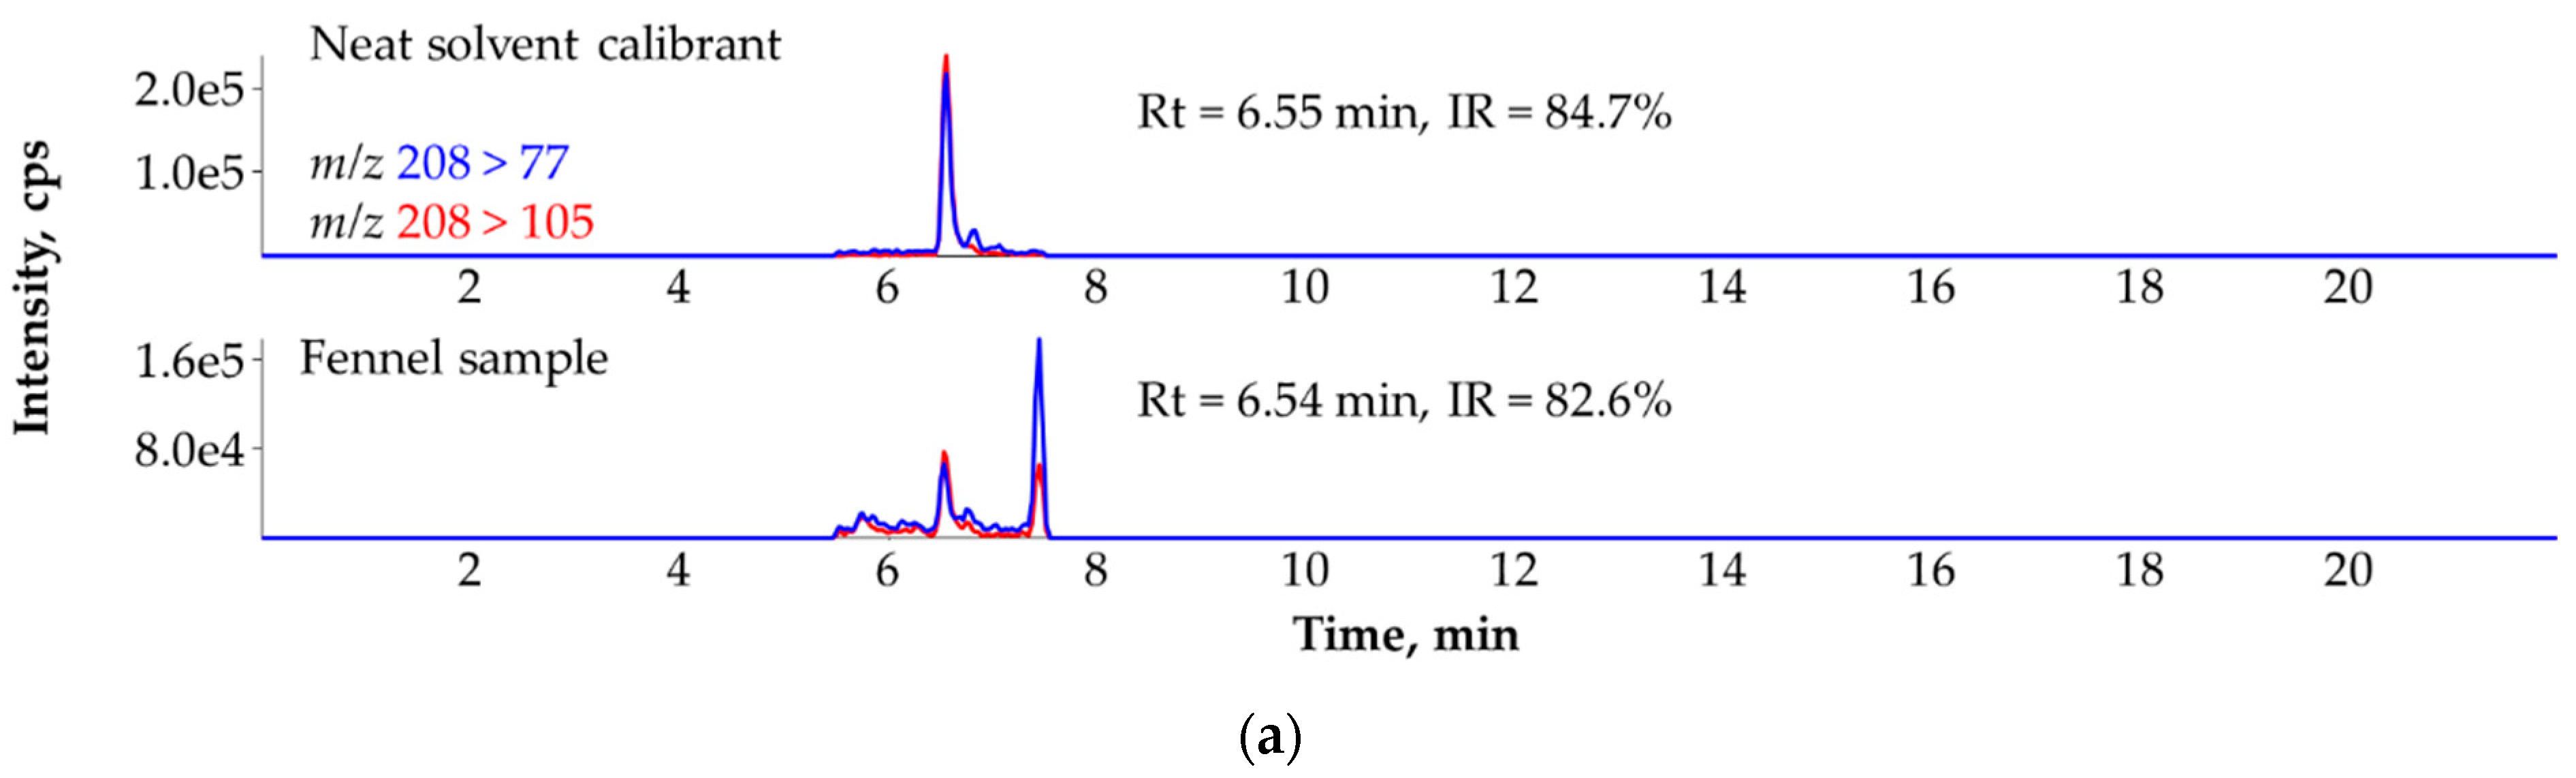
3.6. Ruling Out the False Identification of Quinoclamine in Fennel (Foeniculum vulgare) with the Help of Standard Addition and the Third MRM Transition

Positive identification of quinoclamine in a fennel sample was recorded during the screening analysis. The retention time of the supposed analyte, quinoclamine, in the neat solvent, and in the fennel sample, was 6.55 min and 6.54 min, respectively. Both ion transitions (m/z 208 > 77 and m/z 208 > 105) showed distinct peaks for quinoclamine and the IR values in the neat solvent (84.7%) and in the sample (82.6%) were close to each other (Figure 5a).
The close retention time between the interfering matrix peak and the target compound remained the same under the confirmatory analysis (at 4.71 min). Finally, the interference and the analyte could only be distinguished by monitoring a third ion transition (m/z 208 > 172) for quinoclamine to achieve adequate selectivity. Indeed, only the target compound gave signal on the third ion trace (Figure 5b), hence the application of more than two ion transitions per compound was highly required. Again, involving a third MRM transition, similarly to what Schürmann et al. presented in their study [22], was necessary to make decision on the target compound.

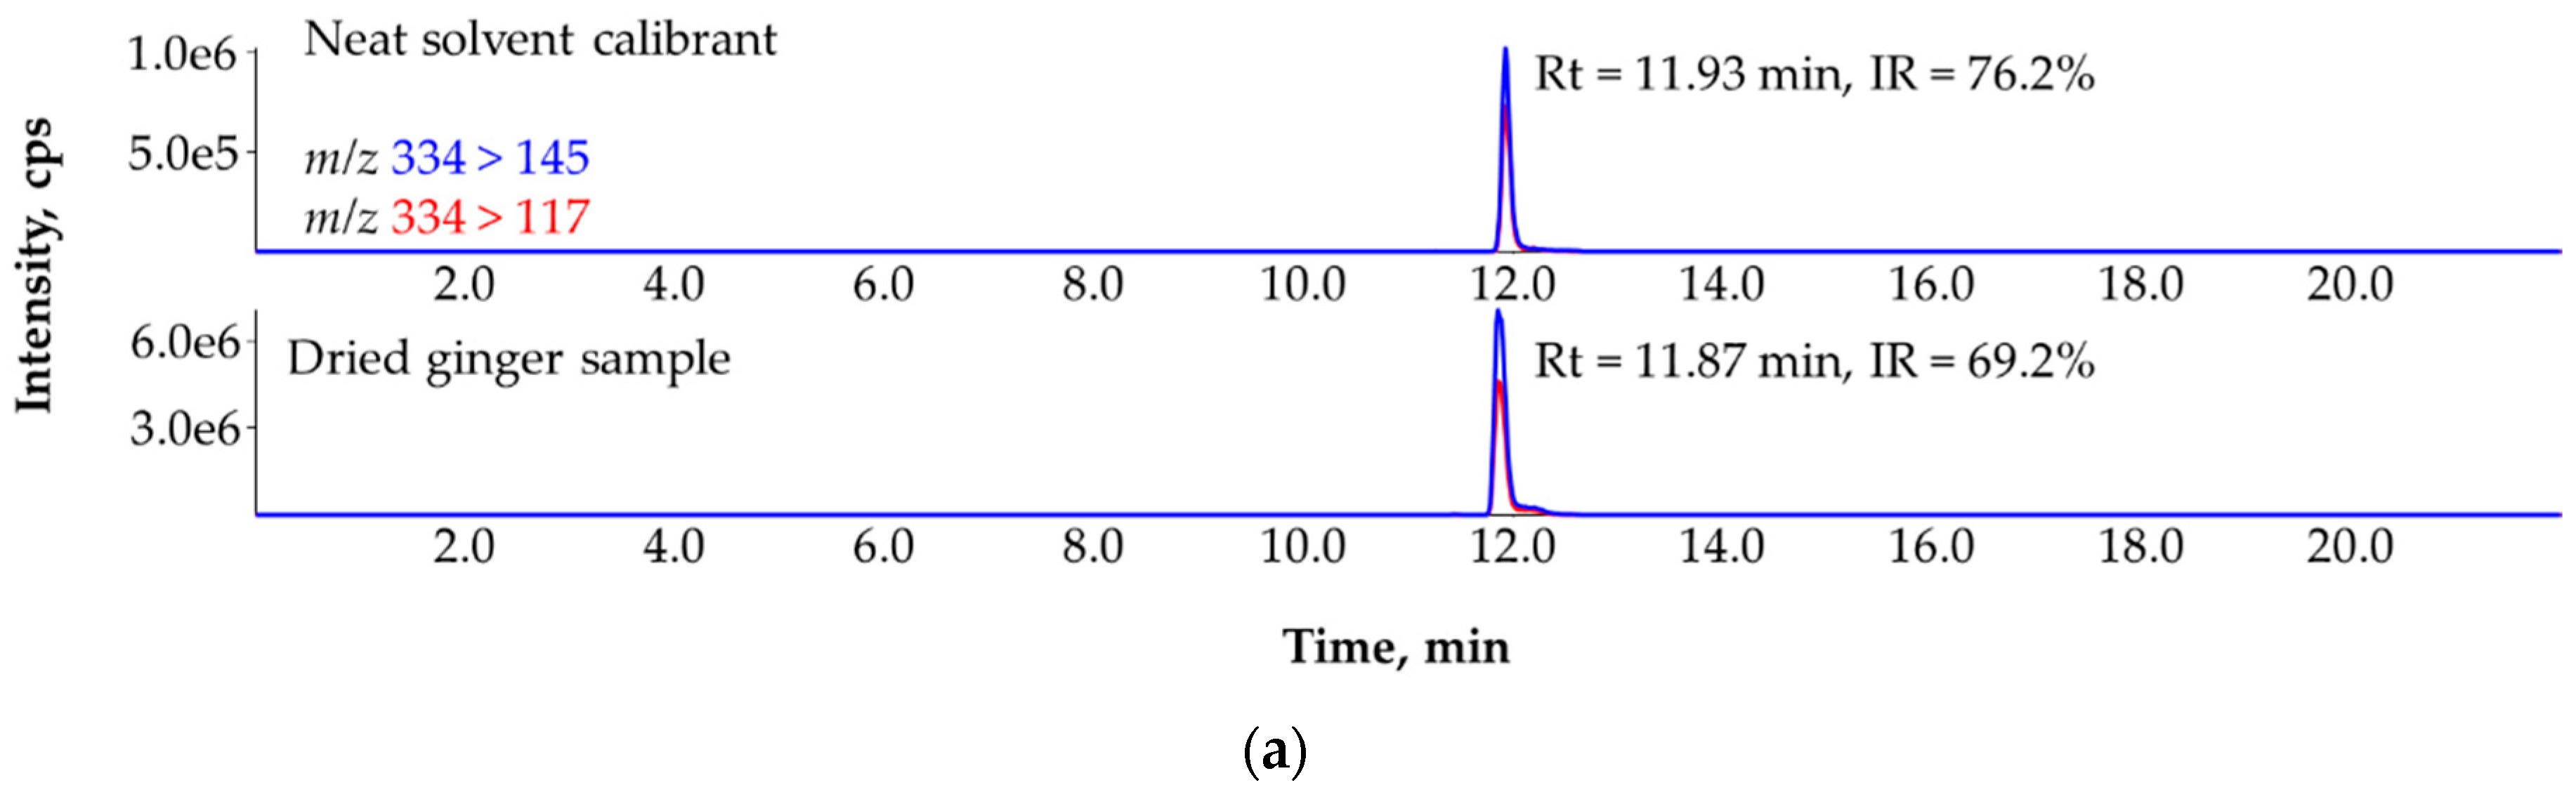
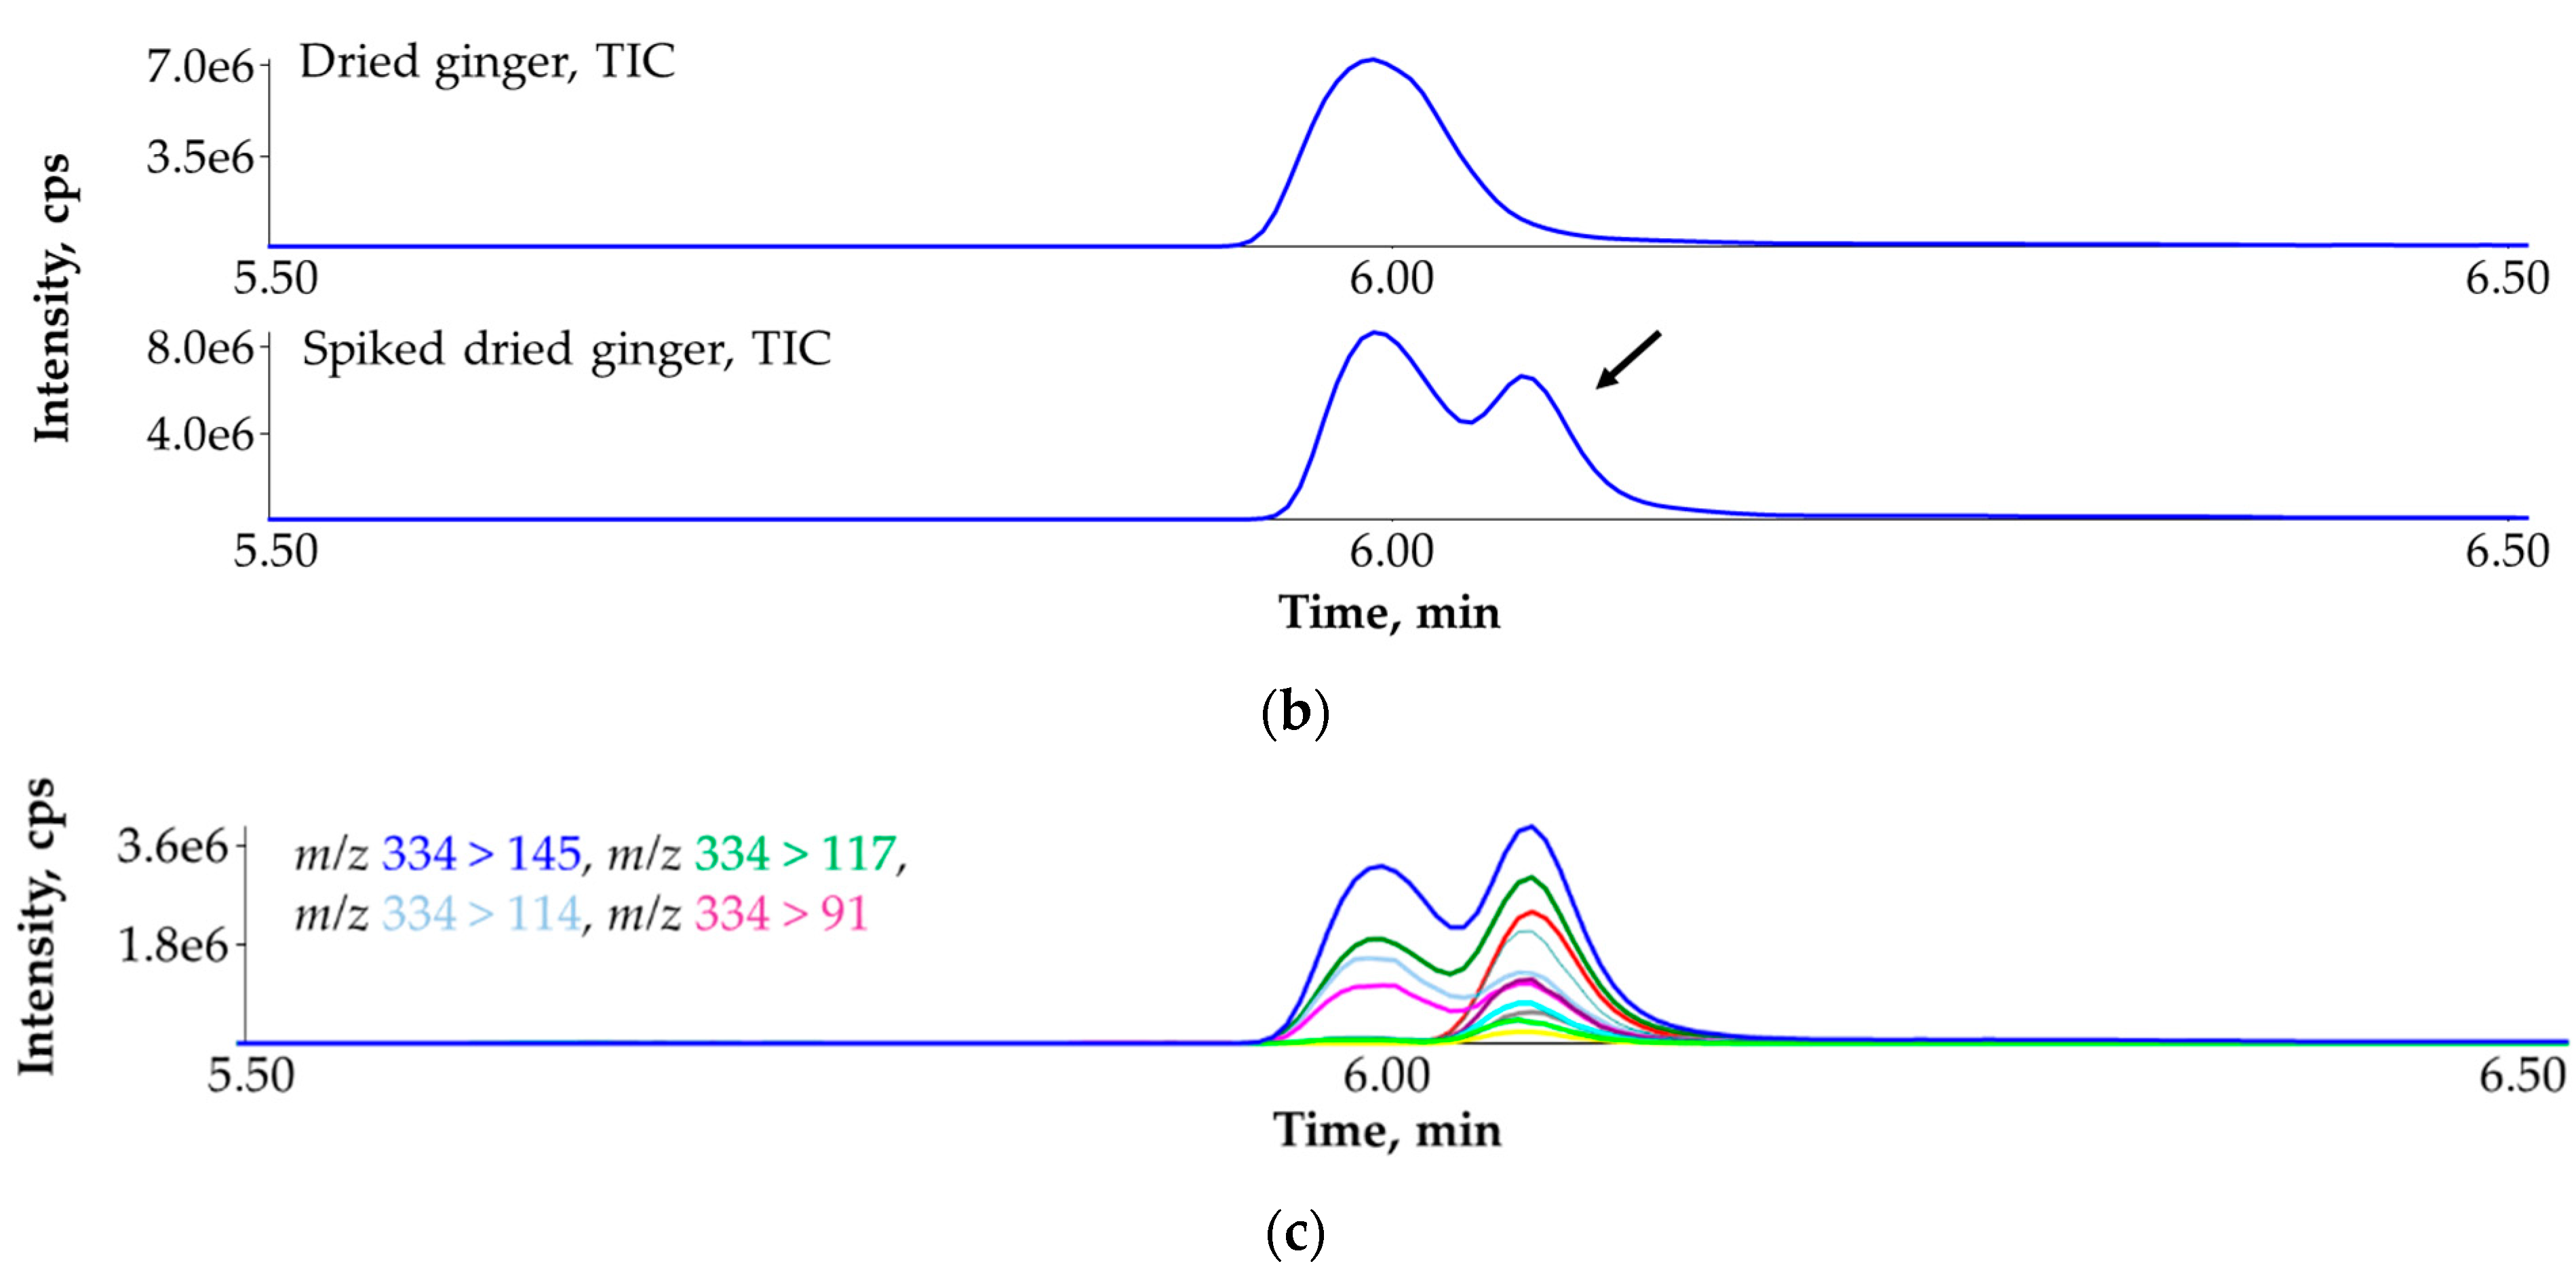
3.7. Ruling Out the False Identification of Tebufenpyrad in Dried Ginger (Zingiber officinale) with the Help of Standard Addition and More MRM Transitions

Tebufenpyrad elutes at 11.93 min during the screening analysis (m/z 334 > 145 and m/z 334 > 117, IR = 76.2%). During the screening of a dried ginger sample (Figure 6a) signals on both ion traces of tebufenpyrad appeared at 11.87 min (IR = 69.2%). Both the retention times and the IRs were within the tolerance range (Δ 0.1 min and ±30%). The standard addition to the sample during the confirmation analysis clearly showed that the sample did not contain tebufenpyrad over the limit of detection (Figure 6b). Retention time difference between the target compound and the matrix peak was observed. This was further confirmed by monitoring twelve ion transitions for tebufenpyrad from which only four ion traces (m/z 334 > 145, m/z 334 > 117, m/z 334 > 114, m/z 334 > 91) could be detected for the interfering peak (Figure 6c). Again, the standard addition calibration could indicate that the identified compound is not the targeted, which was further confirmed by setting several ion transitions. This means that the retention time tolerance of 0.1 min can be deceptive in some particular cases.

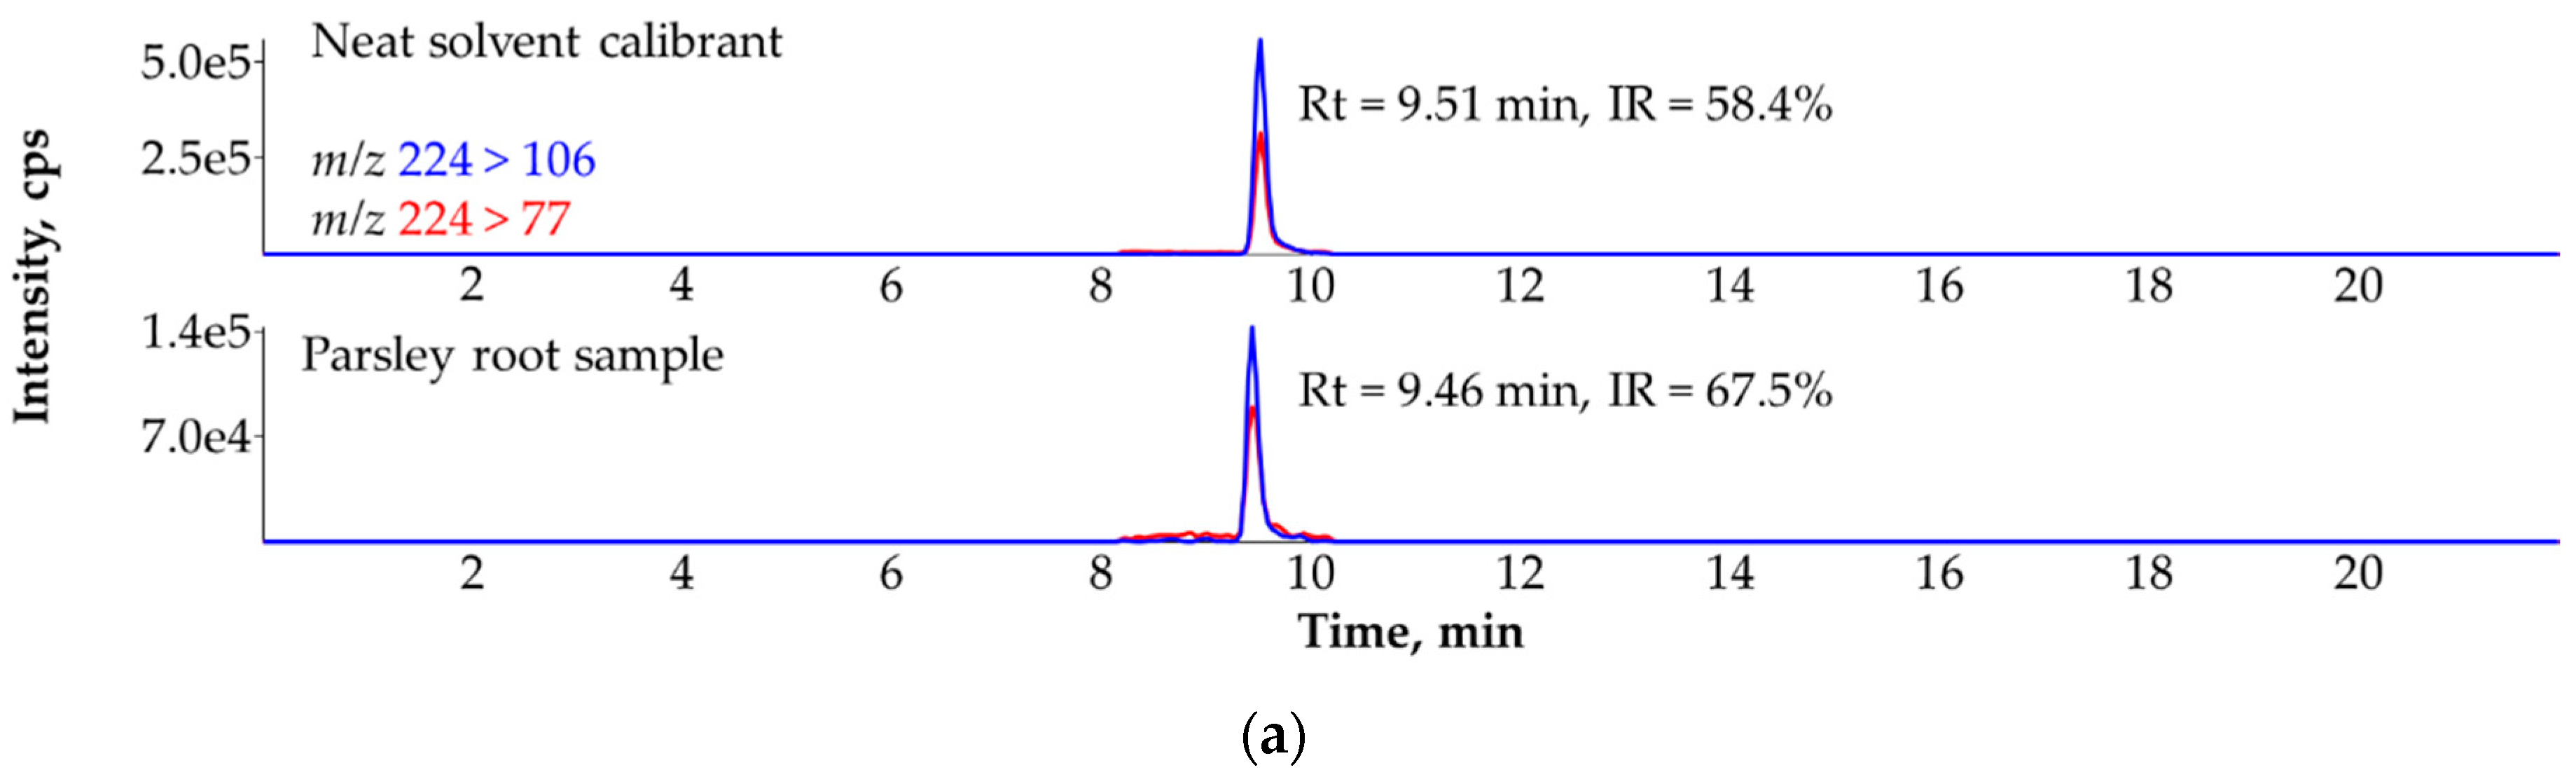
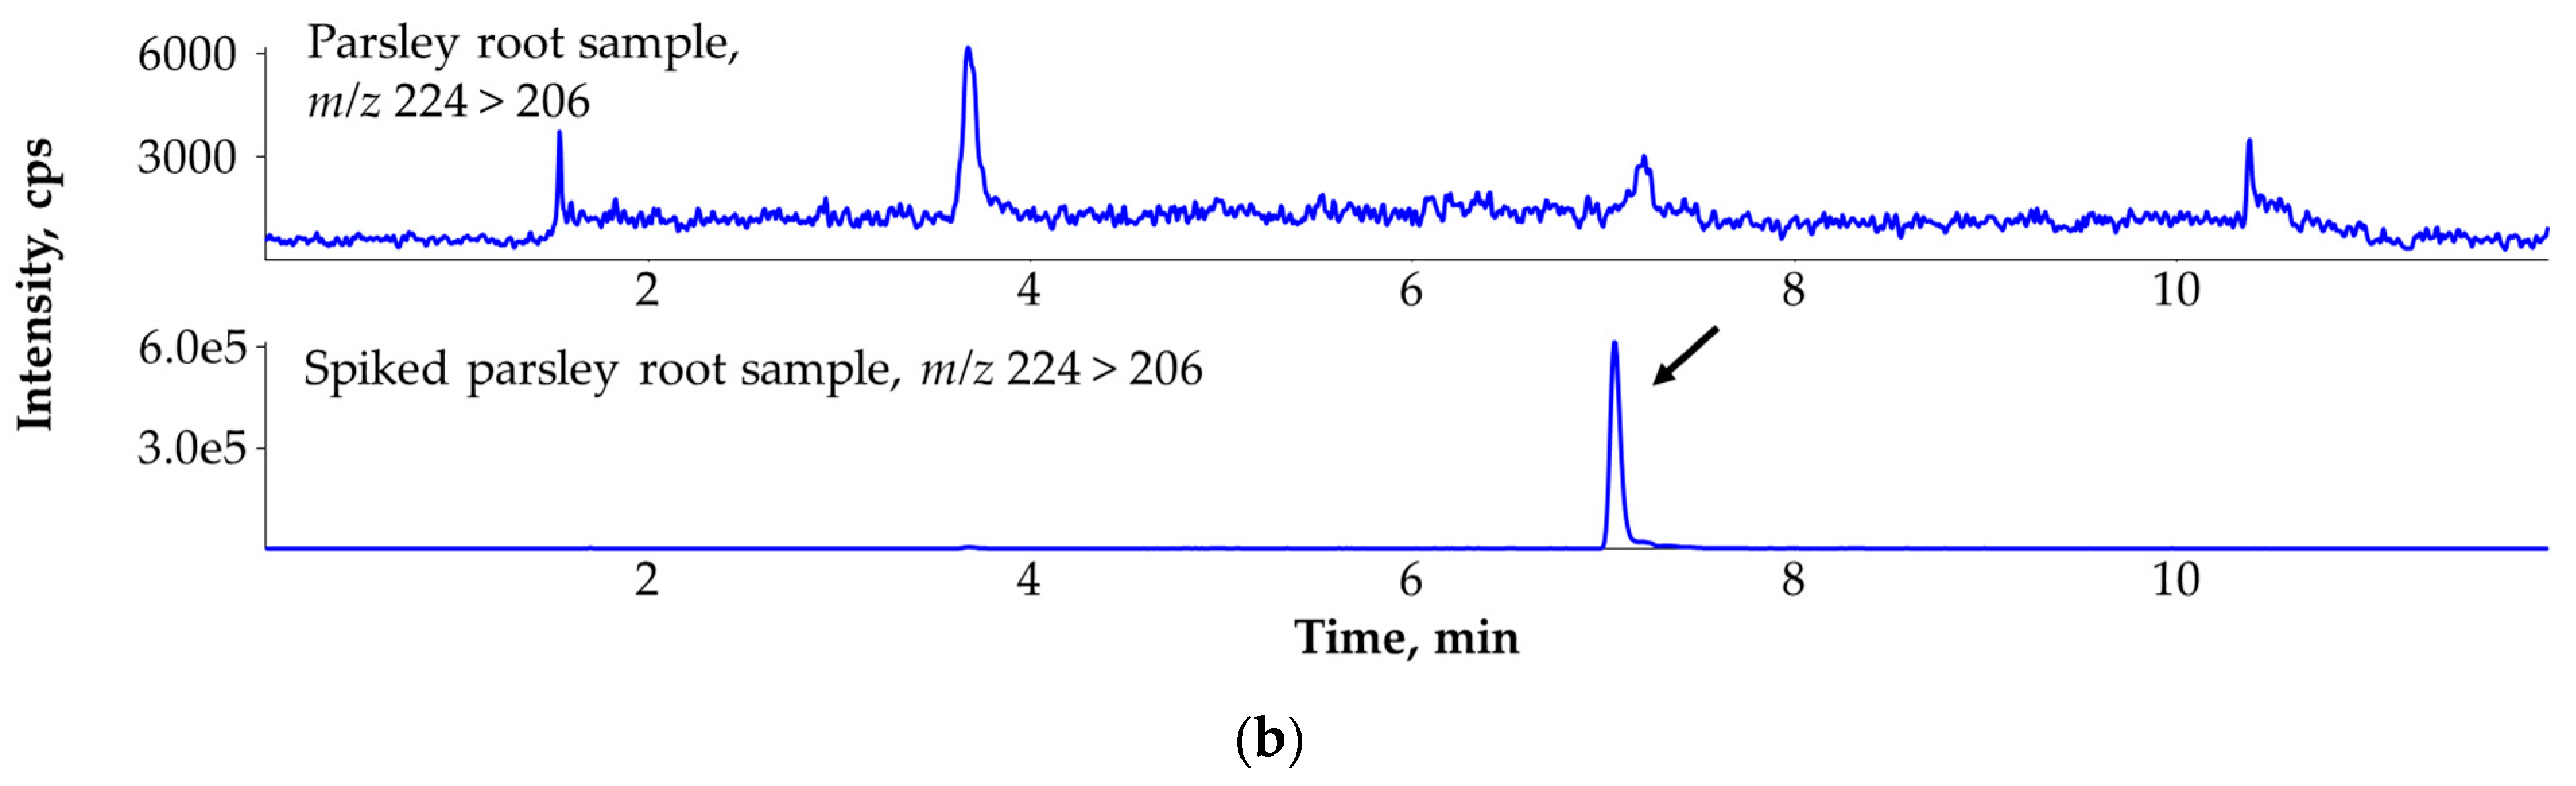
3.8. Ruling Out the False Identification of Mepanipyrim in Parsley Root (Petroselinum crispum) with the Help of the Third MRM Transition

The positive identification of mepanipyrim was observed in parsley root during screening analysis (Figure 7a). The retention time of the analyte in neat solvent and sample extract were 9.51 min and 9.46 min, respectively. Ion ratio of the two recorded ion transitions (m/z 224 > 106, m/z 224 > 77) were 58.4% in neat solvent and 67.5% in sample extract, respectively. Estimation by the screening analysis showed the concentration of the analyte to be above current maximum residue level (MRL = 0.01 mg/kg). The estimated value was 0.026 mg/kg. To exclude the possibility of false positive identification, two additional ion transitions (m/z 224 > 205 and m/z 224 > 206) were tuned and monitored during the confirmatory analysis, however, only one ion trace (m/z 224 > 206) was selective enough for mepanipyrim in parsley root matrix (Figure 7b).
In the lack of GC-MS/MS and LC-HRMS technique for further confirmation, the application of more than two ion transitions is crucial sometimes. However, the number of ion transitions scanned using multi-methods—such as scheduled MRM or Dynamic MRM—is limited by coeluting analytes. In order to obtain enough data points for a chromatographic peak, the cycle time should not exceed a certain value, thus the number ion traces scanned simultaneously is restricted. Therefore, the pesticide multi-methods are generally used for screening samples and as the above presented examples revealed, false identification can happen if only two ion transitions are used. Hence, confirmatory analysis shall be followed after the screening and the confirmatory method shall include more ion traces than those included in the screening approach. It is also important to emphasize that the calibration in neat solvent is only usable to screen the samples, the final decision on the sample shall include standard addition or isotopically labelled analogue to obtain the appropriate retention time.
The identification criteria laid down in SANTE guideline is appropriate as the current HPLC systems has a stable retention time and the MS/MS detection also gives stable IR (e.g., atrazine-desethyl) if the signal on the ion transitions can be appropriately distinguished from the noise. Improvement in identification can be achieved with HRMS or utilizing the isotope distribution of halogenated compounds (e.g., myclobutanil). However, final qualification from the screening method cannot be carried out even though the retention time and IR meet the criteria (e.g., propham). It is advised to use more than two ion transitions for the confirmatory analysis of compounds identified during screening analysis (e.g., quinoclamine, pirimisul-fon-methyl, tebufenpyrad, mepanipyrim). Although the standard addition approach for quantification is time consuming, it can also enhance the identification if there is negligible retention time difference between the matrix and target compounds.

4. Conclusions

Identification criteria laid down in the SANTE guideline are generally appropriate as HPLC systems can provide stable retention time data and MS/MS detection can record reproducible IR in case the signal on the relevant ion transitions can be appropriately distinguished from the noise. On the other hand, consumer awareness together with the increasing supply of formerly less common food commodities result in a longer list of analytical matrices to face in routine laboratories. Indeed, the novel and often “exotic” matrices might have not been considered and validated according to SANTE guidelines, and it is inevitable to deal with novel interferences on the MRM transitions of the hundreds of targeted pesticides. As some of the analytes possess low MRLs (ng/g levels), the involvement of HRMS setups may not offer the right solution for selective identification and, accordingly, the use of a minimum of three MRM transitions should be regarded as a general, and not exceptional policy, which should be often backed by the standard addition process. In the related good laboratory practice, scientific proactivity to set up an amendment for SANTE guidelines listing the problematic analyte + matrix couples (i.e., where the usual approach of using neat solvent-based calibration and monitoring only two MRMs has been reported to fail) would be highly welcome.

Supplementary Materials

The following supporting information can be downloaded at: https://www.mdpi.com/article/10.3390/app122312005/s1, Table S1: Screening detection Limits (SDLs) established for 415 pesticides in olive oil under screening analysis; Table S2: Recovery% (n = 10) and precision (RSD%) data calculated for 23 compounds under confirmatory validation. Sample matrix was olive oil.

Author Contributions

Conceptualization, E.T. and Á.T.; methodology, E.T. and Á.T.; software, E.T. and Á.T.; validation, E.T.; formal analysis, E.T.; investigation, E.T. and Á.T.; resources, M.B.; data curation, E.T. and Á.T.; writing—original draft preparation, Á.T. and E.T.; writing—review and editing, Á.T. and E.T. All authors have read and agreed to the published version of the manuscript.

Funding

This research received no external funding.

Institutional Review Board Statement

Not applicable.

Informed Consent Statement

Not applicable.

Data Availability Statement

Not applicable.

Acknowledgments

The authors would like to thank Mihály Dernovics for his assistance that improved the paper greatly.

Conflicts of Interest

The authors declare no conflict of interest.

References

  1. Narenderan, S.T.; Meyyanathan, S.N.; Babu, B. Review of pesticide residue analysis in fruits and vegetables. Pre-treatment, extraction and detection techniques. Int. Food Res. J. 2020, 133, 109141. [Google Scholar] [CrossRef] [PubMed]
  2. Wahab, S.; Muzammil, K.; Nasir, N.; Khan, M.S.; Ahmad, M.F.; Khalid, M.; Ahmad, W.; Dawria, A.; Reddy, L.K.V.; Busayli, A.M. Advancement and New Trends in Analysis of Pesticide Residues in Food: A Comprehensive Review. Plants 2022, 11, 1106. [Google Scholar] [CrossRef] [PubMed]
  3. Schleiffer, M.; Speiser, B. Presence of pesticides in the environment, transition into organic food, and implications for quality assurance along the European organic food chain—A review. Environ. Pollut. 2022, 313, 120116. [Google Scholar] [CrossRef] [PubMed]
  4. Burns, C.J.; McIntosh, L.J.; Mink, P.J.; Jurek, A.M.; Li, A.A. Pesticide exposure and neurodevelopmental outcomes: Review of the epidemiologic and animal studies. J. Toxicol. Environ. Health B Crit. Rev. 2013, 16, 127–283. [Google Scholar] [CrossRef] [PubMed]
  5. Islam, A.; Nurul Amin, S.M.; Aminur Rahman, M.; Juraimi, A.S.; Uddin, K.; Brown, K.L.; Arshad, A. Chronic effects of organic pesticides on the aquatic environment and human health: A review. Environ. Nanotechnol. Monit. Manag. 2022, 18, 100740. [Google Scholar] [CrossRef]
  6. O’Driscoll, H.J.; Siggins, A.; Healy, M.G.; McGinley, J.; Mellander, P.-E.; Morrison, L.; Ryan, P.C. A risk ranking of pesticides in Irish drinking water considering chronic health effects. Sci. Total Environ. 2022, 829, 154532. [Google Scholar] [CrossRef] [PubMed]
  7. Regulation (EC) No. 396/2005 of the European Parliament and of the Council of 23 February 2005 on Maximum Residue Levels of Pesticides in or on Food and Feed of Plant and Animal Origin and Amending Council Directive 91/414/EEC. Available online: http://data.europa.eu/eli/reg/2005/396/2016-05-13 (accessed on 18 September 2022).
  8. Pesticide Residue Monitoring Program, Fiscal Year 2020 Pesticide Report, U.S. Food and Drug Administration. Available online: https://www.fda.gov/media/160464/download (accessed on 18 September 2022).
  9. Pesticide Evaluations: Overview and Procedure. Available online: https://www.efsa.europa.eu/en/applications/pesticides (accessed on 18 September 2022).
  10. Xie, Y.; Wu, X.; Song, Y.; Sun, Y.; Tong, K.; Yu, X.; Fan, C.; Chen, H. Screening of 258 Pesticide Residues in Silage Using Modified QuEChERS with Liquid- and Gas Chromatography-Quadrupole/Orbitrap Mass Spectrometry. Agriculture 2022, 12, 1231. [Google Scholar] [CrossRef]
  11. Ghosh, R.K.; Khan, Z.S.; Banerjee, K.; Reddy, D.D.; Johnson, N.; Ray, D.P. Elucidation of False Detection of Pesticides During Residue Analysis in Indian Tobacco by Multidimensional GC-MS. J. AOAC Int. 2020, 103, 55–61. [Google Scholar] [CrossRef] [PubMed]
  12. Jo, H.-W.; Park, M.-G.; Jeon, H.-J.; Moon, J.-K.; Lee, S.-E. Analysis of Multiresidue Pesticides in Agricultural Paddy Soils Near Industrial Areas in Korea by GC–MS/MS and LC–MS/MS Using QuEChERS Extraction with dSPE Clean-Up. Appl. Sci. 2021, 11, 8415. [Google Scholar] [CrossRef]
  13. Guo, Z.; Zhu, Z.; Huang, S.; Wang, J. Non-targeted screening of pesticides for food analysis using liquid chromatography high-resolution mass spectrometry-a review. Food Addit. Contam Part A 2020, 37, 1180–1201. [Google Scholar] [CrossRef] [PubMed]
  14. Kalogiouri, N.P.; Papadakis, E.-N.; Maggalou, M.G.; Karaoglanidis, G.S.; Samanidou, V.F.; Menkissoglu-Spiroudi, U. Development of a Microwave-Assisted Extraction Protocol for the Simultaneous Determination of Mycotoxins and Pesticide Residues in Apples by LC-MS/MS. Appl. Sci. 2021, 11, 10931. [Google Scholar] [CrossRef]
  15. Jang, S.; Seo, H.; Kim, H.; Kim, H.; Ahn, J.; Cho, H.; Hong, S.; Lee, S.; Na, T. Development of a Quantitative Method for Detection of Multiclass Veterinary Drugs in Feed Using Modified QuPPe Extraction and LC–MS/MS. Molecules 2022, 27, 4483. [Google Scholar] [CrossRef] [PubMed]
  16. Tankiewicz, M.; Berg, A. Improvement of the QuEChERS method coupled with GC–MS/MS for the determination of pesticide residues in fresh fruit and vegetables. Microchem. J. 2022, 181, 107794. [Google Scholar] [CrossRef]
  17. Wang, S.; Li, X.; Li, M.; Li, X.; Zhang, Q.; Li, H. Emulsification/demulsification method coupled to GC–MS/MS for analysis of multiclass pesticide residues in edible oils. Food Chem. 2022, 379, 132098. [Google Scholar] [CrossRef] [PubMed]
  18. BS EN 15662:2018; Foods of Plant Origin. Multimethod for the Determination of Pesticide Residues Using GC- and LC-Based Analysis Following Acetonitrile Extraction/Partitioning and Clean-Up by Dispersive SPE. Modular QuEChERS-Method. 2018. Available online: https://www.en-standard.eu/bs-en-15662-2018-foods-of-plant-origin-multimethod-for-the-determination-of-pesticide-residues-using-gc-and-lc-based-analysis-following-acetonitrile-extraction-partitioning-and-clean-up-by-dispersive-spe-modular-quechers-method/ (accessed on 18 September 2022).
  19. Main Changes Introduced in Document N° SANTE/11312/2021 with Respect to the Previous Version (Document N° SANTE 12682/2019). Available online: https://food.ec.europa.eu/system/files/2022-02/pesticides_mrl_guidelines_wrkdoc_2021-11312.pdf (accessed on 18 September 2022).
  20. Malato, O.; Lozano, A.; Mezcua, M.; Agüera, A.; Fernandez-Alba, A.R. Benefits and pitfalls of the application of screening methods for the analysis of pesticide residues in fruits and vegetables. J. Chromatogr. A 2011, 1218, 7615–7626. [Google Scholar] [CrossRef] [PubMed]
  21. Mol, H.G.J.; Zomer, P.; de Koning, M. Qualitative aspects and validation of a screening method for pesticides in vegetables and fruits based on liquid chromatography coupled to full scan high resolution (Orbitrap) mass spectrometry. Anal. Bioanal. Chem. 2012, 403, 2891–2908. [Google Scholar] [CrossRef] [PubMed] [Green Version]
  22. Schürmann, A.; Dvorak, V.; Crüzer, C.; Butcher, P.; Kaufmann, A. False-positive liquid chromatography/tandem mass spectrometric confirmation of sebuthylazine residues using the identification points system according to EU directive 2002/657/EC due to a biogenic insecticide in tarragon. Rapid Commun. Mass Spectrom. 2009, 23, 1196–1200. [Google Scholar] [CrossRef] [PubMed]
  23. Mol Hans, G.J.; Zomer, P.; López, M.G.; Fussell, R.J.; Scholten, J.; de Kok, A.; Wolheim, A.; Anastassiades, M.; Lozano, A.; Alba, A.F. Identification in residue analysis based on liquid chromatography with tandem mass spectrometry: Experimental evidence to update performance criteria. Anal. Chim. Acta 2015, 873, 1–13. [Google Scholar] [CrossRef] [PubMed]
  24. Tóth, E.; Tölgyesi, Á.; Simon, A.; Bálint, M.; Ma, X.; Sharma, V.K. An Alternative Strategy for Screening and Confirmation of 330 Pesticides in Ground- and Surface Water Using Liquid Chromatography Tandem Mass Spectrometry. Molecules 2022, 27, 1872. [Google Scholar] [CrossRef] [PubMed]
  25. EU Pesticides Database. Available online: https://ec.europa.eu/food/plants/pesticides/eu-pesticides-database_hu (accessed on 18 September 2022).
Figure 1. Screening analysis of a date seed coffee sample. The IR (8.5%) of ion transitions of atrazine-desethyl in a neat solvent calibrant (100 ng/mL, above) excluded the presence of it in the sample (below).
Applsci 12 12005 g001
Figure 2. (a) Screening analysis of an herb extract. The ion transitions of primisulfuron-methyl in a neat solvent calibrant (100 ng/mL, above) and in the sample (below). (b) Confirmatory analysis of an herb extract for primisulfuron-methyl. The ion transitions of m/z 469 > 254 (blue line), m/z 469 > 135 (red line) and m/z 469 > 199 (green line). The spiking level was 0.010 mg/kg. Note the different retention time compared to the screening method, according to Section 2.4. (c) Confirmatory analysis of an herb extract for primisulfuron-methyl. The ion transition of m/z 469 > 199 was the only selective MRM for primisulfuron-methyl in this sample. The spiking level was 0.010 mg/kg. Different retention time compared to the screening method can be seen according to Section 2.4.
Applsci 12 12005 g002aApplsci 12 12005 g002b
Figure 3. (a) Screening analysis of myclobutanil in a white peppercorn sample. The identification criteria meet the theoretical requirements, i.e., the retention times and IR in the sample (below) were within the tolerance limits determined according to the neat solvent calibrant (100 ng/mL, above). (b) Confirmatory analysis for myclobutanil in a white peppercorn sample. The A + 2 ion transitions of (m/z 291 > 72, above) was the only selective MRM for myclobutanil, contributing to ruling out its false detection in this sample (below). Different retention time compared to the screening method can be seen according to Section 2.4. The arrow shows the absent of signal in the expected retention time on m/z 291 > 72 ion transition in the sample.
Applsci 12 12005 g003
Figure 4. (a) Screening analysis of propham in an elderberry sample. Relevant signals in the expected retention time (7.80 min) with tolerable IR difference appeared on the ion transitions of m/z 180 > 138 and m/z 180 > 120. (b) Confirmatory analysis of propham in elderberry sample. The retention time difference between the target compound (indicated by the arrow at 4.25 min) and the interfering matrix peak (4.21 min) can be clearly observed with the help of the standard addition process (below).
Applsci 12 12005 g004aApplsci 12 12005 g004b
Figure 5. (a) Screening analysis of a fennel sample. The ion transitions of quinoclamine in a neat solvent calibrant (100 ng/mL, below) and in the sample (above). (b) Confirmatory analysis of the fennel sample for quinoclamine with standard addition. The 208 > 172 m/z ion transition (Rt = 4.71 min) was selective enough to make the correct decision on the sample. This ion trace appeared only in the chromatogram of the spiked sample (0.010 mg/kg, below). The arrow shows the appearance of signal in the expected retention time in the fortified sample due to the spiking.
Applsci 12 12005 g005aApplsci 12 12005 g005b
Figure 6. (a) Screening analysis of a dried ginger sample. The ion transitions of tebufenpyrad in a neat solvent calibrant (100 ng/mL, above) and in the sample (below). (b) Confirmatory analysis of a dried ginger sample for tebufenpyrad using standard addition (0.010 mg/kg). Figures show the total ion chromatograms (TICs). (c) Confirmatory analysis of a dried ginger sample for tebufenpyrad using standard addition. The target compound elutes at 6.05 min. Ion transitions were as follows: blue line (m/z 334 > 145), green line (m/z 334 > 117), light blue line (m/z 334 > 114), purple line (m/z 334 > 91).
Applsci 12 12005 g006aApplsci 12 12005 g006b
Figure 7. (a) Screening analysis of parsley root sample. The ion transitions of mepanipyrim in a neat solvent calibrant (100 ng/mL, above) and in the sample (below). (b) Confirmatory analysis of parsley root sample for mepanipyrim using standard addition. The 224 > 206 ion transition (Rt = 7.10 min) was selective enough to exclude the presence of the analyte in the sample. This ion trace appeared only in the chromatogram of the spiked sample (0.050 mg/kg, below). The arrow shows the appearance of signal in the expected retention time in the fortified sample due to the spiking.
Applsci 12 12005 g007aApplsci 12 12005 g007b
Table 1. Blueberry purée, proficiency test 19,258 (FAPAS), October 2018.
ComponentAssigned Value (µg/kg)Result (µg/kg)z-Score
Benalaxyl68.871.50.2
Boscalid96.188.9−0.3
Diazinon19.520.30.2
Metolachlor (sum of constituent isomers including S-metolachlor)91.294.80.2
Table 2. Olive oil, proficiency test 5147 (FAPAS), October 2020.
ComponentAssigned Value (µg/kg)Result (µg/kg)z-Score
Buprofezin42.853.01.1
Dimethoate1521660.4
Hexythiazox54.663.00.7
Methamidophos71.884.00.8
Methomyl64.564.00.0
Phenthoate87.298.00.6
Pyrimethanil1091280.8
Quinalphos72.884.00.7
Tebuconazole1371620.8
Table 3. Apple purée, proficiency test 19,307 (FAPAS), March 2021.
ComponentAssigned Value (µg/kg)Result (µg/kg)z-Score
Dinotefuran76.283.10.4
Kresoxim-methyl36.253.42.2
Omethoate1171431.0
Pendimethalin41.158.61.9
Proquinazid82.71011.0
Tebufenpyrad59.174.91.2
Thiacloprid75.980.10.3
Table 4. Green bean purée, proficiency test 19,310 (FAPAS), April 2021.
ComponentAssigned Value (µg/kg)Result (µg/kg)z-Score
Azoxystrobin36.543.30.8
Carbendazim46.251.30.5
Carbofuran62.469.60.5
Clothianidin77.083.80.4
Cyprodinil42.745.90.3
Dimethoate57.162.80.5
Dimethomorph (sum of isomers)87.888.60.0
Emamectin (as emamectin benzoate B1a, expressed as emamectin)61.172.30.8
Monocrotophos47.550.90.3
Omethoate78.683.70.3
Tetraconazole75.582.70.4
Trifloxystrobin1121180.3
Table 5. Lettuce, proficiency test VF1700P (Test Veritas), October 2021.
ComponentAssigned Value (µg/kg)Result (µg/kg)z-Score
Atrazine39.347.20.77
Azoxystrobin1721920.48
Bocalid50.280.92.23
Cumaphos51.452.80.11
Linuron75.375.1−0.01
Pyrimethanil70.547.90.71
Triadimefon96.999.80.13
Table 6. Milk powder, proficiency test 5161 (FAPAS), September 2022.
ComponentAssigned Value (µg/kg)Result (µg/kg)z-Score
Malathion58.049.1−0.7
Phosmet51.352.60.1
Prochloraz58.263.70.4
Propoxur78.071.0−0.4
Tetraconazole76.070.8−0.3
Publisher’s Note: MDPI stays neutral with regard to jurisdictional claims in published maps and institutional affiliations.

