Abstract
Cichorium intybus L. (chicory) is an important medicinal plant with significant economic potential and has recently gained rapid momentum in the functional food sector. In the present study, soil chemistry, phytochemical, and molecular diversity were assessed for 50 accessions of chicory collected from diverse agro-climatic zones. In total, 64 common metabolites were identified from the leaves of 7 chicory accessions collected from different altitudes and among them, the predominant metabolites included methyl commate B (6.3–10.14%), gamma sitosterol (2.79–9.3%), and 9, 12, 15-octadecatrienoic-acid (2.55–8.42%). Three terpenoid compounds, viz., betulin, kolavelool and betulinaldehyde, were observed at high altitudes (1790, 1901, and 2172 m) and not observed at low altitudes. Among these compounds, betulin had the highest concentration with an average value of 23.53% followed by kolavelool with 7.37% and betulinaldehyde with 7.21%. For molecular diversity analysis, 12 ISSR primers were selected for PCR amplification and 86 bands were generated with an overall polymorphism percentage of 67.44%. The observed Nei’s genetic diversity (H) and Shannon’s information indices (I) were highest for the Pulwama (CIN-PU) group of accessions (H = 0.222 ± 0.018; I = 0.343 ± 0.027) and lowest for the Baramulla (CIN-BM) group of accessions (H = 0.115 ± 0.019; I = 0.173 ± 0.028). The Analysis of Molecular Variance (AMOVA) analysis revealed 56% variation existing within the groups and 44% among the groups of chicory accessions. This study shows that chicory populations vary considerably in terms of their molecular and phytochemical composition as a function of their geographic location. Furthermore, this study demonstrates that chicory phytochemical and molecular diversity are significantly influenced by altitude, soil chemistry, and growing conditions. Using metabolomics and altitudinal variation, cluster analysis showed that geographic origin was correlated with diversity patterns.
1. Introduction
The genus Cichorium belongs to the family Asteraceae and is represented by six species mostly distributed in European and Asian countries [1]. Cichorium intybus L. (chicory) is a perennial herb, distributed in temperate and semi-arid regions of the world and is widely grown as a multi-purpose crop, such as coffee substitutes, micro-greens, forage, and herbal medicine, thus having significant potential as a future crop [2,3,4]. The plant is highly valued because of its traditional medicinal properties, such as anticancer [5], antioxidant [6], anti-inflammatory [7], antidiabetic [8], antihelminthic [9], analgesic [10], cardiovascular [11], antimicrobial [12], gastroprotective [13], hepatoprotective [14], immune-boosting [15], reproduction-improving [16], and wound healing capabilities [17], and many other pharmacological applications [18]. Although all parts of the plant synthesize important secondary metabolites [18], the chicory root and leaves contain an important bioactive compound commonly known as inulin and it is also gaining popularity as a source of soluble dietary fiber and functional food [19,20,21]. In Europe, it has been consumed for centuries as a leafy vegetable and nowadays, it is ranked as a functional food of the 21st century because of the presence of important constituents, such as inulin (68%), sucrose (14%), and proteins (6%) on a dry weight basis [22,23]. The roots and leaves of chicory are known to contain several sesquiterpene lactones such as 8α-angeloyloxycichoralexin, which possess significant antifungal properties [24,25,26]. Moreover, flavones, flavonols, alkaloids, coumarins, and caffeic acid derivatives are also present in chicory as reported by Al-Snafi [18]. However, the metabolite concentration is affected by several factors that include the growing season, altitudinal variation, and climatic and edaphic factors [27,28,29]. Numerous studies have also demonstrated that different ecological, physiological, and genetic factors influence the quantity and quality of active principles and their biological activities [30,31,32]. Factors such as altitude, soil diversity, organic matter, calcium, phosphorous, and nitrogen play a significant role in the accumulation of bioactive substances in plants [31].
As the crop grows at different altitudes, unraveling the genetic diversity and metabolite profiling of chicory is of paramount importance to disclose how the diverse altitudinal ranges and edaphic factors affect the metabolite profiling of this species [32]. Moreover, the use of molecular markers has been applied to plant breeding and the conservation of genetic resources has proved to be quite effective [33]. However, due to the limited information available regarding isozymes and morphological traits, molecular markers could significantly help to determine the genetic variability in chicory [34]. DNA-based molecular markers have been reported for assessment of intra- and interspecific variations in the genome of a particular organism that exists in variable environmental conditions [35,36]. In this context, Qian et al. [37] reported that simple, cost-effective, rapid, and highly reproducible inter simple sequence repeat (ISSR) markers could be used to study genetic diversity in wild varieties, and, therefore, determine population structure [38,39,40,41,42,43]. Genetic diversity studies can be utilized to identify potential accessions/genotypes with desirable traits to enhance the gene pool of the species. Until now, no comprehensive study has been conducted to determine the interrelationships between altitude, edaphic factors, secondary metabolite composition, and molecular diversity in C. intybus collected from diverse altitudes and eco-geographical regions.
Given the above facts, this study was conducted to assess the effects of diverse altitudinal ranges and edaphic factors on the phytochemical and molecular diversity of Cichorium intybus collected from different sites of the Kashmir region and reveal their relationship by performing multivariate analysis.
2. Materials and Methods
2.1. Survey and Sample Collection
A random sampling technique was used for sample collection of the accessions of C. intybus L. (chicory) from diverse altitudinal ranges (roadsides, forest areas, and agricultural lands) of the Kashmir region. The sample material was collected from different districts, including Bandipora (BD), Baramulla (BM), Anantnag (AN), Srinagar (SR), Ganderbal (GA), Pulwama (PU), and Budgam (BU), in the months of August–October 2017 and 2018. A total of 50 accessions of chicory were collected from 7 different districts in the Kashmir region and plant identification was carried out at the Centre for Biodiversity and Taxonomy, Department of Botany, University of Kashmir, Srinagar-190006. The number of accessions collected, latitude, longitude, and mean altitude readings recorded by GPS at the various sites of the study area are presented in Table 1 and Table S1.

Table 1.
Collection sites and the number of accessions of C. intybus L. (chicory) used.
2.2. Phytochemical Analysis
Fresh leaves from the mature plants of seven different accessions of chicory were collected from seven different altitudinal ranges and were stored immediately at −40 °C before processing for metabolite profiling.
2.2.1. Preparation of Extract
To 5 g of air-dried powdered leaf samples, 40 mL of 80% (v/v) methanol was added and kept on an incubator shaker for 48 h at 25 °C. The extract was filtered through Whatman’s filter paper no. 45 and transferred to a fresh flask to allow the solvent to evaporate until the minimal volume was achieved and then ventilated to dryness. The residue was then re-suspended in a 2.5 mL mixture of acetonitrile, acetone, and ethanol (1:1:1), and the obtained dried powder was pooled and subjected to derivatization according to the protocol of Dhar et al. [40] by adding 80 μL of methoxyamine hydrochloride in pyridine (20 mg/mL) and incubated at 30 °C for 90 min. The sample was then trimethylsilylated at 37 °C for 30 min by adding 40 μL of N-methyl-N-(trimethylsilyl) trifluoroacetamide (MSTFA). The final filtrate was then filtered through a 0.22 µM syringe filter (Millipore Corp., Bedford, MA, USA). Thereafter, a 1 µL aliquot of the sample solution was injected into the GC/MS-MS system for the analysis.
2.2.2. GC-MS Analysis
GC-MS (GC-MS-QP2010 Plus: Shimadzu, Kyoto, Japan with headspace sampler (AOC-20s) and auto-injector (AOC-20i)) analysis was carried out at the University Science Instrumentation Centre, AIRF, Jawaharlal Nehru University, New-Delhi. The system was equipped with a mass selective detector with an ion source (temperature 220 °C and interface temperature 260 °C) and capillary column (Rt × 5 MS, with 30 mM × 0.25 mM and 0.25 μM). By enabling the split injection mode, the injector temperature was adjusted to 250 °C. The initial oven temperature was programmed from 60 (isothermal for 3 min), with a gradual increase of 10 °C/min, to 280 °C. Helium (>99.99%) was used as the carrier gas with a linear velocity of 40.5 cm/s. The programmed total flow was 16.3 mL/min, with a column flow of 1.21 mL/min.
2.2.3. Identification of the Compounds
Compounds were identified based on the retention time (RT) for GC and interpretation of the mass spectrum (MS) was carried out by comparing the obtained spectral fragmentation with the database provided by the WILEY 8 LIB and National Institute Standard and Technology (NIST 14 LIB; https://www.chemdata.nist.gov/; accessed on 18 March 2022). MS of the unknown component was compared with the spectrum of the known components stored in the WILEY and NIST libraries. The name, molecular weight, and structure of the components of the test material were finally ascertained.
2.3. Collection and Analysis of Soil Samples
Analysis of the soil sample was conducted at the laboratory of the Agricultural Department, Lal Mandi, Srinagar, Jammu and Kashmir, India. The total nitrogen, phosphorous, potassium, soil organic carbon, and pH of the soil samples were evaluated according to the Walkley and Black [41], Kjeldahl, and potentiometry methods [42], respectively.
2.4. Genetic Diversity Analysis
2.4.1. DNA Extraction
Extraction of the total genomic DNA was carried out by following the CTAB protocol as described by Doyle and Doyle [43] with minor modifications. DNA of three independent replicates was extracted from 1 g of fresh and healthy leaf tissues and the concentration of the extracted DNA samples was assessed by 0.8% agarose gel electrophoresis and UV-spectrophotometry. After estimating the DNA concentration, each sample was diluted to a concentration of 25 ng/µL by adding MilliQ water for PCR amplification.
2.4.2. ISSR Analysis and PCR Amplification
The ISSR reaction was performed with 50 ng of genomic DNA and the PCR reaction was carried out in a 25 µL final reaction mixture volume containing Taq buffer (1×), MgCl2 (3 mM), dNTPs (0.2 mM), primer (0.5 mM), and Taq polymerase (0.5 U) (all obtained from Merck Biosciences, India). PCR amplifications were carried out (SureCycler 8800, Agilent Technologies) under the following conditions: 5 min at 95 °C (initial denaturation) followed by 40 cycles at 94 °C for 1 min, 1 min at the annealing temperature (46–61 °C), extension at 72 °C for 2 min and 72 °C for 10 min for the final extension. Amplicons were separated on 1.8% agarose gel electrophoresis (75–80 V) for 2 h and the gels were visualized and photographed by a gel documentation system (UVC-1200, Major Science, Taiwan). All ISSR reactions were repeated at least three times to determine the reproducibility of the profiles. A set of 35 random ISSR primers were screened, out of which 12 primers were selected depending on the clarity and reproducibility of the banding patterns and the level of polymorphism detected. Using the visual method, the amplified bands were scored for presence (1) or absence (0). During analysis, only those bands which were persistent among replicates and repeated on two independent runs were included.
2.5. Statistical Analysis
To compare the significantly different means and test the effects of altitude, edaphic factors, and metabolomic profiling of Chicory, the one-way ANOVA method was employed using GraphPad Prism v. 7.0 (http://graphpad.com, accessed on 18 March 2022) and the data were also subjected to multivariate analysis using MetaboAnalyst software v. 4.0 (http://metaboanalyst.ca/, accessed on 18 March 2022) [44]. Population-wise Shannon’s information index I = −Σpi log2pi [45] and Nei’s genetic diversity H = 1−Σpi2 [46] were estimated using GenAlEx v. 6.5.1b (https://biology-assets.anu.edu.au/GenAlEx/Download.html, accessed on 18 March 2022) [47]. The degree of polymorphism was determined at the species and population level using percentage polymorphic bands (PPBs), Shannon’s information index (I) [48], and Nei’s genetic diversity index (H) [46]. The total genetic diversity (HT) and intra- and inter-population diversity (HS) were determined using Nei’s genetic diversity statistics. The coefficient of gene differentiation (GST) between populations/groups of accessions was calculated as GST = 1 − HS/HT and the gene flow was calculated using the following equation: Nm = 0.5 × (1 − GST)/GST. Nei’s unbiased genetic distance coefficient was used to measure the genetic distances (GDs) among populations/groups [46]. Based on the pair-wise squared Euclidean distances between the molecular haplotypes, AMOVA was performed to determine the partitioning of ISSR variation in chicory. The FST distance (fixation index) [49] among groups of accessions was determined using GenAlEx v. 6.51b [47]. The generated binary data matrix was used for the analysis of the genetic dissimilarity by DARwin software v. 6.0.21 (https://darwin.cirad.fr/, accessed on 18 March 2022) [50]. The UPGMA dissimilarity matrix data was used to generate a dendrogram and principal coordinate analysis (PCoA) was also performed on the dissimilarity matrix of the ISSR data using DARwin v. 6.0.21 [50].
3. Results
3.1. Distribution
An extensive survey was performed across the Kashmir region, which includes seven districts, including Bandipora (BD), Baramulla (BM), Anantnag (AN), Srinagar (SR), Ganderbal (GA), Budgam (BU), and Pulwama (PU), for germplasm collection. A total of 50 accessions of chicory seeds were collected from wild habitats and the passport data of these accessions are presented in Table S1. The present data show that the distribution pattern of chicory was more extensive in the study areas, especially in the districts Bandipora, Ganderbal, and Pulwama, whereas the rest of the districts had a smaller distribution. A map developed through ArcView GIS 3.3 software shows the distribution of chicory in the different districts of the Kashmir region and can thus be used to localize areas that have an abundant distribution (Figure 1).
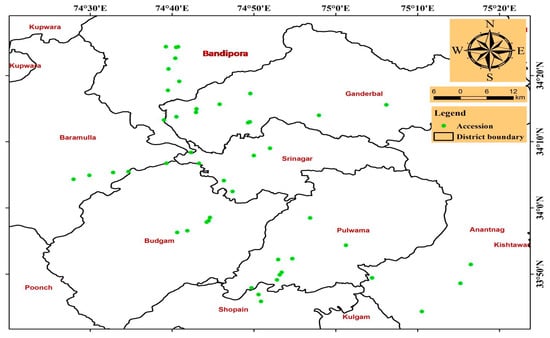
Figure 1.
Distributional map of accessions of C. intybus from different districts of the Kashmir region.
3.2. Identification of the Altitude-Responsive Metabolites in Chicory Leaves
Gas chromatography-mass spectrometry (GC-MS) is a robust technique for metabolomics study to identify various metabolites. The GC-MS analysis of chicory leaf led to the identification of various metabolites that show significant variation at different altitudes and localities. All identified major metabolites (˃1%), in terms of percent area, are shown in Table 2.
Table 2.
GC-MS analysis of C. intybus L. (chicory) from different altitudes.
The highest number of metabolites, i.e., 78, were identified at the highest elevation of 2172 m (17%) and the lowest number of metabolites, i.e., 61 (12%), were identified at the lowest elevation of 1554 m (Figure 2). Eight major metabolites were found in all the samples of all the selected altitudes and localities, among which methyl commate B showed the highest concentration with an average value of 8.65% followed by γ-sitosterol with 6.25% and 9,12,15-octadecatrienoic-acid (Z,Z,Z) with 4.60% (Figure S1). Interestingly, three terpenoid compounds, such as betulin, kolavelool, and betulinaldehyde, that were observed at high altitudes (1790, 1901, and 2172 m) were not observed at low altitudes in which betulin had the highest concentration with an average value of 23.53% followed by kolavelool with 7.37% and betulinaldehyde with 7.21% (Table 2). Interestingly, all major metabolites exhibited the highest concentration in terms of percentage area at the highest altitude of 2172 m. The structures of the major metabolites (11 metabolites) identified from the GC-MS profiling of chicory leaf collected from different altitudes and localities are presented in Figure S2 (Supplementary Materials). In the present study, GC-MS analysis indicated the presence of several metabolites in chicory leaf collected at different altitudes and localities among which some of the major metabolites possess known potent biological activities.
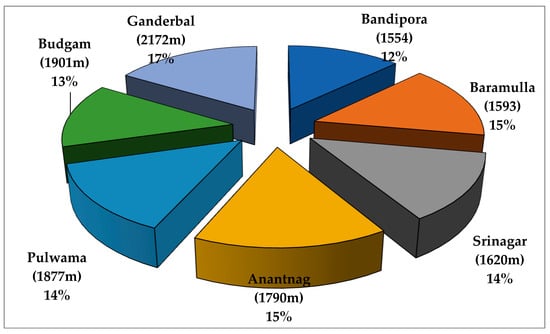
Figure 2.
Percentage of secondary metabolites identified by GC-MS analysis at different altitudes and localities in C. intybus L. (chicory).
3.3. Multivariate Metabolomics Data Analysis
Metabolite profiling among the 8 accessions of chicory collected from different altitudes revealed 64 common compounds. These included hydrocarbons, alcohols, esters, ketones, terpenoids, steroids, aldehydes, and fatty acids. The data were subjected to multivariate statistical analysis to understand the metabolomics responses of the chicory accessions to altitudinal variations. Hierarchical clustering analysis revealed that the chicory accessions were segregated separately based on their metabolomics responses (Figure S3). The metabolite profiling of different accessions in response to different altitudes was also analyzed and is presented in the form of a heatmap (Figure 3).
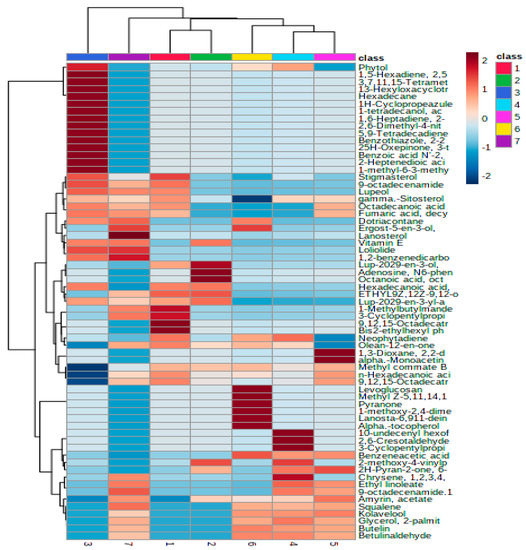
Figure 3.
Heat map of the normalized response ratios of leaf metabolite areas in chicory accessions in response to different altitudes. Data of the content value of each compound were normalized to complete linkage hierarchical clustering. Each altitude is visualized as a single column and each metabolite is represented by a single row. Red indicates high abundance, whereas low relative compounds are shown in blue (color key scale on the right of the heat map).
It was visualized that the varieties respond differently to the altitudinal variation. It was also found that the accessions from Ganderbal (2172 m) showed the highest number of metabolites (78) compared to the areas with the lowest altitudes. Heat map analysis of the various chicory accessions at different altitudes revealed that the majority of the metabolites showed a significant increase (as marked in red) while the other metabolites exhibited a significant decrease (marked in blue) under different altitudinal ranges. Segregation of the chicory accessions based on the metabolite levels was also determined through principal component analysis (PCA), partial least squares discriminant analysis (PLS-DA), and orthogonal PLS-DA (Figure S4). The findings suggest that the plants respond differently to different altitudinal variations. Using the PCA model and the PLS-DA model, biplots and VIP scores were generated to identify which metabolites are responsible for such variation (Figure S4). VIP plots analyzed 15 metabolites with VIP scores of 1.0–2.0 and included metabolites such as lanosterol, amyrin acetate, dotriacontane, and 9-octadecenamide. Further, Pearson’s correlation analysis was performed among the various metabolites of chicory accessions from different altitudes and the data showed that a significantly higher number of metabolites were identified among the accessions collected from higher altitudes, thus showing a positive altitudinal correlation (Figure 4).
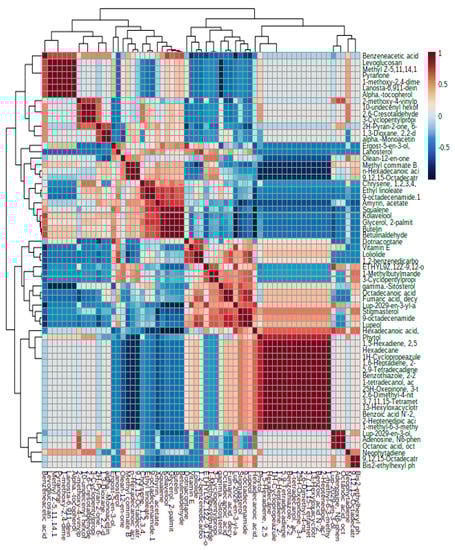
Figure 4.
Pearson’s correlation analysis among the different metabolites of chicory accessions from different altitudinal areas.
3.4. Soil Analysis
In the present investigation, soil organic carbon (SOC), nitrogen (N), phosphorous (P), potassium (K), and pH of the soil showed significant variation among the different altitudes and localities (Table 3). It is evident from the results that the percentage of soil organic carbon (4.792%), P content (440 mg/kg), and K content (96 mg/kg) was higher in the soil samples collected at the highest altitude of 2172 m with soil pH of 7.0, whereas the total N content (0.660%) was higher in the soil samples collected at an altitude of 1620 m with soil pH of 6.9 (Table 3). However, in the present study, the lowest values for the percentage of soil organic carbon (2.334%), P content (210 mg/kg), K content (54 mg/kg), and total N content (0.221%) were observed in the soil samples collected at the lowest altitude of 1554 m with soil pH of 8.21 (Table 3). Moreover, it was also found that there was an increase in the percentage of soil organic carbon and P and K content with an increase in altitude, except for total N content, which did not show any trend regarding the soil parameters with altitude.
Table 3.
Composition of soil at different altitudes in the Kashmir region.
3.5. Genetic Diversity Analysis
Genetic diversity assessment is an important parameter and forms the basis for the conservation of plant genetic resources. In the present study, DNA fingerprint profiles were developed using 12 ISSR markers. In total, 5–10 bands were generated per primer (an average of 7.16 bands/primer) with an average size ranging from 400 to 3000 bp. Among the 86 developed bands, 58 (67.44%) were polymorphic and 28 (32.55%) were monomorphic, reflecting rich genetic diversity in the sampled populations. Primer UBC841 and UBC842 exhibited the maximum number of polymorphic bands (7 amplicons each), with polymorphism percentages of 77.77% and 70%, respectively, and primer UBC880 showed the lowest polymorphism percentage of 40% (Figure S5). The percentage of polymorphism for various primers ranged from 40 to 80%. Among the 12 selected primers, 7 exhibited more than 70% polymorphism (Table 4).
Table 4.
ISSR primers used, polymorphic bands, and polymorphism percentage detected in the present study.
Analysis of the ISSR data revealed that the group of accessions (CIN-BM) showed the lowest frequency of percentage polymorphic bands (PPBs) (31.40%), whereas the group of accessions (CIN-PU) exhibited the highest frequency of PPBs (68.60%) with an average of 47.51% as shown in Table 5. Similarly, Nei’s genetic diversity (H) and Shannon’s information indices of phenotypic diversity (I) were lowest for the group of accessions of CIN-BM (H = 0.115 ± 0.019; I = 0.173 ± 0.0.028) and highest for the group of accessions of CIN-PU (H = 0.222 ± 0.0.018; I = 0.343 ± 0.0.027). The average values of Nei’s genetic diversity (H) and Shannon’s information indices of phenotypic diversity (I) were H = 0.160 ± 0.007 and I = 0.244 ± 0.011 as depicted in Table 5. A significant amount of genetic differentiation was observed based on the results obtained from Nei’s genetic diversity within and among the groups of accessions.
Table 5.
Percentage polymorphic bands (PPBs), Nei’s genetic diversity (H), and Shannon’s information indices (I) for ISSR in C. intybus L.
Nei’s diversity index-based analysis provided information about the total species diversity (HT), with an estimated value of 0.296, and the mean diversity within accessions (HS), with an estimated value of 0.160 as shown in Table 5. The proportion of diversity among the accessions (GST), also referred to as the coefficient of genetic differentiation, was estimated to be 0.459, suggesting that 45.9% of the genetic variability was distributed among the chicory accessions. The latter comprised a proportion of 0.541 of the total diversity, i.e., 54.1% of the total diversity was contributed within the accessions. A high level of genetic differentiation was also confirmed with a low level of gene flow (Nm = 0.589) (Table 6).
Table 6.
Nei’s estimates of total genetic diversity, intra-specific genetic diversity, the proportion of diversity within and among the accessions, and the degree of gene flow in C. intybus.
AMOVA revealed comparable results, with 56% of the variation present within the accessions of chicory, which was statistically significant at p < 0.01, whereas 44% of the total molecular variance was observed among the accessions as shown in Table 7.
Table 7.
Analysis of the molecular variance (AMOVA) for the accessions of C. intybus.
The FST distance among the groups of accessions ranged from 0.285 (between CIN-AN and CIN-PU) to 0.698 (between CIN-BM and CIN-GA) as depicted in Table 8.
Table 8.
FST distance among the groups of accessions of C. intybus.
Nei’s unbiased measure of the genetic distance among the groups of accessions of chicory ranged from 0.217 (between CIN-AN and CIN-PU) to 0.588 (between CIN-BM and CIN-GA) as shown in Table 9.
Table 9.
Nei’s unbiased measures of genetic identity and distance among the groups of accessions of C. intybus.
The DARwin program was used to construct the principal coordinate analysis (PCoA) and UPGMA hierarchical dendrogram. On the PCoA plot, genetically differentiated chicory accessions are grouped along the coordinate axes (Figure 5). Accessions collected from Budgam and Ganderbal showed greater dispersion compared to the accessions collected from other districts. However, accessions collected from the Srinagar district showed lesser dispersion and grouped together along the axes system. The DARwin-based UPGMA dendrogram also resolved 50 accessions in 7 major clusters (Figure 6). These clusters were exclusively formed based on the existing genetic variation among the accessions collected from different sites in the Kashmir region. Cluster-I comprised a total of 11 accessions mainly collected from the Bandipora district, cluster-II comprised 5 accessions collected from the Bandipora and Anantnag districts, cluster-III comprised 10 accessions collected from the Ganderbal and Pulwama districts, cluster-IV comprised 6 accessions collected from the Pulwama district, cluster-V comprised 6 accessions collected from the Baramulla and Anantnag districts, cluster-VI comprised 6 accessions collected from the Budgam district, and cluster-VII comprised 6 accessions collected from the Srinagar district. These seven major clusters formed sub-clusters based on the genetic differences among the accessions. Accession no. 21 collected from the Anantnag district was more distant as revealed by the PCoA plot and UPGMA dendrogram (Figure 5 and Figure 6).
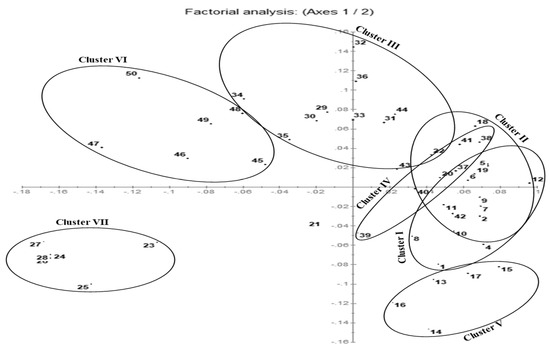
Figure 5.
Principal coordinate analysis (PCoA) plot of 50 accessions of C. intybus species based on ISSR marker data: (1–12 = CIN–BD, 13–17 = CIN–BM, 18–22 = CIN–AN, 23–28 = CIN–SR, 29–36 = CIN–GA, 37–44 = CIN–PU and 45–50 = CIN–BU).
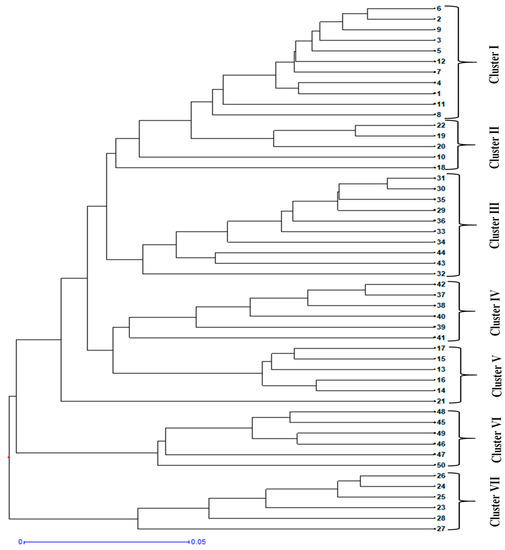
Figure 6.
UPGMA hierarchical dendrogram of 50 accessions of C. intybus based on ISSR marker data using Jaccard’s dissimilarity coefficient.
4. Discussion
4.1. Distribution of Chicory in the Kashmir Region
Agro-climatic zones display remarkable variation regarding abiotic factors, which results in the evolution of plant varieties due to selection pressures [51,52]. Comprehensive knowledge regarding species distribution is often considered a primary parameter to rehabilitate and utilize the species in the ecosystem [53]. In the present study, a distributional map of chicory was prepared for the first time to locate the distributional pattern in different agro-climatic zones based on an extensive survey across the Kashmir region. It was observed that the distribution of chicory varies significantly across different habitats and climatic zones as previously reported by Saenz-Romero et al. [54] and van Zonneveld et al. [55]. Moreover, the direction of the spread of chicory is along roadsides to various nearby sites, which include grazing lands, forests, agricultural lands, and some parts of mountains. However, the present study revealed that the distribution of chicory is extensive in the districts of Bandipora (BA), Ganderbal (GA), and Pulwama (PU) compared to the remaining districts. This may be due to the different climatic conditions of a particular area, which could severely restrict the survival and reproduction of plant populations, thus restricting the distributional pattern as a result of local adaptations [56,57]. Therefore, the distributional map provides a holistic view regarding the distribution pattern of chicory across the Kashmir region and can help to localize areas for germplasm collection based on existing available information.
4.2. Altitude Variation in Secondary Metabolite Profiling
Gas chromatography coupled with mass spectrometry (GC-MS) provides more precise information for qualitative and quantitative analysis of secondary metabolites [30]. During the present study, GC-MS analysis of chicory leaves collected at different altitudes and localities revealed the presence of different secondary metabolite compounds in different concentrations. The highest number of metabolites, i.e., 78, were identified at an elevation of 2172 m (17%) and the lowest number of metabolites, i.e., 61 (12%), were identified at the lowest elevation of 1554 m. Thus, altitudinal variation strongly influences the landscape topography, geology, amount of rainfall and, consequently, soil texture and moisture, groundwater depth, hydrology, evaporation, soil type, and the vegetation itself [58]. There are usually noticeable variations in secondary metabolite production between different taxa compared to intra-specific variations of a particular taxon at different elevations [59]. The present study also revealed the presence of eight common major metabolites from chicory samples at all altitudes and localities, among which methyl commate B had the highest concentration in terms of percent area (10.14) with an average value of 8.79% followed by γ-sitosterol and 9, 12, 15-octadecatrienoic acid, with potent known biological activities. Methyl commate B is a triterpene glycoside, which is a natural, polar compound with low volatility. Triterpene glycosides are well known for their cytotoxic, antibacterial, antimicrobial, antiviral, insecticide, nematicide, anticoagulant, hemolytic, antiparasitic, wound healing, and antitumor activities [60]. Another major metabolite that was observed is γ-sitosterol (9.3%), which is a steroid that possesses antibacterial potential [61] and anti-inflammatory activity after topical application [62]. Furthermore, the fatty acid 9,12,15, octadecatrienoic acid, a key metabolite identified in the GC-MS analysis in the present study, has anti-inflammatory, anticancer, hypocholesterolemia, insectifuge, and antiandrogenic activities [63]. This study also revealed the presence of three terpenoid compounds, including betulin, kolavelool, and betulin aldehyde, at high altitudes of 1790, 1901, and 2172 m that were not present at low altitudes, among which betulin had the highest concentration with an average value of 21.02% followed by kolavelool with 7.37% and betulinaldehyde with 6.98%. These compounds possess significant biological activities, for instance, betulin possesses anti-inflammatory [64], hepatoprotective activity [65], antiplasmodial effects and some of its derivatives were reported to exhibit antibacterial [66,67], anticancer [68] and antileishmanial activity [69]. Furthermore, kolavelool exhibited cytotoxic activity against human leukemia [70]. However, the plants’ ecological and physiological relations are significantly affected by different environmental factors such as sunlight, temperature, relative humidity, wind velocity, availability of water, etc. Altitudinal differences results in significant changes in these parameters, which in turn affects secondary metabolite production in plants [27]. Variation in the same taxon at different altitudes may be the result of differences in their genetic makeup. Thus, the presence and absence of a particular secondary metabolite in the chicory leaf at different altitudes might be due to the genetic variability, different geographical conditions, physiological development, and growth of the plant as revealed by the multivariate metabolomics data analysis.
4.3. Soil Analysis
The soil chemistry might affect the concentration and composition of the secondary metabolites of plants [71]. The present investigation revealed that the percentage of soil organic C and P and K content were higher in the soil samples collected at the highest altitude of 2172 m with a soil pH of 7.0 whereas the total N content was higher in the soil samples collected at an altitude of 1620 m with a soil pH of 6.9. In addition to elevation factors, the physiochemical properties of the soil may also influence the quantity and quality of secondary metabolites in medicinal and aromatic plants [72]. Various chemical elements present in the rhizosphere of plants enter the enzymatic composition and affect the biochemical processes of plants [71]. Hence, the soil chemistry can affect secondary metabolite production in plants. In the present investigation, it was also revealed that the percentage of soil organic C, P and K content, and the total N content were found to be the lowest in the soil samples collected at the lowest altitude of 1583 m with a soil pH of 8.2. Hence, the soil composition may also play an important role in the chemical profiling of secondary metabolites. Furthermore, it was also observed that there was an increase in the percentage of soil organic C and the P and K content with an increase in the altitude, except for the total N content, which did not show any trend in the soil parameters concerning the variable altitude. This means that the environmental factors that are suitable for one component might not be favorable for another component. Secondary metabolite production in plants is directly related to edaphic factors and the quantity and quality of secondary metabolite production are affected by genetic and environmental factors. Therefore, the distribution of secondary metabolites and soil components in the present study may be attributed to the different geographical conditions.
4.4. Genetic Diversity of Chicory in the Kashmir Region
The evaluation of genetic differences utilizing molecular markers will help in the analysis of selection procedures and conservation of a sufficient amount of genetic variation for the selection of breeding programs [73]. Therefore, the genetic diversity of chicory growing in various agro-climatic zones across the Kashmir region was evaluated using ISSR-based DNA markers. In the present study, the total percentage of polymorphism was found to be 67.44% across accessions and the data revealed that groups of accessions of chicory collected from Baramulla (CIN-BM) showed the lowest frequency of percentage polymorphic bands (31.40%), whereas the group of accessions collected from Pulwama (CIN-PU) exhibited the highest frequency of percentage polymorphic bands (68.60%) with an average PPB of 47.51%, indicating the high level of genetic variation in chicory. Moreover, a significant level of polymorphism was found within the group of accessions (54.1%) and among the groups of accession (45.9%) in the species collected from the different geographical locations under study. This was expected since the ISSR markers amplify microsatellite regions that exhibit significant polymorphism [74] and the promising outcome in the present investigation is due to the use of many randomly selected pre-screened highly informative primers. Using SRAP markers, Liang et al. [75] showed that the geographic structure also contributes to genetic differentiation within a species. Our results are also in agreement with Dar et al. [52], who observed a high level of genetic diversity within and among the groups of accessions of Phaseolus vulgaris; Alansi et al. [76] in Ziziphusspina-christi; Oliveira et al. [77] in Saccharum species; and Yuan et al. [78] in Abelmoschus escullentus collected from diverse locations using ISSR markers. Moreover, a recent study was conducted by Hamouda [79] using RAPD and ISSR markers in Silybum marianum, concluding that both the markers revealed a high degree of polymorphism, which varied between samples from distinct sites. In the current study, the high level of polymorphism might be due to the differences in the agro-climatic conditions and the type of propagation of the plant, which might have induced some variations in the population at the genetic level. Nei’s genetic diversity (H) and Shannon’s information indices (I) were lowest for the Baramulla (CIN-BM) group of accessions (H = 0.155 ± 0.019; I = 0.173 ± 0.028) and highest for the Pulwama (CIN-PU) group of accessions (H = 0.222 ± 0.018; I = 0.343 ± 0.027). The values of Nei’s genetic diversity (H) and Shannon information indices (I) for the species are indicative of the existence of significant genetic polymorphism in the species. It was also observed that although the majority of the diversity was distributed within groups of accessions (54.1%), a significant amount also existed among the groups as indicated by the GST value of 0.459 (HT = 0.296, HS = 0.160). According to Nei’s [46], GST is classified as low when GST < 0.05, medium when the GST value is between 0.05 and 0.15, and high when GST > 0.15. Thus, the GST (coefficient of genetic differentiation) coefficient of chicory (GST = 0.459) is considered high. The Cichorium species also had a gene flow (Nm) value less than 1 (Nm = 0.589), with Nm < 1 indicating local differentiation of populations while Nm > 1 is evidence of little differentiation among populations [80], indicating that our sampled populations were subjected to genetic drift and the high genetic differentiation within populations may be caused by the outcrossing pollination phenomenon and altitudinal variations. Our results are in agreement with Li et al. [81] and Chung and Chung [82], who found GST and Nm values ˂ 1 in Liriodendron chinense and Lilium cernuum, respectively. The AMOVA analysis found that most of the genetic diversity occurred within populations (56%) while genetic diversity between populations was 44%, indicating that chicory is a relatively outcrossing species. The high value of the intra-population genetic variation of chicory is in line with other studies on different plant species [83,84].
The present investigation also aimed to establish a relationship among the different accessions of chicory using ISSR markers collected from different sites of the Kashmir region. The PCoA plot was used to genetically differentiate the accessions collected from different agro-climatic zones into groups along the coordinate axes. The plot showed that the accessions collected from the Budgam, Ganderbal, and Pulwama districts were highly dispersed as compared to the accessions collected from other districts along the axes system. This may be due to the significant amount of genetic diversity exhibited by the accessions collected from such districts as also revealed by Nei’s genetic diversity and Shannon’s information index. PCoA analysis reflects the importance of the largest contributor to the variation at each axis of differentiation [85]. On the other hand, the UPGMA hierarchical method produces a dendrogram with the maximum cophenetic correlation [86], and it is the most effective protocol for representing dissimilarities among accessions. Moreover, a dendrogram was prepared based on UPGMA using Jaccard’s dissimilarity coefficients. In this dendrogram, 50 accessions were grouped into 7 major clusters and sub-clusters, i.e., cluster-I, cluster-II, cluster-III, cluster-IV, cluster-V, cluster-VI, and cluster-VII. However, cluster-VII formed a separate group and consisted exclusively of accessions from the Srinagar district. This may be due to the unique genetic architecture of the accessions found in this district. The distinctly different genetic architecture of these accessions can be ascribed to the kind of climate they inhabit. Our results are also in agreement with Kiers et al. [34], who observed that chicory has accumulated a large amount of genetic diversity controlled by several factors, including the outcrossing mechanism and climatic variations. Both the PCoA analysis and phylogeny reconstruction based on ISSR markers revealed a clustering pattern consistent with the geographical location and indicative of responses to environmental stress that resulted in such variations. ISSR markers are quite promising for differentiating closely related germplasm and thus may be used to effectively differentiate between accessions with a high degree of variability, thus making them powerful molecular tools for the analysis of significantly large genetic data [87,88]. Previous reports have also revealed that the level of polymorphism detected in species depends on various parameters such as the type of germplasm [89], markers [90], selected primers [91], and sampling strategy [92]. In summary, the findings of this study show that ISSR markers are efficient in detecting polymorphism even in closely related germplasm and suggest that they are useful for genome analysis and genetic variability studies in chicory.
5. Conclusions
The present study indicates that there is a significant distribution of chicory along the length and breadth of the Kashmir region. The present study found that the variation in the altitude, growing conditions, and edaphic factors has significantly affected the phytochemical and genetic diversity of chicory collected from diverse agro-ecological sites. Metabolomics profiling exhibited a significant correlation between altitudinal ranges and geographical origin with phytoconstituents, suggesting an effect on metabolite biosynthesis. In the present study, significant genetic diversity was also observed among the chicory accessions, especially those collected from the Budgam, Ganderbal, and Pulwama districts of the Kashmir region. Moreover, a significant level of diversity exists both within and among the groups of chicory accessions as revealed by AMOVA. This study also suggests that the use of ISSR markers is very effective in unraveling the genetic variation in the germplasm of chicory. These results are further supported by the PCoA plot and UPGMA hierarchical clustering, which revealed significant variation among the accessions. Therefore, the present information could act as a repository for taxonomists to localize the area for germplasm collection and diversity analysis for the effective management of the genetic resources of the species and their utilization in various breeding programs. As this study represents the first approach to obtain a preliminary understanding of the genetic diversity of chicory, future studies should include more accessions from diverse geographical regions of the country.
Supplementary Materials
The following are available online at https://www.mdpi.com/article/10.3390/app122312061/s1: Figure S1: Eight major metabolites present at all altitudes and localities identified by GC-MS analysis in C. intybus L. (chicory); Figure S2: Structures of major metabolites identified in C. intybus L. (chicory); Figure S3: Hierarchical cluster analysis of metabolites in chicory collected at seven different altitudes; Figure S4: Multivariate data analysis obtained using MetaboAnalyst software 4.0. Variable importance in projection (VIP) plot demonstrating (A) metabolites with maximum change at higher altitude (2172 m), (B) loadings, and (C) score plots of PCA analysis indicating a correlation between different metabolites subjected to different altitudinal variations; Figure S5: ISSR (UBC841 and UBC842) amplification profile of 50 accessions of C. intybus L. M = marker (100 bp); 1–12 = CIN–BD; 13–17 = CIN–BM; 18–22 = CIN–AN; 23–28 = CIN–SR; 29–36 = CIN–GA; 37–44 = CIN–PU and 45–50 = CIN–BU; Table S1: Passport data of different accessions of C. intybus collected from the Kashmir region.
Author Contributions
B.M. conceptualization, designed research work and conducted the experiments; B.M., F.A.D. and T.B.P. analyzed the data and wrote the manuscript; R.U.R., K.R.H., A.Z., T.A.Z. and H.F.A. reviewed and edited the manuscript and approved the final version of the manuscript. All authors have read and agreed to the published version of the manuscript.
Funding
This research was supported and funded by the Department of Science and Technology (DST), Government of India vide reference no.: SR/WOS-A/LS-1278/2015 under Women Scientist Scheme (WOS-A) to carry out this work.
Institutional Review Board Statement
Not applicable.
Informed Consent Statement
Not applicable.
Data Availability Statement
Not applicable.
Acknowledgments
The corresponding authors are thankful to the Department of Science & Technology (DST), Govt. of India for providing financial assistance under the Women Scientist Scheme (WOS-A) in conducting this research.
Conflicts of Interest
The authors declare no conflict of interest.
References
- Bais, H.P.; Ravishankar, G.A. Cichorium intybus L.—Cultivation, processing, utility, value addition and biotechnology, with an emphasis on current status and future prospects. J. Sci. Food Agric. 2001, 81, 467–484. [Google Scholar] [CrossRef]
- Hauser, T.P.; Jørgensen, R.B.; Toneatto, F. Reduced sexual compatibility between cultivated and wild chicory and their F 1 hybrids. Genet. Resour. Crop Evol. 2012, 59, 783–791. [Google Scholar] [CrossRef]
- Nandagopal, S.; Kumari, B.D.R. Phytochemical and Antibacterial Studies of Chicory (Cichorium intybus L.)—A Multipurpose Medicinal Plant. Adv. Biol. Res. 2007, 1, 17–21. [Google Scholar]
- Ivarsson, E.; Frankow-Lindberg, B.E.; Andersson, H.K.; Lindberg, J.E. Growth performance, digestibility and faecal coliform bacteria in weaned piglets fed a cereal-based diet including either chicory (Cichorium intybus L.) or ribwort (Plantago lanceolata L.) forage. Animal 2011, 5, 558–564. [Google Scholar] [CrossRef]
- Lee, K.T.; Kim, J.I.; Park, H.J.; Yoo, K.O.; Han, Y.N.; Miyamoto, K.I. Differentiation-inducing effect of magnolialide, a 1β-hydroxyeudesmanolide isolated from Cichorium intybus, on human leukemia cells. Biol. Pharm. Bull. 2000, 23, 1005–1007. [Google Scholar] [CrossRef]
- Mehmood, N.; Zubair, M.; Rizwan, K.; Rasool, N.; Shahid, M.; Ahmad, V.U. Antioxidant, antimicrobial and phytochemical analysis of Cichorium intybus seeds extract and various organic fractions. Iran. J. Pharm. Res. 2012, 11, 1145–1151. [Google Scholar] [CrossRef] [PubMed]
- Ripoll, C.; Schmidt, B.M.; Ilic, N.; Poulev, A.; Dey, M.; Kurmukov, A.G.; Raskin, I. Anti-inflammatory effects of a sesquiterpene lactone extract from chicory (Cichorium intybus L.) Roots. Nat. Prod. Commun. 2007, 2, 717–722. [Google Scholar] [CrossRef]
- Karim, A.; Nouman Sohail, M.; Munir, S.; Sattar, S.; Abbas, R.J.; Abdel Gadir, E.H.; Gadir, W.S.A.; Adam, S.E.I.; Abdel Gadir, E.H.; Gadir, W.S.A.; et al. Anti-diabetic effects of Cichorium intybus in streptozotocin-induced diabetic rats. Int. J. Pharmacol. 2010, 7, 278–282. [Google Scholar]
- Miller, M.C.; Duckett, S.K.; Andrae, J.G. The effect of forage species on performance and gastrointestinal nematode infection in lambs. Small Rumin. Res. 2011, 95, 188–192. [Google Scholar] [CrossRef]
- Wesołowska, A.; Nikiforuk, A.; Michalska, K.; Kisiel, W.; Chojnacka-Wójcik, E. Analgesic and sedative activities of lactucin and some lactucin-like guaianolides in mice. J. Ethnopharmacol. 2006, 107, 254–258. [Google Scholar] [CrossRef] [PubMed]
- Ahmed, N. Alloxan diabetes-induced oxidative stress and impairment of oxidative defense system in rat brain: Neuroprotective effects of cichorium intybus. Int. J. Diabetes Metab. 2009, 17, 105–109. [Google Scholar] [CrossRef]
- Das, S.; Vasudeva, N.; Sharma, S. Cichorium intybus: A concise report on its ethnomedicinal, botanical, and phytopharmacological aspects. Drug Dev. Ther. 2016, 7, 1. [Google Scholar] [CrossRef]
- Gürbüz, I.; Üstün, O.; Yeşilada, E.; Sezik, E.; Akyürek, N. In vivo gastroprotective effects of five Turkish folk remedies against ethanol-induced lesions. J. Ethnopharmacol. 2002, 83, 241–244. [Google Scholar] [CrossRef]
- Gilani, A.H.; Janbaz, K.H. Evaluation of the liver protective potential of Cichorium intybus seed extract on Acetaminophen and CCl4-induced damage. Phytomedicine 1994, 1, 193–197. [Google Scholar] [CrossRef]
- Kim, J.H.; Mun, Y.J.; Woo, W.H.; Jeon, K.S.; An, N.H.; Park, J.S. Effects of the ethanol extract of Cichorium intybus on the immunotoxicity by ethanol in mice. Int. Immunopharmacol. 2002, 2, 733–744. [Google Scholar] [CrossRef]
- Behnam-Rassouli, M.; Aliakbarpour, A.; Hosseinzadeh, H.; Behnam-Rassouli, F.; Chamsaz, M. Investigating the effect of aqueous extract of Chicorium intybus L. leaves on offspring sex ratio in rat. Phyther. Res. 2010, 24, 1417–1421. [Google Scholar] [CrossRef]
- Süntar, I.; Küpeli Akkol, E.; Keles, H.; Yesilada, E.; Sarker, S.D.; Baykal, T. Comparative evaluation of traditional prescriptions from Cichorium intybus L. for wound healing: Stepwise isolation of an active component by in vivo bioassay and its mode of activity. J. Ethnopharmacol. 2012, 143, 299–309. [Google Scholar] [CrossRef]
- Al-Snafi, A.E. Medicinal importance of Cichorium intybus—A review. IOSR J. Pharm. 2016, 6, 41–56. [Google Scholar]
- Douglas, J.A.; Poll, J.T.K. A preliminary assessment of chicory (Cichorium intybus) as an energy crop. N. Z. J. Exp. Agric. 1986, 14, 223–225. [Google Scholar] [CrossRef]
- Madrigal, L.; Sangronis, E. Inulin and derivates as key ingredients in functional foods. Arch. Latinoam. Nutr. 2007, 57, 387–396. [Google Scholar]
- Slavin, J.; Feirtag, J. Chicory inulin does not increase stool weight or speed up intestinal transit time in healthy male subjects. Food Funct. 2011, 2, 72–77. [Google Scholar] [CrossRef] [PubMed]
- Sinkovic, L.; Hribar, J.; Vidrih, R. Influence of Cultivar and Storage of Chicory (Cichorium intybus L.) Plants on Polyphenol Composition and Antioxidative Potential. Czech J. Food Sci. 2014, 32, 10–15. [Google Scholar] [CrossRef]
- Kim, M.; Shin, H.K. The water-soluble extract of chicory reduces glucose uptake from the perfused jejunum in rats. J. Nutr. 1996, 126, 2236–2242. [Google Scholar] [CrossRef] [PubMed]
- Peters, A.M.; van Amerongen, A. Sesquiterpene lactones in chicory (Cichorium intybus L.): Distribution in chicons and effect of storage. Food Res. Int. 1996, 29, 439–444. [Google Scholar] [CrossRef]
- Mares, D.; Romagnoli, C.; Tosi, B.; Andreotti, E.; Chillemi, G.; Poli, F. Chicory extracts from Cichorium intybus L. as potential antifungals. Mycopathologia 2005, 160, 85–91. [Google Scholar] [CrossRef] [PubMed]
- Monde, K.; Oya, T.; Shirata, A.; Takasugi, M. A guaianolide phytoalexin, cichoralexin, from Cichorium intybus. Phytochemistry 1990, 29, 3449–3451. [Google Scholar] [CrossRef]
- Şanli, A.; Karadoğan, T. Geographical Impact on Essential Oil Composition of Endemic Kundmannia Anatolica Hub.-Mor. (Apiaceae). African J. Tradit. Complement. Altern. Med. AJTCAM 2017, 14, 131–137. [Google Scholar] [CrossRef]
- Mishra, R.; Gupta, A.K.; Kumar, A.; Lal, R.K.; Saikia, D.; Chanotiya, C.S. Genetic diversity, essential oil composition, and in vitro antioxidant and antimicrobial activity of Curcuma longa L. germplasm collections. J. Appl. Res. Med. Aromat. Plants 2018, 10, 75–84. [Google Scholar] [CrossRef]
- Mahdavi, M.; Vahid, B.R. The effects of ecologic and habitational factors on the essence quality of Stachys lavandulifolia Vahl. in north Khorassan province. Int. J. Farming Allied Sci. 2015, 4, 448–456. [Google Scholar]
- Zhang, C.; Qi, M.; Shao, Q.; Zhou, S.; Fu, R. Analysis of the volatile compounds in Ligusticum chuanxiong Hort. using HS-SPME-GC-MS. J. Pharm. Biomed. Anal. 2007, 44, 464–470. [Google Scholar] [CrossRef]
- AA, T. Influence of ecological factors on the chemical composition of the essential oil of Stachys lavandulifolia (Lamiaceae). Calodema 2012, 228, 1–4. [Google Scholar]
- Bertoni, B.W.; Telles, M.P.d.C.; Malosso, M.G.; Torres, S.C.Z.; Pereira, J.O.; Lourenço, M.V.; França, S.d.C.; Pereira, A.M.S. Genetic diversity in natural populations of Jacaranda decurrens Cham. determined using RAPD and AFLP markers. Genet. Mol. Biol. 2010, 33, 532–538. [Google Scholar] [CrossRef] [PubMed]
- Ali, M.L.; Rajewski, J.F.; Baenziger, P.S.; Gill, K.S.; Eskridge, K.M.; Dweikat, I. Assessment of genetic diversity and relationship among a collection of US sweet sorghum germplasm by SSR markers. Mol. Breed. 2008, 21, 497–509. [Google Scholar] [CrossRef]
- Kiers, A.M.; Mes, T.H.; van der Meijden, R.; Bachmann, K. A search for diagnostic AFLP markers in Cichorium species with emphasis on endive and chicory cultivar groups. Genome 2000, 43, 470–476. [Google Scholar] [CrossRef] [PubMed]
- Powell, W.; Morgante, M.; Andre, C.; Hanafey, M.; Vogel, J.; Tingey, S.; Rafalski, A. The comparison of RFLP, RAPD, AFLP and SSR (microsatellite) markers for germplasm analysis. Mol. Breed. 1996, 2, 225–238. [Google Scholar] [CrossRef]
- Dávila, J.A.; Loarce, Y.; Ramsay, L.; Waugh, R.; Ferrer, E. Comparison of RAMP and SSR markers for the study of wild barley genetic diversity. Hereditas 1999, 131, 5–13. [Google Scholar] [CrossRef]
- Qian, W.; Ge, S.; Hong, D.Y. Genetic variation within and among populations of a wild rice Oryza granulata from China detected by RAPD and ISSR markers. Theor. Appl. Genet. 2001, 102, 440–449. [Google Scholar] [CrossRef]
- Zietkiewicz, E.; Rafalski, A.; Labuda, D. Genome fingerprinting by simple sequence repeat (SSR)-anchored polymerase chain reaction amplification. Genomics 1994, 20, 176–183. [Google Scholar] [CrossRef]
- Zoratti, L.; Palmieri, L.; Jaakola, L.; Häggman, H. Genetic diversity and population structure of an important wild berry crop. AoB Plants 2015, 7, plv117. [Google Scholar] [CrossRef]
- Dhar, P.; Tayade, A.B.; Kumar, J.; Chaurasia, O.P.; Srivastava, R.B.; Singh, S.B. Nutritional profile of phytococktail from trans-Himalayan plants. PLoS ONE 2013, 8, e83008. [Google Scholar] [CrossRef]
- Walkley, A.; Black, I.A. An examination of the degtjareff method for determining soil organic matter, and a proposed modification of the chromic acid titration method. Soil Sci. 1934, 37, 29–38. [Google Scholar] [CrossRef]
- Bremner, J.M. Determination of nitrogen in soil by the Kjeldahl method. J. Agric. Sci. 1960, 55, 11–33. [Google Scholar] [CrossRef]
- Doyle, J.J.; Doyle, J.L. Isolation of plant DNA from fresh tissue. Focus 1988, 12, 13–15. [Google Scholar] [CrossRef]
- Chong, J.; Soufan, O.; Li, C.; Caraus, I.; Li, S.; Bourque, G.; Wishart, D.S.; Xia, J. MetaboAnalyst 4.0: Towards more transparent and integrative metabolomics analysis. Nucleic Acids Res. 2018, 2, W486–W494. [Google Scholar] [CrossRef]
- Shannon, C.E.; Weaver, W. The mathematical theory of communication, University of Illinois Press. Urbana 1949, 27, 379–423. [Google Scholar]
- Nei, M. Estimation of average heterozygosity and genetic distance from a small number of individuals. Genetics 1978, 89, 583–590. [Google Scholar] [CrossRef]
- Peakall, R.; Smouse, P.E. GenALEx 6.5: Genetic analysis in Excel. Population genetic software for teaching and research-an update. Bioinformatics 2012, 28, 2537–2539. [Google Scholar] [CrossRef] [PubMed]
- Lewontin, R.C. The apportionment of human diversity. Concept Race Nat. Soc. Sci. 2014, 7–15. [Google Scholar] [CrossRef]
- Slatkin, M. A Measure of Population Subdivision Based on Microsatellite Allele Frequencies. Genetics 1995, 139, 457–462. [Google Scholar] [CrossRef] [PubMed]
- Perrier, X.; Jacquemoud-collet, J. DARwin software. Nat. Methods 2006, 5, 1005–1010. [Google Scholar]
- Singh, A.K.; Smartt, J.; Simpson, C.E.; Raina, S.N. Genetic variation vis-a-vis molecular polymorphism in groundnut, Arachis hypogaea L. Genet. Resour. Crop Evol. 1998, 45, 119–126. [Google Scholar] [CrossRef]
- Dar, F.A.; Verma, S.; Rehman, R.U. Genetic Diversity Assessment of Phaseolus vulgaris L. in Two Himalayan Districts of India. Proc. Natl. Acad. Sci. India Sect. B-Biol. Sci. 2018, 88, 165–173. [Google Scholar] [CrossRef]
- Abbott RJ, B.A. Altitudinal gradients, plant hybrid zones and evolutionary novelty. Philos. Trans. R. Soc. Lond. B Biol. Sci. 2014, 369, 1648. [Google Scholar] [CrossRef] [PubMed]
- Sáenz-Romero, C.; Guzmán-Reyna, R.R.; Rehfeldt, G.E. Altitudinal genetic variation among Pinus oocarpa populations in Michoacán, Mexico. Implications for seed zoning, conservation, tree breeding and global warming. For. Ecol. Manag. 2006, 229, 340–350. [Google Scholar] [CrossRef]
- Van Zonneveld, M.; Jarvis, A.; Dvorak, W.; Lema, G.; Leibing, C. Climate change impact predictions on Pinus patula and Pinus tecunumanii populations in Mexico and Central America. For. Ecol. Manag. 2009, 257, 1566–1576. [Google Scholar] [CrossRef]
- Ohsawa, T.; Ide, Y. Global patterns of genetic variation in plant species along vertical and horizontal gradients on mountains. Glob. Ecol. Biogeogr. 2008, 17, 152–163. [Google Scholar] [CrossRef]
- Frei, E.R.; Ghazoul, J.; Matter, P.; Heggli, M.; Pluess, A.R. Plant population differentiation and climate change: Responses of grassland species along an elevational gradient. Glob. Chang. Biol. 2014, 20, 441–455. [Google Scholar] [CrossRef]
- Knoop, W.T.; Walker, B.H. Interactions of Woody and Herbaceous Vegetation in a Southern African Savanna. J. Ecol. 1985, 73, 235. [Google Scholar] [CrossRef]
- Zidorn, C.; Schubert, B.; Stuppner, H. Altitudinal differences in the contents of phenolics in flowering heads of three members of the tribe Lactuceae (Asteraceae) occurring as introduced species in New Zealand. Biochem. Syst. Ecol. 2005, 33, 855–872. [Google Scholar] [CrossRef]
- Bahrami, Y.; Franco, C.M.M.; Benkendorff, K. Acetylated triterpene glycosides and their biological activity from holothuroidea reported in the past six decades. Mar. Drugs 2016, 14, 147. [Google Scholar] [CrossRef] [PubMed]
- Ododo, M.M.; Choudhury, M.K.; Dekebo, A.H. Structure elucidation of β-sitosterol with antibacterial activity from the root bark of Malva parviflora. Springerplus 2016, 5. [Google Scholar] [CrossRef] [PubMed]
- Gómez, M.A.; Sáenz, M.T.; García, M.D.; Fernández, M.A. Study of the topical anti-inflammatory activity of Achillea ageratum on chronic and acute inflammation models. Z. Naturforsch.-Sect. C J. Biosci. 1999, 54, 937–941. [Google Scholar] [CrossRef]
- Vohra, A.; Kaur, H.P. Chemical investigation of medicinal plant Ajuga bractaeosa. J. Nat. Prod. Plant Resour. 2011, 1, 37–45. [Google Scholar]
- Alakurtti, S.; Mäkelä, T.; Koskimies, S.Y.-K. Pharmacological properties of the ubiquitous natural product betulin. Eur. J. Pharm. Sci. 2006, 29, 385–397. [Google Scholar] [CrossRef] [PubMed]
- Shikov, A.N.; Djachuk, G.I.; Sergeev, D.V.; Pozharitskaya, O.N.; Esaulenko, E.V.; Kosman, V.M.; Makarov, V.G. Birch bark extract as therapy for chronic hepatitis C—A pilot study. Phytomedicine 2011, 18, 807–810. [Google Scholar] [CrossRef] [PubMed]
- Chue, K.T.; Chang, M.S.; Ten, L.N. Synthesis and antibacterial activity of betulin esters. Chem. Nat. Compd. 2011, 47, 583–586. [Google Scholar] [CrossRef]
- Haque, S.; Nawrot, D.A.; Alakurtti, S.; Ghemtio, L.; Yli-Kauhaluoma, J.; Tammela, P. Screening and characterisation of antimicrobial properties of semisynthetic betulin derivatives. PLoS ONE 2014, 9, e102696. [Google Scholar] [CrossRef]
- Sousa, M.C.; Varandas, R.; Santos, R.C.; Santos-Rosa, M.; Alves, V.; Salvador, J.A.R. Antileishmanial activity of semisynthetic lupane triterpenoids betulin and betulinic acid derivatives: Synergistic effects with miltefosine. PLoS ONE 2014, 9, e89939. [Google Scholar] [CrossRef]
- Tang, J.; Jones, S.A.; Jeffery, J.L.; Miranda, S.R.; Galardi, C.M.; Irlbeck, D.M.; Brown, K.W.; McDanal, C.B.; Han, N.; Gao, D.; et al. Synthesis and Biological Evaluation of Macrocyclized Betulin Derivatives as a Novel Class of Anti-HIV-1 Maturation Inhibitors. Open Med. Chem. J. 2014, 8, 23–27. [Google Scholar] [CrossRef][Green Version]
- Chawengrum, P.; Boonsombat, J.; Kittakoop, P.; Mahidol, C.; Ruchirawat, S.; Thongnest, S. Cytotoxic and antimicrobial labdane and clerodane diterpenoids from Kaempferia elegans and Kaempferia pulchra. Phytochem. Lett. 2018, 24, 140–144. [Google Scholar] [CrossRef]
- Vaičiulytė, V.; Ložienė, K.; Taraškevičius, R.; Butkienė, R. Variation of essential oil composition of Thymus pulegioides in relation to soil chemistry. Ind. Crops Prod. 2017, 95, 422–433. [Google Scholar] [CrossRef]
- Weiss, U.; Edwards, J.M. The Biosynthesis of Aromatic Compounds. Biochem. Educ. 1980, 9, 323–343. [Google Scholar] [CrossRef]
- Azevedo, A.L.S.; Costa, P.P.; Machado, M.A.; de Paula, C.M.P.; Sobrinho, F.S. High degree of genetic diversity among genotypes of the forage grass Brachiaria ruziziensis (Poaceae) detected with ISSR markers. Genet. Mol. Res. 2011, 10, 3530–3538. [Google Scholar] [CrossRef] [PubMed]
- Morgante, M.; Olivieri, A.M. PCR-amplified microsatellites as markers in plant genetics. Plant J. 1993, 3, 175–182. [Google Scholar] [CrossRef]
- Liang, X.Y.; Zhang, X.Q.; Bai, S.Q.; Huang, L.K.; Luo, X.M.; Ji, Y.; Jiang, L.F. Genetic diversity and relationship of chicory (Cichorium intybus L.) using sequence-related amplified polymorphism markers. Genet. Mol. Res. 2014, 13, 7736–7746. [Google Scholar] [CrossRef]
- Alansi, S.; Tarroum, M.; Al-Qurainy, F.; Khan, S.; Nadeem, M. Use of ISSR markers to assess the genetic diversity in wild medicinal Ziziphus spina-christi (L.) Willd. collected from different regions of Saudi Arabia. Biotechnol. Biotechnol. Equip. 2016, 30, 942–947. [Google Scholar] [CrossRef]
- Oliveira, L.A.R.; Machado, C.A.; Cardoso, M.N.; Oliveira, A.C.A.; Amaral, A.L.; Rabbani, A.R.C.; Silva, A.V.C.; Ledo, A.S. Genetic diversity of Saccharum complex using ISSR markers. Genet. Mol. Res. 2017, 16, gmr16039788. [Google Scholar] [CrossRef][Green Version]
- Yuan, C.Y.; Wang, P.; Chen, P.P.; Xiao, W.J.; Zhang, C.; Hu, S.; Zhou, P.; Chang, H.P.; He, Z.; Hu, R.; et al. Genetic diversity revealed by morphological traits and ISSR markers in 48 Okras (Abelmoschus escullentus L.). Physiol. Mol. Biol. Plants 2015, 21, 359–364. [Google Scholar] [CrossRef]
- Hamouda, M. Molecular analysis of genetic diversity in population of Silybum marianum (L.) Gaertn in Egypt. J. Genet. Eng. Biotechnol. 2019, 17, 12. [Google Scholar] [CrossRef]
- McDermott, J.M.; McDonald, B.A. Gene flow in plant pathosystems. Annu. Rev. Phytopathol. 1993, 31, 353–373. [Google Scholar] [CrossRef]
- Li, K.; Chen, L.; Feng, Y.; Yao, J.; Li, B.; Xu, M.; Li, H. High genetic diversity but limited gene flow among remnant and fragmented natural populations of Liriodendron chinense Sarg. Biochem. Syst. Ecol. 2014, 54, 230–236. [Google Scholar] [CrossRef]
- Chung, M.Y.; Chung, M.G. Large effective population sizes and high levels of gene flow between subpopulations of Lilium cernuum (Liliaceae). Biochem. Syst. Ecol. 2014, 54, 354–361. [Google Scholar] [CrossRef]
- Jena, S.N.; Verma, S.; Nair, K.N.; Srivastava, A.K.; Misra, S.; Rana, T.S. Genetic diversity and population structure of the mangrove lime (Merope angulata) in India revealed by AFLP and ISSR markers. Aquat. Bot. 2015, 120, 260–267. [Google Scholar] [CrossRef]
- Pereira, D.d.A.; Corrêa, R.X.; Oliveira, A.C. de Molecular genetic diversity and differentiation of populations of “somnus” passion fruit trees (Passiflora setacea DC): Implications for conservation and pre-breeding. Biochem. Syst. Ecol. 2015, 59, 12–21. [Google Scholar] [CrossRef]
- Santosh, K.; Kumar, S.; Baranwal, D.K.; Chatterjee, A.; Solankey, S.S. Genetic Diversity Based on Cluster and Principal Component Analyses for Yield and Quality Attributes in Ginger (Zingiber officinale Roscoe). Int. J. Plant Breed. Genet. 2013, 7, 159–168. [Google Scholar] [CrossRef]
- De Magalhães Bertini, C.H.C.; Schuster, I.; Sediyama, T.; de Barros, E.G.; Moreira, M.A. Characterization and genetic diversity analysis of cotton cultivars using microsatellites. Genet. Mol. Biol. 2006, 29, 321–329. [Google Scholar] [CrossRef]
- Reddy, M.P.; Sarla, N.; Siddiq, E.A. Inter simple sequence repeat (ISSR) polymorphism and its application in plant breeding. Euphytica 2002, 128, 9–17. [Google Scholar] [CrossRef]
- Sethy, N.K.; Shokeen, B.; Edwards, K.J.; Bhatia, S. Development of microsatellite markers and analysis of intraspecific genetic variability in chickpea (Cicer arietinum L.). Theor. Appl. Genet. 2006, 112, 1416–1428. [Google Scholar] [CrossRef]
- He, Q.; Li, X.W.; Liang, G.L.; Ji, K.; Guo, Q.G.; Yuan, W.M.; Zhou, G.Z.; Chen, K.S.; van de Weg, W.E.; Gao, Z.S. Genetic Diversity and Identity of Chinese Loquat Cultivars/Accessions (Eriobotrya japonica) Using Apple SSR Markers. Plant Mol. Biol. Rep. 2011, 29, 197–208. [Google Scholar] [CrossRef]
- Baraket, G.; Chatti, K.; Saddoud, O.; Abdelkarim, A.B.; Mars, M.; Trifi, M.; Hannachi, A.S. Comparative Assessment of SSR and AFLP Markers for Evaluation of Genetic Diversity and Conservation of Fig, Ficus carica L.; Genetic Resources in Tunisia. Plant Mol. Biol. Rep. 2011, 29, 171–184. [Google Scholar] [CrossRef]
- Sharma, S.S.; Negi, M.S.; Sinha, P.; Kumar, K.; Tripathi, S.B. Assessment of Genetic Diversity of Biodiesel Species Pongamia pinnata Accessions using AFLP and Three Endonuclease-AFLP. Plant Mol. Biol. Rep. 2011, 29, 12–18. [Google Scholar] [CrossRef]
- Kong, Q.; Li, X.; Xiang, C.; Wang, H.; Song, J.; Zhi, H. Genetic Diversity of Radish (Raphanus sativus L.) Germplasm Resources Revealed by AFLP and RAPD Markers. Plant Mol. Biol. Rep. 2011, 29, 217–223. [Google Scholar] [CrossRef]
Publisher’s Note: MDPI stays neutral with regard to jurisdictional claims in published maps and institutional affiliations. |
© 2022 by the authors. Licensee MDPI, Basel, Switzerland. This article is an open access article distributed under the terms and conditions of the Creative Commons Attribution (CC BY) license (https://creativecommons.org/licenses/by/4.0/).