Article

Cyclic and Fragility Analysis of a Corroded Bridge Reinforced by Steel Plates under Mainshock and Aftershock Sequences

1
Jiangsu Ningjingyan Highway Co., Ltd., No. 2, Jiangyan Avenue, Jiangyan District, Taizhou 225500, China
2
College of Civil Science and Engineering, Yangzhou University, Yangzhou 225127, China
*
Author to whom correspondence should be addressed.
Appl. Sci. 2022, 12(23), 12078; https://doi.org/10.3390/app122312078
Submission received: 24 October 2022 / Revised: 18 November 2022 / Accepted: 22 November 2022 / Published: 25 November 2022
(This article belongs to the Special Issue Seismic Design and Damage Evaluation of Steel Structures)

Abstract

:
The corrosion of steel bars embedded in concrete structures results in the degradation of their structural capacity. In earthquake-prone zones, the corroded structure may be considerably vulnerable under mainshock–aftershock sequences relative to a single mainshock. Therefore, it is necessary to reinforce corroded structures to resist potential natural hazards. In this study, the effects of both pitting and uniform corrosion on the structural capacity of a bridge pier before and after strengthening were studied. Subsequently, the failure probability of a corroded bridge was calculated, which is conditional on the corrosion level, steel plate thickness, and ground-motion intensity. The findings implied that both pitting and uniform corrosions significantly reduced the capacity of the bridge pier, particularly pitting corrosion. The fragility curves showed that with an increased thickness of the steel plate, the probability of failure decreases if the intensity of the mainshock–aftershock sequences is higher than the threshold value. In addition, the threshold value has a high correlation with the thickness of the steel plate and the corrosion ratio.

1. Introduction

In marine environments, the corrosion of steel bars embedded in the concrete of structural components, such as beams or piers, is a common phenomenon. Corrosion reduces the mechanical properties of steel bars [1,2,3]. Generally, there are two types of corrosion: pitting and uniform. Both types of corrosion affect the yield stress and Young’s modulus of the steel bars [3]. However, some researchers have demonstrated that corrosion causes a decrease only in the bar area [4,5]. Therefore, in [4], the loss of bar area was utilized to simulate the corrosion of longitudinal bars. Although researchers have different opinions about the mechanical properties of corroded steel bars, they agree that the corroded steel bars reduce the structural capacity [4,6,7,8,9,10,11,12,13,14]. Ghosh and Padgett [4] stated that the probability of failure of corroded bridge systems increases with the corrosion ratio. The cyclic behavior of corroded reinforced concrete piers was investigated by Guo et al. [12], and the results implied that corrosion causes a significant degradation in the structural capacity. Other researchers have also assessed the fatigue failure of corroded bridge structures [15,16,17,18,19]. In [16], a simplified approach was proposed for the corrosion fatigue assessment of steel structures in aggressive environments; and in [17], statistical time features were used for global corrosion assessment in a truss bridge from vibration signals.
Based on the above studies, it can be concluded that corrosion induces a degradation of the structural capacity. Therefore, it is necessary to reinforce corroded structures to enhance their performance. Many reinforcement methods have been developed and utilized to strengthen buildings or bridge structures in civil engineering [20]. These methods include: increasing the concrete section [21,22,23,24,25], or using bonded steel plates [26,27], carbon fiber-reinforced plastic [28,29], or glass-fiber-reinforced polymers [30,31]. Bonded steel plates are commonly used to reinforce bridge piers, beams, or other structural components to enhance their flexural and shear capacities. Tan and Tjandra [24] demonstrated that external tendons are effective in reinforcing continuous beams by improving their ductility. GFRP composite sheets are effective in improving compressive strength, and increasing the number of GFRP layers can significantly enhance the load capacity of a column [30]. Fiber-reinforced polymer composites are widely used in engineering for retrofitting bridge piers. In [32], the effectiveness of carbon-fiber-reinforced polymer jackets on retrofitted bridge piers was evaluated, and the findings indicated that FRP jackets improved the ductility capacity of plastic hinges; thus, this approach successfully eliminated the potential collapse of bridge columns subjected to strong earthquakes.
Numerous efforts have been made to evaluate the structural capacity of strengthened structures. Among these studies, some have focused on the safety evaluation of deteriorated structures with different retrofitting methods subjected to earthquake loads or other natural hazards through fragility analysis [33]. However, earthquake events in the past have shown that many aftershocks may follow a mainshock, and these aftershocks with high magnitudes may also have the potential to damage bridges or building structures, especially those damaged in the mainshock [34,35,36,37,38,39,40,41,42,43,44,45,46,47,48]. Yin et al. [35] suggested that the influence of mainshock and aftershock sequences (MAS) on seismic loss should be further investigated. In [49], the findings imply that aftershocks have a remarkable influence on the seismic behavior of low-ductility RC frame structures, and the degree of effect is determined by the magnitude of the mainshock.
In these previous studies, researchers have focused on the mechanical properties of corroded steel bars and the carrying capacity of corroded structures. In addition, several reinforcement methods have been developed to enhance their capacity. The performance of reinforced structures in resisting natural hazards, such as earthquake loads, has also been investigated. However, few studies have been conducted on the seismic behavior of strengthened corroded bridge systems after reinforcement subjected to MAS considering both pitting and uniform corrosion. In this study, a two-span bridge system was used to examine performance before and after bonded steel-plate reinforcement under multi-hazard MAS, and steel bar corrosion through cyclic pushover and seismic fragility analyses. In the cyclic and seismic fragility analyses, the pitting and uniform corrosion of the longitudinal and circular hoop bars were considered. Following the introduction, the methodology of fragility analysis is presented in Section 2. In Section 3, corrosion and MAS are introduced. The finite element model of the bridge is presented in Section 4, and the corresponding numerical results are introduced in Section 5. The discussion and conclusions are presented in the final section.

2. Seismic Fragility Analysis

Seismic fragility analysis is a powerful tool for evaluating the failure probability of bridges or buildings subjected to earthquake loads, which is conditional on a particular seismic intensity [50,51,52,53,54,55,56,57]. The fragility function is expressed as Equation (1).
P ( C < D ) | P G A = Φ ( ln x ln σ ξ )
where P ( C < D ) | P G A is the probability of exceeding a damage state, C denotes the structure’s capacity, D denotes the seismic demand, Φ is the cumulative normal distribution function, x is the intensity of ground motions, σ , and ξ is the mean and standard deviation of seismic intensity resulting in a damaged state, respectively.
Over the past ten years, researchers have mainly focused on the seismic fragility of structures under multiple hazards [11,58,59,60,61]. In this work, we focus on the fragility of strengthened corroded bridges under mainshock and aftershock sequences. Equation (2) is the fragility function of a corroded structure,
P ( C < D ) | P G A = Φ ( ln x ln σ c ξ c )
where σ c and ξ c are functions of the corrosion ratio η m .
The fragility function for a corroded structure reinforced by steel plates is a function of the ground-motion intensity, corrosion level, and thickness (th) of the bonded steel plates as in Equation (3).
P ( C < D ) | P G A = Φ ( ln x ln σ c , t h ξ c , t h )
where σ c , t h and ξ c , t h are functions of the corrosion ratio η m and the thickness of the steel plates, respectively. For a specific corrosion level, σ c , t h and ξ c , t h can be calculated using the maximum likelihood method as in [62]. In [4], a time-variant quadratic model is used to estimate the mean and standard deviation at different years, and the concept is borrowed in this work for a thickness-variant quadratic model. By calculating σ c , t h and ξ c , t h at different th values, fitting equations for σ c , t h and ξ c , t h can be obtained using the least-squares method. The fragility curves for any expected thickness of the strengthened steel plates at a specific corrosion level can be calculated as shown in Equation (6):
σ c , t h = p 1 t h 2 + p 2 t h + p 3
ξ c , t h = p 4 t h 2 + p 5 t h + p 6
P ( C < D ) | P G A = Φ ( ln x ln ( p 1 t h 2 + p 2 t h + p 3 ) p 4 t h 2 + p 5 t h + p 6 )
where p 1 , p 2 , and p 3 are the coefficients for σ c , t h at a specific corrosion ratio; p 4 , p 5 , and p 6 are the coefficients for ξ c , t h at a specific corrosion ratio. For a specific corrosion level, the σ c , t h and ξ c , t h of the structure reinforced by steel plates of different thicknesses were calculated. A least-squares fitting method was used to calculate σ c , t h and ξ c , t h at any expected thickness of the steel plates. Thereafter, using Equation (6), the fragility curves and surface at any expected thickness of the steel plate can be calculated efficiently without performing nonlinear dynamics a second time.

3. Multiple Hazards: Corrosion and Mainshock—Aftershock Sequences

3.1. Corrosion

Previous studies have shown that pitting and uniform corrosion are two types of corrosion in engineering, and both significantly affect the mechanical properties of steel bars. For pitting corrosion, the corroded bar yield stress, ultimate stress, Young’s modulus, and ultimate strain can be expressed by Equation (7) [3]:
{ f y c = ( 1 1.98 η m ) f y f u c = ( 1 1.57 η m ) f u E s c = ( 1 1.15 η m ) E s s δ c = ( 1 2.59 η m ) δ s
where f y c , f u c , E s c , and δ c denote the yield stress, ultimate stress, Young’s modulus, and ultimate strain of the corroded bar, respectively. f y , f u , E s , and δ s are the yield stress, ultimate stress, Young’s modulus, and ultimate strain of a pristine bar, respectively. For uniform corrosion, the bar yield strength, ultimate strength, Young’s modulus, and ultimate strain are expressed in Equation (8):
{ f y c = ( 1 1.24 η m ) f y f u c = ( 1 1.07 η m ) f u E s c = ( 1 0.75 η m ) E s s δ c = ( 1 1.95 η m ) δ s
The parameters in Equation (8) have the same meaning as those in Equation (7). It is worth mentioning that for a bridge existing in a marine environment, the structure may be damaged severely if the corrosion ratio reaches a high value, and some maintenance measurements will be adopted. In order to consider a realistic view, the maximum corrosion ratio is set as 20% in this work.

3.2. Mainshock–Aftershock Sequences

In this study, 60 MAS downloaded from [63] were used for nonlinear dynamic analysis as listed in Table 1. Usually, two methods are used to generate MAS. One is a synthesis method, and the other uses MAS recorded in a real earthquake event. Thus far, no scientific methods have been developed to determine the magnitude of the aftershocks behind the mainshock and their intensity. To obtain a more realistic view, the second method was employed in this study. The MAS was recorded during the same earthquake event and at the same station. The maximum aftershock among the recorded aftershocks was combined with the mainshock to form one ground-motion sequence for simplification, the time gap between the mainshock and aftershock was also considered and set to 20 s in this study. The intensity of the mainshock in this work was scaled from 0.2 g to 2.0 g with an increment of 0.2 g for increment dynamic analysis [64,65]; the scale factor for the aftershock was the same as that of the mainshock to maintain their original intensity relationship.

4. Bridge Model and Uncertainty

A two-span continuous reinforced-concrete bridge was selected in order to evaluate its performance before and after strengthening. The total length of the bridge was 60 m, the height of the bridge column was 9 m, and its diameter was 1.6 m. The longitudinal steel bar area ratio of the bridge column was approximately 1.42%, and the circular hoop bar volume ratio was approximately 0.27%. The pile length and diameter were 20.0 m and 1.6 m, respectively. The details of the bridge model before and after the reinforcement are shown in Figure 1a,b. In this study, steel plates were pasted around the surface of the bridge piers, as shown in Figure 1b. In order to evaluate the performance of the bridge under different reinforcement cases, the thicknesses of the steel plates were set ranging from 1 mm to 5 mm, with an incremental value of 1 mm.
OpenSees [66] was used in this study to create a finite-element model of the bridge. The beam of the superstructure was simulated using elastic elements as the beam was designed as the protective component, and the bridge columns were simulated using a displacement-based beam–column element in OpenSees [67]. The stress–strain model of the confined concrete was calculated using Mander’s model [68]. The corrosion of the circular hoop bars affects the mechanical properties of the confined concrete, which were also considered in this study. For different corrosion levels, the corresponding yield strength and Young’s modulus for hoop bars were calculated first and then used to calculate the properties of confined concrete using Mander’s model. The strength of the confined concrete decreases with an increase in the corrosion ratio. Springs in different directions (horizontal: p–y, vertical: q–z, and t–z) were used to simulate the soil layer around the pile foundations, as presented in Figure 1b. Figure 1b shows three groups of springs. The stiffness of the soil springs was calculated using the equations from the American Petroleum Institute (1989) [69].
In this study, the uncertainty of the ground motions and materials was considered using the Latin hypercube sampling method. The sample size was set to 60, which was the same as the number of ground-motion sequences. The concrete compressive strength (which follows a normal distribution) had a mean of 31.0 MPa, and its standard deviation was 6.2 MPa; the mean strength of the steel bar was 336.2 MPa, and its standard deviation was 36 MPa, following a lognormal distribution [70]. The yield strength of the steel plate was 345 MPa, and its Young’s modulus was 2.06 × 10⁵ MPa. Nonlinear dynamic analysis was conducted after the finite element model of the bridge was created, and the displacement at the top of the bridge piers was recorded for each case. Subsequently, the displacement was transformed into the ductility demand ( μ Δ ) to determine the damaged state of the bridge. To judge the failure of the bridge, we defined four damage states according to HAZUS-MH/MR3 (FEMA 2007) [71]: slight damage 1 < μ Δ 2.5 , moderate damage 2.5 < μ Δ 4.0 , major damage 4.0 < μ Δ 7.0 , and collapse μ Δ > 7.0 . Note that the corrosion levels and thickness of the steel plates affect the threshold value for different damage states. In the nonlinear dynamic analysis, the uncertainties of the materials were considered, which also affected the damage to the bridge system and threshold value. For consistency and simplification, an average threshold value was used for different scenarios of corrosion levels and thickness of steel plates for different damage states to judge the damage to the bridge system. This simplification does not affect the results in this work, because the nonlinear behavior of bridge systems with different corrosion and thickness of steel plates (such as yield displacement) was considered using real values.

5. Results

5.1. Cyclic Pushover

In this study, the effects of pitting and uniform corrosion of longitudinal and hoop circular bars on the cyclic behavior of a bridge pier reinforced with steel plates of different thicknesses were investigated through cyclic pushover analysis. Figure 2 shows the force-displacement curves for bridge piers with different pitting corrosion ratios: (a) 0 and (b) 5% corrosion. Figure 2 clearly shows that the corrosion of the steel bars significantly reduces the ultimate capacity of the bridge pier. For example, the peak force for the pristine bridge pier was 1321.8 kN, and that of the bridge pier with a 5% corrosion ratio was 1257.7 kN, which represents a decrease of approximately 4.8%. For other corrosion levels, the hysteretic curves could also be calculated by applying the same procedure.
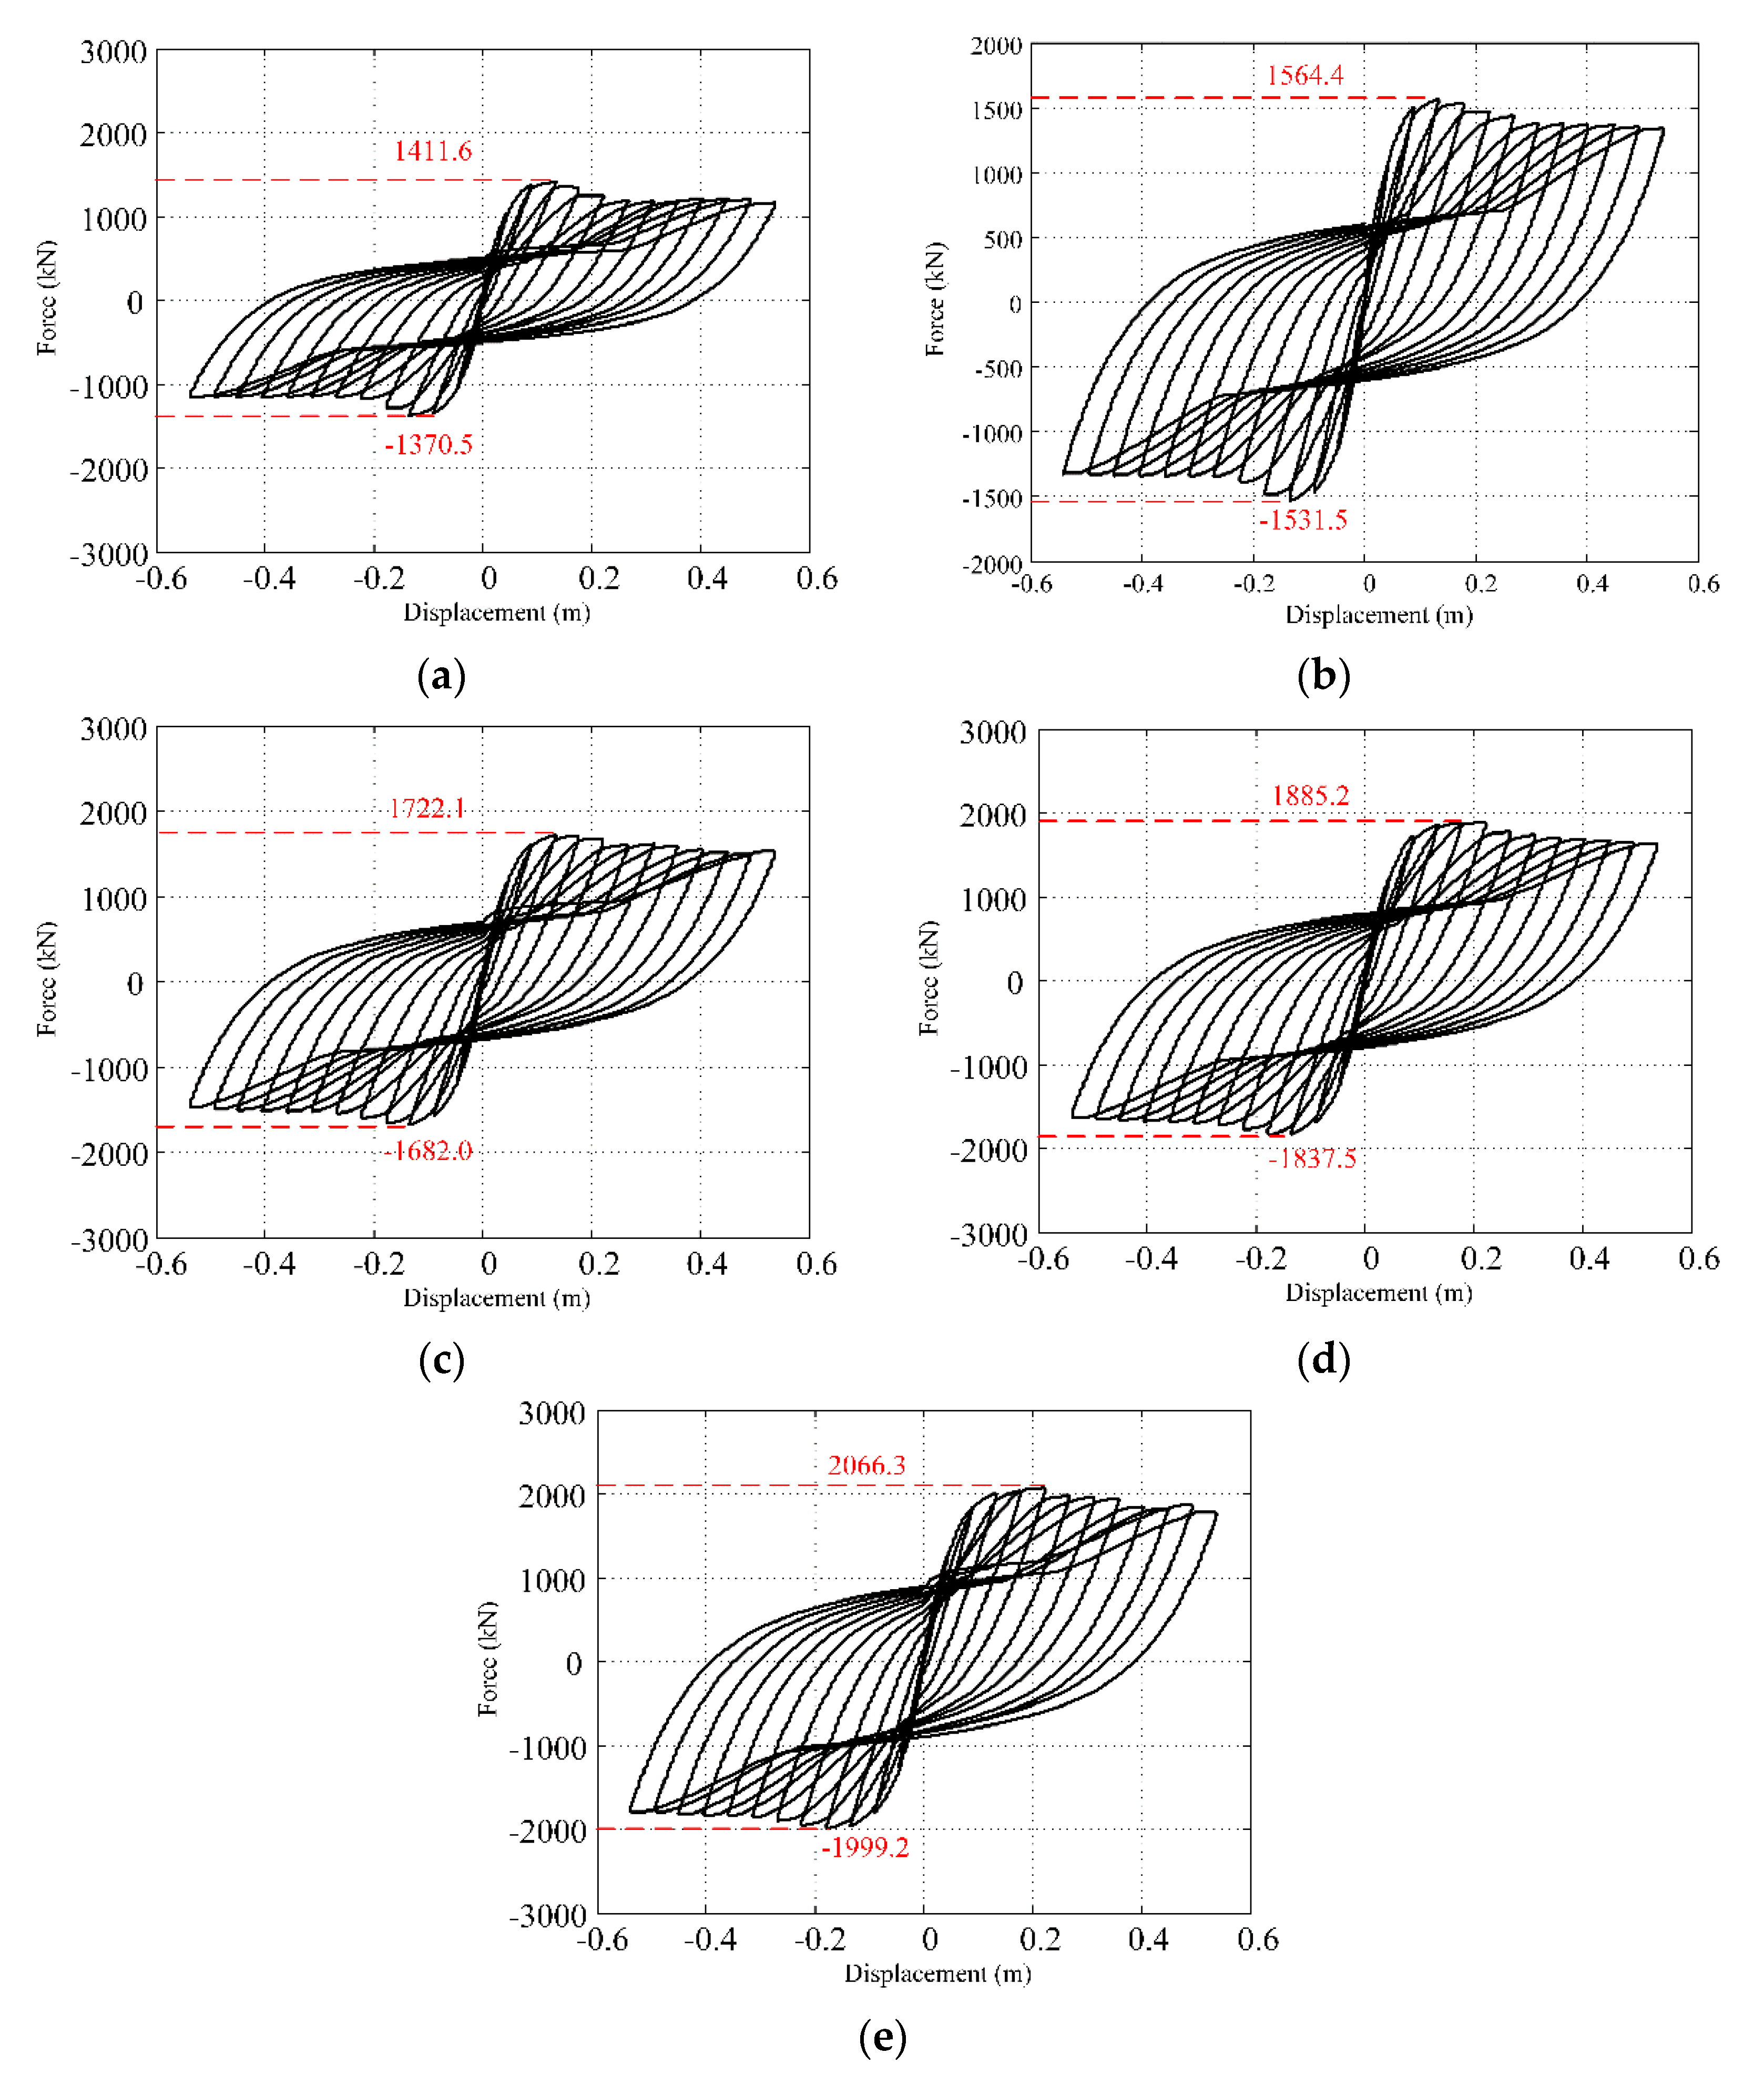
Steel plates were used to strengthen the corroded bridge pier, and hysteretic curves of the bridge pier after reinforcement were created corresponding to steel plates of different thicknesses. Figure 3 shows the hysteretic curves of the corroded bridge pier with a 5% pitting corrosion ratio reinforced by 1 mm, 2 mm, 3 mm, 4 mm, and 5 mm steel plates. Figure 3 shows that with an increase in the steel plate thickness, the carrying capacity of the bridge pier increases significantly. For other corrosion ratios (10–20%), hysteretic curves can also be obtained. For simplification, in this work, only the hysteretic curves corresponding to 5% corrosion for reinforcement by steel plates with thicknesses ranging from 1 to 5 mm are presented. From Figure 3, it can be observed that, with an increase in the number of steel plates, the bridge has a significantly greater capacity to absorb energy.
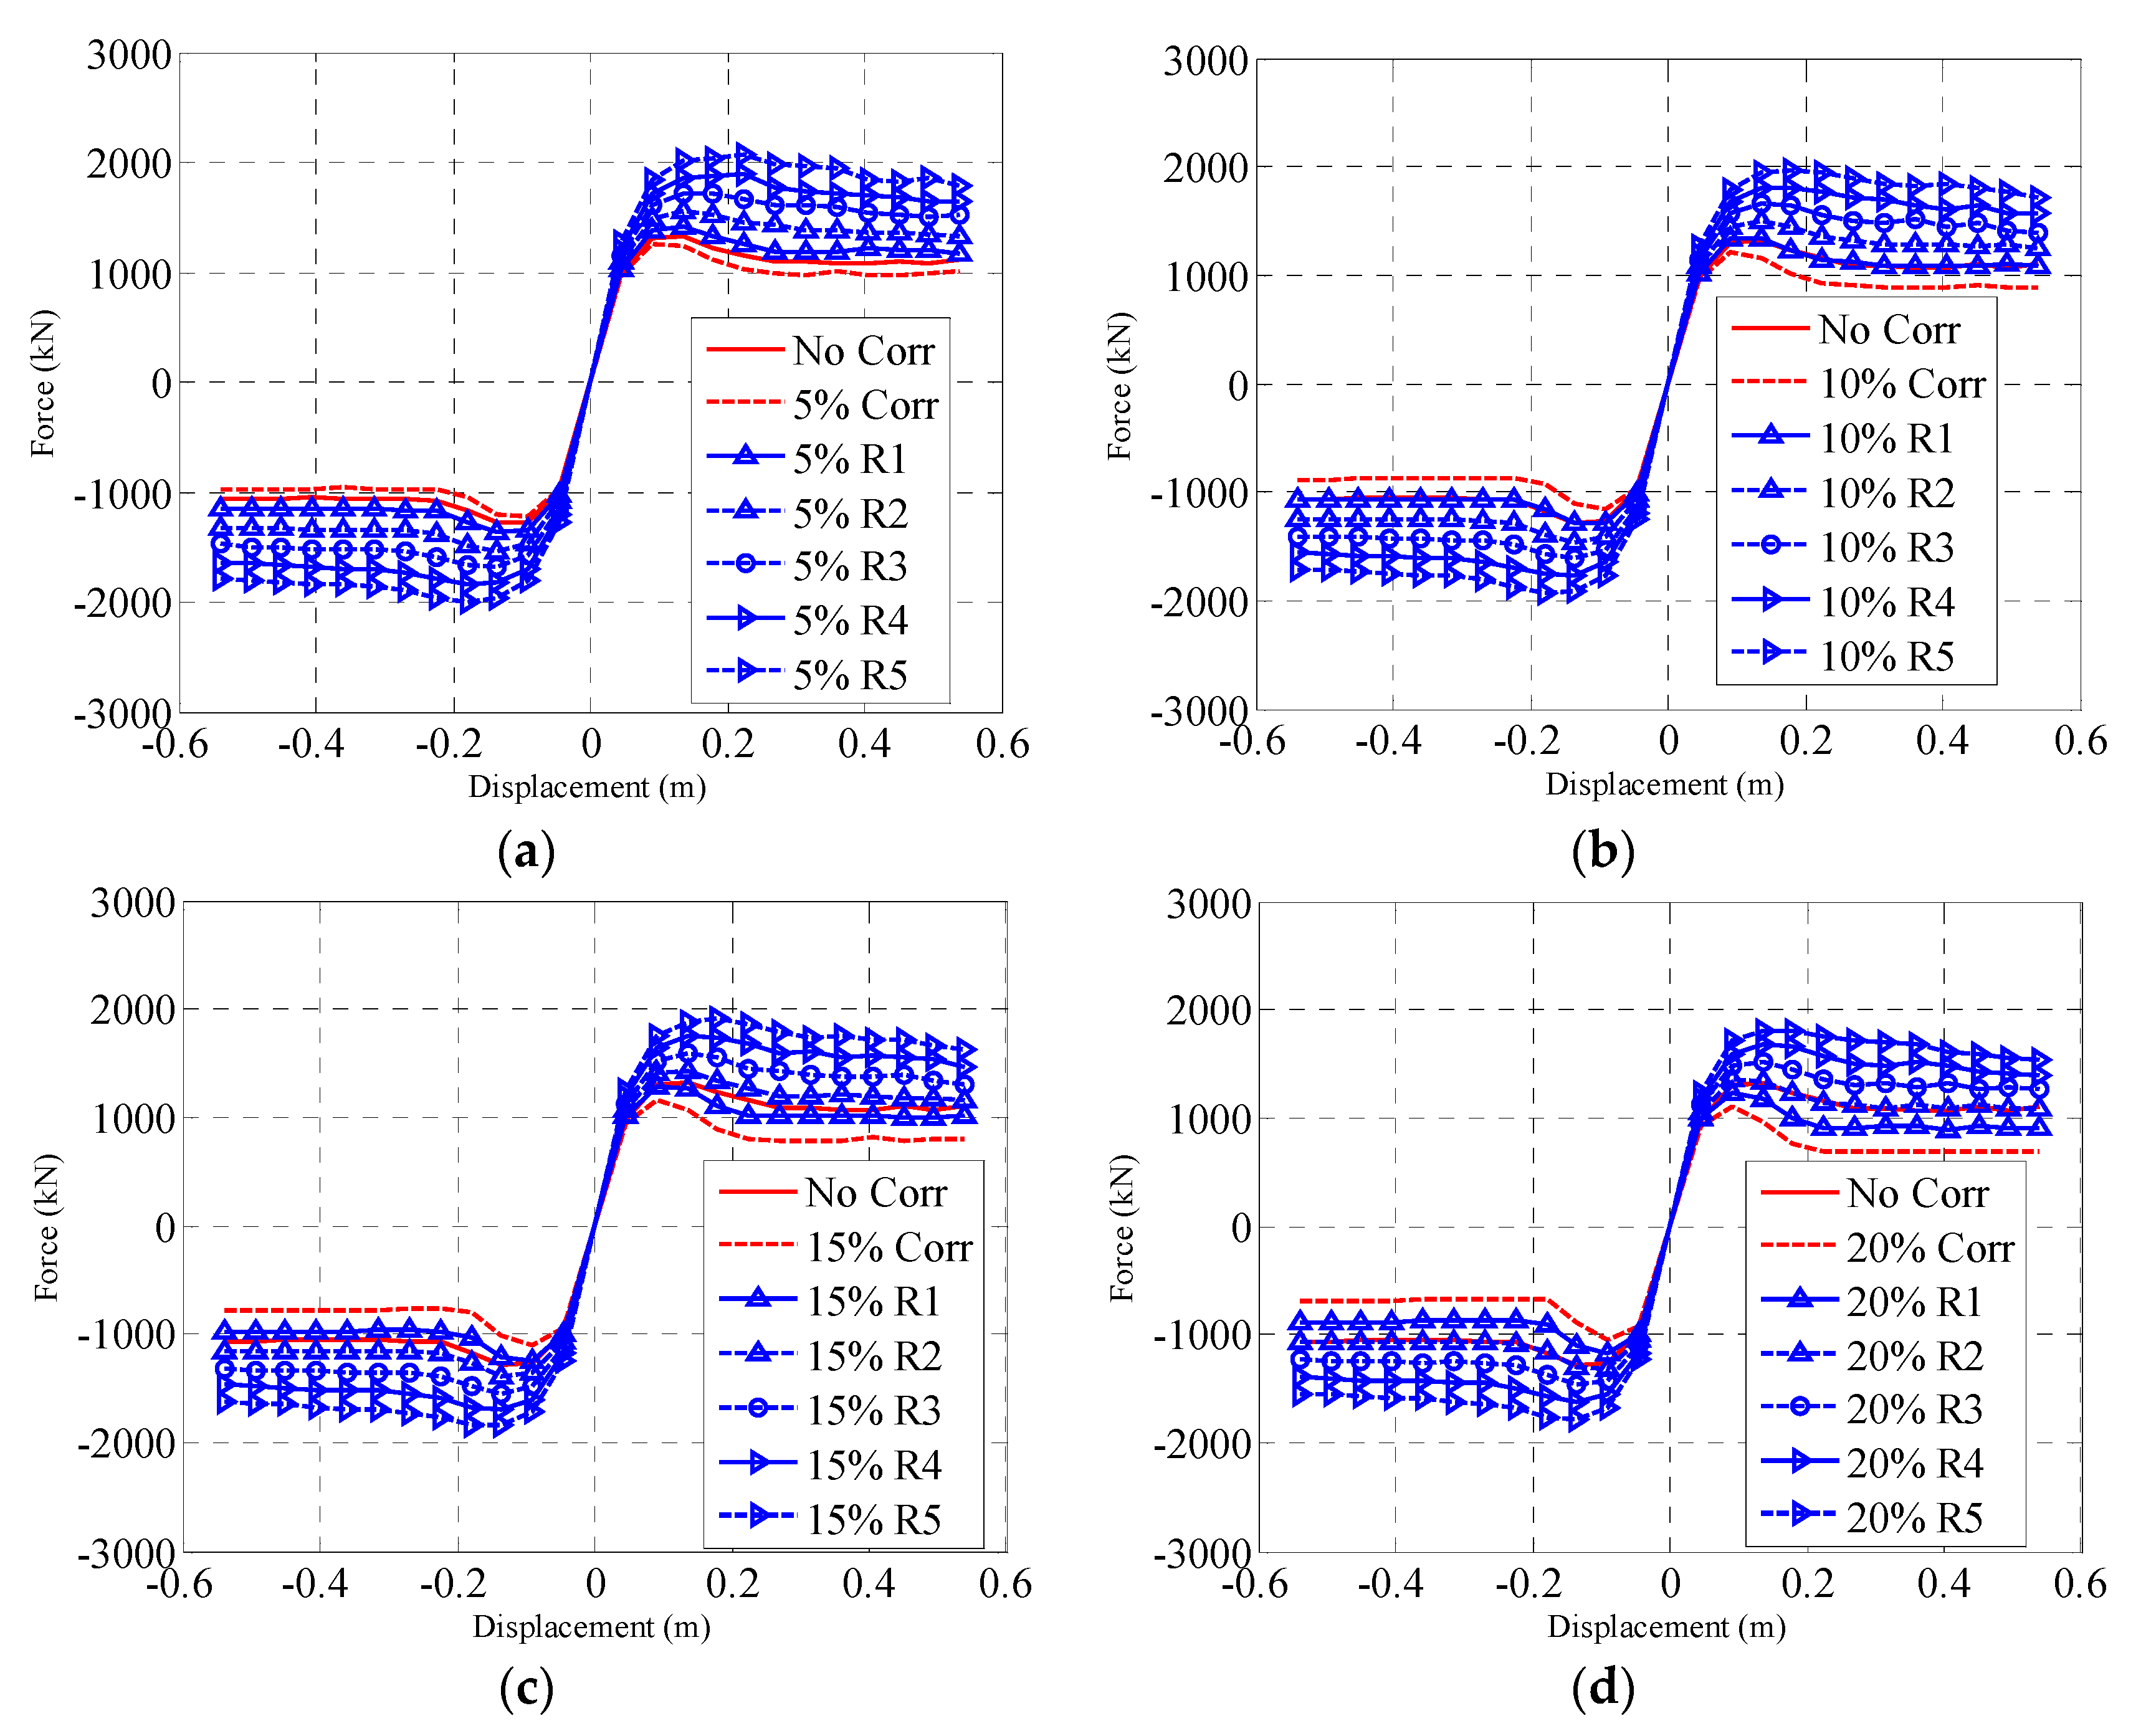
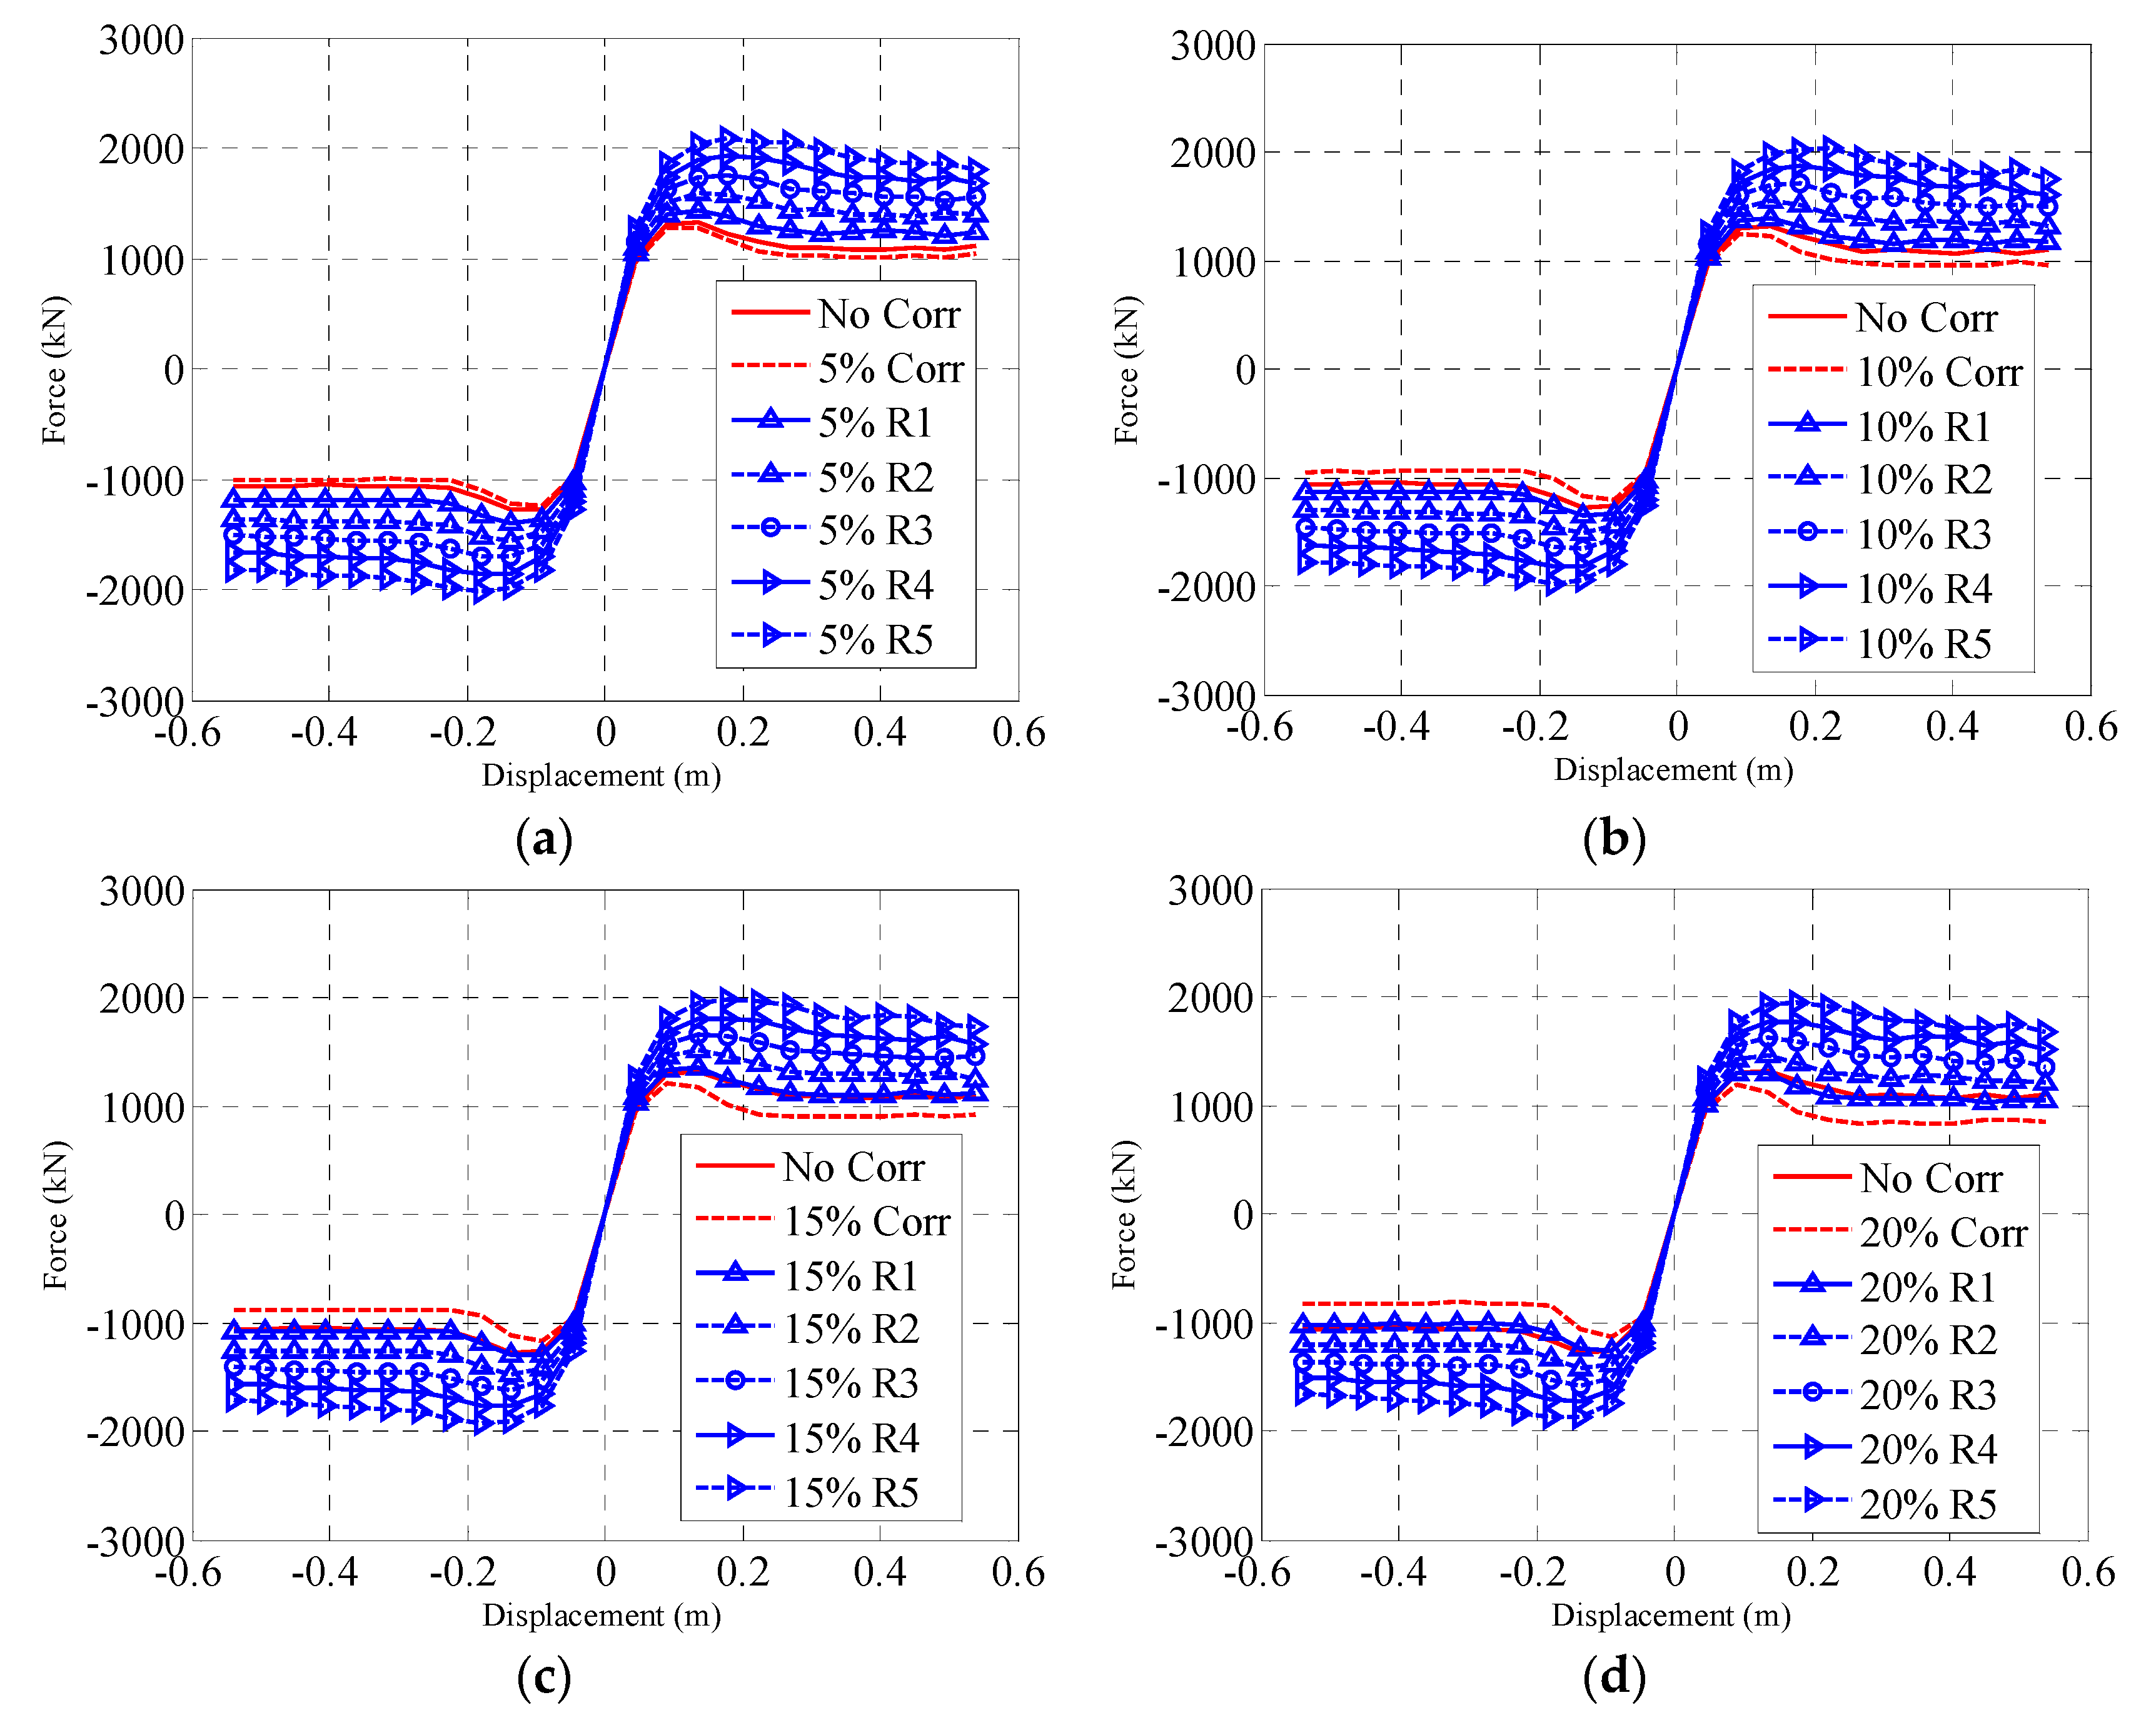
Based on Figure 2 and Figure 3, the skeleton curves for different reinforcement cases corresponding to different corrosion ratios were obtained, as shown in Figure 4 (pitting corrosion) and Figure 5 (uniform corrosion). For pitting corrosion, Figure 4 clearly shows that regarding corrosion level, the load-carrying capacity of the reinforced bridge pier increases with the thickness of the steel plates. However, the thickness of the steel plates that is necessary for the capacity of the reinforced bridge pier to be restored or exceed its original level is determined by the corrosion severity. Generally, a thicker steel plate is required for increased corrosion levels. The same conclusion can be drawn for a bridge pier with uniform corrosion. However, the results imply that pitting corrosion causes more severe damage than uniform corrosion does. Therefore, for the same corrosion level, thicker steel plates are required in the reinforcement for pitting corrosion piers.
Based on the skeleton curves, the peak forces were extracted and are listed in Table 2, Table 3, Table 4 and Table 5. For example, Table 2 lists the peak force for a bridge pier with 5% corrosion, reinforced by steel plates of different thicknesses. The peak force is 1321.8 kN for no corrosion, and that of the bridge with 5% corrosion is 1257.7 kN; the peak force reduces by approximately 4.85%. Table 2, Table 3, Table 4 and Table 5 list the peak force ratios for the bridge pier before and after the reinforcement. A negative value in the table indicates that the peak force is smaller than its original state, while a positive value implies that the capacity of the reinforced bridge pier is greater. From Table 2, Table 3, Table 4 and Table 5, it can be concluded that uniform corrosion has a smaller effect on the capacity of the bridge pier compared to that of the bridge pier with pitting corrosion. For example, the peak force of the bridge pier without reinforcement is about 1257.7 kN for pitting corrosion with a corrosion level of 5%, and the peak force of the bridge pier is about 1275.9 kN for uniform corrosion with the same corrosion ratio without reinforcement, which is about 1.5% greater than that of the pitting corrosion. From Table 2, Table 3, Table 4 and Table 5, it can also be concluded that with an increased corrosion ratio, the peak force for pitting corrosion decreases more. For a corrosion ratio of 5%, the peak force is about 3% smaller than that of uniform corrosion for each case; for the corrosion ratio of 20%, the peak force for pitting corrosion is about 10% smaller than that of the uniform corrosion for each case.

5.2. Fragility Curves

In the previous section, a cyclic pushover analysis was performed to evaluate the cyclic behavior of a reinforced bridge pier with pitting and uniform corrosion. In particular, we only show the fragility curves of the bridge system with pitting corrosion and a corrosion ratio of 20%. The fragility curves under uniform corrosion and pitting corrosion at other corrosion levels were calculated using the same procedure.
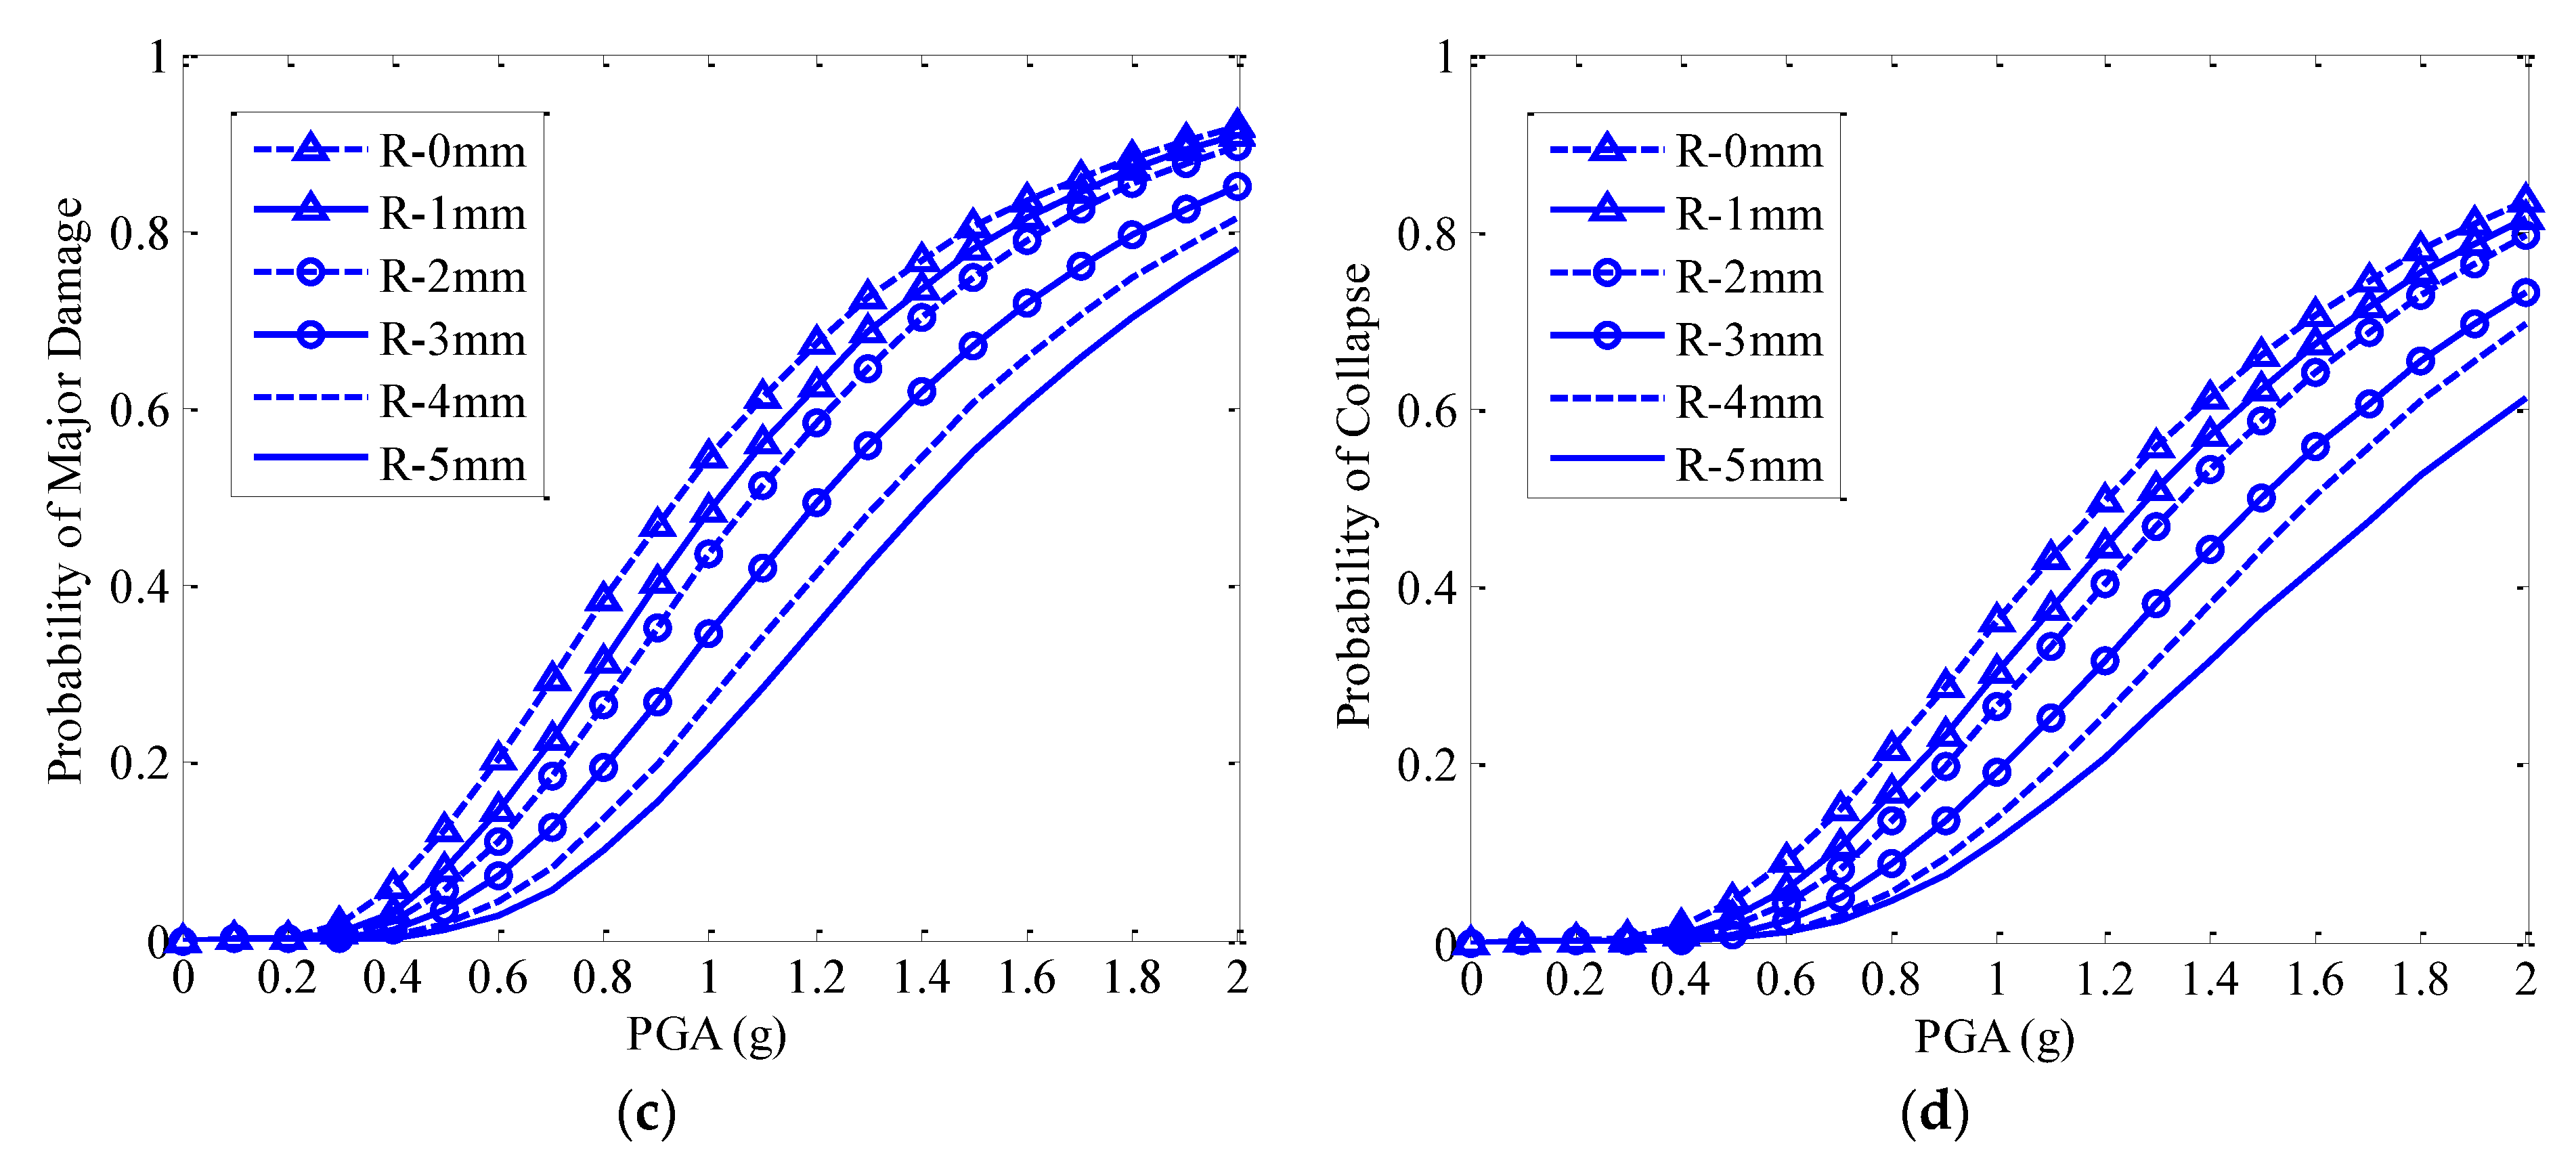
Based on Equation (3), the probability of failure of the bridge system with a corrosion ratio of 20% was calculated, as presented in Figure 6. Figure 6a indicates that with the increased thickness of the steel plates, the probability of slight damage decreases when the intensity of the mainshock is greater than 0.1 g. However, with the increased thickness of the steel plates, the probability of slight damage decreases slowly when the ground-motion intensity is larger than 1.0 g, and the probability of slight damage almost reaches 1.0 at a larger intensity of ground motion in any scenario. Therefore, the reinforced steel plates are effective in reducing slight damage when the intensity of the ground motion is between 0.1 g and 1.0 g. For the moderate damage state, the same trend can also be found, as shown in Figure 6b. The probability of failure decreased with the thickness of the steel plates when the ground-motion intensity was larger than 0.3 g. The probability of moderate damage increased sharply when ground motions were greater than 0.3 g and smaller than 1.1 g for each case. Figure 6c implies that the probability of major damage decreases with an increase in the thickness of the steel plates. For example, the probability of major damage is approximately 40% for a bridge with 20% corrosion when the ground-motion intensity is 0.8 g, and that of the bridge reinforced by 5 mm steel plates is only approximately 7% under the same intensity of ground motion. Therefore, bonded steel plates are useful for corroded bridge systems to resist mainshock–aftershock sequences. Figure 6d shows that with the increased thickness of the steel plates, the probability of collapse decreases significantly if the intensity of the ground motion is larger than 0.5 g. For example, for an underground motion intensity of 0.8 g, the probability of collapse for the bridge structure with a 20% pitting corrosion ratio is approximately 20%, which is approximately four times that of the bridge structure reinforced with 5 mm steel plates. The findings indicate that steel plates are significantly effective for a bridge system to resist earthquake-load-induced structural collapse. In addition, Figure 6d indicates that the threshold value of the ground-motion intensity that causes collapse increases with the thickness of the steel plates. Therefore, bonded steel plates are useful for enhancing the structural capacity, and reducing the vulnerability of civil structures subjected to mainshock–aftershock sequences.

6. Discussion and Conclusions

6.1. Discussion

Cyclic pushover and seismic fragility analyses were performed to investigate a corroded bridge system reinforced by steel plates under mainshock–aftershock sequences; meaningful results were obtained. The findings in this work can be used to guide the design of reinforcements by selecting the rational thickness of steel plates to enhance the structural capacity. In addition, through the proposed framework, the failure probability of a corroded structure reinforced by steel plates under mainshock–aftershock sequences can be calculated efficiently. In this work, steel plates with different thicknesses were used for the reinforcement; this work aimed to use a minimum thickness steel plate that could cover the decreased capacity of the bridge pier induced by corrosion, and thus steel plates with thicknesses of 1~5 mm were utilized. In reality, other than the five kinds of steel plates mentioned, thicker steel plates can also be used for reinforcement.
Through cyclic pushover analysis, it can be observed by comparing the skeleton curves that pitting corrosion had a large and significant influence on the structural capacity of the bridge pier. At the same corrosion level, the capacity of the bridge pier with pitting corrosion was less than that of the bridge pier with uniform corrosion. Therefore, structures with pitting corrosion are prone to vulnerability to natural hazards, such as earthquake loads. In this study, pitting corrosion was simulated by reducing the mechanical properties of the steel bars using the model proposed by Lee and Cho [3]. In future research, we suggest creating a solid model to simulate pitting corrosion and investigate its impact on the performance of the structures. For simplification, in this study, we only show the fragility curves for pitting corrosion with a 20% corrosion ratio; the probability of failure at other corrosion levels for pitting or uniform corrosion of the bridge before and after reinforcement can be calculated using the same framework. There are many kinds of bridges constructed worldwide, such as arch bridges, cable-stayed bridges, or suspension bridges. In this work, a two-span-RC bridge was used as an example bridge to evaluate its failure probability under both corrosion and mainshock–aftershock sequences. For future research, it is suggested that more types of bridges in the marine environment are assessed.

6.2. Conclusions

The behavior of a corroded pile foundation-supported bridge before and after reinforcement under mainshock–aftershock sequences was studied through cyclic pushover and seismic fragility analyses, in which the effects of both pitting and uniform corrosion were considered. In the cyclic pushover analysis, the skeleton curves corresponding to different corrosion levels and reinforcement cases were calculated. The skeleton curves indicated that both types of corrosion significantly induced degradation in the structural capacity of a bridge pier, which makes the structure more prone to vulnerability when it is simultaneously subjected to other natural hazards. The bonding of steel plates is efficient in enhancing the structural capacity of bridge piers. For example, for 20% pitting corrosion, the load-carrying capacity can reach its initial level only when the thickness is greater than 3 mm. Compared to uniform corrosion, pitting corrosion induces a larger degradation in the structural capacity for the same corrosion level. The fragility curves revealed that the probability of failure decreases with an increase in the thickness of the steel plates when the intensity of the mainshock–aftershock is greater than a threshold value. For each damage state, the threshold value increased with the thickness of the steel plate, particularly for a more severe damage state.

Author Contributions

Conceptualization, A.K. and X.G.; Methodology, X.C., L.C., H.S. and X.G.; Investigation, X.C. and A.K.; Writing—review & editing, X.C., L.C. and H.S.; Funding acquisition, X.G. All authors have read and agreed to the published version of the manuscript.

Funding

The authors are thankful for support from the National Natural Science Foundation of China with grant number 51708484, via the Qing Lan project of Yangzhou University.

Institutional Review Board Statement

Not applicable.

Informed Consent Statement

Not applicable.

Data Availability Statement

The data can be obtained from the authors on request.

Conflicts of Interest

The authors declare no conflict of interest.

References

  1. Almusallam, A.A. Effect of degree of corrosion on the properties of reinforcing steel bars. Constr. Build. Mater. 2001, 15, 361–368. [Google Scholar] [CrossRef]
  2. Apostolopoulos, C.A.; Papadakis, V.G. Consequences of steel corrosion on the ductility properties of reinforcement bar. Constr. Build. Mater. 2008, 22, 2316–2324. [Google Scholar] [CrossRef]
  3. Lee, H.-S.; Cho, Y.-S. Evaluation of the mechanical properties of steel reinforcement embedded in concrete specimen as a function of the degree of reinforcement corrosion. Int. J. Fract. 2009, 157, 81–88. [Google Scholar] [CrossRef]
  4. Ghosh, J.; Padgett, J.E. Aging Considerations in the Development of Time-Dependent Seismic Fragility Curves. Eng. Struct. 2010, 136, 1497–1511. [Google Scholar] [CrossRef]
  5. Simon, J.; Bracci, J.M.; Gardoni, P. Seismic Response and Fragility of Deteriorated Reinforced Concrete Bridges. Eng. Struct. 2010, 136, 1273–1281. [Google Scholar] [CrossRef]
  6. Stewart, M.G. Spatial variability of pitting corrosion and its influence on structural fragility and reliability of RC beams in flexure. Struct. Saf. 2004, 26, 453–470. [Google Scholar] [CrossRef]
  7. Stewart, M.G.; Al-Harthy, A. Pitting corrosion and structural reliability of corroding RC structures: Experimental data and probabilistic analysis. Reliab. Eng. Syst. Saf. 2008, 93, 373–382. [Google Scholar] [CrossRef]
  8. Choe, D.-E.; Gardoni, P.; Rosowsky, D.; Haukaas, T. Probabilistic capacity models and seismic fragility estimates for RC columns subject to corrosion. Reliab. Eng. Syst. Saf. 2008, 93, 383–393. [Google Scholar] [CrossRef]
  9. Choe, D.-E.; Gardoni, P.; Rosowsky, D.; Haukaas, T. Seismic fragility estimates for reinforced concrete bridges subject to corrosion. Struct. Saf. 2009, 31, 275–283. [Google Scholar] [CrossRef]
  10. Choe, D.E.; Gardoni, P.; Rosowsky, D. Fragility increment functions for deteriorating reinforced concrete bridge columns. J. Eng. Mech. 2010, 136, 969–978. [Google Scholar] [CrossRef]
  11. Alipour, A.; Shafei, B.; Shinozuka, M.S. Capacity loss evaluation of reinforced concrete bridges located in extreme chloride-laden environments. Struct. Infrastruct. Eng. 2013, 9, 8–27. [Google Scholar] [CrossRef]
  12. Guo, A.; Li, H.; Ba, X.; Guan, X.; Li, H. Experimental investigation on the cyclic performance of reinforced concrete piers with chloride-induced corrosion in marine environment. Eng. Struct. 2015, 105, 1–11. [Google Scholar] [CrossRef]
  13. Rao, A.S.; Lepech, M.D.; Kiremidjian, A. Development of time-dependent fragility functions for deteriorating rein-forced concrete bridge piers. Struct. Infrastruct. Eng. 2017, 13, 67–83. [Google Scholar] [CrossRef]
  14. Jiang, C.; Wu, Y.-F.; Dai, M.-J. Degradation of steel-to-concrete bond due to corrosion. Constr. Build. Mater. 2018, 158, 1073–1080. [Google Scholar] [CrossRef]
  15. Wu, W.; He, X.; He, L.; Wu, C.; Zhu, A. Joints Fatigue Damage Prediction for a Steel Truss Suspension Bridge Considering Corrosion Environment. Arab. J. Sci. Eng. 2022, 47, 4879–4892. [Google Scholar] [CrossRef]
  16. Milone, A.; Landolfo, R. A Simplified Approach for the Corrosion Fatigue Assessment of Steel Structures in Aggressive Environments. Materials 2022, 15, 2210. [Google Scholar] [CrossRef]
  17. Yanez-Borjas, J.J.; Valtierra-Rodriguez, M.; Camarena-Martinez, D.; Amezquita-Sanchez, J.P. Statistical time features for global corrosion assessment in a truss bridge from vibration signals. Measurement 2020, 160, 107858. [Google Scholar] [CrossRef]
  18. Milone, A.; Landolfo, R.; Berto, F. Methodologies for the fatigue assessment of corroded wire ropes: A state-of-the-art review. Structures 2022, 37, 787–794. [Google Scholar] [CrossRef]
  19. Li, L.; Mahmoodian, M.; Li, C.Q. Prediction of fatigue failure of corrosion affected riveted connections in steel structures. Struct. Infrastruct. Eng. 2020, 16, 1524–1538. [Google Scholar] [CrossRef]
  20. Cao, X.-Y.; Feng, D.-C.; Wang, Z.; Wu, G. Parametric investigation of the assembled bolt-connected buckling-restrained brace and performance evaluation of its application into structural retrofit. J. Build. Eng. 2022, 48, 103988. [Google Scholar] [CrossRef]
  21. Ghernouti, Y.; Li, A.; Rabehi, B. Effectiveness of repair on damaged concrete columns by using fiber-reinforced polymer composite and increasing concrete section. J. Reinf. Plast. Compos. 2012, 31, 1616–1629. [Google Scholar] [CrossRef]
  22. El-Ariss, B. Stiffness of reinforced concrete beams with external tendons. Eng. Struct. 2004, 26, 2047–2051. [Google Scholar] [CrossRef]
  23. Chen, S.; Gu, P. Load carrying capacity of composite beams prestressed with external tendons under positive moment. J. Constr. Steel Res. 2005, 61, 515–530. [Google Scholar] [CrossRef]
  24. Tan, K.H.; Tjandra, R.A. Strengthening of RC Continuous Beams by External Prestressing. J. Struct. Eng. 2007, 133, 195–204. [Google Scholar] [CrossRef]
  25. Manisekar, R.; Sivakumar, P.; Lakshmikandhan, K.N. Experimental investigations on strengthening of RC beams by external prestressing. Asian J. Civ. Eng. 2014, 15, 350–363. [Google Scholar]
  26. Darwish, M.N.; Subedi, N.K.; Baglin, P.S. External Plate Reinforcement for Concrete Beams. J. Struct. Eng. 1999, 125, 1455–1456. [Google Scholar] [CrossRef]
  27. Su, R.; Zhu, Y. Experimental and numerical studies of external steel plate strengthened reinforced concrete coupling beams. Eng. Struct. 2005, 27, 1537–1550. [Google Scholar] [CrossRef] [Green Version]
  28. Li, Y.F.; Sung, Y.Y. A study on the shear-failure of circular sectioned bridge column retrofitted by using CFRP jacketing. J. Reinf. Plast. Compos. 2004, 23, 811–830. [Google Scholar] [CrossRef]
  29. Li, J.; Gong, J.; Wang, L. Seismic behavior of corrosion-damaged reinforced concrete columns strengthened using combined carbon fiber-reinforced polymer and steel jacket. Constr. Build. Mater. 2009, 23, 2653–2663. [Google Scholar] [CrossRef]
  30. Kumutha, R.; Vaidyanathan, R.; Palanichamy, M.S. Behaviour of reinforced concrete rectangular columns strengthened using GFRP. Cem. Concr. Compos. 2007, 29, 609–615. [Google Scholar] [CrossRef]
  31. El-Mogy, M.; El-Ragaby, A.; El-Salakawy, E. Flexural Behavior of Continuous FRP-Reinforced Concrete Beams. J. Compos. Constr. 2010, 14, 669–680. [Google Scholar] [CrossRef]
  32. Agrawal, A.K.; Ghosn, M.; Alampalli, S.; Pan, Y. Seismic Fragility of Retrofitted Multispan Continuous Steel Bridges in New York. J. Bridg. Eng. 2012, 17, 562–575. [Google Scholar] [CrossRef]
  33. Cao, X.-Y.; Feng, D.-C.; Li, Y. Assessment of various seismic fragility analysis approaches for structures excited by non-stationary stochastic ground motions. Mech. Syst. Signal Process. 2023, 186, 109838. [Google Scholar] [CrossRef]
  34. Li, Y.; Song, R.; van de Lindt, J.W. Collapse Fragility of Steel Structures Subjected to Earthquake Mainshock-Aftershock Sequences. J. Struct. Eng. 2014, 140, 04014095. [Google Scholar] [CrossRef]
  35. Yin, Y.-J.; Li, Y. Loss Estimation of Light-Frame Wood Construction Subjected to Mainshock-Aftershock Sequences. J. Perform. Constr. Facil. 2011, 25, 504–513. [Google Scholar] [CrossRef]
  36. Song, R.; Li, Y.; van de Lindt, J.W. Impact of earthquake ground motion characteristics on collapse risk of post-mainshock buildings considering aftershocks. Eng. Struct. 2014, 81, 349–361. [Google Scholar] [CrossRef]
  37. Dong, Y.; Frangopol, D.M. Risk and resilience assessment of bridges under mainshock and aftershocks incorporating uncertainties. Eng. Struct. 2015, 83, 198–208. [Google Scholar] [CrossRef]
  38. Goda, K.; Salami, M.R. Inelastic seismic demand estimation of wood-frame houses subjected to mainshock-aftershock sequences. Bull. Earthq. Eng. 2014, 12, 855–874. [Google Scholar] [CrossRef]
  39. Nazari, N.; van de Lindt, W.; Li, Y. Effect of mainshock-aftershock sequences on wood frame building damage fragilities. J. Perform. Constr. Facil. 2015, 29, 04014036. [Google Scholar] [CrossRef]
  40. Raghunandan, M.; Liel, A.B.; Luco, N. Aftershock collapse vulnerability assessment of reinforced concrete frame structures. Earthq. Eng. Struct. Dyn. 2015, 44, 419–439. [Google Scholar] [CrossRef]
  41. Ruiz-García, J.; Aguilar, J.D. Aftershock seismic assessment taking into account postmainshock residual drifts. Earthq. Eng. Struct. Dyn. 2014, 44, 1391–1407. [Google Scholar] [CrossRef]
  42. Tesfamariam, S.; Goda, K.; Mondal, G. Seismic vulnerability of RC frame with unreinforced masonry infill due to mainshock-aftershock earthquake sequences. Earthq. Spectra 2015, 31, 1427–1449. [Google Scholar] [CrossRef]
  43. Zhai, C.H.; Zheng, Z.; Li, S.; Xie, L.L. Seismic analyses of a RCC building under mainshock–aftershock seismic sequences. Soil Dyn. Earthq. Eng. 2015, 74, 46–55. [Google Scholar] [CrossRef]
  44. Zhai, C.H.; Wen, W.P.; Li, S.; Xie, L.L. The ductility-based strength reduction factor for the mainshock–aftershock sequence-type ground motions. Bull. Earthq. Eng. 2015, 13, 2893–2914. [Google Scholar] [CrossRef]
  45. Burton, H.V.; Sreekumar, S.; Sharma, M.; Sun, H. Estimating aftershock collapse vulnerability using mainshock in-tensity, structural response and physical damage indicators. Struct. Saf. 2017, 68, 85–96. [Google Scholar] [CrossRef]
  46. Zhai, C.-H.; Zheng, Z.; Li, S.; Pan, X. Damage accumulation of a base-isolated RCC building under mainshock-aftershock seismic sequences. KSCE J. Civ. Eng. 2017, 21, 364–377. [Google Scholar] [CrossRef]
  47. AbdelNaby, A.E. Fragility Curves for RC Frames Subjected to Tohoku Mainshock-Aftershocks Sequences. J. Earthq. Eng. 2017, 22, 902–920. [Google Scholar] [CrossRef]
  48. Shokrabadi, M.; Burton, H.V. Risk-based assessment of aftershock and mainshock-aftershock seismic performance of reinforced concrete frames. Struct. Saf. 2018, 73, 64–74. [Google Scholar] [CrossRef]
  49. Zhang, P.; Kang, J.; Jinping, O. Damage and seismic performance analysis of RC frame structures under mainshock-aftershock earthquake sequences. Earthq. Eng. Eng. Dyn. 2014, 34, 1–8. [Google Scholar]
  50. Shinozuka, M.; Feng, M.Q.; Lee, J.; Naganuma, T. Statistical analysis of fragility curves. J. Eng. Mech. 2000, 126, 1224–1231. [Google Scholar] [CrossRef] [Green Version]
  51. Hwang, H.; Liu, J.B.; Chiu, Y.H. Seismic Fragility Analysis of Highway Bridges; Technical Report; Mid-America Earthquake Center: Urbana, IL, USA, 2001.
  52. Sasani, M.; Kiureghian, A.D. Seismic fragility of RC structural walls: Displacement approach. J. Struct. Eng. 2001, 127, 219–228. [Google Scholar] [CrossRef]
  53. Choi, E.; DesRoches, R.; Nielson, B. Seismic fragility of typical bridges in moderate seismic zones. Eng. Struct. 2004, 26, 187–199. [Google Scholar] [CrossRef]
  54. Nielson, B.G.; DesRoches, R. Seismic fragility methodology for highway bridges using a component level approach. Earthq. Eng. Struct. Dyn. 2006, 36, 823–839. [Google Scholar] [CrossRef]
  55. Nielson, B.G.; Desroches, R. Analytical Seismic Fragility Curves for Typical Bridges in the Central and Southeastern United States. Earthq. Spectra 2007, 23, 615–633. [Google Scholar] [CrossRef]
  56. Tekie, P.B.; Ellingwood, B.R. Seismic fragility assessment of concrete gravity dams. Earthq. Eng. Struct. Dyn. 2003, 32, 2221–2240. [Google Scholar] [CrossRef]
  57. Simon, J.; Vigh, L.G. Seismic fragility assessment of integral precast multi-span bridges in areas of moderate seismicity. Bull. Earthq. Eng. 2016, 14, 3125–3150. [Google Scholar] [CrossRef]
  58. Alipour, A.; Shafei, B.; Shinozuka, M. Reliability-based calibration of load and resistance factors for design of rc bridges under multiple extreme events: Scour and earthquake. J. Bridge Eng. 2013, 18, 362–371. [Google Scholar] [CrossRef]
  59. Guo, X.; Wu, Y.; Guo, Y. Time-dependent seismic fragility analysis of bridge systems under scour hazard and earthquake loads. Eng. Struct. 2016, 121, 52–60. [Google Scholar] [CrossRef]
  60. Guo, X.; Guo, Y. Probability of collapse of a bridge system under seismic and scour hazards. Proc. Inst. Mech. Eng. Part O J. Risk Reliab. 2016, 230, 195–203. [Google Scholar] [CrossRef]
  61. Cui, F.; Zhang, H.; Ghosn, M.; Xu, Y. Seismic fragility analysis of deteriorating RC bridge substructures subject to marine chloride-induced corrosion. Eng. Struct. 2018, 155, 61–72. [Google Scholar] [CrossRef]
  62. Baker, J.W. Efficient Analytical Fragility Function Fitting Using Dynamic Structural Analysis. Earthq. Spectra 2015, 31, 579–599. [Google Scholar] [CrossRef]
  63. Pacific Earthquake Engineering Research [PEER] Center. PEER Ground Motion Database. 2018. Available online: https://peer.berkely.edu/ (accessed on 10 November 2018).
  64. Vamvatsikos, D.; Cornell, C.A. Incremental dynamic analysis. Earthq. Eng. Struct. Dyn. 2002, 31, 491–514. [Google Scholar] [CrossRef]
  65. Vamvatsikos, D.; Cornell, C.A. Applied Incremental Dynamic Analysis. Earthq. Spectra 2004, 20, 523–553. [Google Scholar] [CrossRef]
  66. OpenSees. The Open System for Earthquake Engineering Simulation. 2014. Available online: http://opensees.berkeley.edu/ (accessed on 20 October 2022).
  67. Mazzoni, S.; McKenna, F.; Scott, M.H.; Fenves, G.L. OpenSees Command Language Manual; Pacific Earthquake Engineering Research Center: Berkeley, CA, USA, 2006.
  68. Mander, J.B.; Priestley, M.J.; Park, R. Theoretical stress–strain model for confined concrete. J. Struct. Eng. 1988, 114, 1804–1826. [Google Scholar] [CrossRef]
  69. American Petroleum Institute. Recommended Practice for Planning, Designing, and Constructing Fixed Offshore Platforms Volume 2; American Petroleum Institute: Washington, DC, USA, 1989. [Google Scholar]
  70. Jernigan, J.B.; Hwang, H.M. Inventory and Fragility Analysis of Memphis Bridges; Center for Earthquake Research and Information, University of Memphis: Memphis, TN, USA, 1997; p. 15.
  71. HAZUS-MH/MR3, The Federal Emergency Management Agency’s [FEMA] Methodology for Estimating Potential Losses from Disasters; U.S. Department of Homeland Security: Washington, DC, USA, 2007.
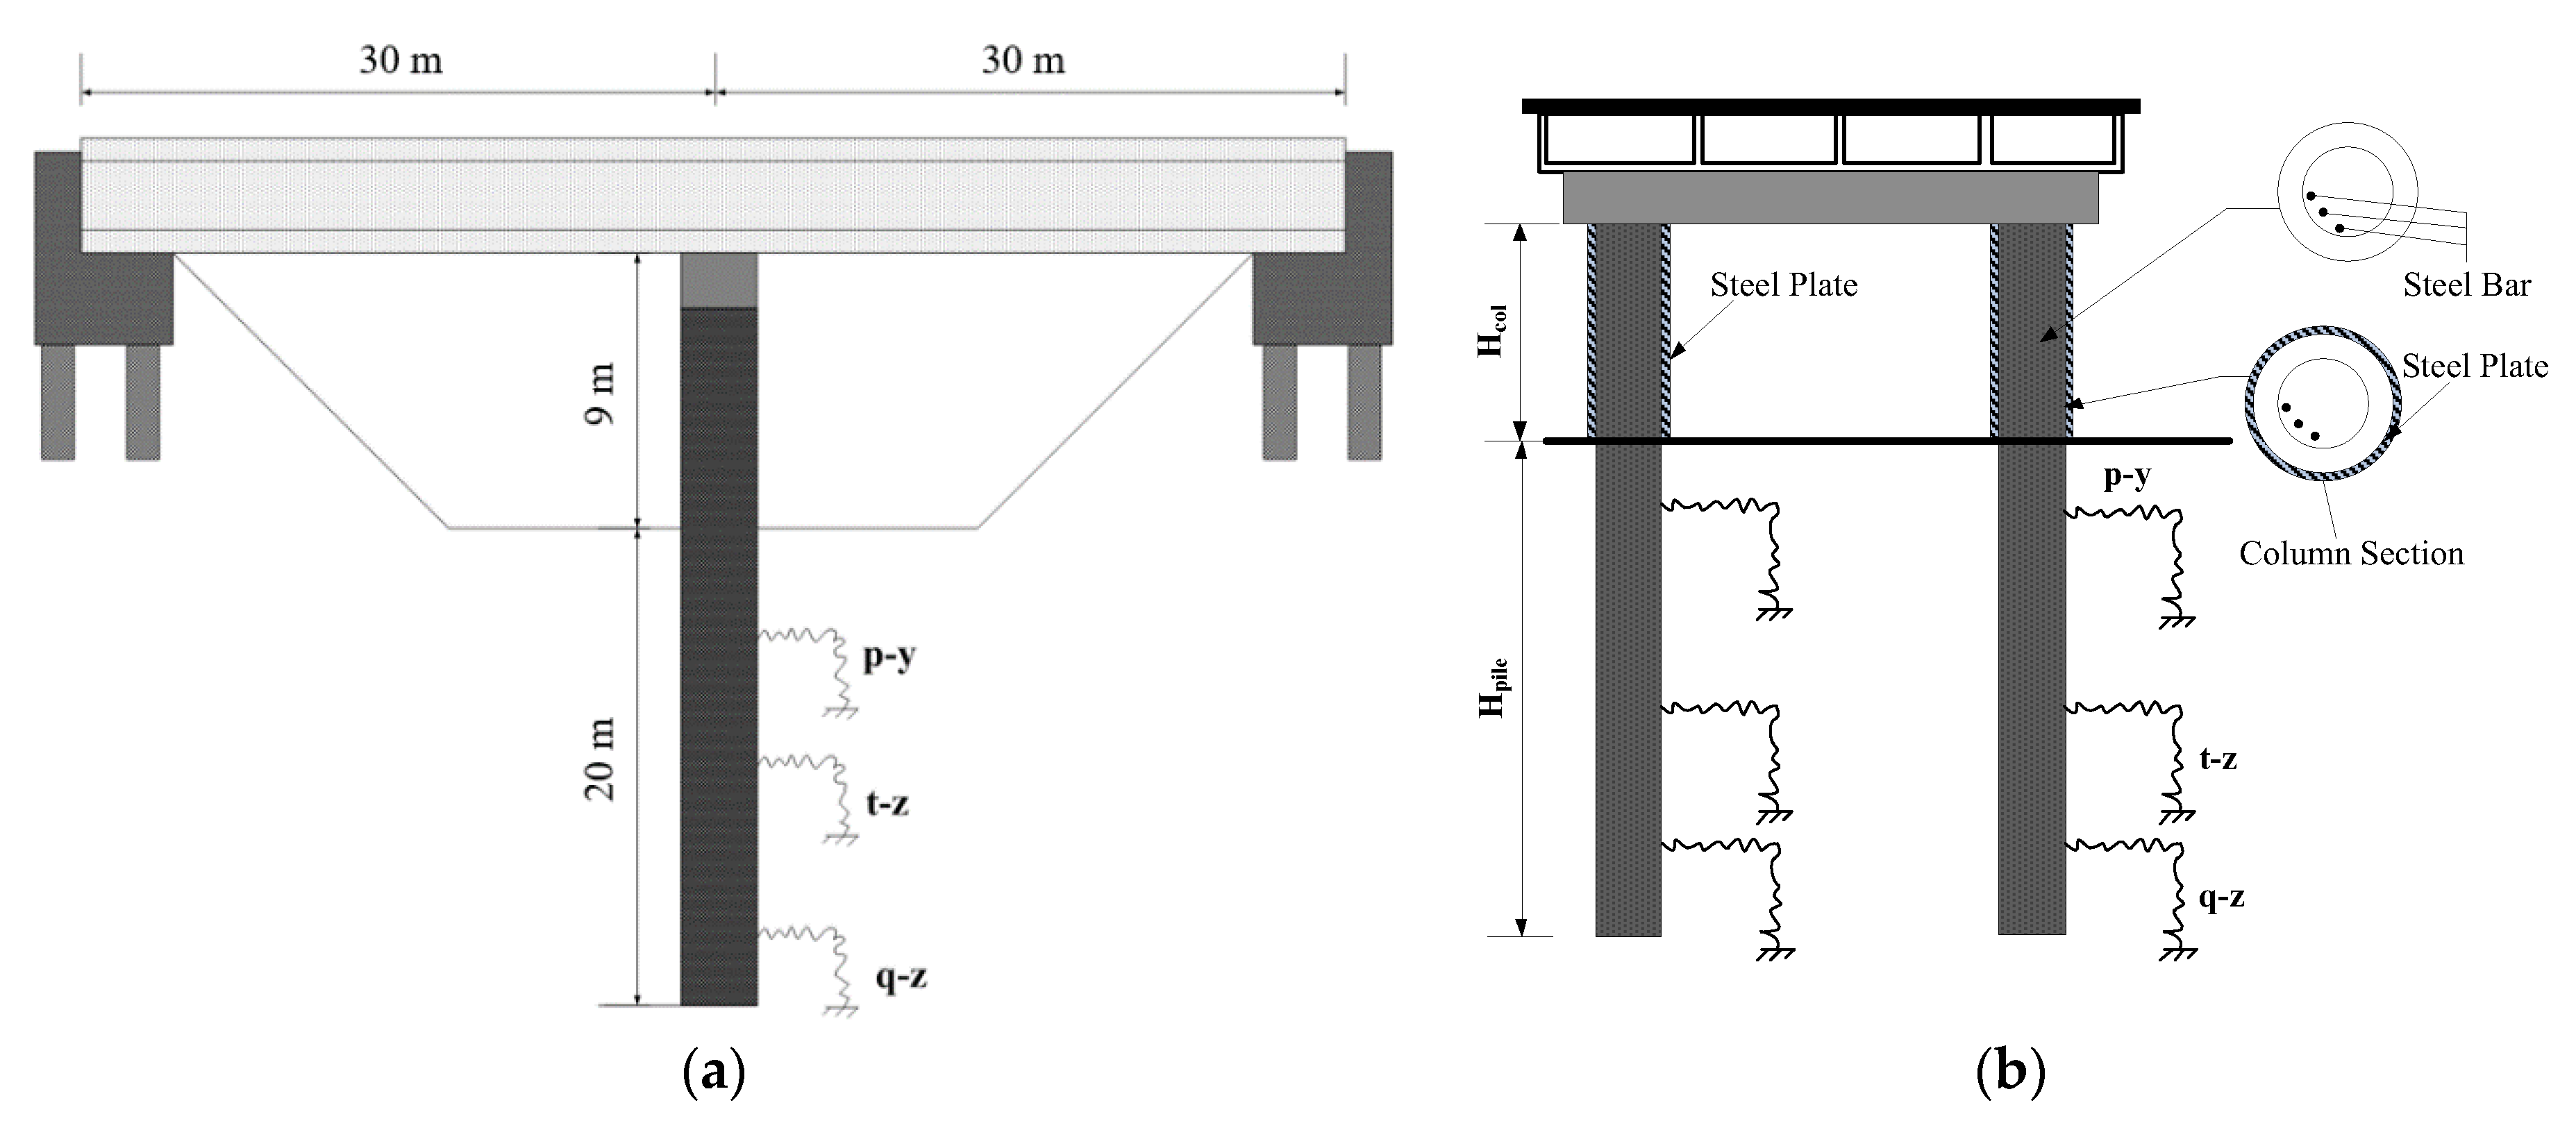
Figure 1. Bridge model. (a) Elevation view, (b) reinforced bridge piers.
Applsci 12 12078 g001
Figure 2. Hysteretic curves of a bridge pier with pitting corrosion. (a) Pristine, (b) 5% corrosion.
Applsci 12 12078 g002
Figure 3. Hysteretic curves of a bridge pier with 5% corrosion strengthened by different thicknesses of steel plates. (a) 1 mm, (b) 2 mm, (c) 3 mm, (d) 4 mm, (e) 5 mm.
Applsci 12 12078 g003
Figure 4. Skeleton curves for a bridge pier with pitting corrosion. (a) 5%, (b) 10%, (c) 15%, (d) 20%.
Applsci 12 12078 g004
Figure 5. Skeleton curves for a bridge pier with uniform corrosion. (a) 5%, (b) 10%, (c) 15%, (d) 20%.
Applsci 12 12078 g005
Figure 6. Fragile curves of the bridge system with 20% pitting corrosion strengthened by steel plates. (a) Slight damage, (b) moderate damage, (c) major damage, (d) collapse.
Applsci 12 12078 g006aApplsci 12 12078 g006b
Table 1. Mainshock–aftershock sequences.
Num.MainshockAftershockEarthquake Event
SequenceMSequenceM
111807.6238636.3CHI-CHI
211817.6238516.2CHI-CHI
311827.6238656.3CHI-CHI
411837.6238666.3CHI-CHI
511847.6238676.3CHI-CHI
611857.6238686.3CHI-CHI
711867.6232586.3CHI-CHI
811877.6232596.3CHI-CHI
911887.6232606.3CHI-CHI
1011897.6232616.3CHI-CHI
1111907.6232626.3CHI-CHI
1211917.6232636.3CHI-CHI
1311937.6232646.3CHI-CHI
1411947.6232656.3CHI-CHI
1511957.6232666.3CHI-CHI
1611967.6232676.3CHI-CHI
1711977.6232686.3CHI-CHI
1811987.6232696.3CHI-CHI
1911997.6232716.3CHI-CHI
2012007.6232726.3CHI-CHI
2112017.6232736.3CHI-CHI
2212027.6232746.3CHI-CHI
2312037.6232756.3CHI-CHI
2412047.6232776.3CHI-CHI
2512057.6232786.3CHI-CHI
2612067.6232796.3CHI-CHI
2712077.6232806.3CHI-CHI
2812087.6232816.3CHI-CHI
2912097.6232826.3CHI-CHI
3012107.6232836.3CHI-CHI
3112117.6232846.3CHI-CHI
3212127.6232856.3CHI-CHI
3312137.6232866.3CHI-CHI
3412147.6232876.3CHI-CHI
3512167.6232896.3CHI-CHI
3612567.6233246.3CHI-CHI
3712577.6233256.3CHI-CHI
3812587.6229976.2CHI-CHI
3912597.6227616.2CHI-CHI
4012607.6233266.3CHI-CHI
411305.9142765.5Friuli-02
421226.51315.91Friuli-01
431325.9142775.5Friuli-02
441335.9142785.5Friuli-02
451256.542675.2Friuli-01
469496.6916516.05Northridge-01
479546.6916955.28Northridge
489636.6916526.05Northridge
499746.6937795.28Northridge
509786.6917015.28Northridge
519816.6916556.05Northridge
529826.6917035.28Northridge
539846.6916566.05Northridge
549856.6916576.05Northridge
559886.6916586.05Northridge
569906.6916596.05Northridge
579956.6916606.05Northridge
589966.6917115.28Northridge
599996.6916616.05Northridge
6010046.6937715.28Northridge
Table 2. Peak force of a bridge pier with 5% corrosion under different thicknesses of steel plates.
TypeFmax (kN)
0.0%5%5%-R15%-R25%-R35%-R45%-R5
Pitting1321.81257.71411.61564.41722.11885.22066.3
Uniform1321.81275.91439.41593.21753.71927.72088.7
Pitting (%)0.00−4.856.7918.3530.2842.6256.32
Uniform (%)0.00−3.478.8920.5332.6745.8458.02
Table 3. Peak force of a bridge pier with 10% corrosion under different thicknesses of steel plates.
TypeFmax (kN)
0.0%10%10%-R110%-R210%-R310%-R410%-R5
Pitting1321.81209.401342.31503.41661.41802.91975.2
Uniform1321.81244.31395.11547.241708.561866.392042.27
Pitting (%)0.00−8.501.5513.7025.6036.4049.40
Uniform (%)0.00−5.865.5417.1029.3041.2054.50
Table 4. Peak force of a bridge pier with 15% corrosion under different thicknesses of steel plates.
TypeFmax (kN)
0.0%15%15%-R115%-R215%-R315%-R415%-R5
Pitting1321.81157.31282.51433.51595.01743.51905.0
Uniform1321.81213.21344.51509.91656.71809.51990.0
Pitting (%)0.00−12.45−2.908.4020.6031.9044.12
Uniform (%)0.00−8.221.7014.225.3036.8050.50
Table 5. Peak force of a bridge pier with 20% corrosion under different thicknesses of steel plates.
TypeFmax (kN)
0.0%20%20%-R120%-R220%-R320%-R420%-R5
Pitting1321.81100.71229.51353.31521.81670.91814.3
Uniform1321.81182.01305.31466.91621.21771.11942.2
Pitting (%)0.00−16.72−6.90−2.315.1026.4037.30
Uniform (%)0.00−10.57−1.2010.922.6033.9046.90
Publisher’s Note: MDPI stays neutral with regard to jurisdictional claims in published maps and institutional affiliations.