Article

Investigation with Non-Destructive and Destructive Methods for Assessment of Concrete Compressive Strength

Department Reinforced Concrete Structures, Faculty of Structural Engineering, University of Architecture, Civil Engineering and Geodesy (UACEG), 1000 Sofia, Bulgaria
Appl. Sci. 2022, 12(23), 12172; https://doi.org/10.3390/app122312172
Submission received: 30 October 2022 / Revised: 20 November 2022 / Accepted: 25 November 2022 / Published: 28 November 2022
(This article belongs to the Special Issue Multi-Performance Analysis of Concrete from Life Cycle Perspective)

Abstract

:
Determining the compressive strength of concrete is important in all phases of construction and in diagnosing the technical condition of existing reinforced concrete buildings and facilities during their service. In this article, the author presents the experimental results from research conducted over 6 years. The following non-destructive methods were used in the tests—elastic rebound, ultrasonic, SonReb and destructive methods, and the results of the latter were used as a reference. The tests were carried out on specimens prepared on the day of laying the concrete mix in the reinforced concrete beams or cores taken from the beams. The results of the determination of the probabilistic compressive strength using the different methods at concrete ages of 28, 244, 280, 293, 342, 1126 and 1926 days, are presented. The relative error, predicted strength and accuracy were determined and compared. Isocurves were drawn to determine the compressive strength for each point of a reinforced concrete structure based only on measurements obtained using non-destructive methods. The results obtained via SonReb and via the method assessing ultrasonic pulse velocity and its relationship to the dynamic and static modulus of elasticity were the closest to the reference compressive strength values.

1. Introduction

In construction practice, it is often necessary to test new or existing structures in order to assess the quality of the construction materials used. Concrete is one of the most used materials [1,2,3,4]. The study and determination of the main characteristics of concrete, as well as the tracking, evaluation, control and diagnosis of its actual condition is necessary to ensure reliability, durability, safety, security and good service quality in building structures. In practice, it is necessary to evaluate many parameters of concrete, such as its compressive strength, modulus of elasticity, the probability of corrosion, carbonation, homogeneity and changes in the characteristics of concrete occurring with time, as well as evaluations of construction quality and structural integrity through the detection of voids, cracks, honeycombing and other defects. The assessment of concrete’s current state [4,5,6,7,8,9] most often involves the complex application of various methods in order to obtain the most reliable results. Choosing an appropriate evaluation technique involves seeking a compromise between performance, cost, the accuracy of results and objective limitations.
There are many methods for evaluating, measuring, testing and controlling the parameters and characteristics of concrete and they can be used in all phases of construction and at any time in the service of buildings and facilities [3,4,9,10]. Depending on the method of impact used and the condition of the structural elements after the test—whether they are damaged and/or affected—there are two types of methods: destructive and non-destructive. To increase the reliability of test results, it is necessary to comprehensively apply combinations of destructive and non-destructive methods [1,3,6,7,10,11,12,13,14,15,16]. One of the most important and key properties of concrete is its compressive strength.
Traditionally, the determination of compressive strength is carried out by means of destructive tests of cubes with dimensions determined according to a standard and made on site on the day of laying the concrete mix according to EN 12390-2 [17] in the reinforced concrete elements, or with cores taken from the reinforced concrete structures [1,8,15,16,18]. Destructive methods provide direct and accurate information on the value of compressive strength, but they are more expensive, more labor-intensive and sometimes impossible to apply for reasons of damage limitation and the possibility of weakening the existing reinforced concrete structures.
Non-destructive methods (NDM), especially in field testing, have been increasingly used in recent decades due to their rapidity, low cost and easy application [1,2,3,4,6,12,19,20,21]. A disadvantage of these methods is that they are indirect. Despite the fact that NDM studies have been carried out by many researchers for decades, achieving an efficient and reliable estimation of concrete parameters remains a controversial issue and is a goal that has been pursued by many specialists. Combining destructive and non-destructive test results, which are not equally sensitive to the various factors influencing compressive strength, is still a matter of discussion.
Due to the fact that concrete is a non-homogeneous material, a unique assessment model for all concretes does not exist. For the effective conditional assessment of concrete in recent years, a measuring technique based on the achievements of electronics and computer software is used, which enables long-term observations and the automation of measurements, increasing the accuracy and the ability to collect, store and transfer data.
In this article, the author presents experimental results regarding the determination of the compressive strength of concrete samples of different ages—28, 244, 280, 293, 342, 1126 and 1926 days—using destructive and non-destructive methods (the elastic rebound method, the ultrasonic pulse velocity method and the SonReb method). Over a period of 6 years, the changes in the compressive strength of concrete due to various factors, such as aging, temperature changes, shrinkage, environmental action, changes in humidity, poor or improper service and maintenance and other factors, were studied [1,16,18]. The relative error was determined and the accuracy of the results using each of the non-destructive methods compared to those of the destructive method, which was used as a reference, was evaluated. Nomograms were created based on the results of the destructive testing of a limited number of test specimens and the non-destructive determination of the rebound number and the ultrasonic signal velocity. Thus, for any location of the structure from which it is not possible to take a core, the compressive strength of the concrete can be determined.

2. Methods Used for Determining the Compressive Strength of Concrete

The results obtained using the various methods contained various levels of random, methodological, instrumental and subjective errors.
In the experimental studies, the author used the following methods:

2.1. Visual Inspection

Visual inspection is the first step in any planned research in order to determine the current condition of the concrete. This inspection can identify the possible causes of its damage and determine which of the various methods is most useful and appropriate for further investigation [2,3,4,19,21]. Damage and deterioration of concrete quality can be detected through visual inspection, to determine the condition of the surfaces; the presence of cracks, cavities or defects; whether they are limited to certain places or present in the entire volume of the concrete; whether there is a change in the color of the surfaces; etc. Visual inspection is one of the most difficult steps in all structural assessment and diagnostic activities, as something that seems obvious to one person may not be so to another, and often the omission of what seems insignificant can lead to an incorrect conclusion.
During the preliminary inspection, the areas on the concrete where measurements will be conducted are determined.

2.2. Non-Destructive Testing of Concrete

The following non-destructive methods were used in the present study.

2.2.1. Elastic Rebound Method

The elastic rebound method is fast, cheap, convenient and is one of the most widely used diagnostic non-destructive methods for determining the surface hardness of concrete. It uses a correlation dependence and the probabilistic compressive strength fc,Schmidt in new and existing reinforced concrete structures.
It is based on the relationship between the compressive strength and the magnitude of the rebound R (the rebound number) from the concrete surface by a hammer that activates a movable mass. After the impact, energy is induced, which causes the rebound [4,7,21,22,23,24]. The rebound number, which is a measure of surface hardness, is measured on a graduated scale. The most widely used device in this method is the Schmidt hammer. The magnitude of the rebound is affected by the characteristics of the concrete components (the size and type of coarse aggregate, the class and quantity of cement, the water-cement ratio); the age, moisture and carbonation degree of the concrete cover; the size and shape of the specimen; the temperature, type and inclination of the hammer during testing and other factors [1,4,11]. A disadvantage of the method is that if the influence of these parameters is not taken into account, the probabilistic compressive strength can differ by up to 70% from the actual one. To reduce these influences, the test is repeated at least 10 times within a test region, and the result is given by the median of these measurements. If more than 20% of all results differ from the median value by more than 30% all results are dismissed, according to EN 12504-2 [25]. Measurements must be carried out on well-cleaned surfaces, without defects.
With this method, the compressive strength is determined at a depth of 2–3 cm from the surface, and for this reason it should be combined with other methods that determine the strength inside the elements [26,27].
More than 80 empirical models have been established, giving a relationship between the compressive strength of concrete and the rebound number [1,4,6,26].

2.2.2. Non-Destructive Ultrasonic Pulse Velocity Method (UPVM)

With UPVM, it is possible to be performed periodic or continuous measurements for the same test points throughout the service period of a reinforced concrete structure, and there is the possibility of automating the process and detecting damages. Non-destructive UPVM uses the propagation of ultrasonic waves introduced into concrete [2,4,13,21,28,29,30,31]. These consist of longitudinal, transverse and surface waves. Longitudinal waves have the highest velocity. Devices using this method consist of two transducers (a transmitter and a receiver), a high-frequency signal generator, a device for amplifying signals from the receiver and a display for visualizing the results [3]. They are used to measure the time the ultrasonic pulses take to pass from the transmitter to the receiver; knowing the distance between them, the velocity of the ultrasonic signal can be calculated. With this method, the probabilistic compressive strength, homogeneity and the probabilistic modulus of elasticity of the concrete, as well as the presence of cavities, internal defects, cracks and changes occurring over time in the characteristics of concrete, etc., can be determined. A disadvantage of using UPVM is the difficulties associated with the inhomogeneity of the concrete, which must be taken into account in the measurements. The speed of the ultrasonic signal is influenced by the characteristics of the concrete components [4,22,30] and its dependence on them is very complex (involving the size and type of coarse aggregate, the class of cement and water-cement ratio). These characteristics include the age, the moisture content of the concrete, the presence of cracks, concrete delamination, the temperature, the length of the signal path, the contact between the transducers and the surface of the structure, the presence of reinforcement, etc. The influence of these factors has been studied by many researchers [3,22,30] and they clearly indicate the need to establish correlations between ultrasonic pulse velocity measurements and standard destructive tests of specimens, prepared on the day of laying the concrete mix in the reinforced concrete elements, or cylindrical cores taken from existing reinforced concrete structures.
More than 70 models (linear, power, exponential, polynomial and miscellaneous) are known in the scientific literature, expressing a relationship between the compressive strength of concrete and the ultrasonic pulse velocity [1,6,20,26].
The probabilistic compressive strength of concrete in this study was determined using each of the following two approaches:
  • Approach 1: the dependence of fc,UPV,app1 on the velocity of the ultrasonic signal VUPV(km/s) was calculated with the following formula [3,22,32,33]:
f c , UPV , app 1 = c . V UPV 3 , 75 ,
where c is a factor.
  • Approach 2: dependence of fc,UPV,app2 on the weight per unit volume and dynamic modulus of elasticity of concrete, which were determined based on the velocity of the ultrasonic signal.
In [20], a methodology is presented for determining the probabilistic compressive strength of concrete in existing reinforced concrete structures using UPVM and equations that relate the velocity of the ultrasonic pulse to the dynamic and static modulus of elasticity and from there to the compressive strength.
f c , UPV , app 2   = ( E c , s 2. 200 ) . [ 2 , 1.10 5 . ( γ c / 2 , 3 ) 1 , 5 ] 2 ,  
where γ c is the air-dry density of concrete (in kg/m) and E c , s   is the static modulus of elasticity of concrete (in MPa).
The dynamic modulus of elasticity, E c , din , is determined as follows [1,3,21,25,28,31]:
E c , din = ( 1 + ν d ) . ( 1 2 ν d ) ( 1 ν d ) .   γ c g .   V UPV 2 ,
where ν d is the dynamic Poisson’s ratio, V UPV is in km/s, γ c is in kg/m3 and g is the gravity acceleration [m/s2].
In [20], the authors propose the use of the dynamic Poisson’s ratio for concrete preserved in the air to be accepted as   ν d = 0 , 25 . Then, ( 1 + ν d ) ( 1 2 ν d ) / ( 1 ν d ) = 0 , 83 . The air-dry density of concrete γ c can be calculated as follows [21]:
γ c = 114 , 8   . V UPV + 1813
where γ c is in kg/m3 and V UPV is in km/s.
The static modulus of elasticity of concrete, E c , s ,   can be determined using the following formula [3,21]:
E c , s = 2 , 1.10 5 . ( γ c 2 , 3 ) 1 , 5 .   ( f c , UPV , app 2   200 ) 1 2 ,
where γ c is in kg/m3 and f c , UPV , app 2   is in MPa.
After comparing the values for the modulus of elasticity of concrete obtained from Equations (3) and (5), the following linear relationship can be derived:
E c , s = k . E c , din

2.3. Destructive Determination of Concrete Compressive Strength

Classical methods for evaluating the compressive strength of concrete are destructive, expensive and labor-intensive [4,9,11,12,13]. The strength is determined by means of destructive tests, most often using cubes with dimensions determined by a standard and made on site on the day of laying the concrete mix in the reinforced concrete elements or with cores taken from the existing reinforced concrete structures [1].
The cube compressive strength, f c , cube , of the test specimens is determined according to EN 12390-3 [34]. The maximum force at failure F in a material testing machine, corresponding to EN 12390-4 [35], is reported and the compressive strength of the concrete is calculated using the formula:
f c , cube = K . F A c ,
where f c , cube is in N / mm 2 , F is in N ; A c is the cross-sectional area of the test specimen on which the compressive force acts (in mm 2 ) and K   is   a   correction factor for the influence of the shape and size of the test specimen.

2.4. SonReb Method

SonReb is one of the most common and accurate combined methods for determining the compressive strength of concrete, in which the most reliable results are obtained [8,26,36,37,38,39]. In the SonReb method, a correlation is sought between the results of tests with UPVM, the elastic rebound method, which are independent variables, and the obtained compressive strength in a destructive test (dependent variable) of test specimens or cores taken from a reinforced concrete structure in service [4,40]. Many factors, as in the elastic rebound method and UPVM, can influence this relationship. In this combination, they sometimes have opposite effects on the measurement results of the different methods. This leads to a reduction or compensation in measurement errors and an improvement in the reliability of concrete compressive strength assessments. For example, an increase in moisture in concrete leads to an increase in the velocity of the ultrasonic pulse and a decrease in the rebound number when using a Schmidt hammer [1]. The models proposed by different authors vary (linear, power, exponential, polynomial and other) and are strongly influenced by the data used for the specific reinforced concrete structure; to date there is no universal model solution [1]. When there are no data available regarding the concrete used in the reinforced concrete structure, the following equation is applied [8,41,42]:
f c , SonReb = a . R b . V UPV c ,
where a, b and c are constants.
The factors a, b and c can be obtained using the regression analysis function of Microsoft Excel and determining the correlation between the compressive strength determined via the destructive method and the results of the tests conducted with the elastic rebound method and UPVM. With the obtained equations, isocurves can be plotted, from which concrete compressive strength can be determined based on the non-destructive measurements alone [1,40,43]. The formula for f c , SonReb can be used in determining the compressive strength of concrete by means of the SonReb method for the locations of the reinforced concrete structure under study from which cores cannot be sampled.
In [1,8,26,37,38,40,41,43], polynomial, power, linear and other models are cited that relate concrete compressive strength, the rebound number and the ultrasonic pulse velocity.

3. Experimental Setup

The specimens used for this experimental study were as follows.

3.1. RC Beams

The concrete used for the samples (beams and test specimens) was class C25/30, consistency S3, fine fraction of coarse aggregate (dmax = 12 mm). The test specimens were prepared together with the reinforced concrete beams on the same day and from the same concrete mix to ensure the comparability of the experimental results.
Part of the research was performed on reinforced concrete beams. They were initially stored indoors for two years (Figure 1a) at a temperature of ( 20 ± 2 ) ° C and humidity ( 50 ± 5 ) % in an unloaded state, and during the next four years were left outdoors, subjected to external atmospheric effects (Figure 1b). Before testing, the beams were checked for defects, contamination with organic substances, etc.

3.2. Test Specimens

Non-destructive and destructive tests were carried out on standard specimens prepared on the day of laying the concrete mix in the reinforced concrete beams or on cores sampled from the reinforced concrete elements.
The following specimens were used.
Twenty-seven cubes (Figure 2a) with dimensions of 150/150/150 mm. Their size was chosen depending on the size of the coarse aggregate according to EN 12390-1 [44]. They were made of the same concrete as the reinforced concrete beams. To obtain reliable test results, the test specimens used were prepared with accurate dimensions, flat and smooth sides and straight edges and corners in molds of non-deformable material, which gave them the desired shape and dimensions with the smallest possible deviations from standard requirements. The molds for the cubic specimens were made of polyurethane (Figure 2b). Sampling of the concrete mix was carried out according to EN 12350-1 [45]. Internal surfaces of the molds were coated with formwork oil. After mixing the concrete mix, the molds were filled in two layers, with each of them being compacted on a vibrating table (Figure 2c). After compaction, the excess concrete was removed, the surface was smoothed and notes were placed with the date and time of preparation, the specimen number and the class of concrete. The specimens were left to age in the molds for about 48 h at a temperature of ( 20 ± 5 ) ° C , protected from impact, vibration and drying (Figure 2d).
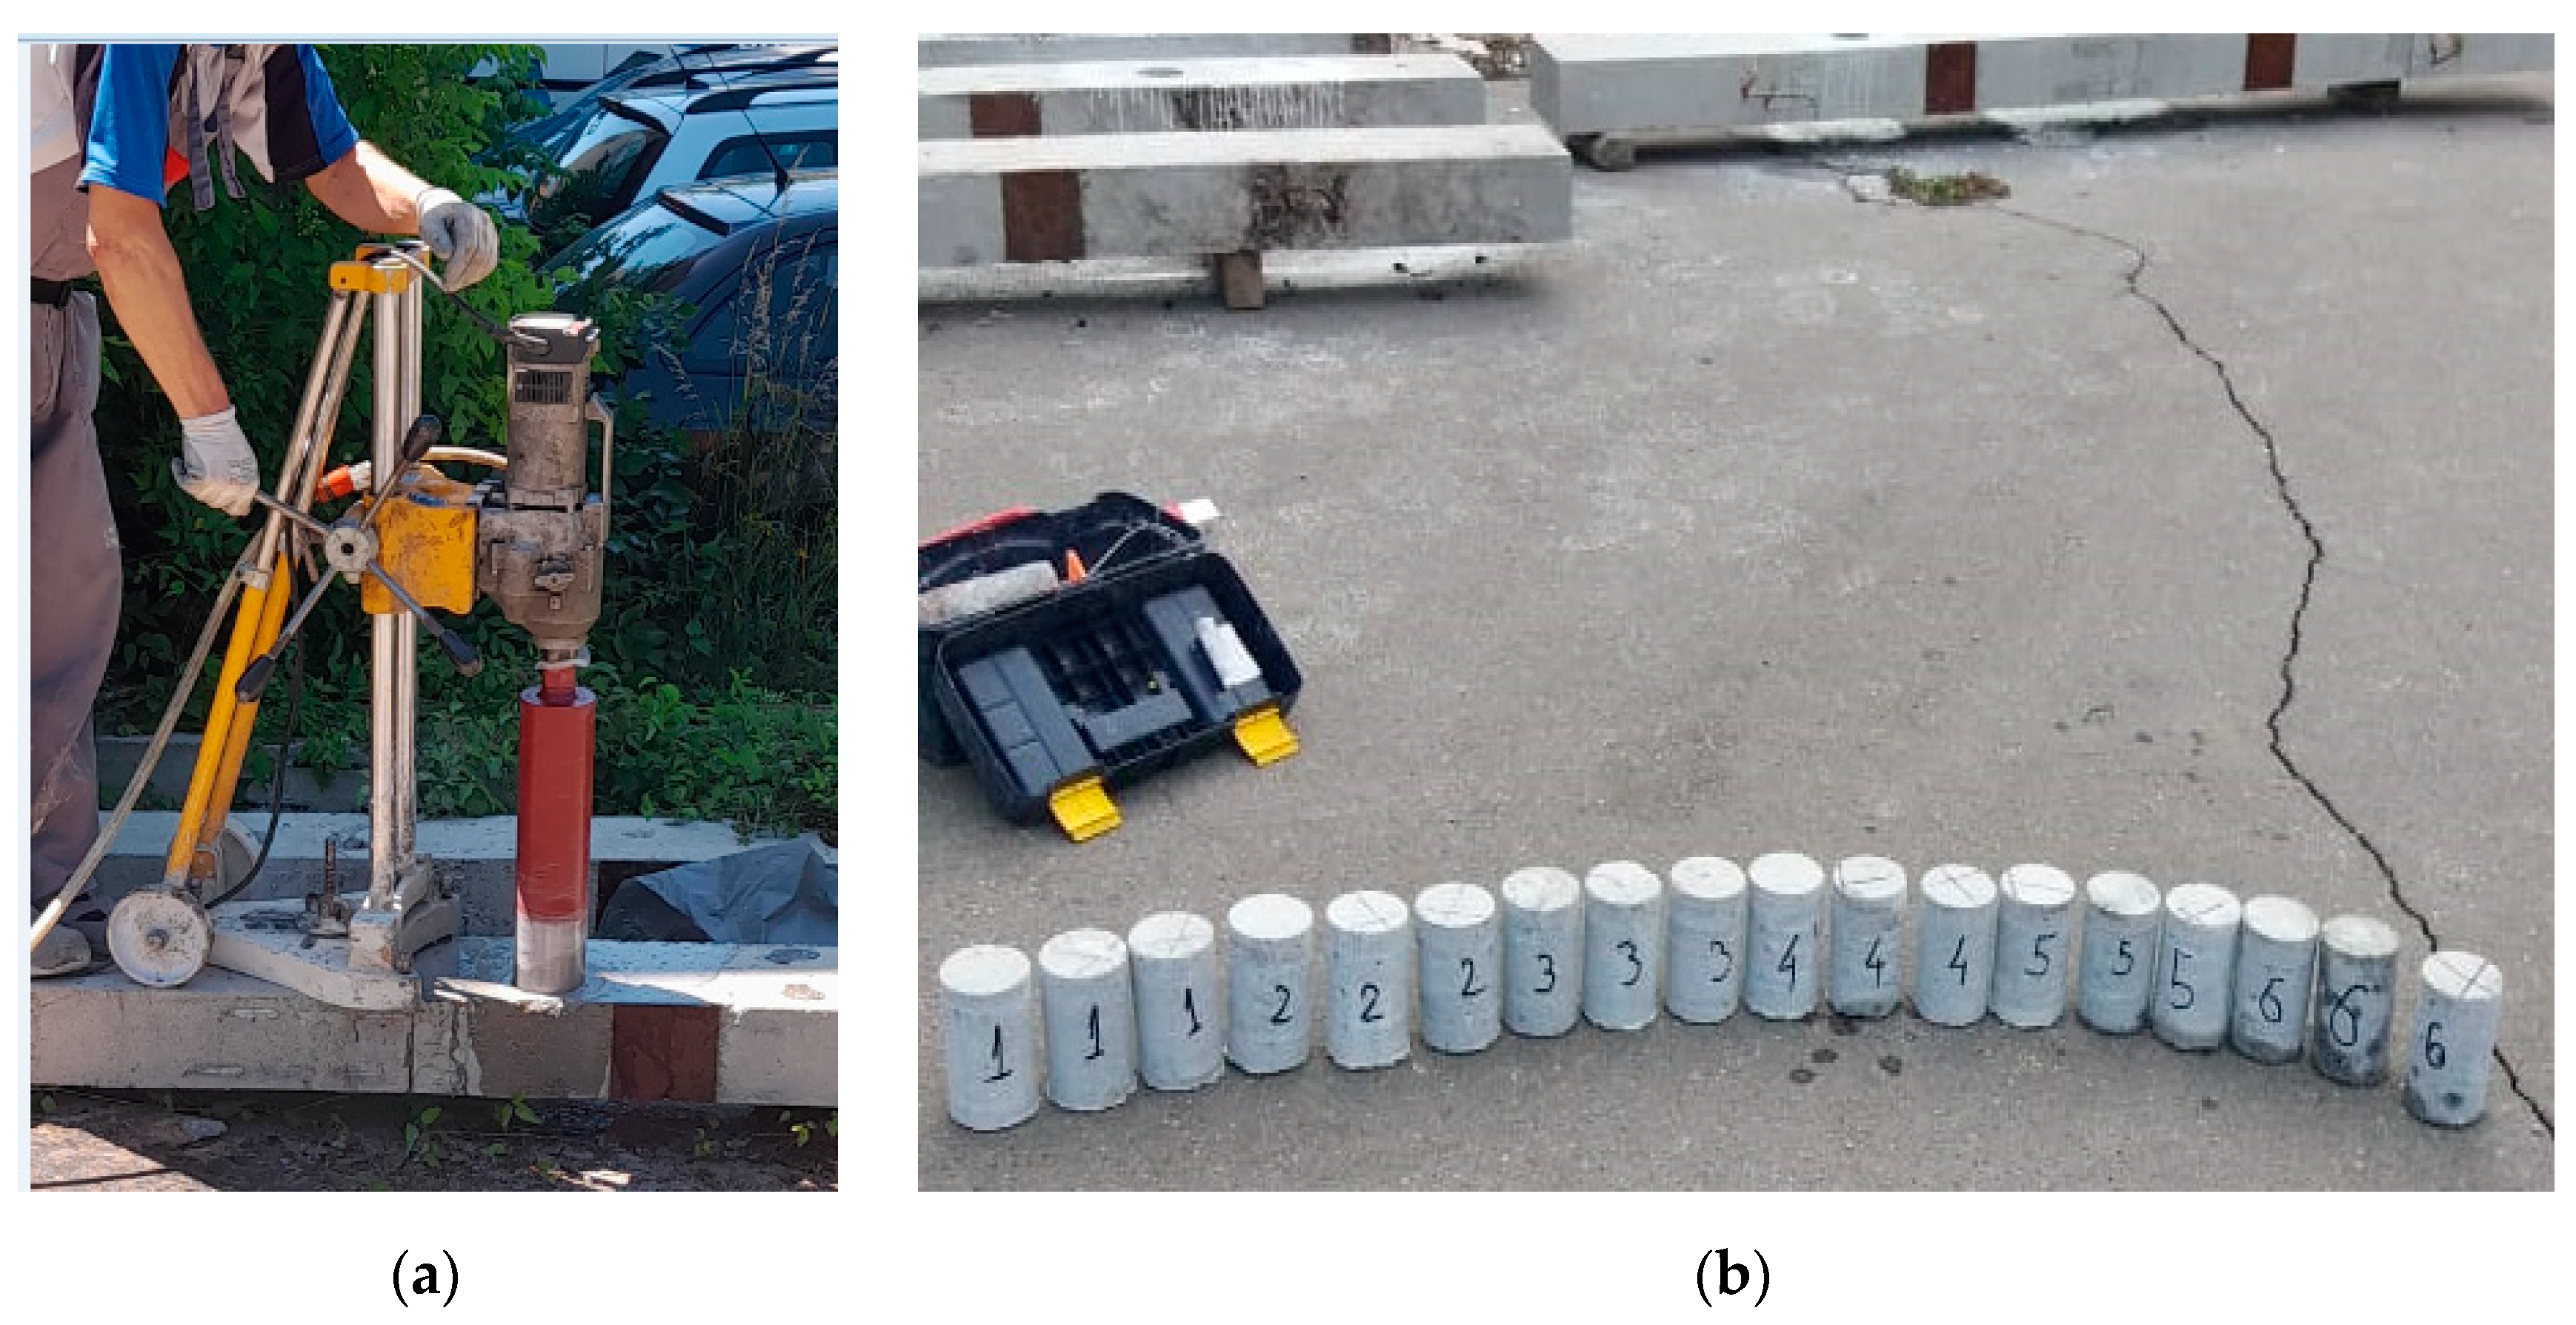
  • Cored specimens. They were taken using a drilling machine according to EN 12504-1 [46] from the reinforced concrete beams at an age of 1926 days (Figure 3a). The machine platform had to be perpendicular to the surface from which the core was drilled in order to avoid obtaining a distorted specimen [8,42]. The diameter of the cores (Figure 3b) depended on the ratio of the diameter to the maximum size of the coarse aggregate [16,23,47], determined according to EN 12504-1 [46] and this was equal to 100 mm, i.e., the requirement that the ratio was not less than 3 was met.
    Eleven of the cored specimens without visible defects and the presence of reinforcement were prepared by cutting off their ends so that they become cylinders with a height and diameter equal to 100 mm. The main limitations in the number of cores taken under real conditions [1,18,19,47,48] were related to costs and the destructive effects on reinforced concrete structures.

4. Experimental Results

4.1. Visual Inspection

Visual inspections were carried out to assess the condition of the visible concrete surfaces, relating to the presence of cracks, splitting of the concrete cover, change of color, surface stains, honeycombing, etc. [2,3,4,19]. Research was not conducted in areas with such defects. During the preliminary inspection, the places subjected to inspection and measurements were marked.

4.2. Compressive Strength of Concrete Determined by Its Surface Hardness (Figure 4)

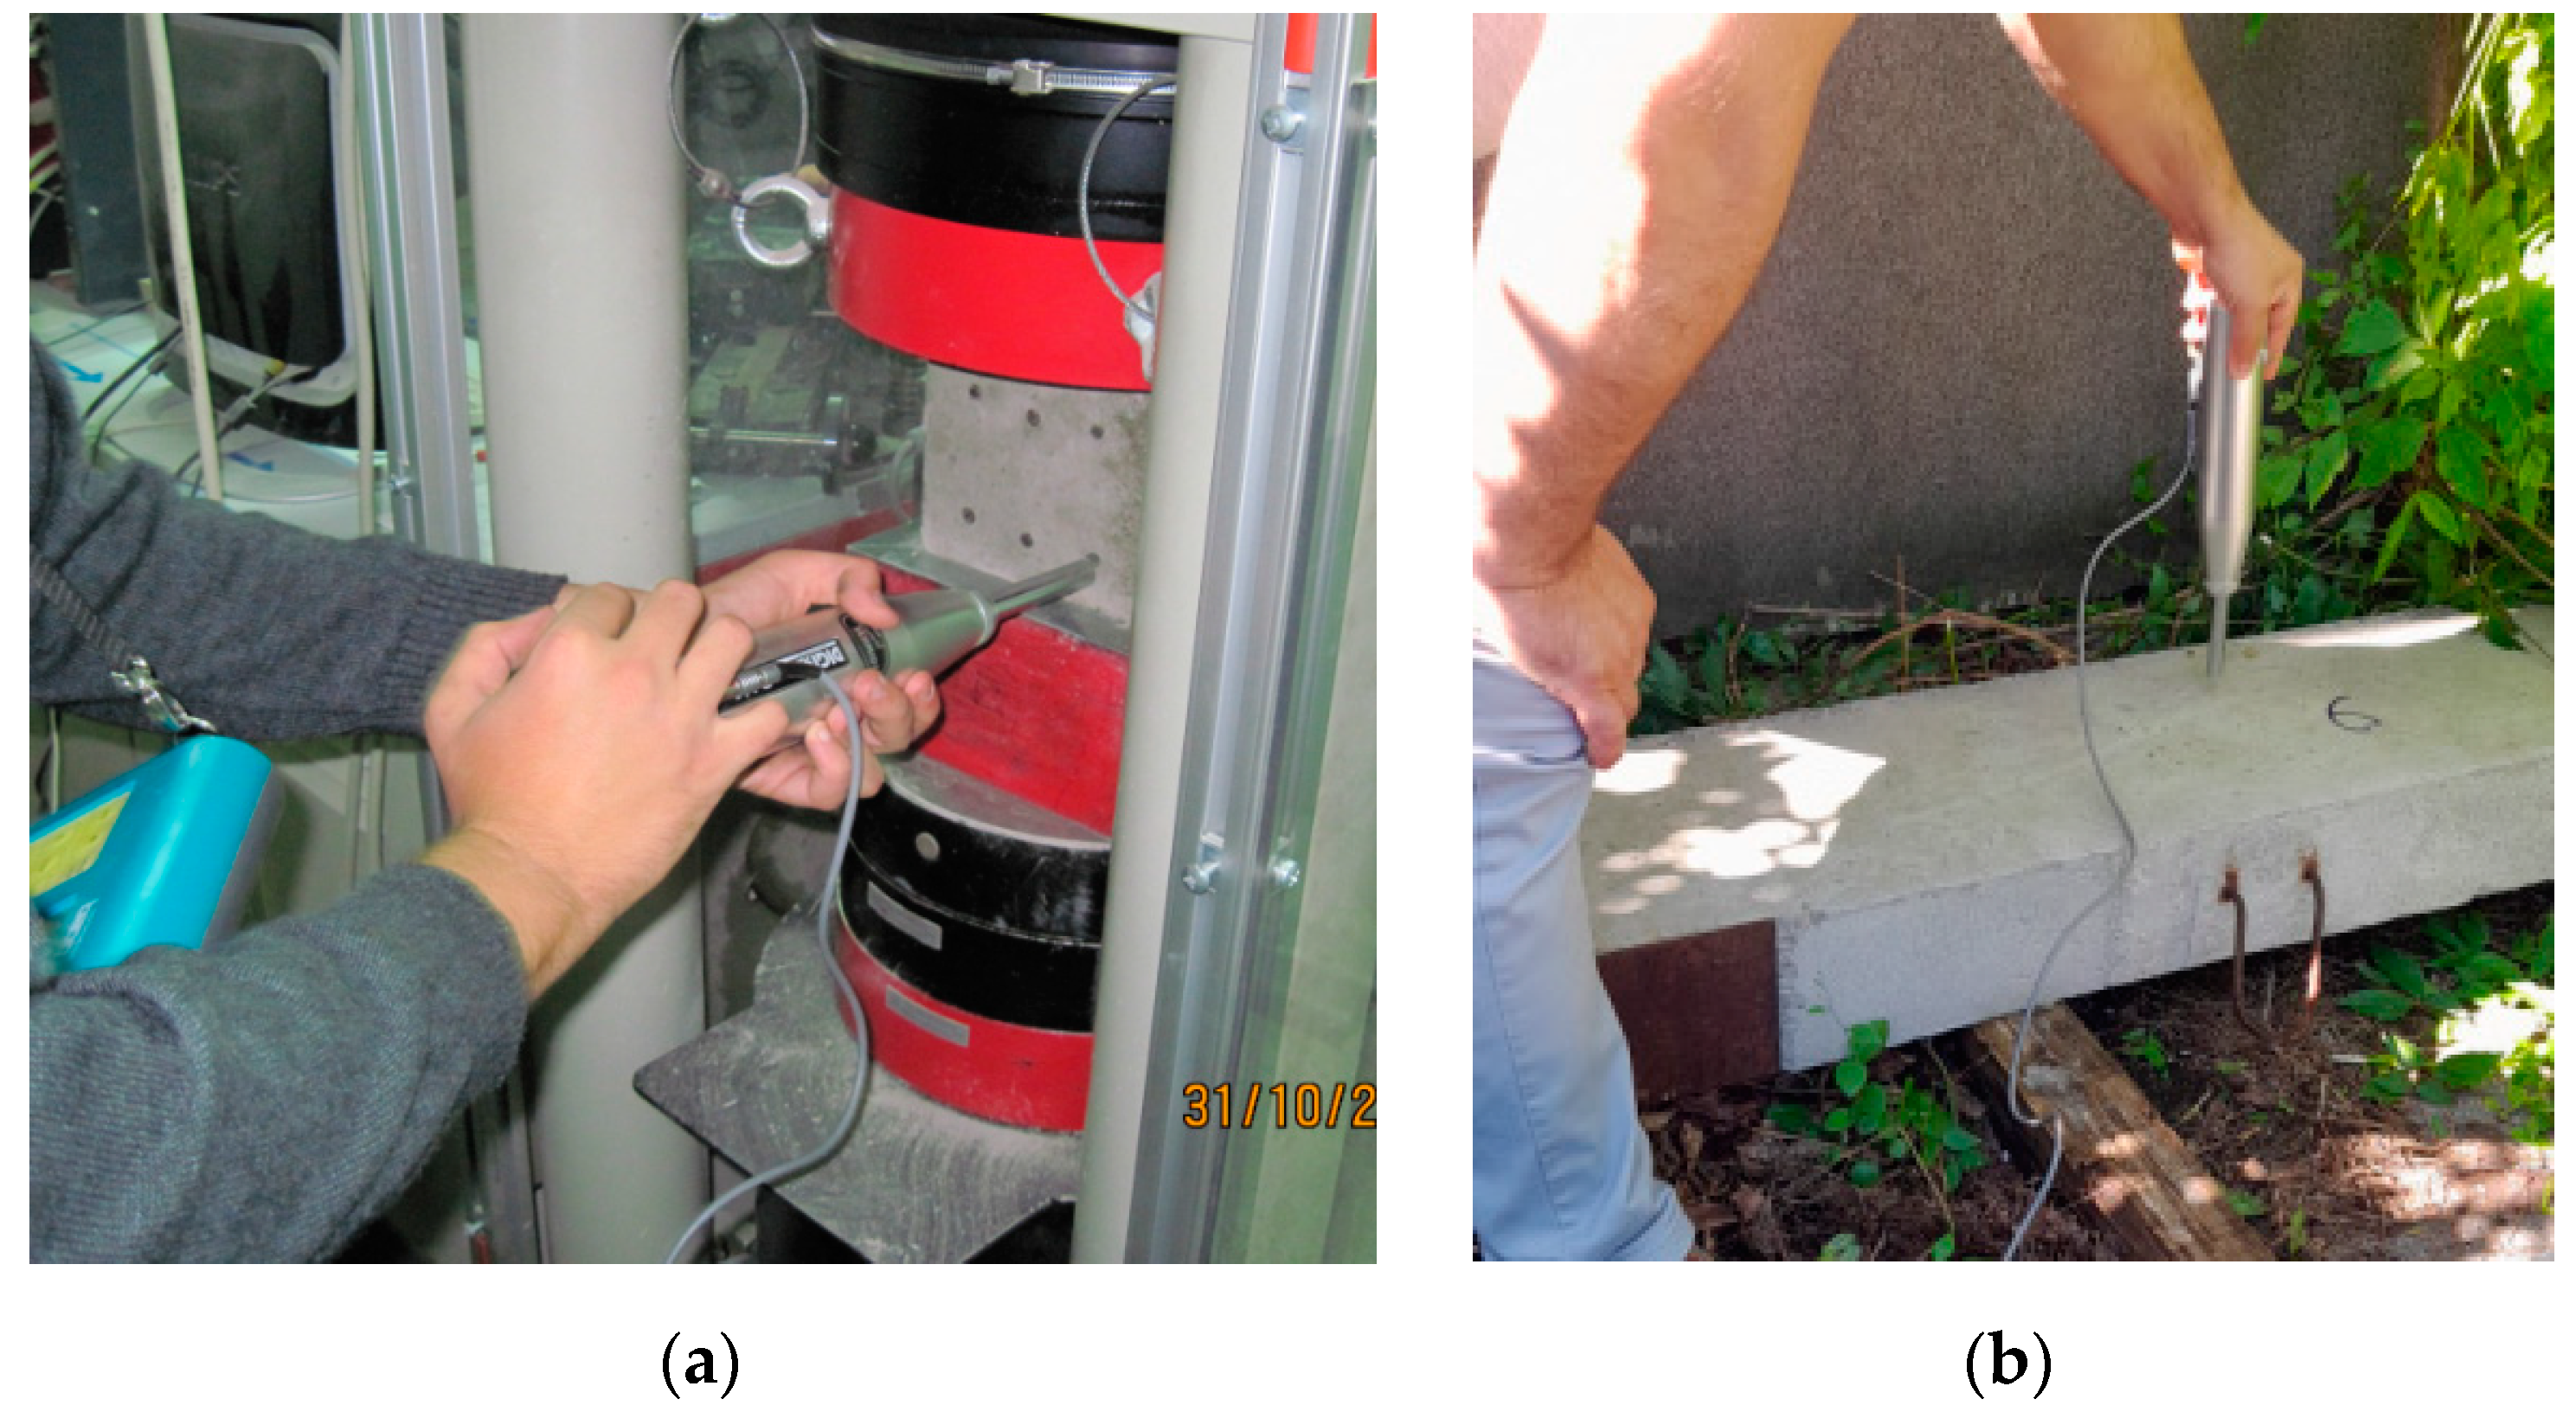
To determine fc,Schmidt based on concrete surface hardness, a Digi Schmidt hammer, type N, from the company Proceq (Figure 4), was used. Studies were conducted on 27 cubes at concrete ages of 28, 244, 280, 293, 342 and 1126 days. For the first five curing periods, three cubes were tested, and for the 1126th day, 12 cubes were tested. The test specimens were aged in an indoor space at a temperature of 20 °C ± 2 °C and a humidity of 50% ± 5% in an unloaded state. At a concrete age of 1926 days, measurements were performed on the reinforced concrete beams at the locations where the cores would be taken.
The tests were performed according to the requirements of EN 12504-2 [25].
In the experiment, cubes were tested on two opposite sides with the hammer while they were firmly pressed in the plates of the machine. Before the non-destructive testing of the specimens, they were loaded on compression with a force that induced normal stresses in them, from 7 N / mm 2 to 10 N / mm 2 . The surface layer of the concrete at the experimental points was dry and had an undamaged surface. A correction was made to the compressive strength ( R s ), reported depending on the rebound number R, with a coefficient of concordance of the device and a coefficient for the age of the concrete. Calibration of the Schmidt hammer used was performed before starting each series of tests, measurements were made with the original Schmidt calibration anvil and the results were within the range specified by the manufacturer.
For each specimen on two opposite sides, 10 readings were made to determine the rebound number, R; the median of the values of R was calculated; and the compressive strength, f c , Schmidt , was determined. For reinforced concrete beams, the rebound number for each test point was determined as the median of 10 results. At the concrete ages of 28, 244, 280, 293, 342 and 1126 days, the direction of the device was horizontal. At the age of 1926 days, the direction was vertical. The distances between the centers of the hits and from the edge of the cube (beam) were not less than 25 mm.
The results regarding the compressive strength of the concrete, determined based on its surface hardness, for different ages are given in Table 1.

4.3. Compressive Strength of Concrete Determined via UPVM

Measurements were made with a Proceq Tico portable device, of which the transmitter and receiver frequency was 54 kHz. Ultrasonic waves cannot move through air (the speed of sound in air is about 340 m/s). Therefore, to ensure good contact between the transmitter, the receiver and the concrete surface, a special paste was used.
The author’s experimental research to determine the probabilistic concrete compressive strength was carried out over almost 6 years—at the age of 28, 244, 280, 293, 342, 1126 and 1926 days. These measurements were performed before the destructive tests.
Ultrasonic pulse velocity measurements were carried out for:
  • Three cubes with dimensions of 150/150/150 mm for each day at 28, 244, 280, 293 and 342 days;
  • Twelve cubes on the 1126th day;
  • Eleven cored specimens with a height and diameter of 100 mm, taken from the reinforced concrete beams on the 1926th day.
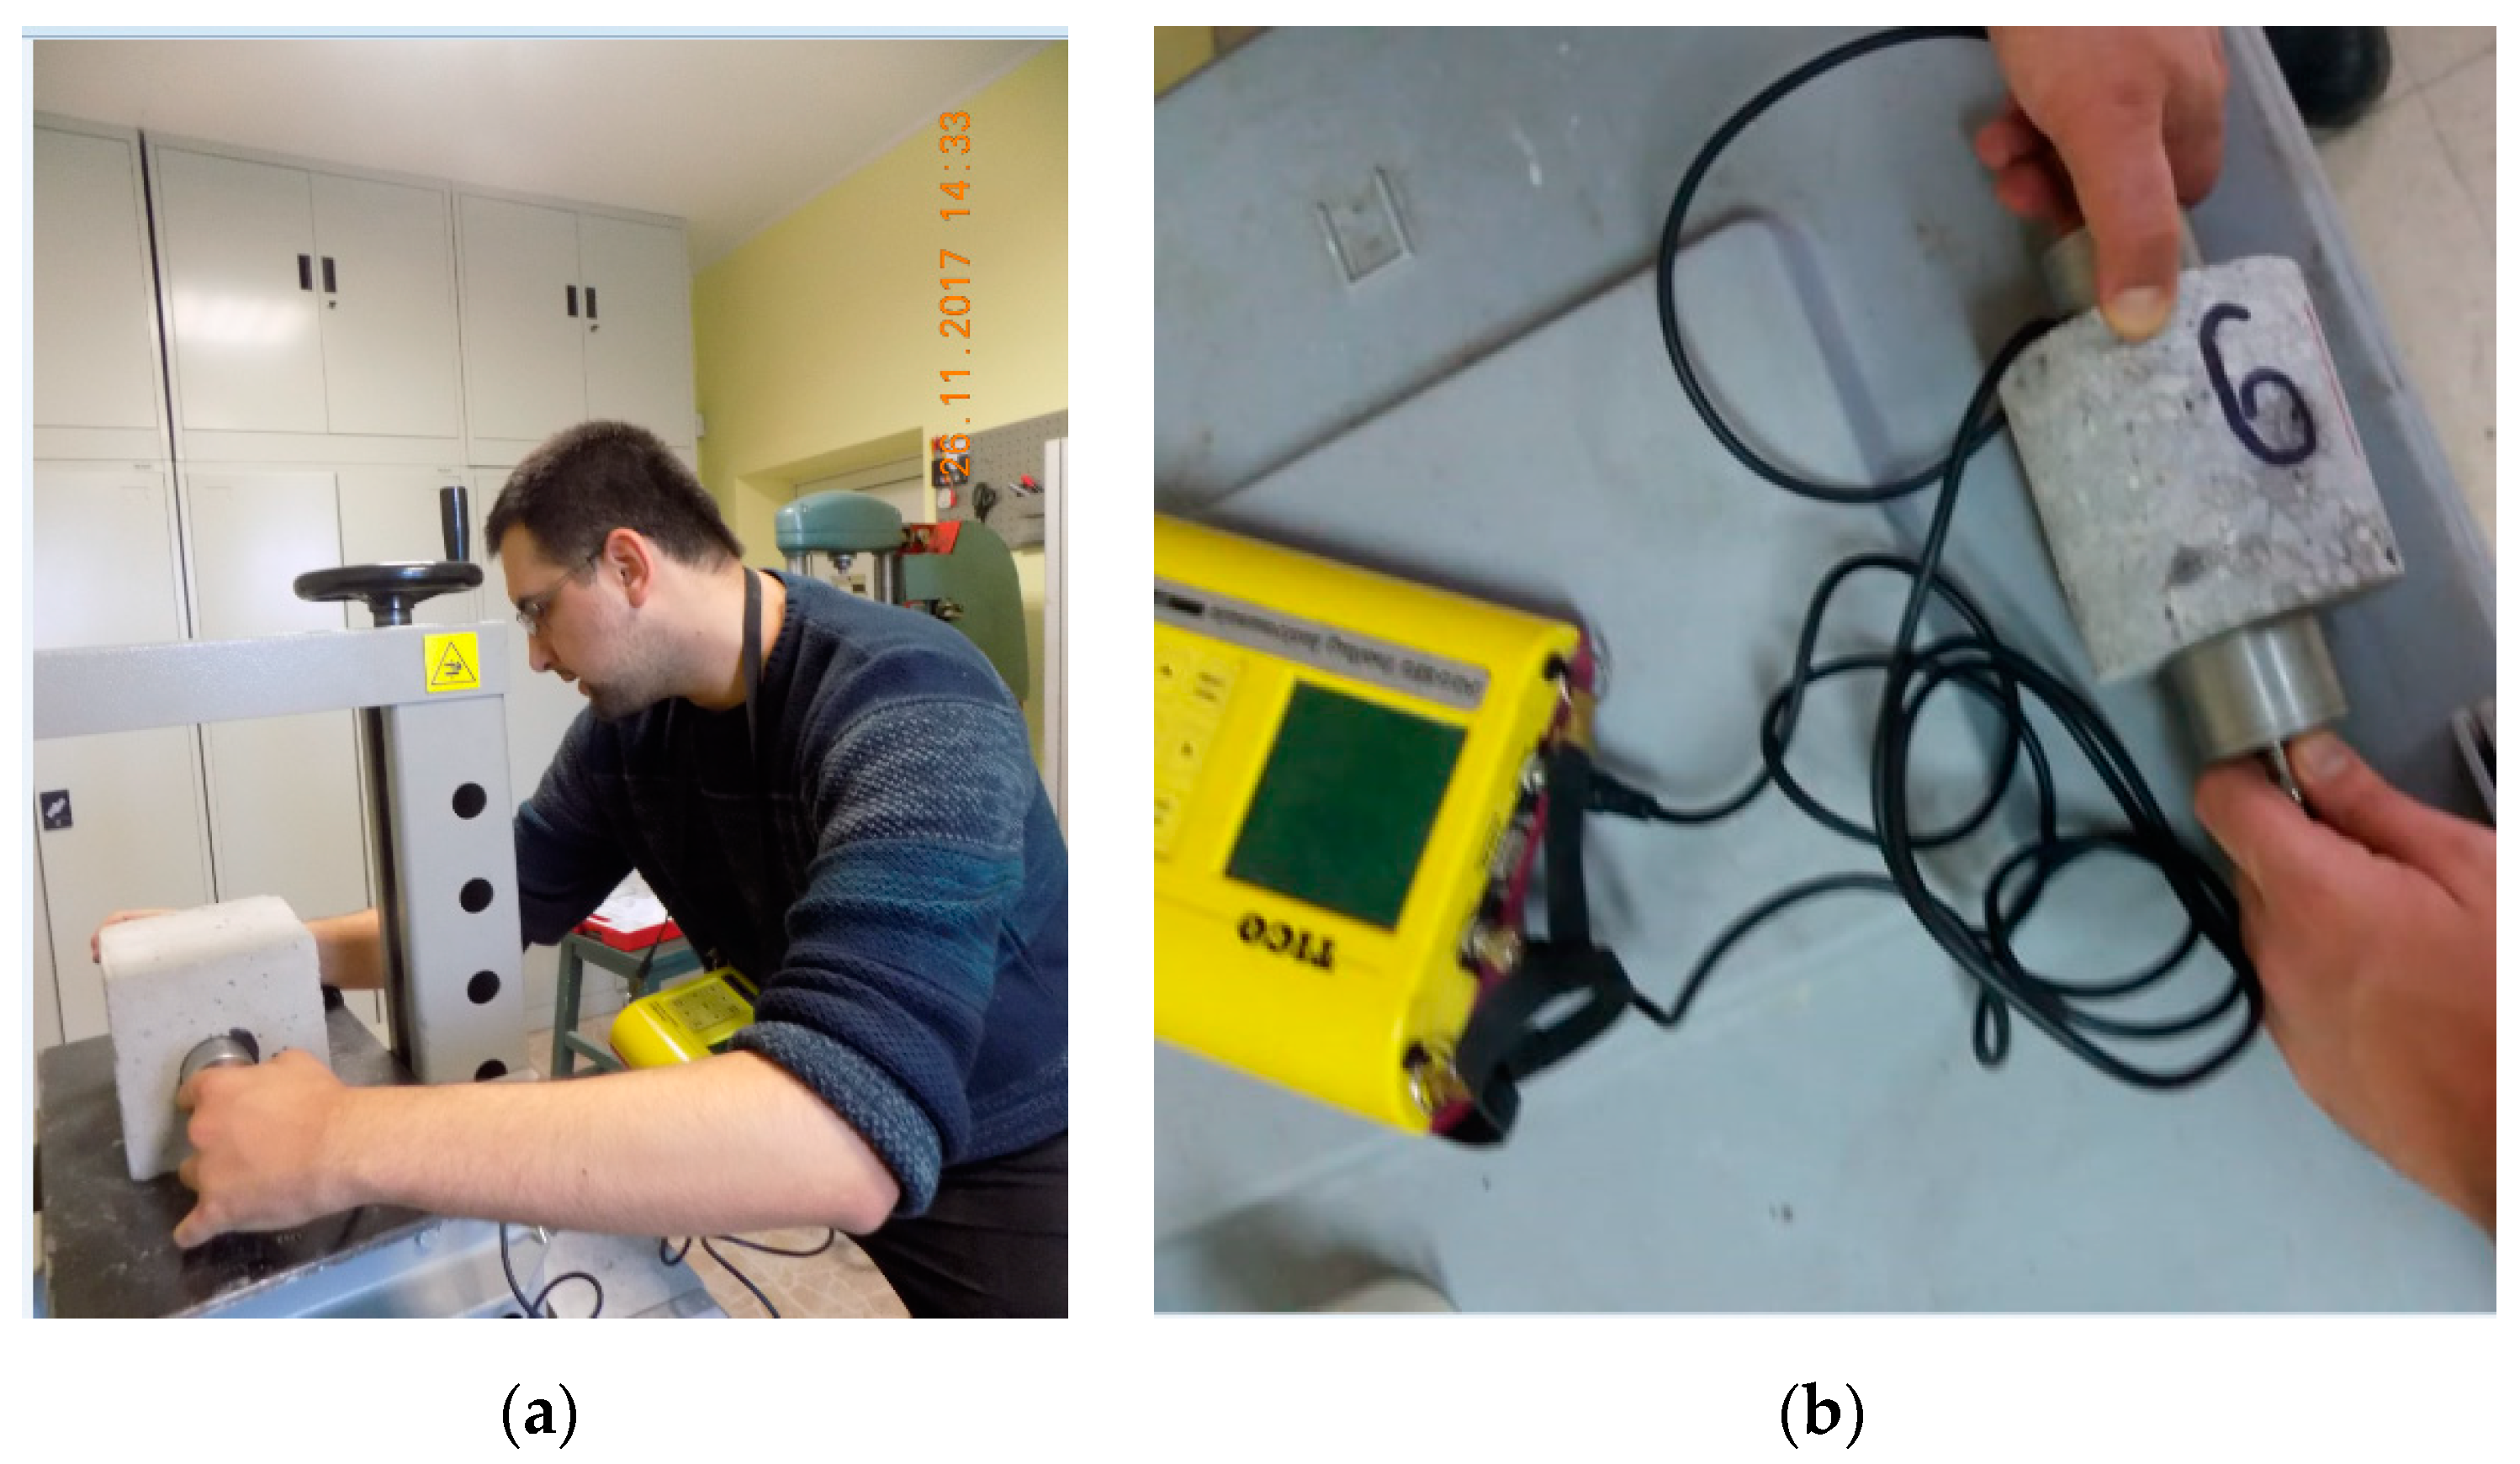
Ten measurements were performed for each specimen according to EN 12504-4 [49], as the transducers were placed symmetrically and opposite to each other (Figure 5). The device was calibrated with a reference cylindrical body.
For each test specimen (cube or core, the arithmetic mean value of the ultrasonic velocity V UPV , mean was determined and then f c , UPV was calculated.
The results regarding the probabilistic compressive strength of concrete, determined with UPVM at different concrete ages, were calculated using two approaches: approach 1— f c , UPV , app 1 (Equation (1)) and approach 2— f c , UPV , app 2 (Equation (2)). The value of the factor c in Equation (1) was assumed to be equal to 0.158 [3]. When determining f c , UPV , app 2 , the value of the air-dry density of concrete γ c   determined by formula (4) was used. The difference between this value and the one determined experimentally (based on the measurement and weighing of specimens) varies from 0.1% to 4.2%. The results are presented in Table 2.

4.4. Compressive Strength of Concrete, Determined via Destructive Testing of Test Specimens—Cubes and Cores

The class of concrete used was C25/30. To determine the cube compressive strength at different ages, the following specimens were tested (Table 3):
  • Three cubes with dimensions of 150/150/150 mm for each day at the ages of 28, 244, 280, 293 and 342 days;
  • Twelve cubes with dimensions of 150/150/150 mm on the 1126th day; and
  • Eleven cored specimens, taken from the reinforced concrete beams on the 1926th day. After cutting off their ends and preparing them for testing, the cores become cylinders of the same height and diameter, which were equal to 100 mm, i.e., according to EN 13791 [36]. The obtained compressive strength was equivalent to the compressive strength from the testing of 150/150/150 mm cubes.
For each test specimen, its mass and dimensions were determined.
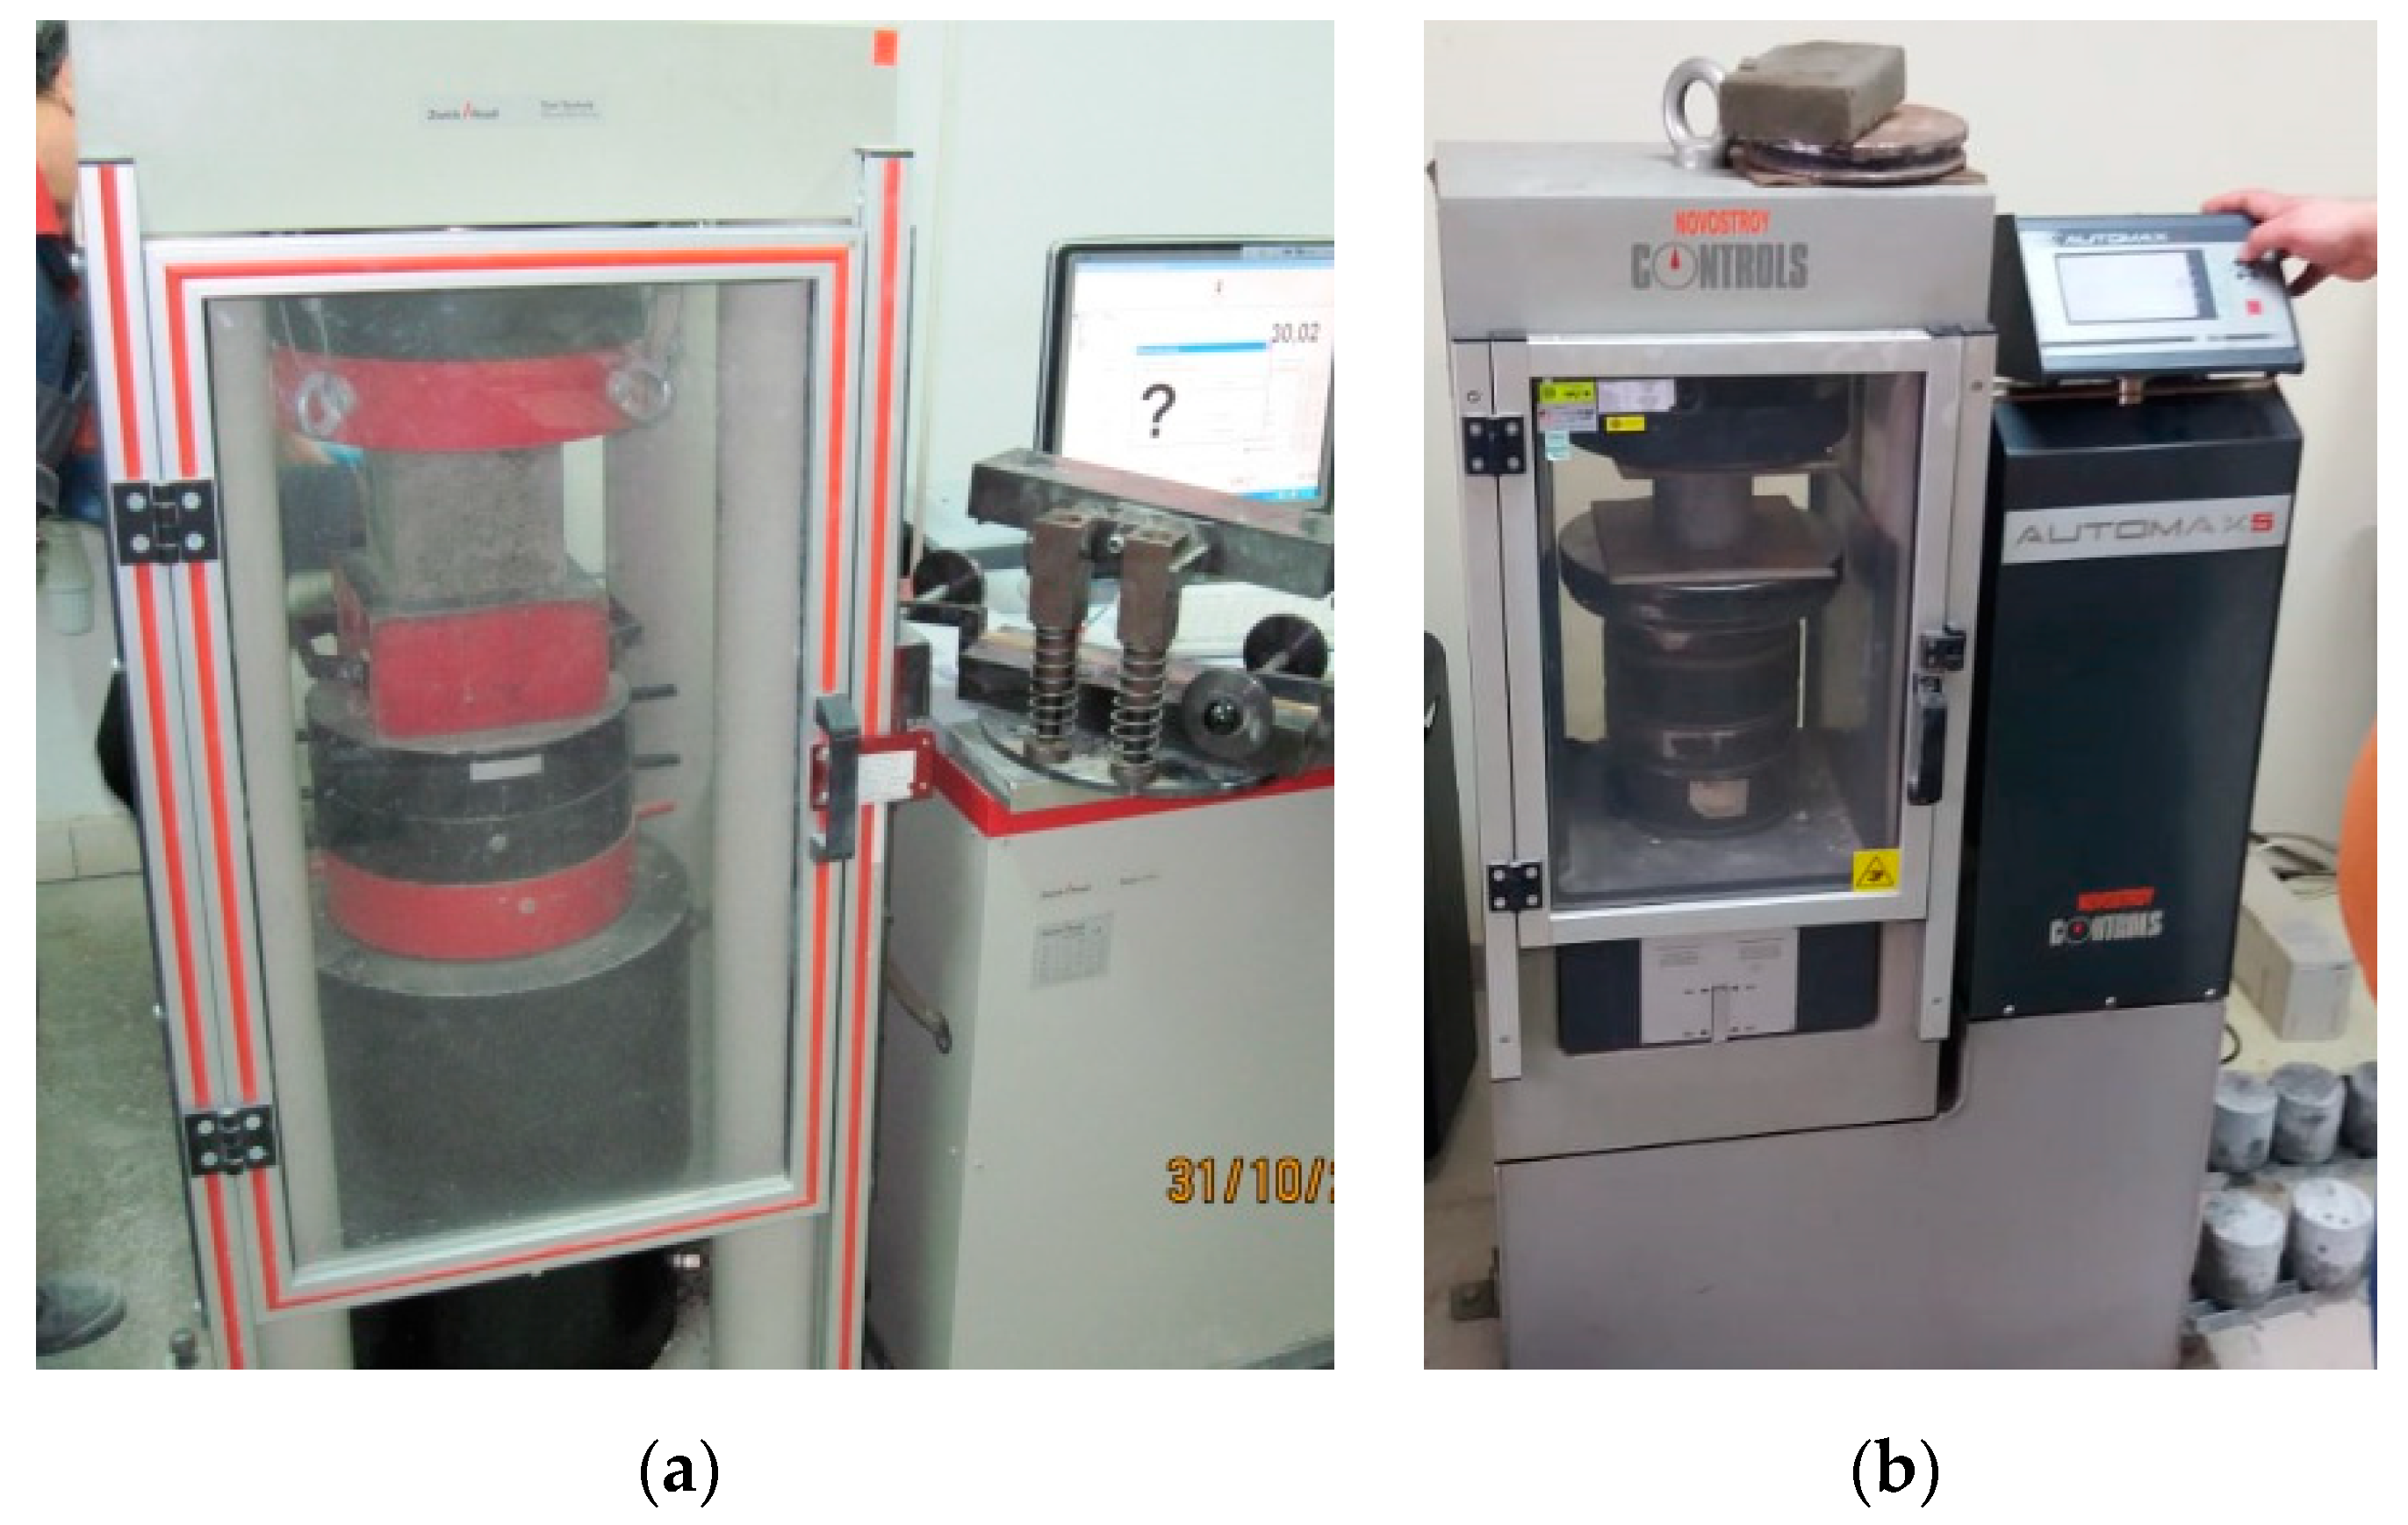
The compressive strength was determined according to EN 12390-3 [34]. The cubes were tested on compression until failure on a calibrated material testing machine from Zwick Roell Toni Technik with a range of up to 3000 kN (Figure 6a). A CONTROLS Automax 5 machine, type 50-C46V2 (Figure 6b), with a range of up to 2000 kN, was used to test the cores. Both meet the requirements of EN 12390-4 [35]. The loading rate of 0.5 MPa/s was constant. The load was applied to the test specimen without hitting until its failure. For each particular specimen, the type of failure was assessed, and we determined whether the test proceeded satisfactorily or unsatisfactorily according to EN 12390-3 [34]. For cube specimens, failure type was considered satisfactory when all four exposed sides were cracked approximately equally and the surfaces in contact with the machine platens received little damage. For cylindrical specimens, the failure type was satisfactory when the entire surrounding surface was cracked approximately equally and the surfaces in contact with the machine platens received little damage. For all tests, the failure types obtained were satisfactory. Then, the force F was reported, and the compressive strength f c , cube was determined, which was obtained by dividing the maximum load by the cross-sectional area of the test specimen. The results are presented in Table 3.

4.5. Determination of the Compressive Strength of Concrete via the SonReb Method

The probabilistic compressive strength was determined using Equation 8 based on the correlation of the data obtained from destructive and non-destructive tests, and multiple regression statistical analysis was used to determine the constants a, b and c, which were 0.465, 1.055 and 0.340 for the samples aged from 28 to 1126 days, respectively, and for those ages 1926 days they were 0.5003, 0.390 and 1.9723, respectively. The results for the compressive strength are given in Table 4.

5. Processing of the Results and Discussion

The evaluation of the results for the compressive strength determined with the use of destructive and non-destructive methods was carried out by plotting the following dependencies.

5.1. Compressive Strength for Different Ages of Concrete

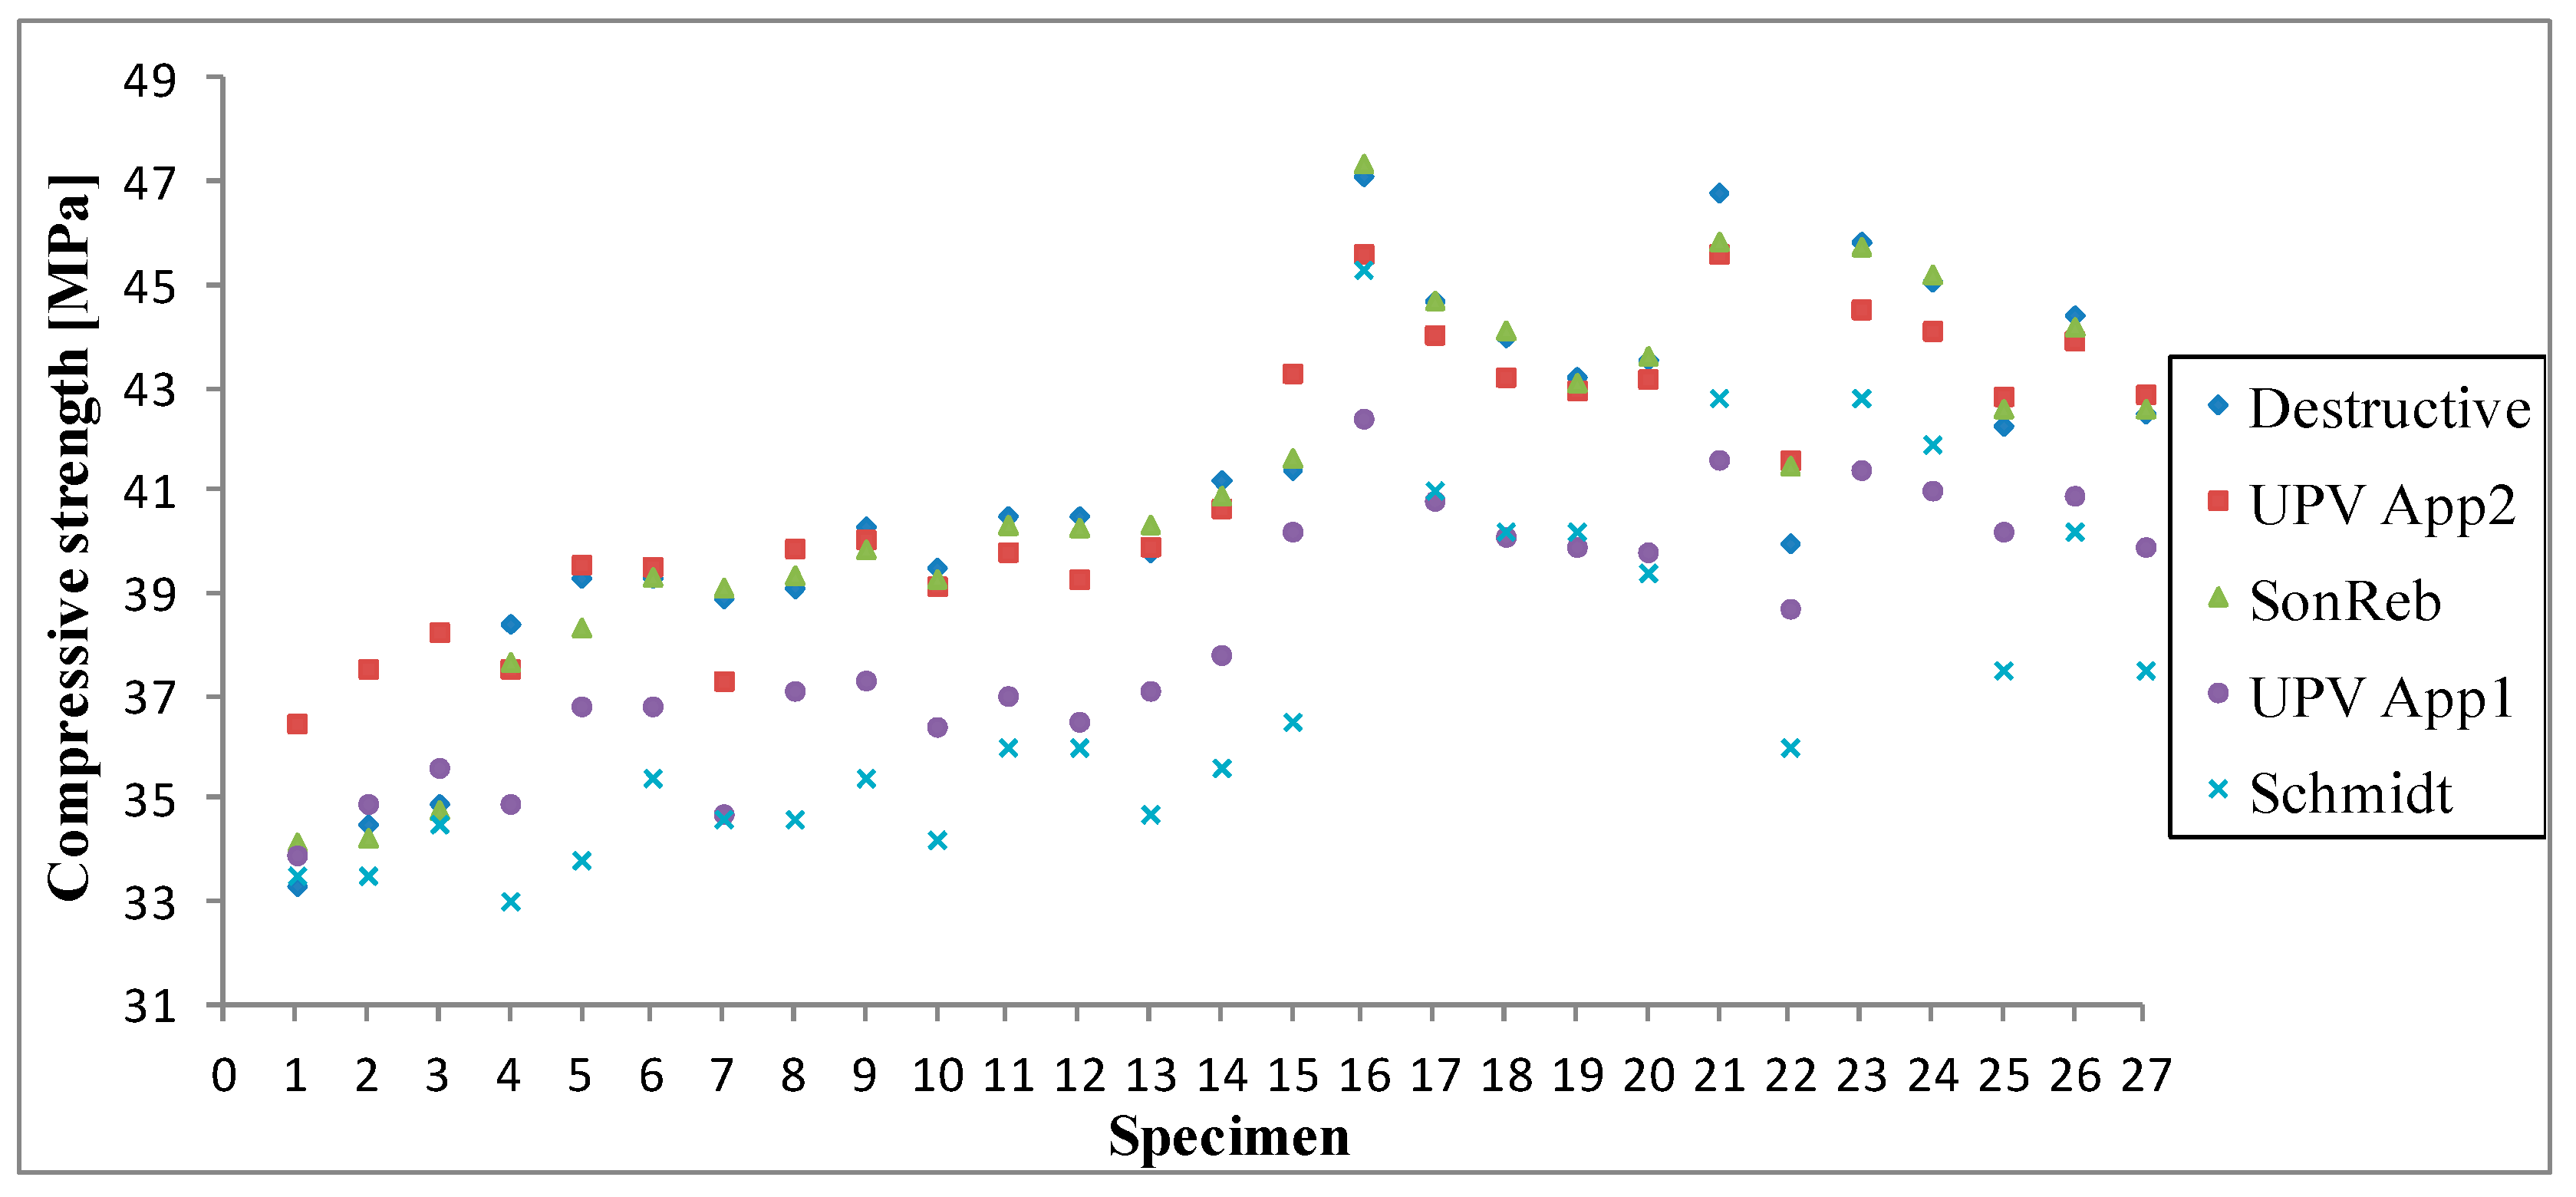
Figure 7 presents the obtained compressive strengths of concrete determined based on its surface hardness and ultrasonic signal velocity using two approaches, SonReb and the destructive method with the testing of 27 cubes (specimens) on different days. Figure 8 presents the obtained compressive strengths of concrete determined based on its surface hardness and ultrasonic signal velocity using two approaches, SonReb and the destructive method with the testing of 11 cores at the age of 1196 days.
The compressive strength value f c , Schmidt , ranged from 33.0 to 59.1 N / mm 2 , f c , UPV , app 1 from 33.9 to 60.1 N / mm 2 , f c , UPV , app 2 from 36.5 to 54.8 N / mm 2 , f c , SonReb from 34.1 to 53.2 N / mm 2 and f c , cube from 33.3 to 52.5 N / mm 2 .
The closest to the reference values of the compressive strength of concrete obtained by the destructive method were the results obtained with SonReb and with the method using ultrasonic velocity according to approach 2.

5.2. Relative Error in Determining Compressive Strength using Non-Destructive Methods

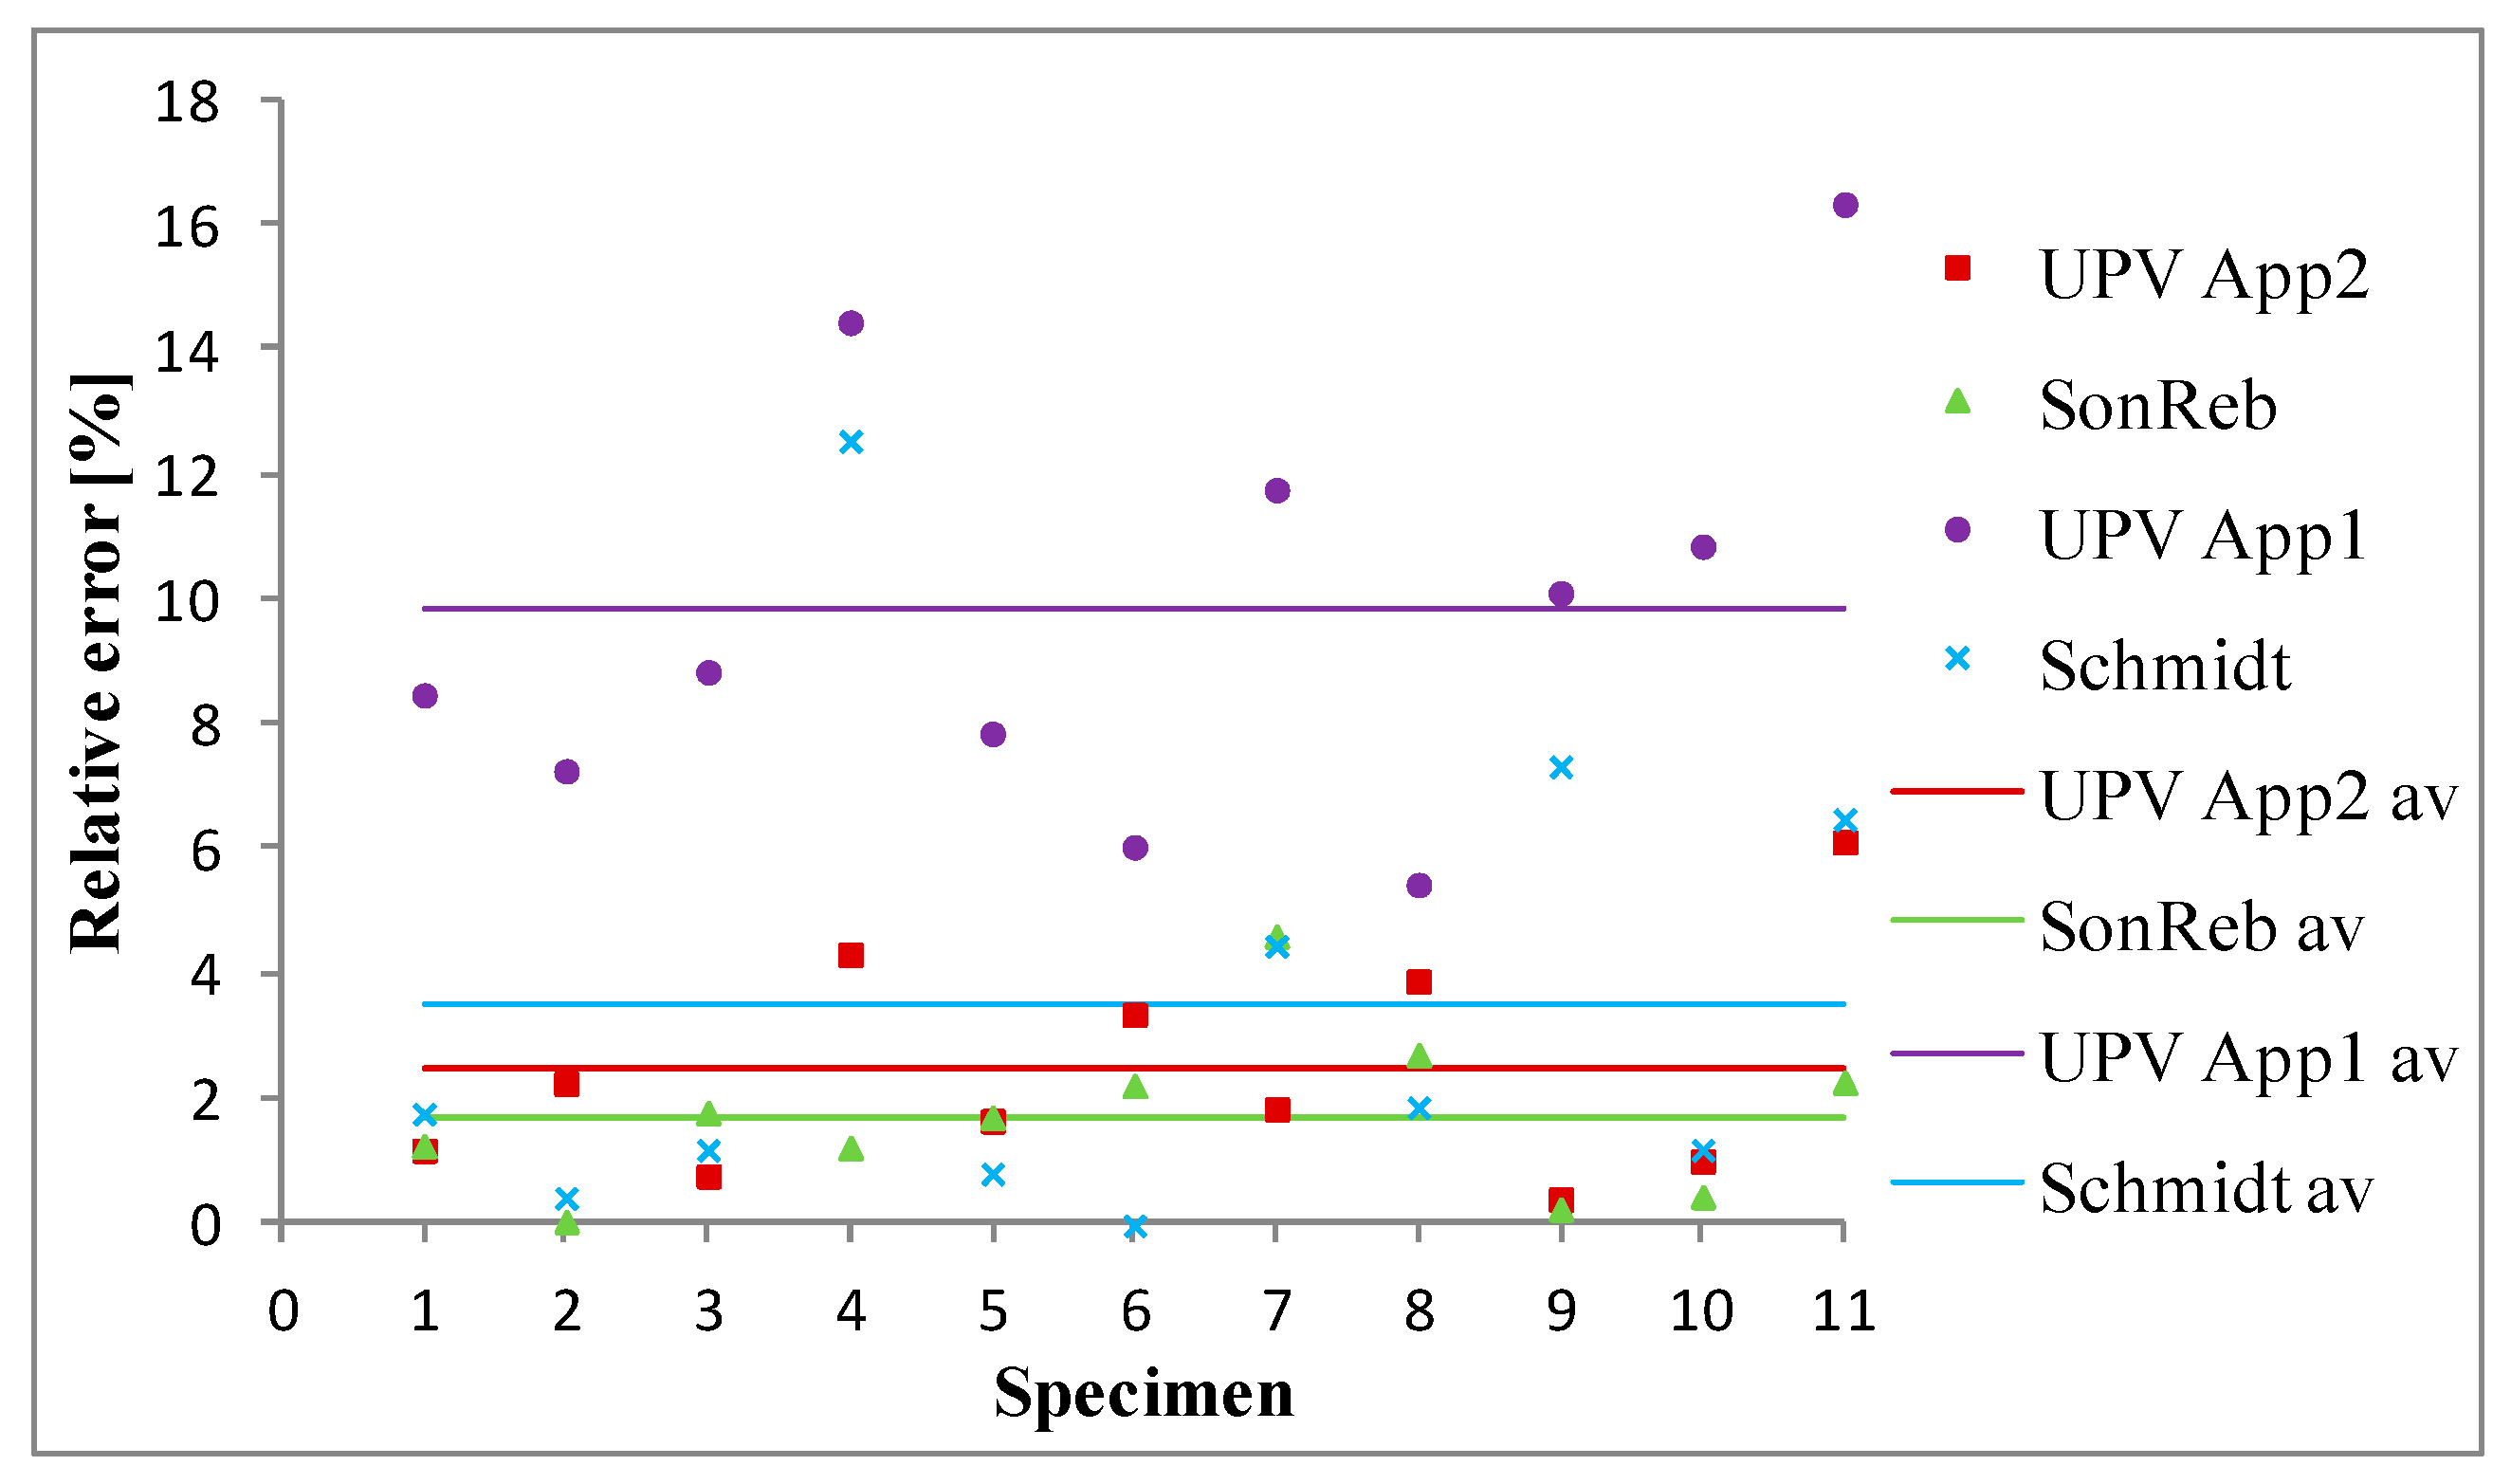
For concrete samples aged 28, 244, 280, 293, 342 and 1126 days, for each specimen, the relative error in determining the compressive strength of concrete with the elastic rebound method, the ultrasonic non-destructive method using two approaches and the SonReb method against f c , cube was calculated (Figure 9). The same was carried out for a concrete age of 1926 days (Figure 10). The reference value of the compressive strength of the concrete was the one obtained via destructive testing of cubes prepared on the day of laying the concrete mix or via the testing of cored specimens according to EN 12390-3 [34].
The relative error was determined using the formula:
ε % = f c , NDM f c , cube f c , cube .100   [ % ] ,
where   f c , NDM is the probabilistic compressive strength of concrete determined via a non-destructive method.
The relative error when using the Schmidt hammer ranged from 0 to 14.1%, with that of UPVM—approach 1 ranging from 1.2% to 16.4%, UPVM—approach 2 ranging from 0.3% to 9.6% and the SonReb method ranging from 0 to 4.6%. The smallest relative error was obtained using the SonReb method. The relative error calculated with the ultrasonic velocity approach using approach 2 was also acceptable.

5.3. Correlation between the Reference Compressive Strength of Concrete and That Determined via Different Non-Destructive Methods

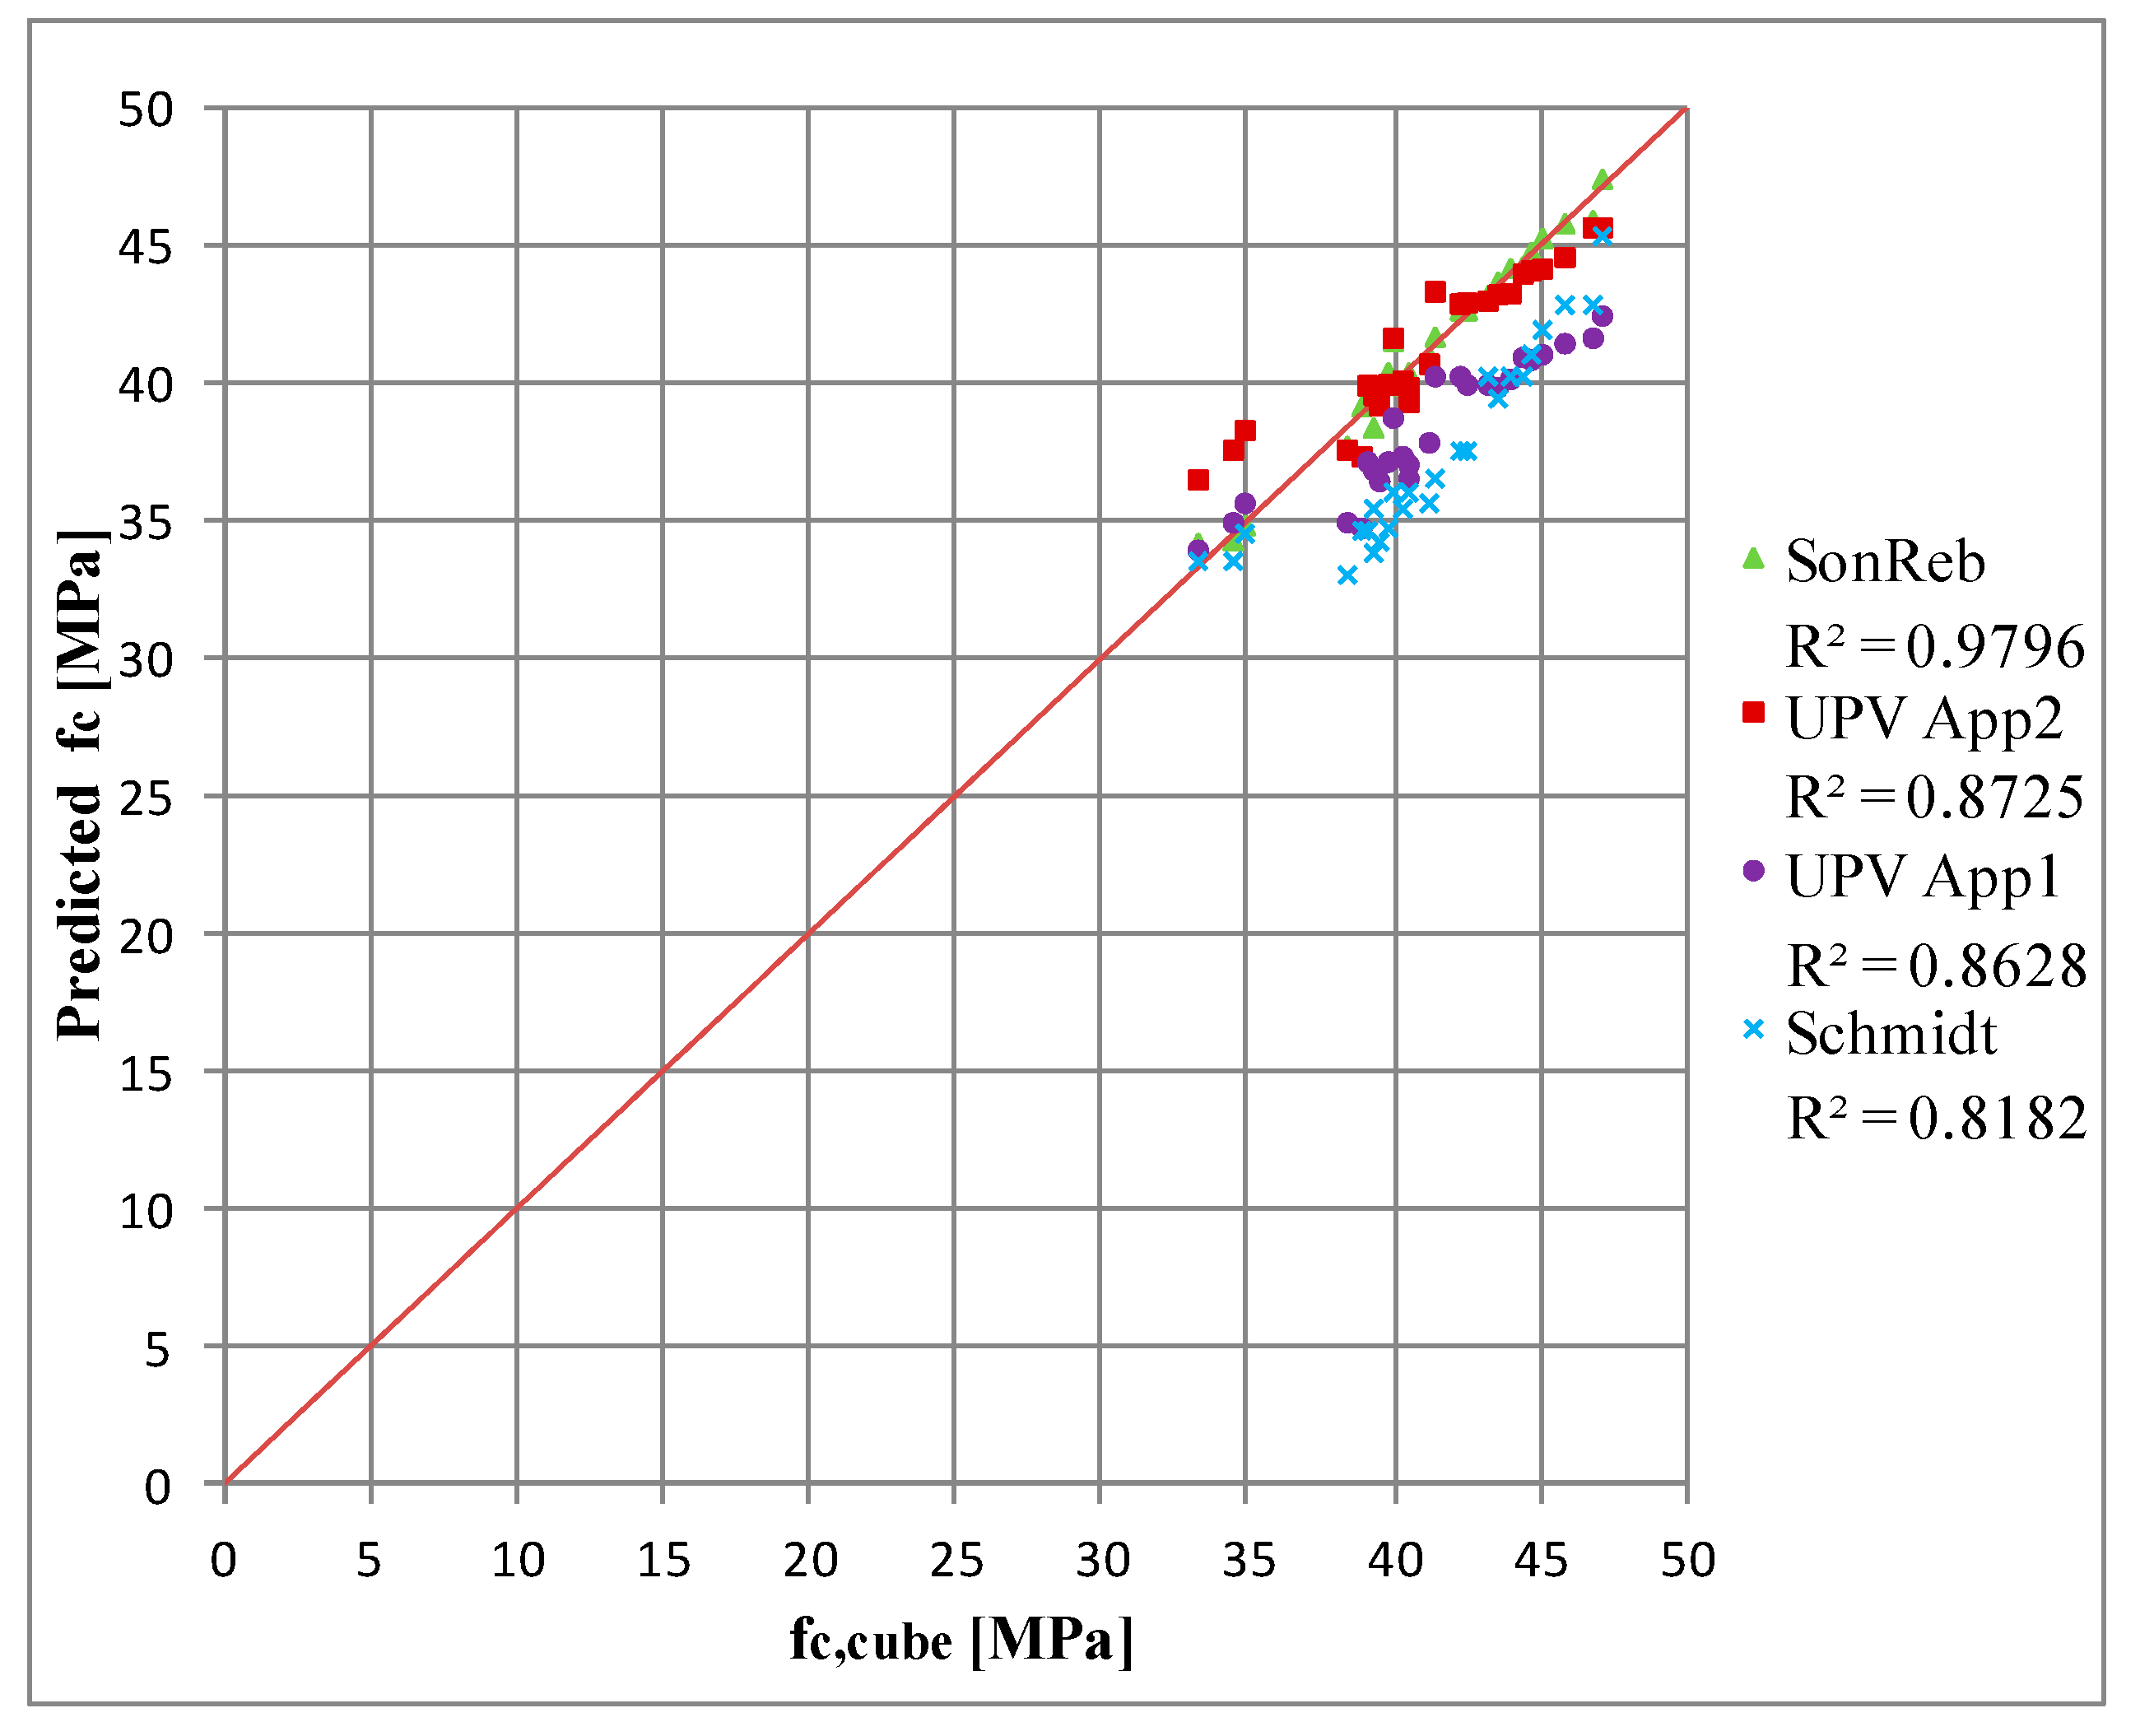
Figure 11 shows the dependence of the reference compressive strength f c , cube on the probabilistic strength determined by the elastic rebound method f c , Schmidt , with both approaches using the ultrasonic velocity approach, f c , UPV , app 1 ,   f c , UPV , app 2 and with the SonReb method, f c , SonReb , for concrete samples aged 28, 244, 280, 293, 342 and 1126 days, and the results for those aged 1926 days are shown in Figure 12.
We preferred to construct the function graph in Microsoft Excel because the resulting graphs are easy to understand and provide an opportunity to analyze the numerical data. The accuracy of the experimental results of the non-destructive tests correlation with the reference compressive strength values can be evaluated using the R 2 parameter. The closer the R 2   value is to 1, the more accurate the correlation between the data. In tests conducted on the 28th, 244th, 280th, 293rd, 342nd and 1126th days (Figure 11), the R 2 value for the SonReb method was the highest and was equal to 0.9796, whereas that obtained using UPVM approach 2 was 0.8725, for UPVM approach 1 it as 0.8628 and for the elastic rebound method it was 0.8182. In tests conducted on the 1196th day (Figure 12), the R 2 value obtained for the SonReb method was the highest and was equal to 0.8824, whereas that obtained for UPVM approach 2 was 0.8732, that for UPVM approach 1 was 0.8742 and the value obtained using the elastic rebound method was 0.8011.
The correlation was best when using the SonReb method and was the smallest when using the elastic rebound method.

5.4. Evaluation the Accuracy of the Compressive Strength Determined Using Non-Destructive Methods Compared to Reference Values

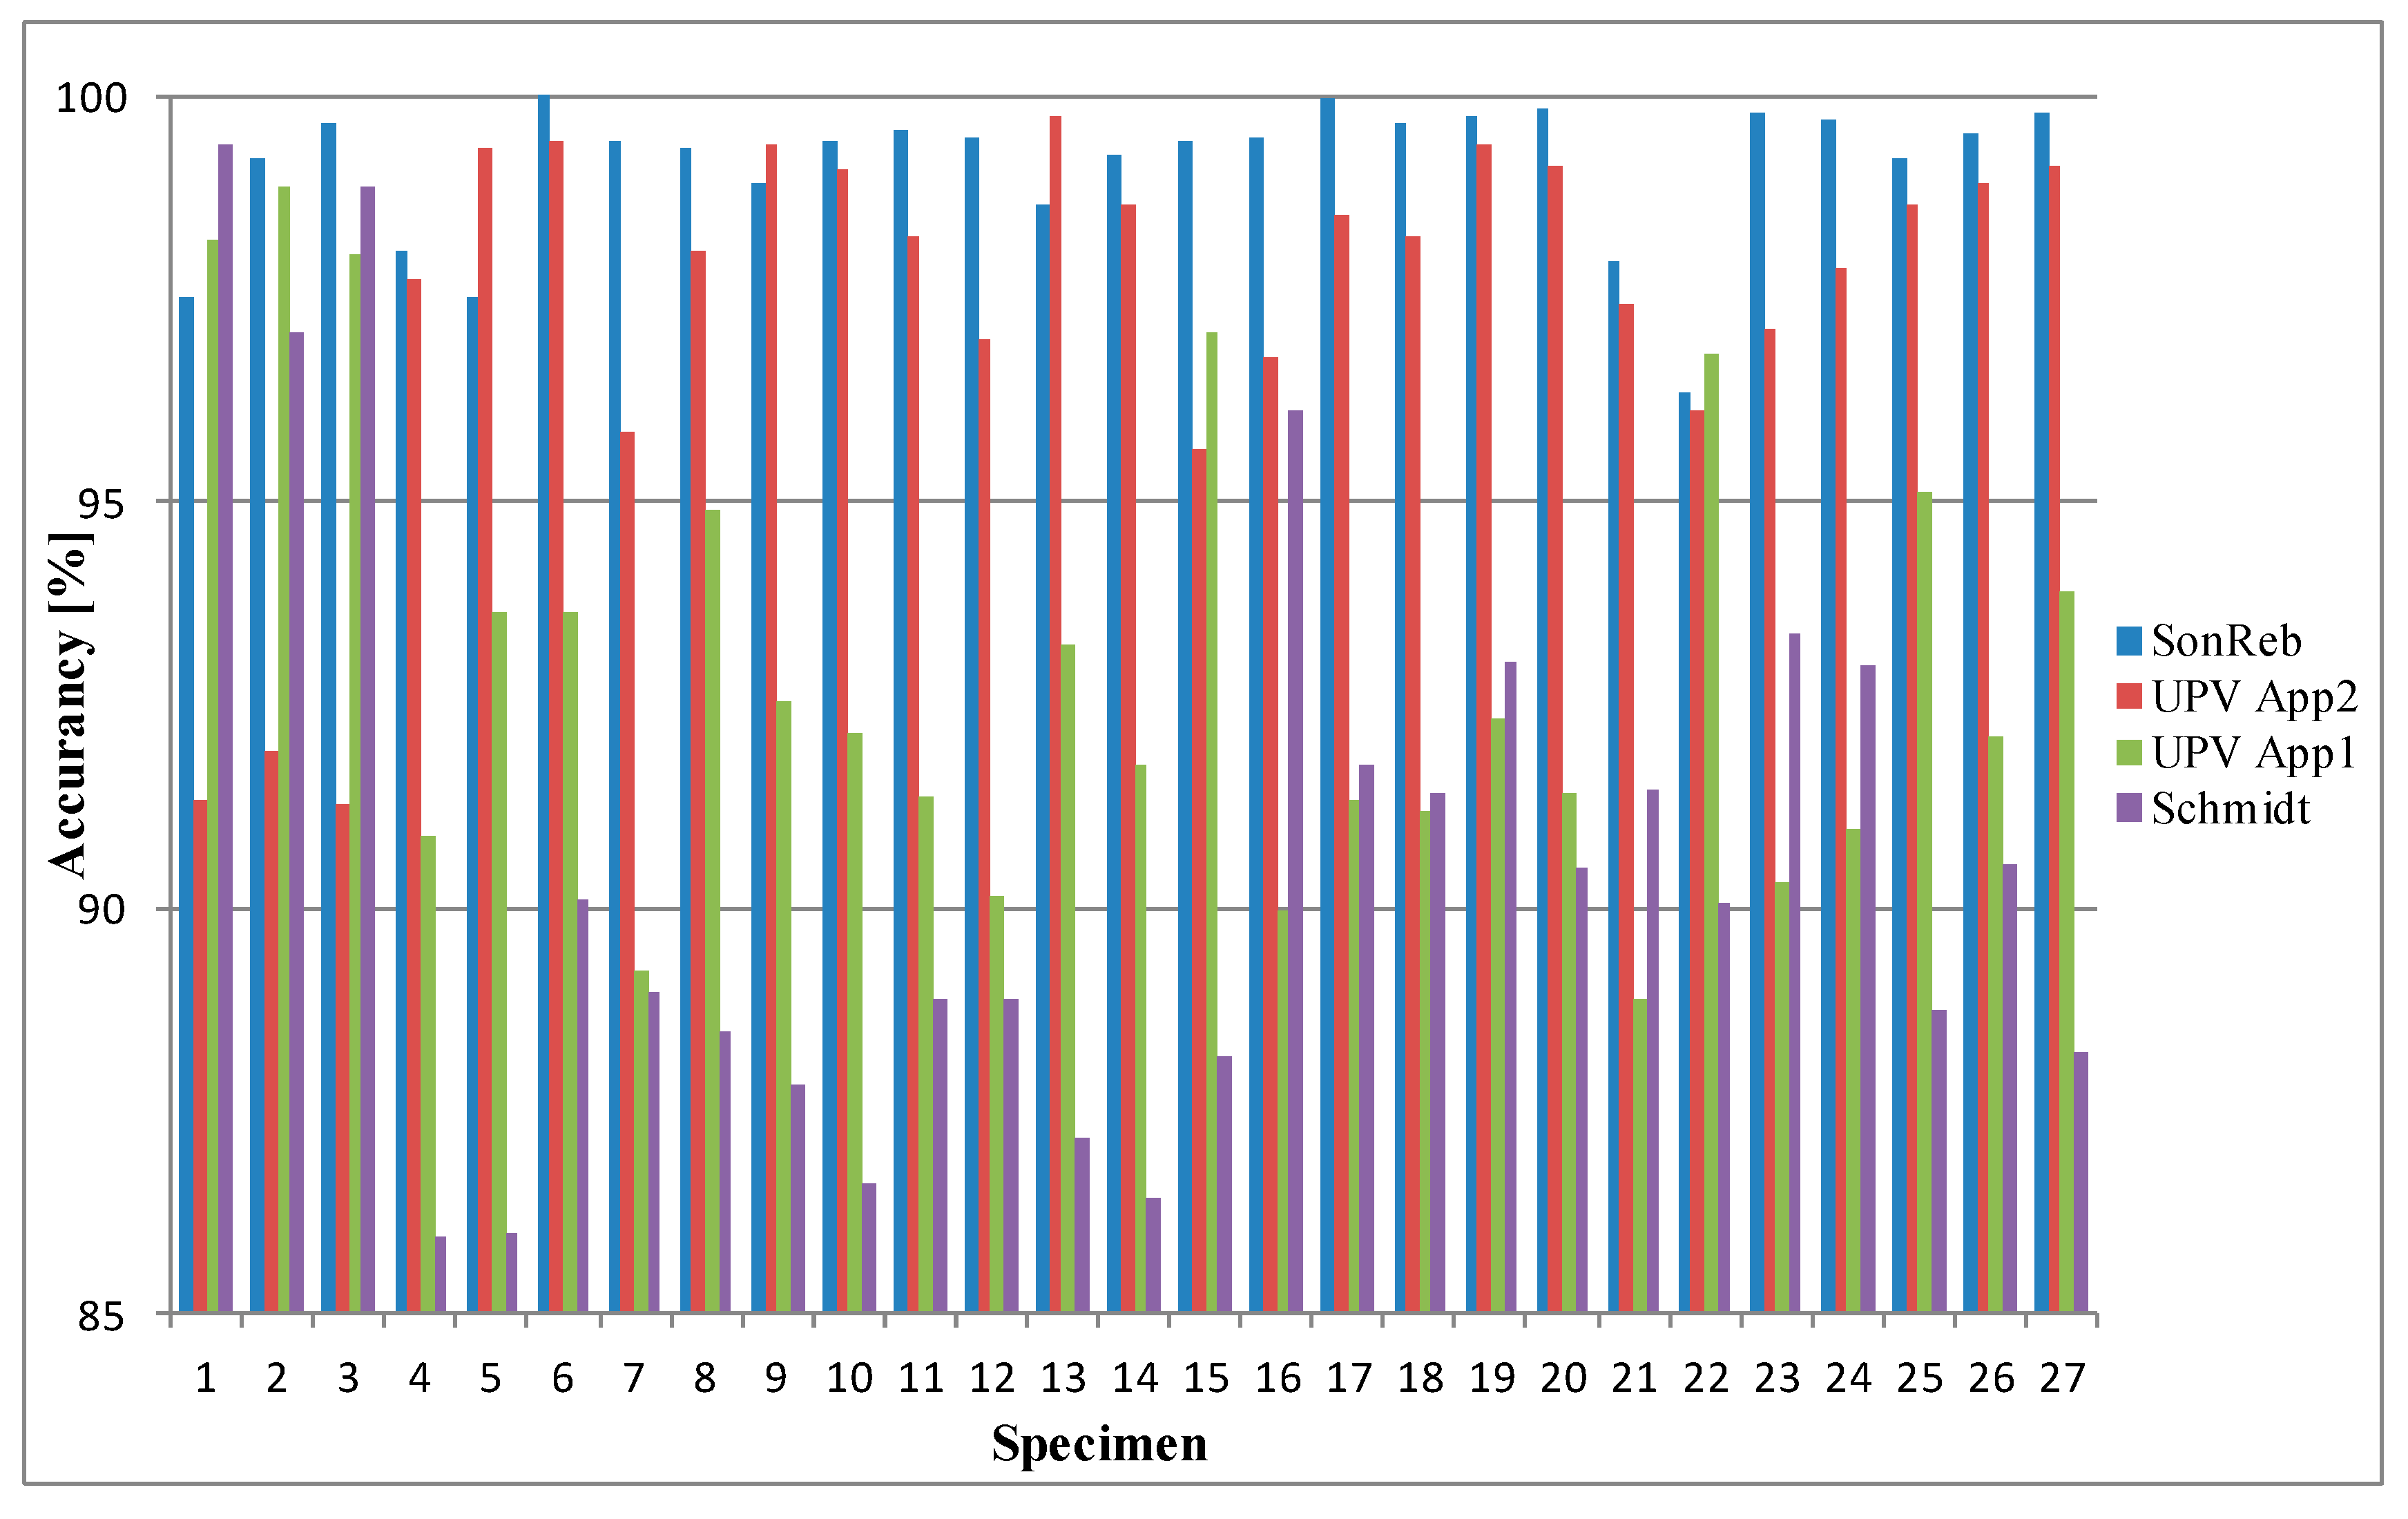
Accuracy (%) was calculated as the ratio of the reference concrete compressive strength for a given specimen to the probabilistic strength determined using a non-destructive method. Probabilistic compressive strength for given specimen was determined from median value of the rebound when using Schmidt hammer, and from mean value of the ultrasonic pulse velocity when using UPVM for calculation by both approaches. The same values were used in the SonReb method.
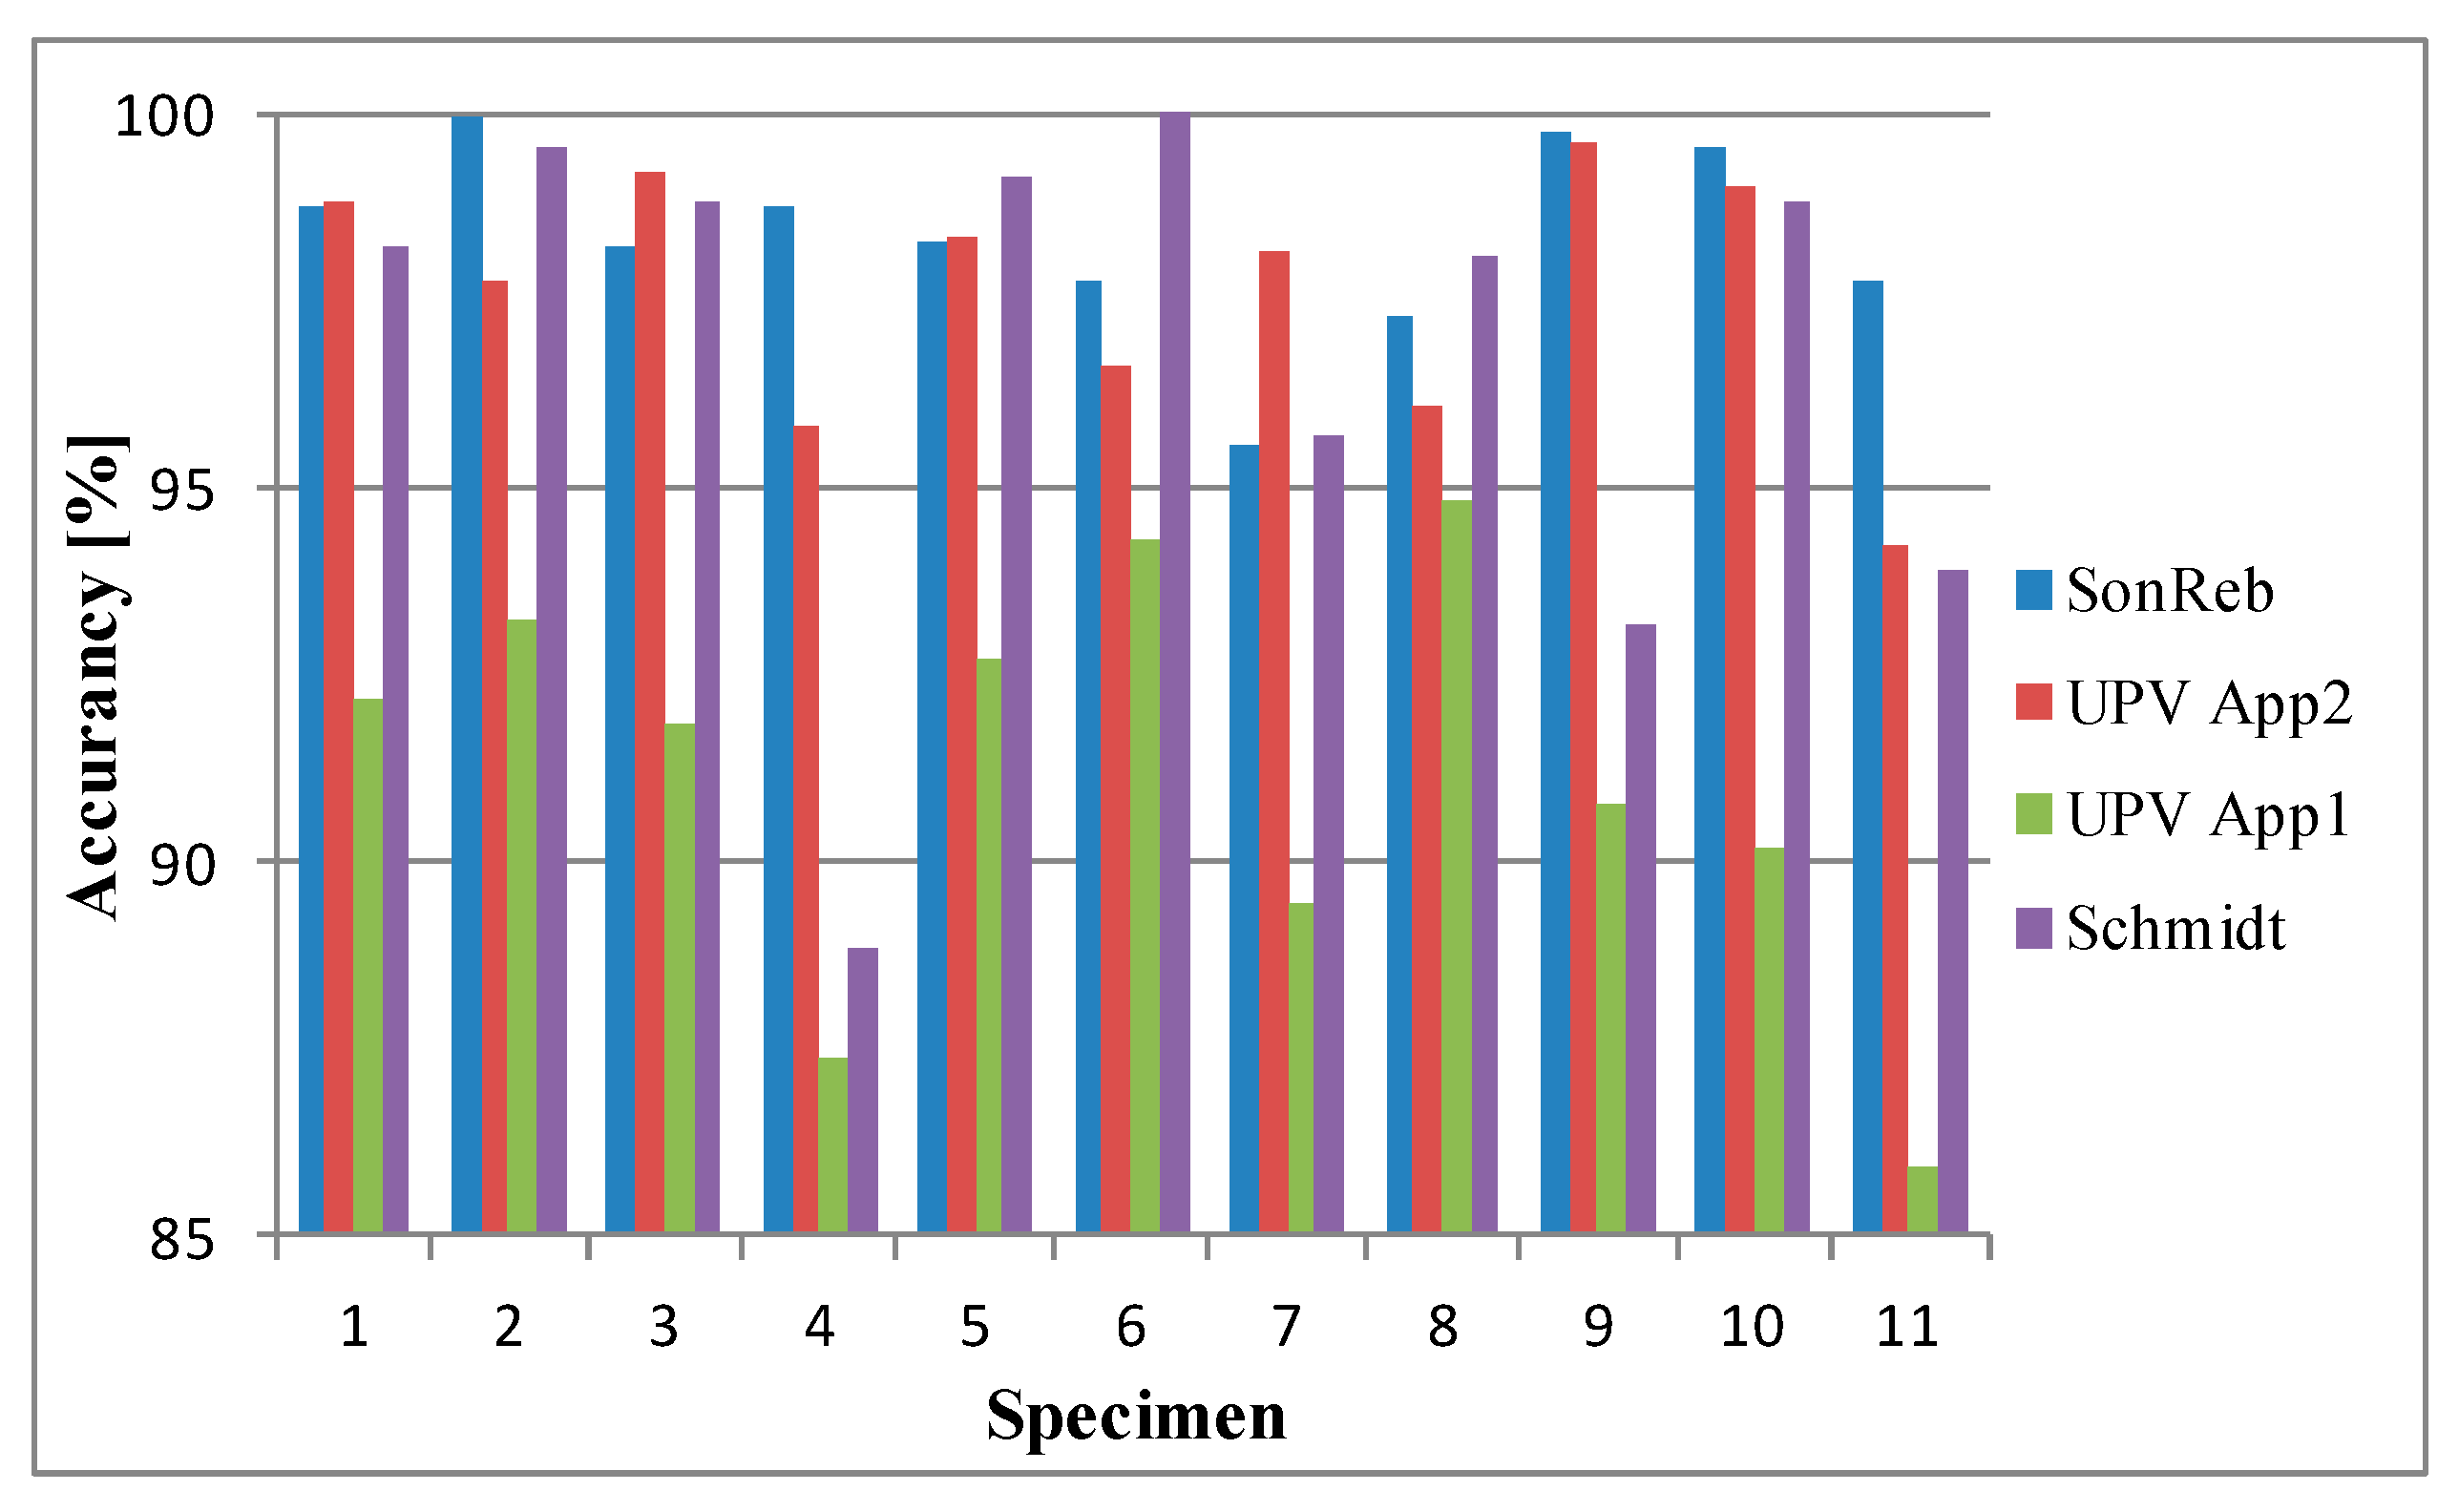
Figure 13 presents the accuracy of the elastic rebound method, the ultrasonic method using both approaches and the SonReb method in the experimental determination of concrete compressive strength compared to reference values based on the testing of 27 cubes at ages of 28, 244, 280, 293, 342 and 1126 days. Figure 14 shows the accuracy obtained in the testing of 11 cores at a concrete age of 1926 days.
The highest accuracy was observed when using the SonReb method—from 96% to 100%, followed by UPVM—from 91% to 100% when using approach 2, whereas the lowest accuracy was obtained when using approach 1—from 86% to 99%—and with the elastic rebound method—from 86% to 100%.

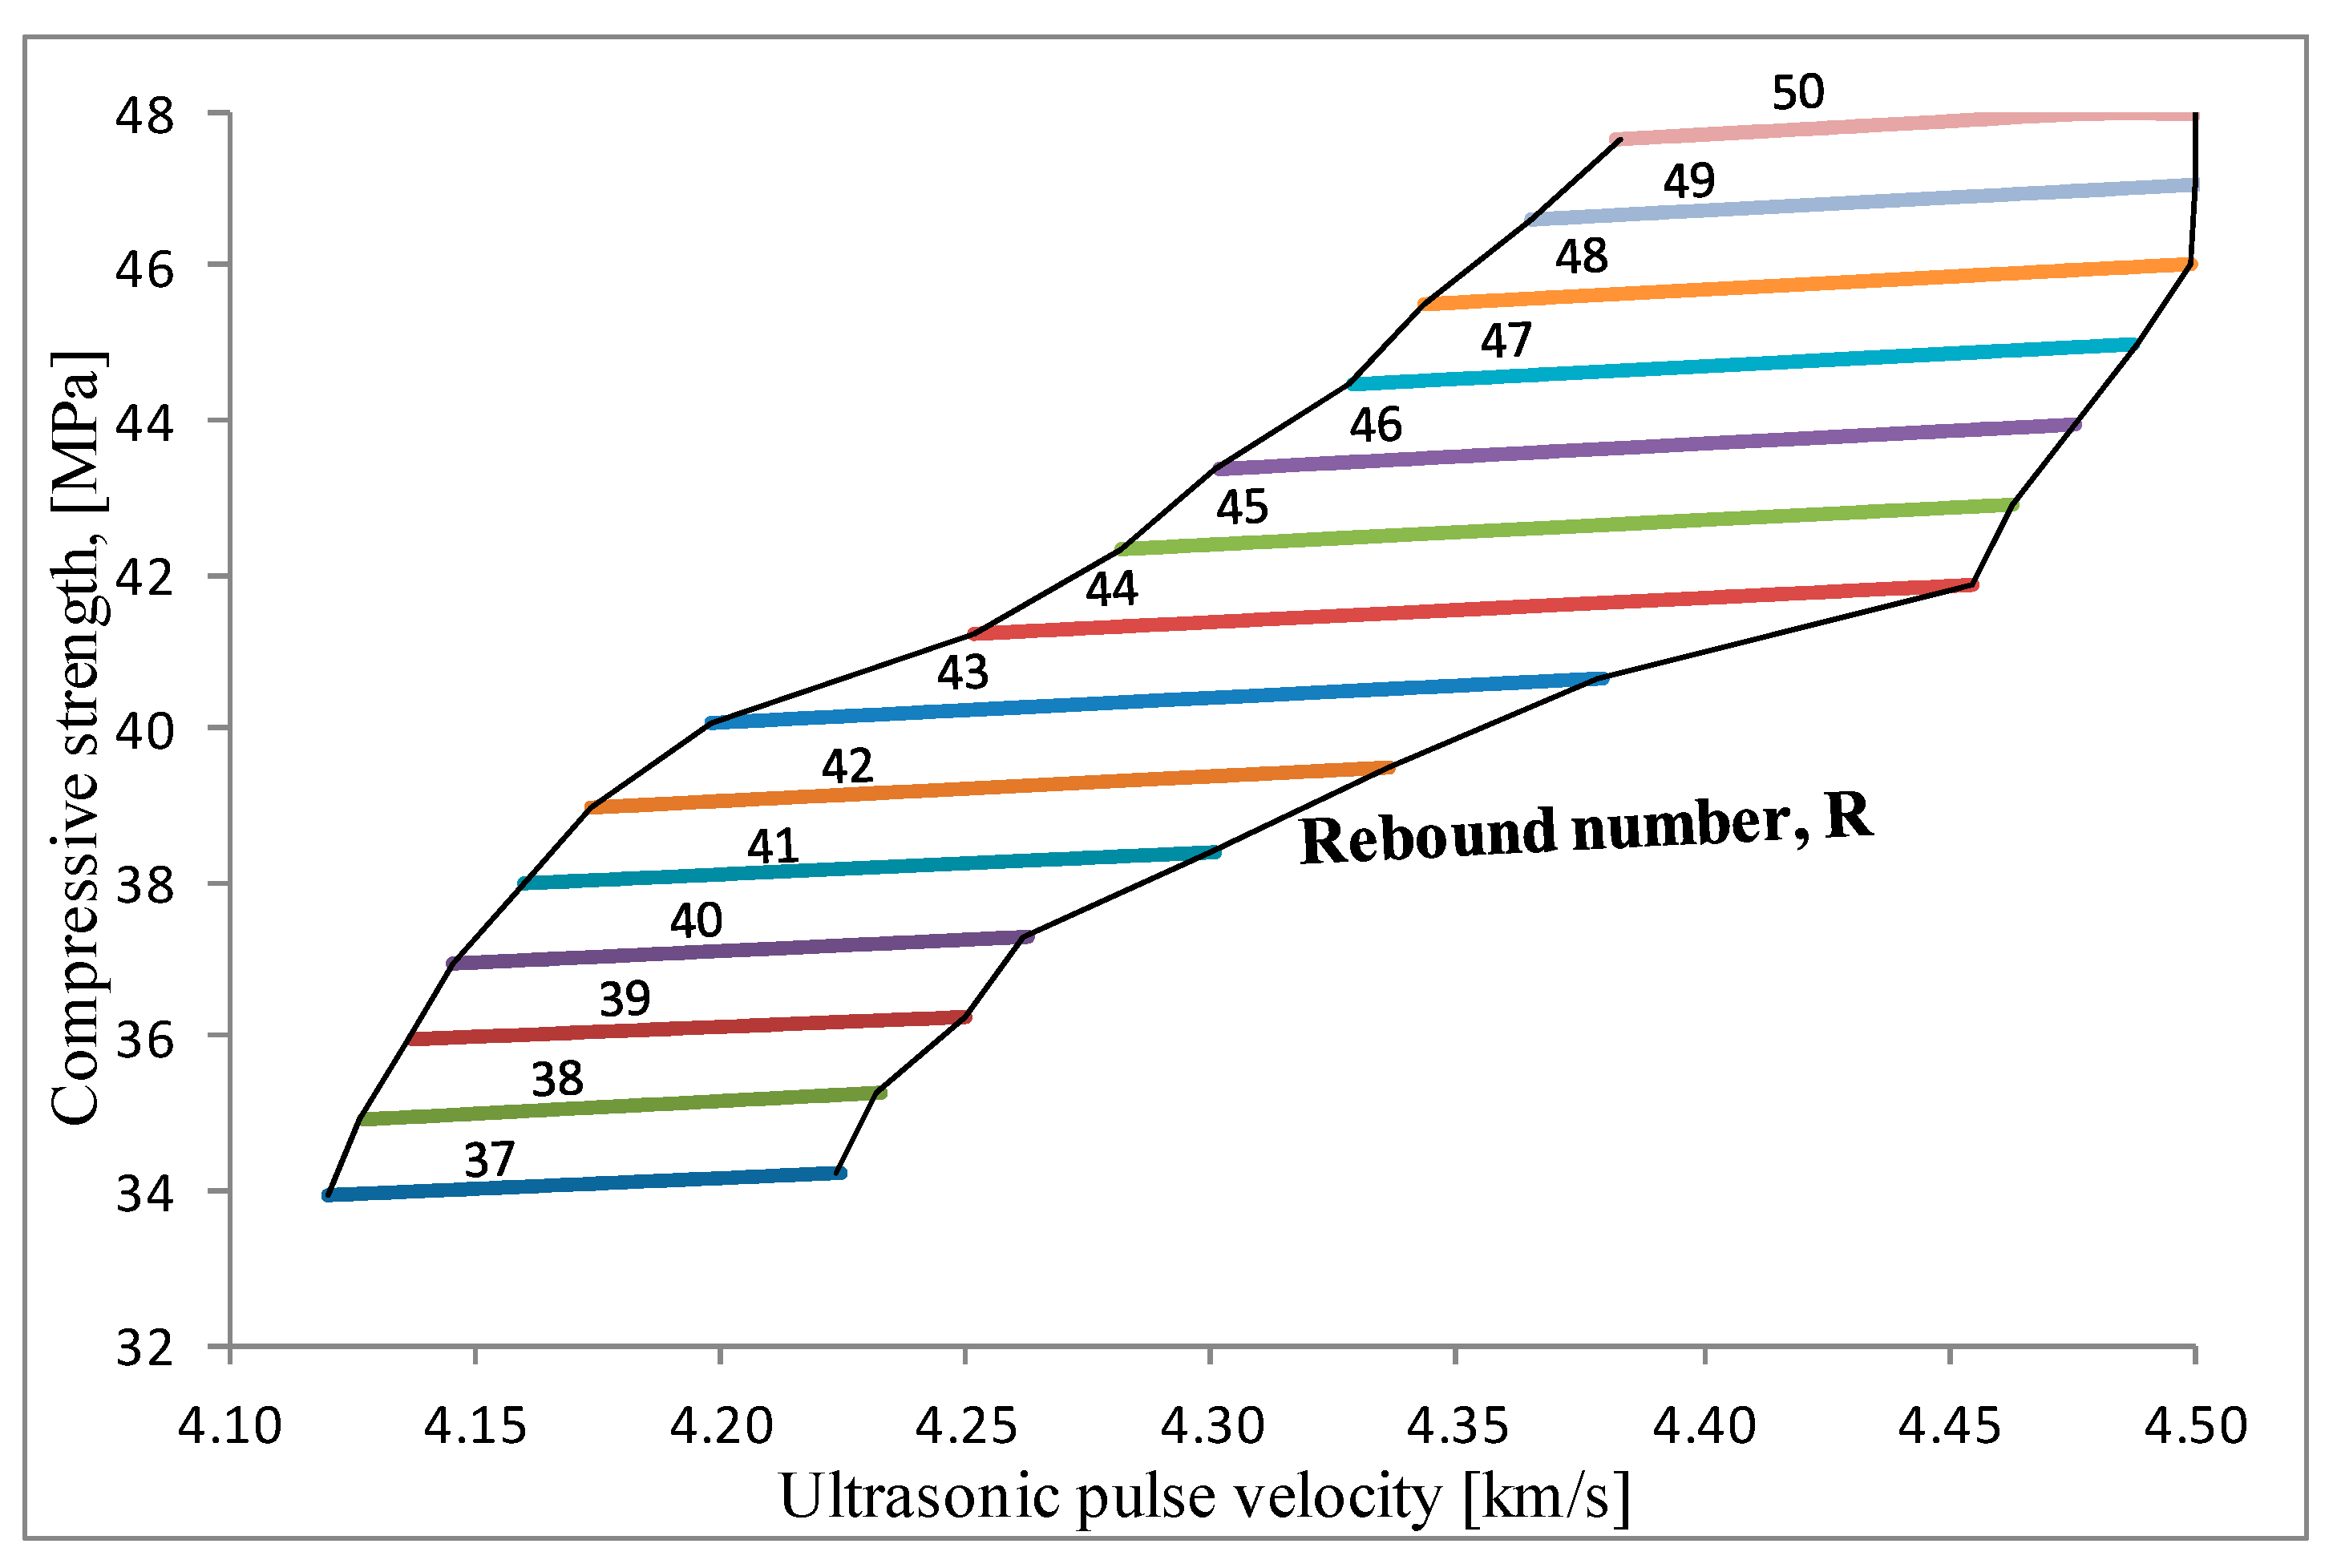
5.5. Typical Multiple-Correlation Relationship in the Form of a Nomogram for the Determination of Concrete Compressive Strength

In experimental studies of reinforced concrete structures of buildings and facilities, it is very convenient to plot nomograms in order to determine the compressive strength of the f c , SonReb values of concrete at an arbitrary point of the structure. Multiple-correlation relationships were obtained based on the concrete strengths determined in the testing of cored specimens or cubes, the results concerning the rebound number obtained using a Schmidt hammer, and the ultrasonic pulse velocity at a sufficient number of test points in the structure. Using these curves for arbitrary locations of the structure, the value of the compressive strength f c , SonReb can be determined solwly on the basis of the results of non-destructive methods. This reduces the number of cores that need to be taken and leads to a reduction in the weakening of existing structures.
Based on the power dependencies obtained from Equation (8), with the corresponding coefficients a, b and c, nomograms were drawn in Microsoft Excel. For concrete ages ranging from 28 to 1126 days, the nomogram shown in Figure 15 can be used, and for the age of 1926 days, the nomogram shown in Figure 16 can be used.

6. Conclusions

Concrete is one of the oldest building materials and it will continue to be widely used as the main structural material in the construction of buildings and facilities. The most important parameter of concrete is its compressive strength, and its determination using different methods continues to be a topical issue.
The author’s experimental research to determine the compressive strength of concrete was carried out over 6 years. The publication of the results in this paper was dictated by the fact that, regardless of the many methods developed and conducted over the years and the ongoing studies by many researchers, there is a lack of a universal algorithm for an effective and reliable assessment of the compressive strength of concrete. The determination of this information is still a goal in scientific circles.
Based on this study to determine the compressive strength of concrete, the following conclusions can be drawn.
  • The results of the destructive tests were used as a reference and compared with those obtained using the elastic rebound method, UPVM (using two approaches) and the SonReb method. The compressive strength value observed in the destructive testing of test specimens ranged between 33.3 and 52.5   N / mm 2 . In determining the number of tests and the number of methods used, the aim was to achieve the lowest price.
  • The relative error when using the elastic rebound method was large and reached 14.1%. The accuracy was low compared to the other non-destructive methods used in the experiments. The results regarding the rebound number were used in obtaining correlation curves for the tested specimens. This method is suitable for the rapid investigation of a large number of concrete or reinforced concrete structural elements in laboratory and field tests. To reduce the influence of different factors, the test should be repeated at least 10 times within each test region.
  • The relative error when using UPVM according to approach 2 was smaller (from 0.3% to 9.6%) compared to that observed using UPVM according to approach 1 (from 1.2% to 16.4%) and the elastic rebound method. Accuracy was greater when using approach 2 compared to approach 1 and the elastic rebound method. The results obtained regarding the ultrasonic signal velocity were used to develop correlation curves for the tested specimens. The method provided reliable results, the measurements were fast, the required equipment was relatively cheap.
  • When using a combination of methods, as with the SonReb method, more reliable results were obtained, with values close to the reference values. The relative error in this method was the smallest and reached 4.6%. The accuracy of this method was the highest (from 96% to 100%) compared to that of the other non-destructive methods used. The regression analysis performed and the correlation curves obtained in this study can be used to determine the compressive strength of concrete at any point of the entire structure solely on the basis of non-destructive testing, provided that the concrete used is the same.
  • The created nomograms could help to optimize the process of evaluating and tracking the compressive strength and behavior of concrete in the future monitoring and quality control of the investigated reinforced concrete elements. Only measurements of the rebound number with the elastic rebound method and the ultrasonic pulse velocity with UPVM are required to be made.
  • The use of these nomograms for other reinforced concrete structures with similar or different concrete compressive strength values may lead to large errors and inaccuracies in the assessments.
The interpretation of the obtained results should be carried out by experienced engineers capable of analyzing deviations and inaccuracies that appear during the testing. If the measurements are carried out by persons with a lack of qualifications, the results may be interpreted incorrectly, leading to serious errors. The results are affected by a large number of factors that must be taken into account.
Using a combination of methods increases the accuracy of the assessment and the results are more reliable.

Author Contributions

Conceptualization, I.I.; methodology, I.I.; formal analysis, I.I.; investigation, I.I.; resources, I.I.; writing—original draft preparation, I.I.; writing—review and editing, I.I.; visualization, I.I.; supervision, I.I.; project administration, I.I.; funding acquisition, I.I. All authors have read and agreed to the published version of the manuscript.

Funding

This research was supported by the research grant No KP-06-OPR01/3-2018 for the project “Creation of a flexible methodology for development and management of innovative project in scientific organizations” (2018/2021) funded by National Science Fund, “Competition for Financial Support for Basic Research Projects on Societal Challenges 2018”, Ministry of Education and Science, Bulgaria.

Institutional Review Board Statement

Not applicable.

Informed Consent Statement

Not applicable.

Data Availability Statement

All the data are included in the article.

Conflicts of Interest

The author declares no conflict of interest. The funders had no role in the design of the study; in the collection, analysis, or interpretation of data; in the writing of the manuscript, or in the decision to publish the results.

References

  1. Alwash, M. Assessment of Concrete Strength in Existing Structures Using Nondestructive Tests and Cores: Analysis of Current Methodology and Recommendations for more Reliable Assessment. Ph.D. Thesis, University of Bordeaux, Bordeaux, France, 2017. [Google Scholar]
  2. Karaiskos, G.; Deraemaeker, A.; Aggelis, D.; Hemelrijck, D. Monitoring of Concrete Structures Using the Ultrasonic Pulse Velocity Method. Smart Mater. Struct. 2015, 24, 113001. [Google Scholar] [CrossRef] [Green Version]
  3. Dimov, D. Investigation and Testing of Structures and Bridges, 3rd ed.; DL & M: Sofia, Bulgaria, 2016. [Google Scholar]
  4. Khan, A.; Bin Ibrahim, A.N.; Bin Ismail, P.; Forde, M.; Gilmour, R.; Kato, K.; Ooka, N.; Siong, S.T.; Terada, K.; Wiggerhauser, H. Guidebook on Non-Destructive Testing of Concrete Structure TCS-17; International Atomic Energy Agency: Vienna, Austria, 2002. [Google Scholar]
  5. Castañeda, A.; Albear, J.J.H.; Corvo, F.; Marrero, R. Concrete Quality Assessment before Building Structures Submitting to Environmental Exposure Conditions. Rev. Constr. 2017, 16, 374–387. [Google Scholar] [CrossRef] [Green Version]
  6. Gupta, S. Comparison of Non-Destructive and Destructive Testing on Concrete: A Review. Trends Civ. Eng. Its Archit. 2018, 3, 351–357. [Google Scholar] [CrossRef] [Green Version]
  7. Hrischev, H.; Rostovsky, I.; Conev, I.; Nikolov, V. Investigation for Estimating of Concrete Strength by the Maturity Method and the Rebound Hammer. AIP Conf. Proc. 2022, 2557, 040001. [Google Scholar] [CrossRef]
  8. Minutolo, V.; Di Ronza, S.; Eramo, C.; Ferla, P.; Palladino, S.; Zona, R. The Use of Destructive and non Destructive Testing in Concrete Strength Assessment for a School Buildin. Int. J. Adv. Res. Eng. Technol. 2019, 10, 252–267. [Google Scholar] [CrossRef]
  9. Kaplan, G.; Yaprak, H.; Memis, S.; Alnkaa, A. Artificial Neural Network Estimation of the Effect of Varying Curing Conditions and Cement Type on Hardened Concrete Properties. Buildings 2019, 9, 10. [Google Scholar] [CrossRef] [Green Version]
  10. Nucera, F.; Pucinotti, R. Destructive and Non-Destructive Testing on Reinforced Concrete Structure: The Case Study of the Museum of Magna Graecia in Reggio Calabria, Mediterranean University of Reggio Calabria. In Proceedings of the 39th International Conference and Exhibition, Prague, Czech Republic, 4–6 November 2009. [Google Scholar]
  11. Hajjeh, H. Correlation Between Destructive and Non-Destructive Strengths of Concrete Cubes Using Regression Analysis. Contemp. Eng. Sci. 2012, 5, 493–509. [Google Scholar]
  12. Jedidi, M.; Kaouther, M. Destructive and Non-destructive Testing of Concrete Structures. Jordan J. Civ. Eng. 2014, 8, 432–441. [Google Scholar]
  13. Bhosale, N.; Salunkhe, P. To Establish Relation Between Destructive and Non-Destructive Tests on concrete. Int. J. Eng. Res. Gen. Sci. 2016, 4, 634–644. [Google Scholar]
  14. Abdulkadir, M.; Karim, A.; Abdullah, A. Destructive and Non Destructive Strength Evaluation of Concrete Exposed to Fire. Zankoy Sulaimani J. Zankoy Sulaimani Part A 2017, 19, 43–55. [Google Scholar] [CrossRef]
  15. Martínez-Molina, W.; Torres-Acosta, A.; Jáuregui, J.; Chávez-García, H.; Alonso-Guzmán, E.; Graff, M.; Arteaga-Arcos, J. Predicting Concrete Compressive Strength and Modulus of Rupture Using Different NDT Techniques. Adv. Mater. Sci. Eng. 2014, 2014, 742129. [Google Scholar] [CrossRef] [Green Version]
  16. Celik, A.; Kilinc, K.; Tuncan, M.; Tuncan, A. Distributions of Compressive Strength Obtained from Various Diameter Cores. ACI Mater. J. 2012, 109, 6. [Google Scholar]
  17. EN 12390-2:2009; Testing Hardened Concrete—Part 2: Making and Curing Specimens for Strength Tests. CEN: Brussels, Belgium, 2009.
  18. Masi, A.; Nigro, D.; Vona, M. Effect of Core Drilling and Subsequent Restoration on RC Column Strength. In Proceedings of the 15th World Conference on Earthquake Engineering, Lisbon, Spain, 24–28 September 2012. [Google Scholar]
  19. Bungey, J.H.; Millard, S.G.; Grantham, M.G. Testing of Concrete in Structures; CRC Press: London, UK, 2014. [Google Scholar] [CrossRef]
  20. Breysse, D. Non-Destructive Assessment of Concrete Structures: Reliability and Limits of Single and Combined Techniques, State-of-the-Art Report of RILEM Technical Committee 207-INR; Springer: Berlin, Germany, 2012. [Google Scholar] [CrossRef]
  21. Bolborea, B.; Baera, C.; Dan, S.; Gruin, A.; Burduhos-Nergis, D.-D.; Vasile, V. Concrete Compressive Strength by Means of Ultrasonic Pulse Velocity and Moduli of Elasticity. Materials 2021, 14, 7018. [Google Scholar] [CrossRef] [PubMed]
  22. Malhotra, V.; Carino, N. Handbook on Nondestructive Testing of Concrete, 2nd ed.; CRC Press: Boca Raton, FL, USA, 2014. [Google Scholar] [CrossRef]
  23. Ju, M.; Park, K.; Oh, H. Estimation of Compressive Strength of High Strength Concrete Using Non-Destructive Technique and Concrete Core Strength. Appl. Sci. 2017, 7, 1249. [Google Scholar] [CrossRef] [Green Version]
  24. Kocáb, D.; Misák, P.; Cikrle, P. Characteristic Curve and Its Use in Determining the Compressive Strength of Concrete by the Rebound Hammer Test. Materials 2019, 12, 2705. [Google Scholar] [CrossRef] [Green Version]
  25. EN 12504-2:2012; Testing Concrete in Structures—Part 2: Non-Destructive Testing—Determination of Rebound Number. CEN: Brussels, Belgium, 2012.
  26. Hannachi, S.; Guetteche, M. Application of the Combined Method for Evaluating the Compressive Strength of Concrete on Site. Open J. Civ. Eng. 2012, 2, 16–21. [Google Scholar] [CrossRef] [Green Version]
  27. Poorarbabi, A.; Ghasemi, M.; Moghaddam, M.A. Concrete compressive strength prediction using non-destructive tests through response surface methodology. Ain Shams Eng. J. 2020, 11, 939–949. [Google Scholar] [CrossRef]
  28. Ahmad, N.; Rahim, R.; Rahim, H.; Rahiman, M. A Review of Ultrasonic Application on Non-destructive Testing Method for Concrete Structure. J. Teknol. 2014, 119–122. [Google Scholar] [CrossRef] [Green Version]
  29. Lorenzi, A.; Tisbierek, F.; Pinto, L. Ultrasonic Pulse Velocity Analysis in Concrete Specimens. In Proceedings of the 4th Conferencia Panamericana de END, Buenos Aires, Argentina, 22–26 October 2007. [Google Scholar]
  30. Naik, T.; Malhotra, V.; Popovics, J. The Ultrasonic Pulse Velocity Method, In Handbook on Nondestructive Testing of Concrete; CRC Press: Boca Raton, FL, USA, 2006. [Google Scholar]
  31. Panzera, T.; Christoforo, A.; Cota, F.; Borges, P.; Bowen, C. Ultrasonic Pulse Velocity Evaluation of Cementitious Materials. In Advances in Composite Materials—Analysis of Natural and Man-Made Materials; InTech: Rijeka, Croatia, 2011. [Google Scholar] [CrossRef] [Green Version]
  32. Hadianfard, M.; Jafari, S. Prediction of Lightweight Aggregate Concrete Compressive Strength Using Ultrasonic Pulse Velocity Test through Gene Expression Programming. Sci. Iran. 2016, 23, 2506–2513. [Google Scholar] [CrossRef] [Green Version]
  33. Savaliya, K.; Thaker, K.; Dave, U. Comparison between Different Methods of Ultrasonic Pulse Velocity Tests on Concrete. In Proceedings of the National Conference on Advances in Engineering and Technology, Ambala, India, 29 March 2014. [Google Scholar]
  34. EN 12390-3:2009; Testing Hardened Concrete—Part 3: Compressive Strength Of Test Specimens. CEN: Brussels, Belgium, 2009.
  35. EN 12390-4:2000; Testing Hardened Concrete—Part 4: Compressive Strength—Specification for Testing Machines. CEN: Brussels, Belgium, 2000.
  36. BDS EN 13791:2007/NA:2011; Assessment of In-Situ Compressive Strength in Structures and Precast Concrete Components. Bulgarian Institute for Standardization: Sofia, Bulgaria, 2011.
  37. Cristofaro, M.; D’Ambrisi, A.; Stefano, M.; Tanganelli, M.; Pucinotti, R. Mechanical Characterization of Concrete from Existing Buildings with SonReb Method. In Proceedings of the 15th World Conference on Earthquake Engineering, Lisboa, Portugal, 24–28 September 2012. [Google Scholar]
  38. Cristofaro, M.; Viti, S.; Tanganelli, M. New predictive models to evaluate concrete compressive strength using the SonReb method. J. Build. Eng. 2020, 27, 100962. [Google Scholar] [CrossRef]
  39. Jain, A.; Kathuria, A.; Kumar, A.; Verma, Y.; Murari, K. Combined Use of Non-Destructive Tests for Assessment of Strength of Concrete in Structure. Procedia Eng. 2013, 54, 241–251. [Google Scholar] [CrossRef] [Green Version]
  40. Chandak, N.; Kumavat, H. SonReb Method for Evaluation of Compressive Strength of Concrete. IOP Conf. Ser.: Mater. Sci. Eng. 2010, 810, 012071. [Google Scholar] [CrossRef]
  41. Pucinotti, R. The Use of Multiple Combined Non Destructive Testing in the Concrete Strenght Assessent: Applications on Laboratory Specimens. Electron. Resour. 2009, 13, 2. [Google Scholar]
  42. Dauji, S.; Bhalerao, S.; Srivastava, P.; Bhargava, K. Conservative Characteristic Strength of Concrete from Nondestructive and Partially Destructive Testing. J. Asian Concr. Fed. 2019, 5, 25–39. [Google Scholar] [CrossRef]
  43. Nikhil, M.; BalkiMinal, R.; Chhabria, S.; Ghare, D.; Tele, S.; Shweta, P. The use of Combined Non Destructive Testing in the Concrete Strength Assessment from Laboratory Specimens and Existing Buildings. Int. J. Curr. Eng. Sci. Res. 2015, 2, 55–59. [Google Scholar]
  44. EN 12390-1:2012; Testing Hardened Concrete—Part 1: Shape, Dimensions and Other Requirements for Specimens and Moulds. CEN: Brussels, Belgium, 2012.
  45. EN 12350-1:2009; Testing Fresh Concrete—Part 1: Sampling and Common Apparatus. CEN: Brussels, Belgium, 2009.
  46. EN 12504-1:2009; Testing Concrete in Structures—Part 1: Cored Specimens—Taking, Examining and Testing in Compression. CEN: Brussels, Belgium, 2009.
  47. Brunarski, L.; Dohojda, M. An Approach to In-situ Compressive strength of Concrete. Bull. Pol. Acad. Sciences. Tech. Sci. 2016, 64, 687–695. [Google Scholar] [CrossRef] [Green Version]
  48. Marco, V. A Review of Experimental Results about in Situ Concrete Strength. Adv. Mater. Res. 2013, 773, 278–282. [Google Scholar] [CrossRef]
  49. EN 12504-4:2004; Testing Concrete in Structures—Part 4: Determination of Ultrasonic Pulse Velocity. CEN: Brussels, Belgium, 2004.
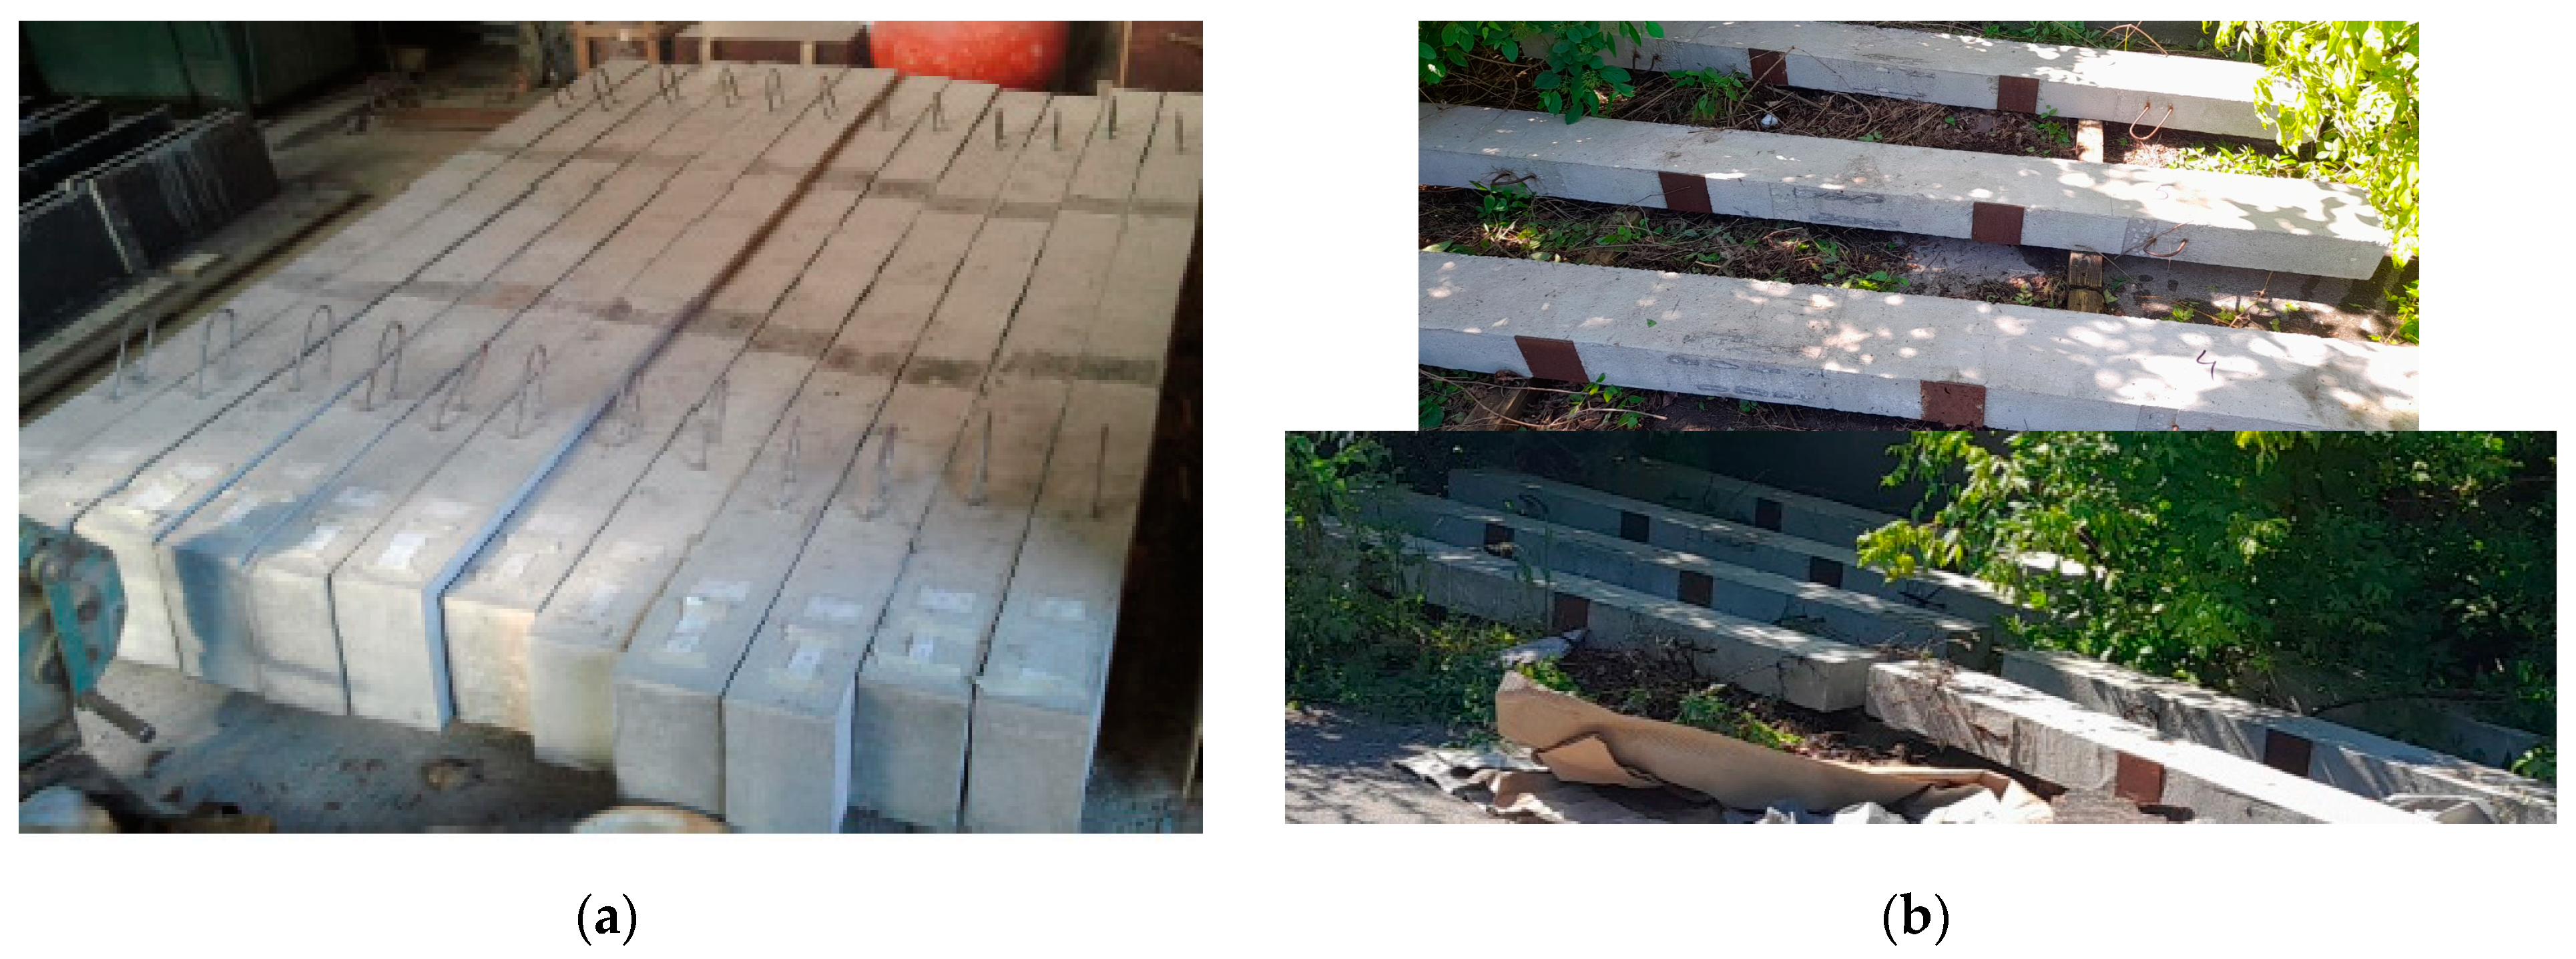
Figure 1. Storage of reinforced concrete beams: (a) indoors; (b) outdoors (source: author I. Ivanchev).
Applsci 12 12172 g001
Figure 2. Test specimens: (a) cubes; (b) formwork molds for cubes; (c) compaction of the concrete mix; (d) aging of test specimens (source: author I. Ivanchev).
Applsci 12 12172 g002
Figure 3. Test specimens: (a) machine for drilling cores, (b) cored specimens (source: author I. Ivanchev).
Applsci 12 12172 g003
Figure 4. Determination of the probabilistic concrete compressive strength based on its surface hardness with Digi Schmidt, type N, with the testing of (a) cubes and (b) reinforced concrete beams (source: author I. Ivanchev).
Applsci 12 12172 g004
Figure 5. Determination of ultrasonic velocity when testing (a) cubes and (b) cored specimens (source: author I. Ivanchev).
Applsci 12 12172 g005
Figure 6. Testing of (a) cubes and (b) cores (source: author I. Ivanchev).
Applsci 12 12172 g006
Figure 7. Compressive strength results of concrete obtained using the different methods from the testing of 27 cubes (source: author I. Ivanchev).
Applsci 12 12172 g007
Figure 8. Compressive strength results of concrete obtained using the different methods from the testing of 11 cores (source: author I. Ivanchev).
Applsci 12 12172 g008
Figure 9. Relative error in the determination of the probabilistic compressive strength of concrete via non-destructive methods versus f c , cube (source: author I. Ivanchev).
Applsci 12 12172 g009
Figure 10. Relative error in the determination of the probabilistic compressive strength via non-destructive methods at the concrete age of 1926 days (source: author I. Ivanchev).
Applsci 12 12172 g010
Figure 11. Correlation between the reference compressive strength and the compressive strength determined via different non-destructive methods for concrete samples aged 28, 244, 280, 293, 342 and 1126 days (source: author I. Ivanchev).
Applsci 12 12172 g011
Figure 12. Correlation between the reference compressive strength and the compressive strength determined via different non-destructive methods for concrete samples aged 1926 days (source: author I. Ivanchev).
Applsci 12 12172 g012
Figure 13. Accuracy of different non-destructive methods in determining the compressive strength of concrete against the reference value based on the testing of 27 cubes at the ages of 28, 244, 280, 293, 342 and 1126 days (source: author I. Ivanchev).
Applsci 12 12172 g013
Figure 14. Accuracy of different non-destructive methods in determining the compressive strength of concrete against the reference value based on the testing of 11 cores at the age of 1926 days (source: author I. Ivanchev).
Applsci 12 12172 g014
Figure 15. Nomogram for concrete ages ranging from 28 to 1126 days (source: author I. Ivanchev).
Applsci 12 12172 g015
Figure 16. Nomogram for concrete aged 1926 days. (source: author I. Ivanchev).
Applsci 12 12172 g016
Table 1. Concrete compressive strength, determined based on its surface hardness.
Age (Days)Test Specimen, №Median R Rs · (N/mm2) fc,Schmidt (N/mm2)
28thCube 13733.533.5
Cube 23733.533.5
Cube 337.534.534.5
244thCube 440.540.533.0
Cube 54141.533.8
Cube 64243.535.4
280thCube 74243.534.6
Cube 84243.534.6
Cube 942.544.635.4
293rdCube 104243.534.2
Cube 114345.736.0
Cube 124345.736.0
342ndCube 134345.734.7
Cube 1443.546.935.6
Cube 154448.036.5
1126thCube 1649.560.445.3
Cube 174754.741.0
Cube 1846.553.640.2
Cube 1946.553.640.2
Cube 204652.539.4
Cube 214857.042.8
Cube 224448.036.0
Cube 234857.042.8
Cube 2447.555.941.9
Cube 254550.037.5
Cube 2646.553.640.2
Cube 274550.037.5
1926thCore 14652.545.5
Core 24652.545.5
Core 34856.649.0
Core 45267.659.1
Core 54754.747.8
Core 64754.747.8
Core 74550.744.3
Core 846.553.646.7
Core 95061.854.0
Core 1048.558.050.2
Core 115061.854.0
Table 2. Compressive strength of concrete determined via UPVM.
Age (Days)Test Specimen, №VUPV,mean
(km/s)
fc,UPV,app1
(N/mm2)
fc,UPV,app2
(N/mm2)
28thCube 14.18733.936.5
Cube 24.21934.937.5
Cube 34.24035.638.2
244thCube 44.21934.937.5
Cube 54.27836.839.6
Cube 64.27736.839.5
280thCube 74.21234.737.3
Cube 84.28737.139.9
Cube 94.29237.340.0
293rdCube 104.26636.439.1
Cube 114.28537.039.8
Cube 124.27036.539.3
342ndCube 134.28837.139.9
Cube 144.30937.840.7
Cube 154.38140.243.3
1126thCube 164.44242.445.6
Cube 174.40140.844.0
Cube 184.37940.143.2
Cube 194.37239.942.9
Cube 204.37839.843.2
Cube 214.44241.645.6
Cube 224.33538.741.6
Cube 234.41441.444.5
Cube 244.40341.044.1
Cube 254.36940.242.8
Cube 264.39840.943.9
Cube 274.37039.942.9
1926thCore 14.60548.544.2
Core 24.60848.644.3
Core 34.73954.049.2
Core 44.87660.154.8
Core 54.69252.047.4
Core 64.66050.746.2
Core 74.57847.443.2
Core 84.64850.245.7
Core 94.77255.450.5
Core 104.76255.050.1
Core 114.85359.053.8
Table 3. Cube compressive strength of concrete on the days of testing.
Age (Days)Test
Specimen, №
Cube DimensionsMass
(kg)
F
(kN)
Fc,cube
(N/mm2)
abh
(mm)(mm)(mm)
28thCube 1149.8149.9150.27.77747.633.3
Cube 2149.9149.9150.37.78776.334.5
Cube 3149.91501507.78785.134.9
244thCube 4150149.91507.76863.138.4
Cube 5149150.5150.37.73882.239.3
Cube 6150.5149.61507.76883.839.3
280thCube 7149.8149.51507.70872.138.9
Cube 8150149150.27.73875.039.1
Cube 9149.7149.91507.72903.840.3
293rdCube 10149.71511507.77893.739.5
Cube 11149.6150.3150.27.75910.740.5
Cube 12149.6149.41507.69904.340.5
342ndCube 13149.7149.81507.66891.739.8
Cube 14149.3149.7149.57.66920.341.2
Cube 15149.5149.7150.37.76926.941.4
1126thCube 16148.6147.7149.87.601034.147.1
Cube 17148.8150.01507.65997.644.7
Cube 18148.5149.51507.62976.444.0
Cube 19150.9148.6149.67.69969.043.2
Cube 20149149.6149.47.67970.643.6
Cube 21146.5149.51507.551025.046.8
Cube 22150.5149.7149.47.69900.640.0
Cube 23147.2149.5149.77.561008.845.8
Cube 24149.5149.9150.37.741009.945.1
Cube 25151.2149.4149.87.73954.742.3
Cube 26148.1149.5149.97.61983.344.4
Cube 27150.6149.5149.87.66956.942.5
1926thCored specimen № D (mm)L (mm)Mass(kg) F (kN) f c , cube (N/mm2)
Core 199991.792298.944.7
Core 299991.796303.345.3
Core 399941.746331.949.6
Core 4991001.867351.552.5
Core 5991001.890322.348.2
Core 699981.818319.947.8
Core 799991.835283.942.4
Core 899961.764318.447.6
Core 9991001.838336.450.3
Core 10991031.890332.349.6
Core 1199991.822339.750.7
Table 4. Compressive strength of concrete determined via SonReb.
Age (Days)Test Specimen, № fc,SonReb (N/mm2)
28thCube 134.1
Cube 234.2
Cube 334.8
244thCube 437.7
Cube 538.3
Cube 639.3
280thCube 739.1
Cube 839.3
Cube 939.9
293rdCube 1039.3
Cube 1140.3
Cube 1240.3
342ndCube 1340.3
Cube 1440.9
Cube 1541.6
1126thCube 1647.4
Cube 1744.7
Cube 1844.1
Cube 1943.1
Cube 2043.6
Cube 2145.8
Cube 2241.5
Cube 2345.8
Cube 2445.2
Cube 2542.6
Cube 2644.2
Cube 2742.6
1926thCore 145.3
Core 245.3
Core 348.7
Core 453.2
Core 547.4
Core 646.7
Core 744.4
Core 846.3
Core 950.2
Core 1049.4
Core 1151.9
Publisher’s Note: MDPI stays neutral with regard to jurisdictional claims in published maps and institutional affiliations.