
Detection of Risk Predictors of COVID-19 Mortality with Classifier Machine Learning Models Operated with Routine Laboratory Biomarkers


Abstract
:1. Introduction
2. Materials and Methods
2.1. Measurements
2.2. Characteristics of Participants and Defined Datasets
2.3. Feature Selection for ML Models with Statistical Approach
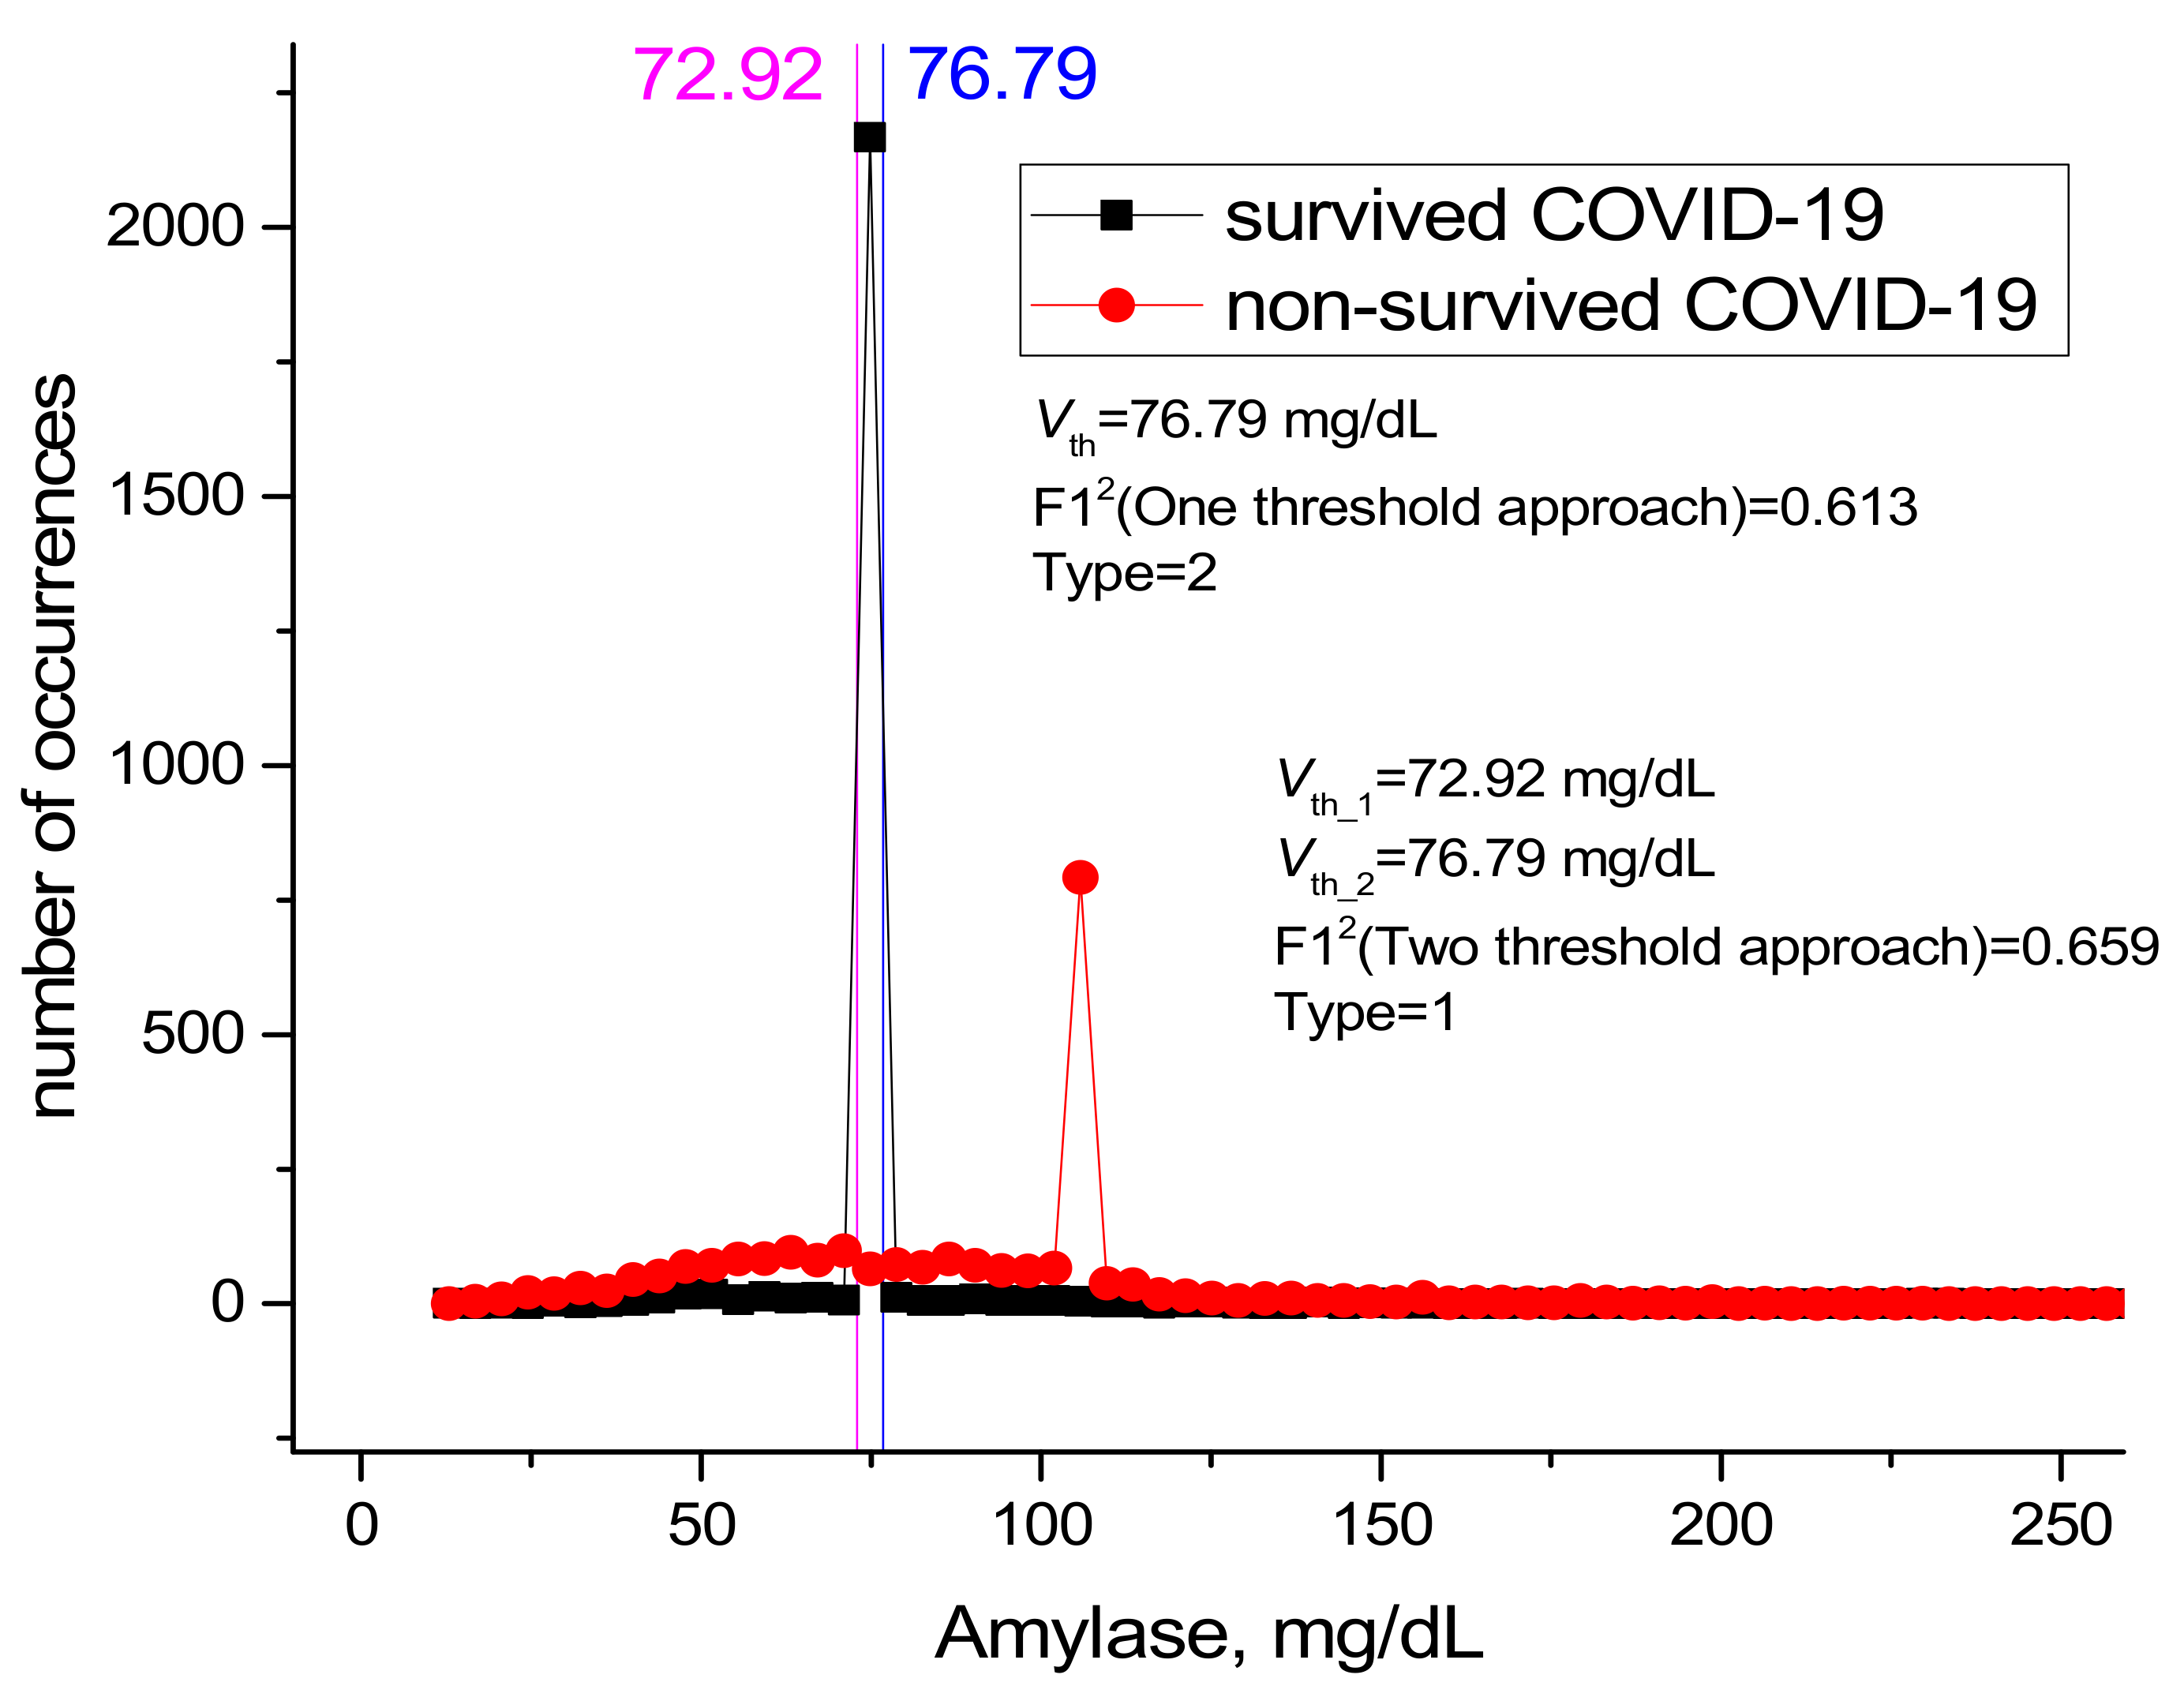
2.4. Threshold Approach
2.4.1. One-Threshold Approach
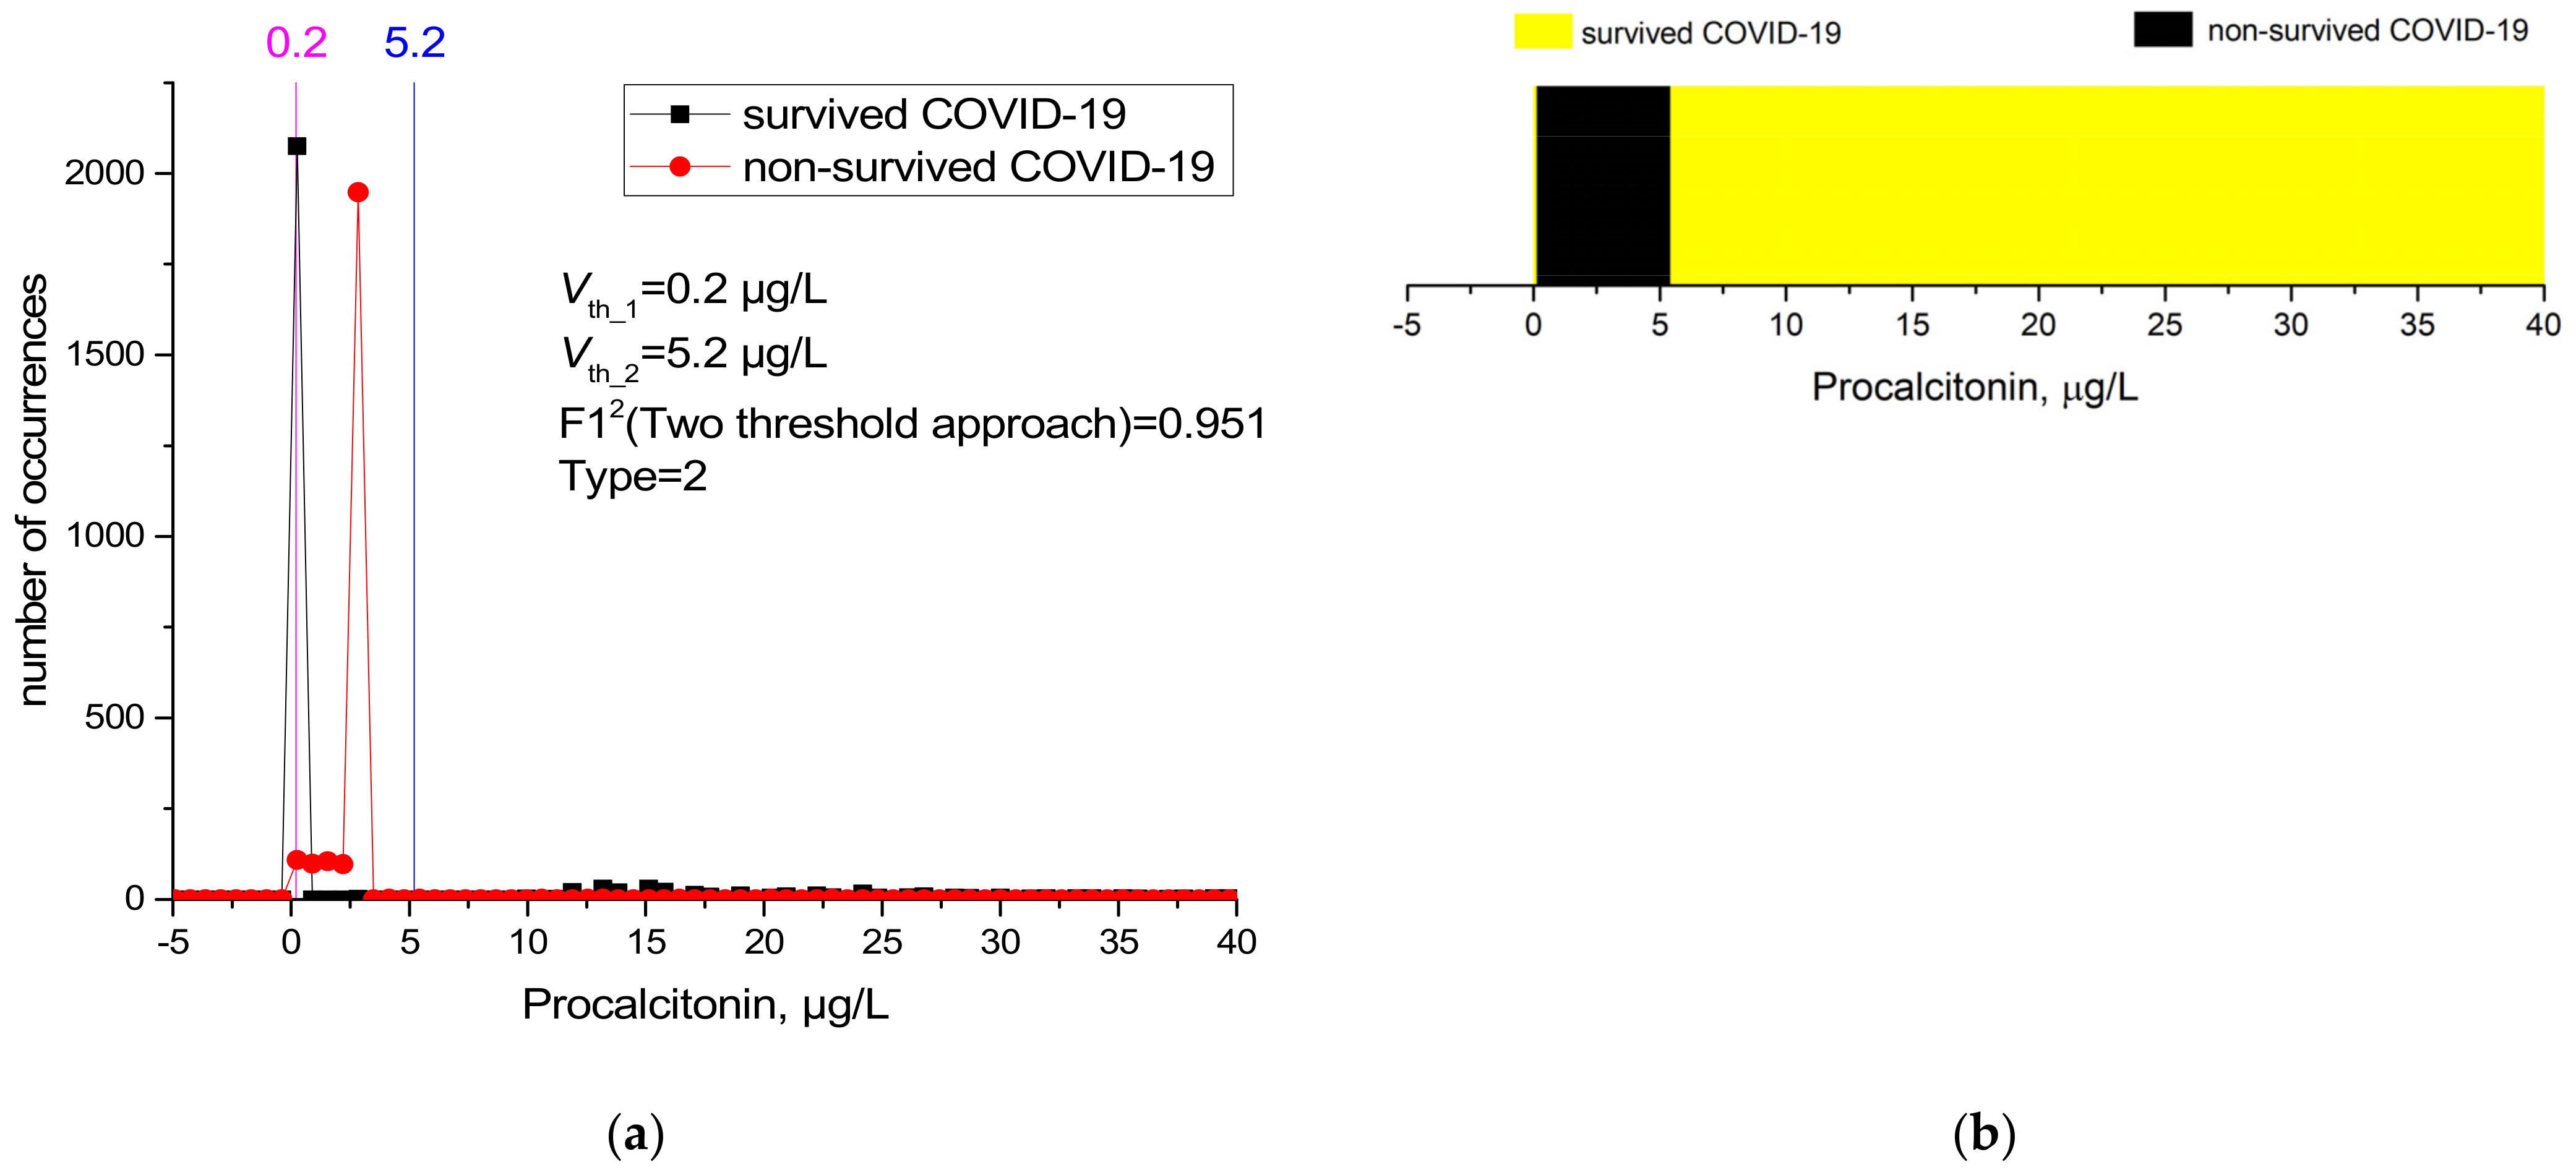
2.4.2. Two-Threshold Approach
2.5. F12 Metric
3. Results
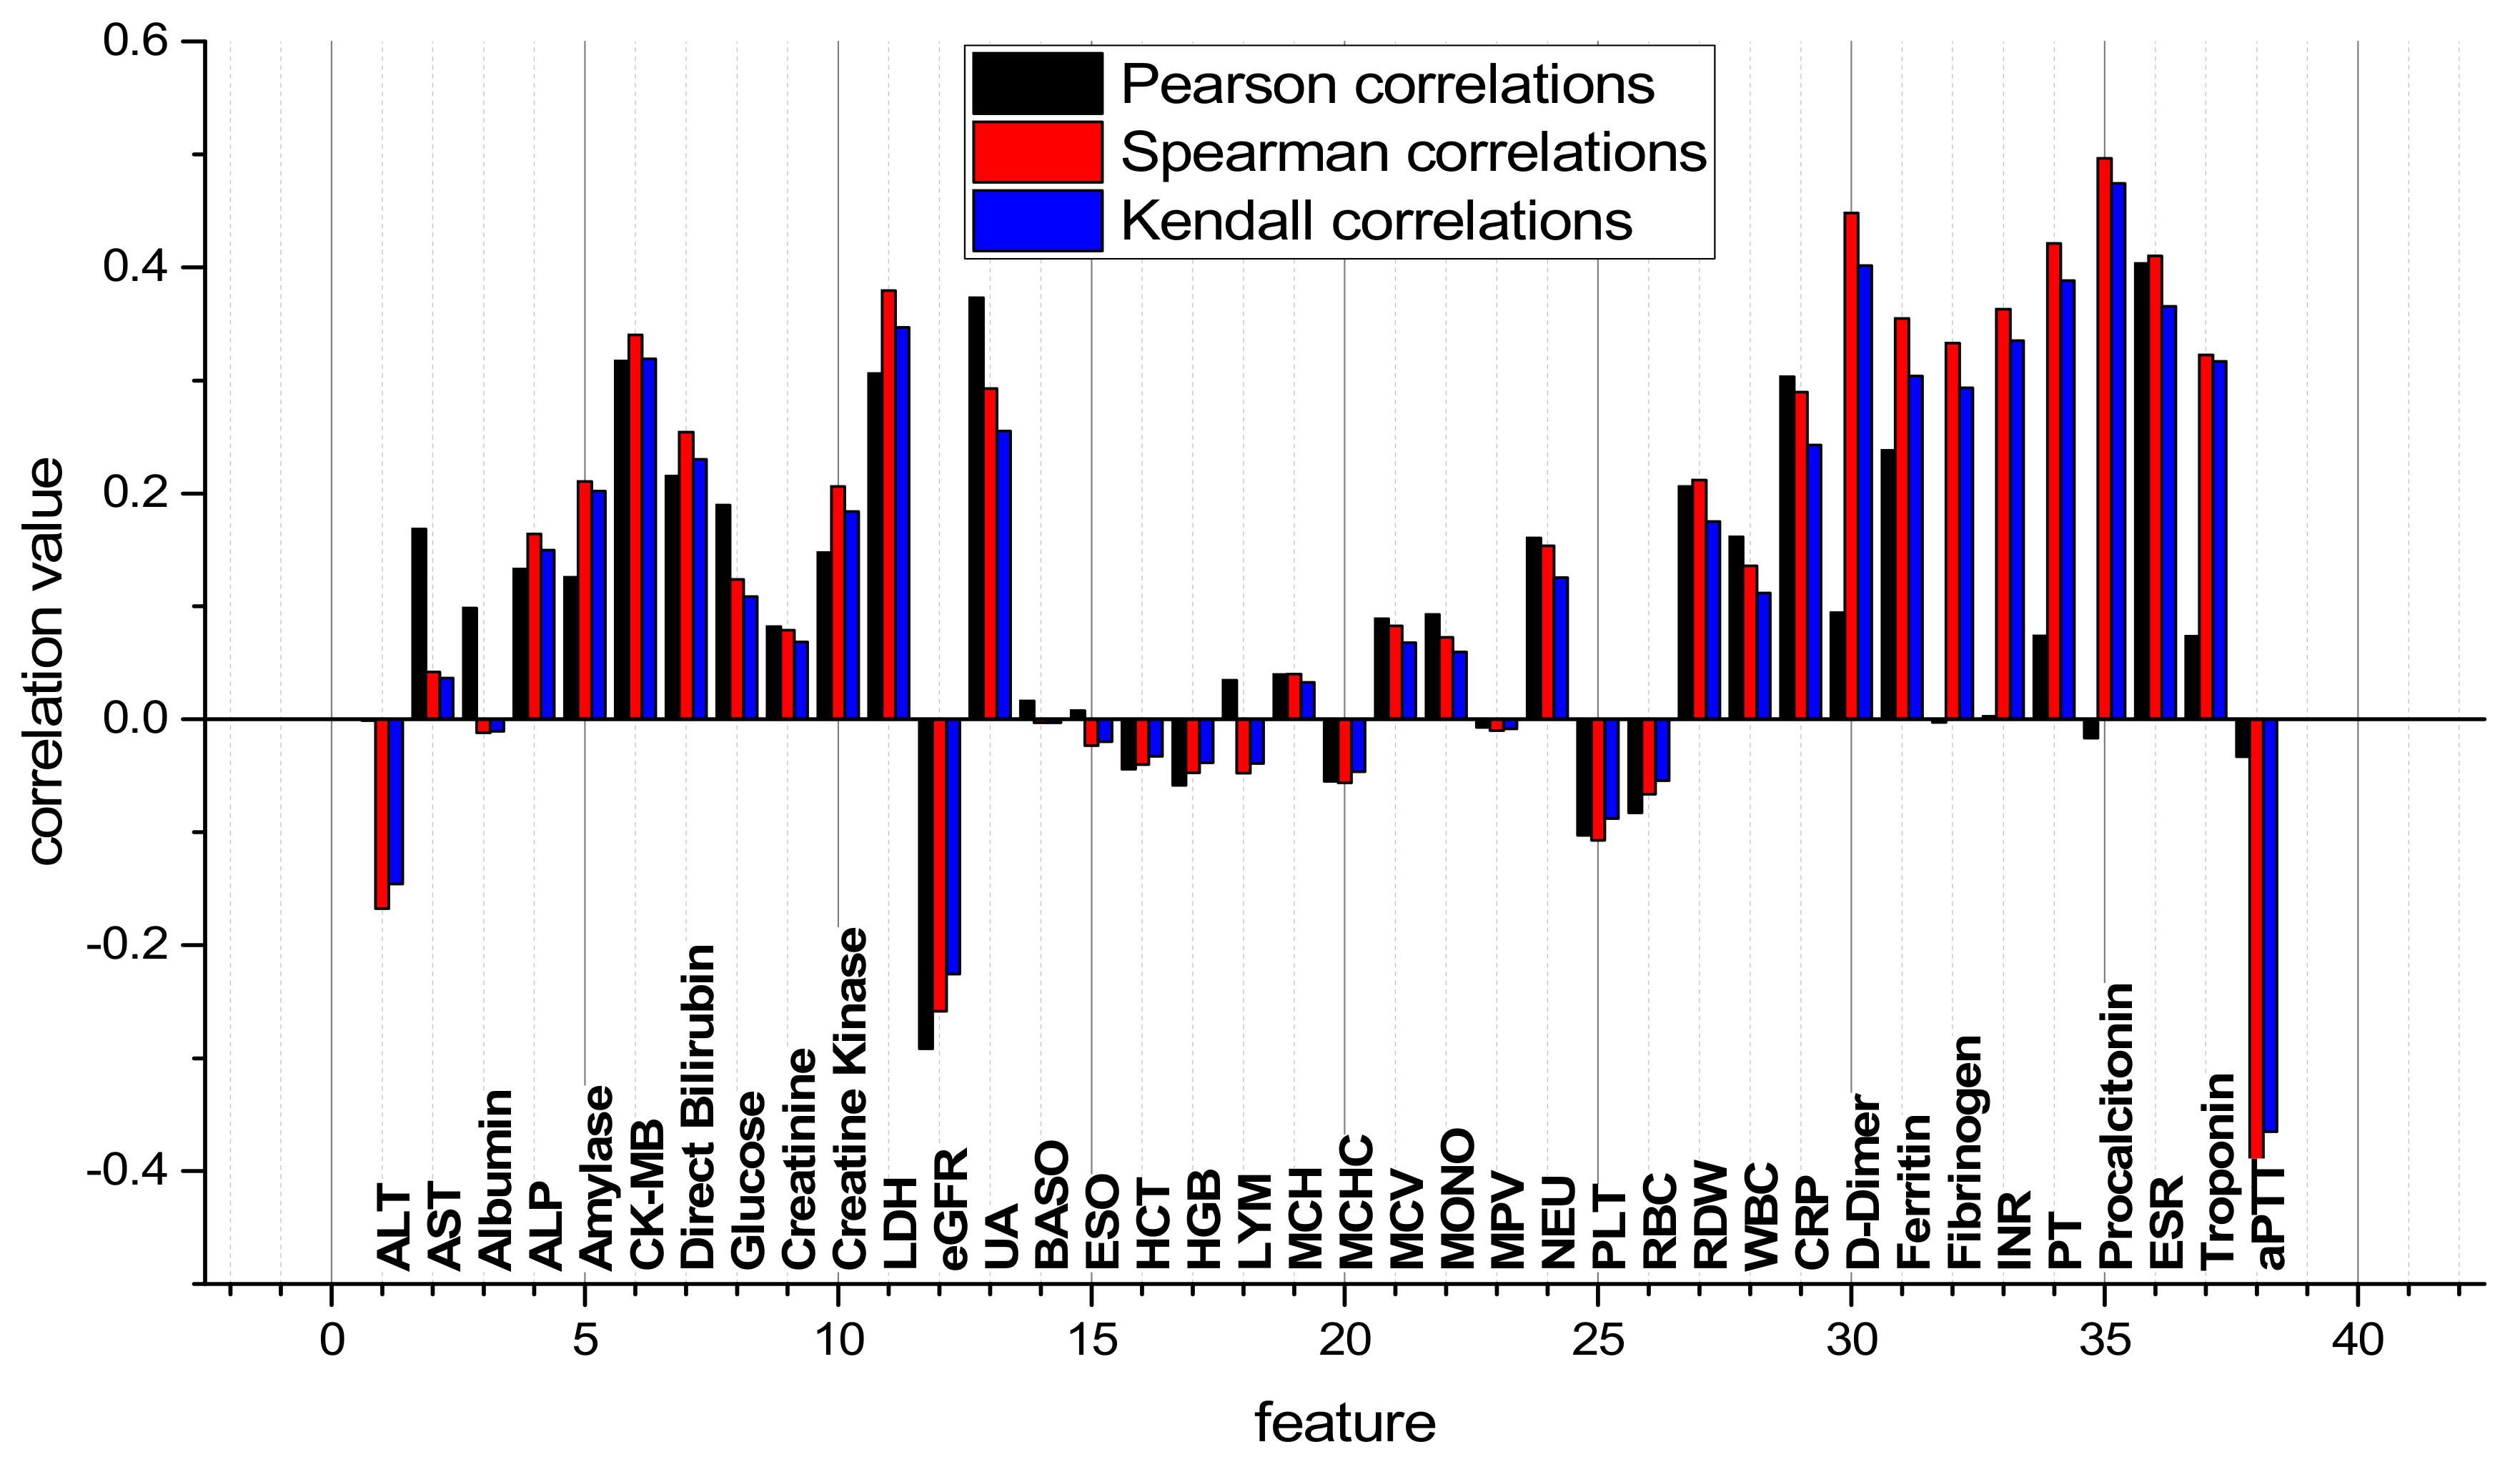
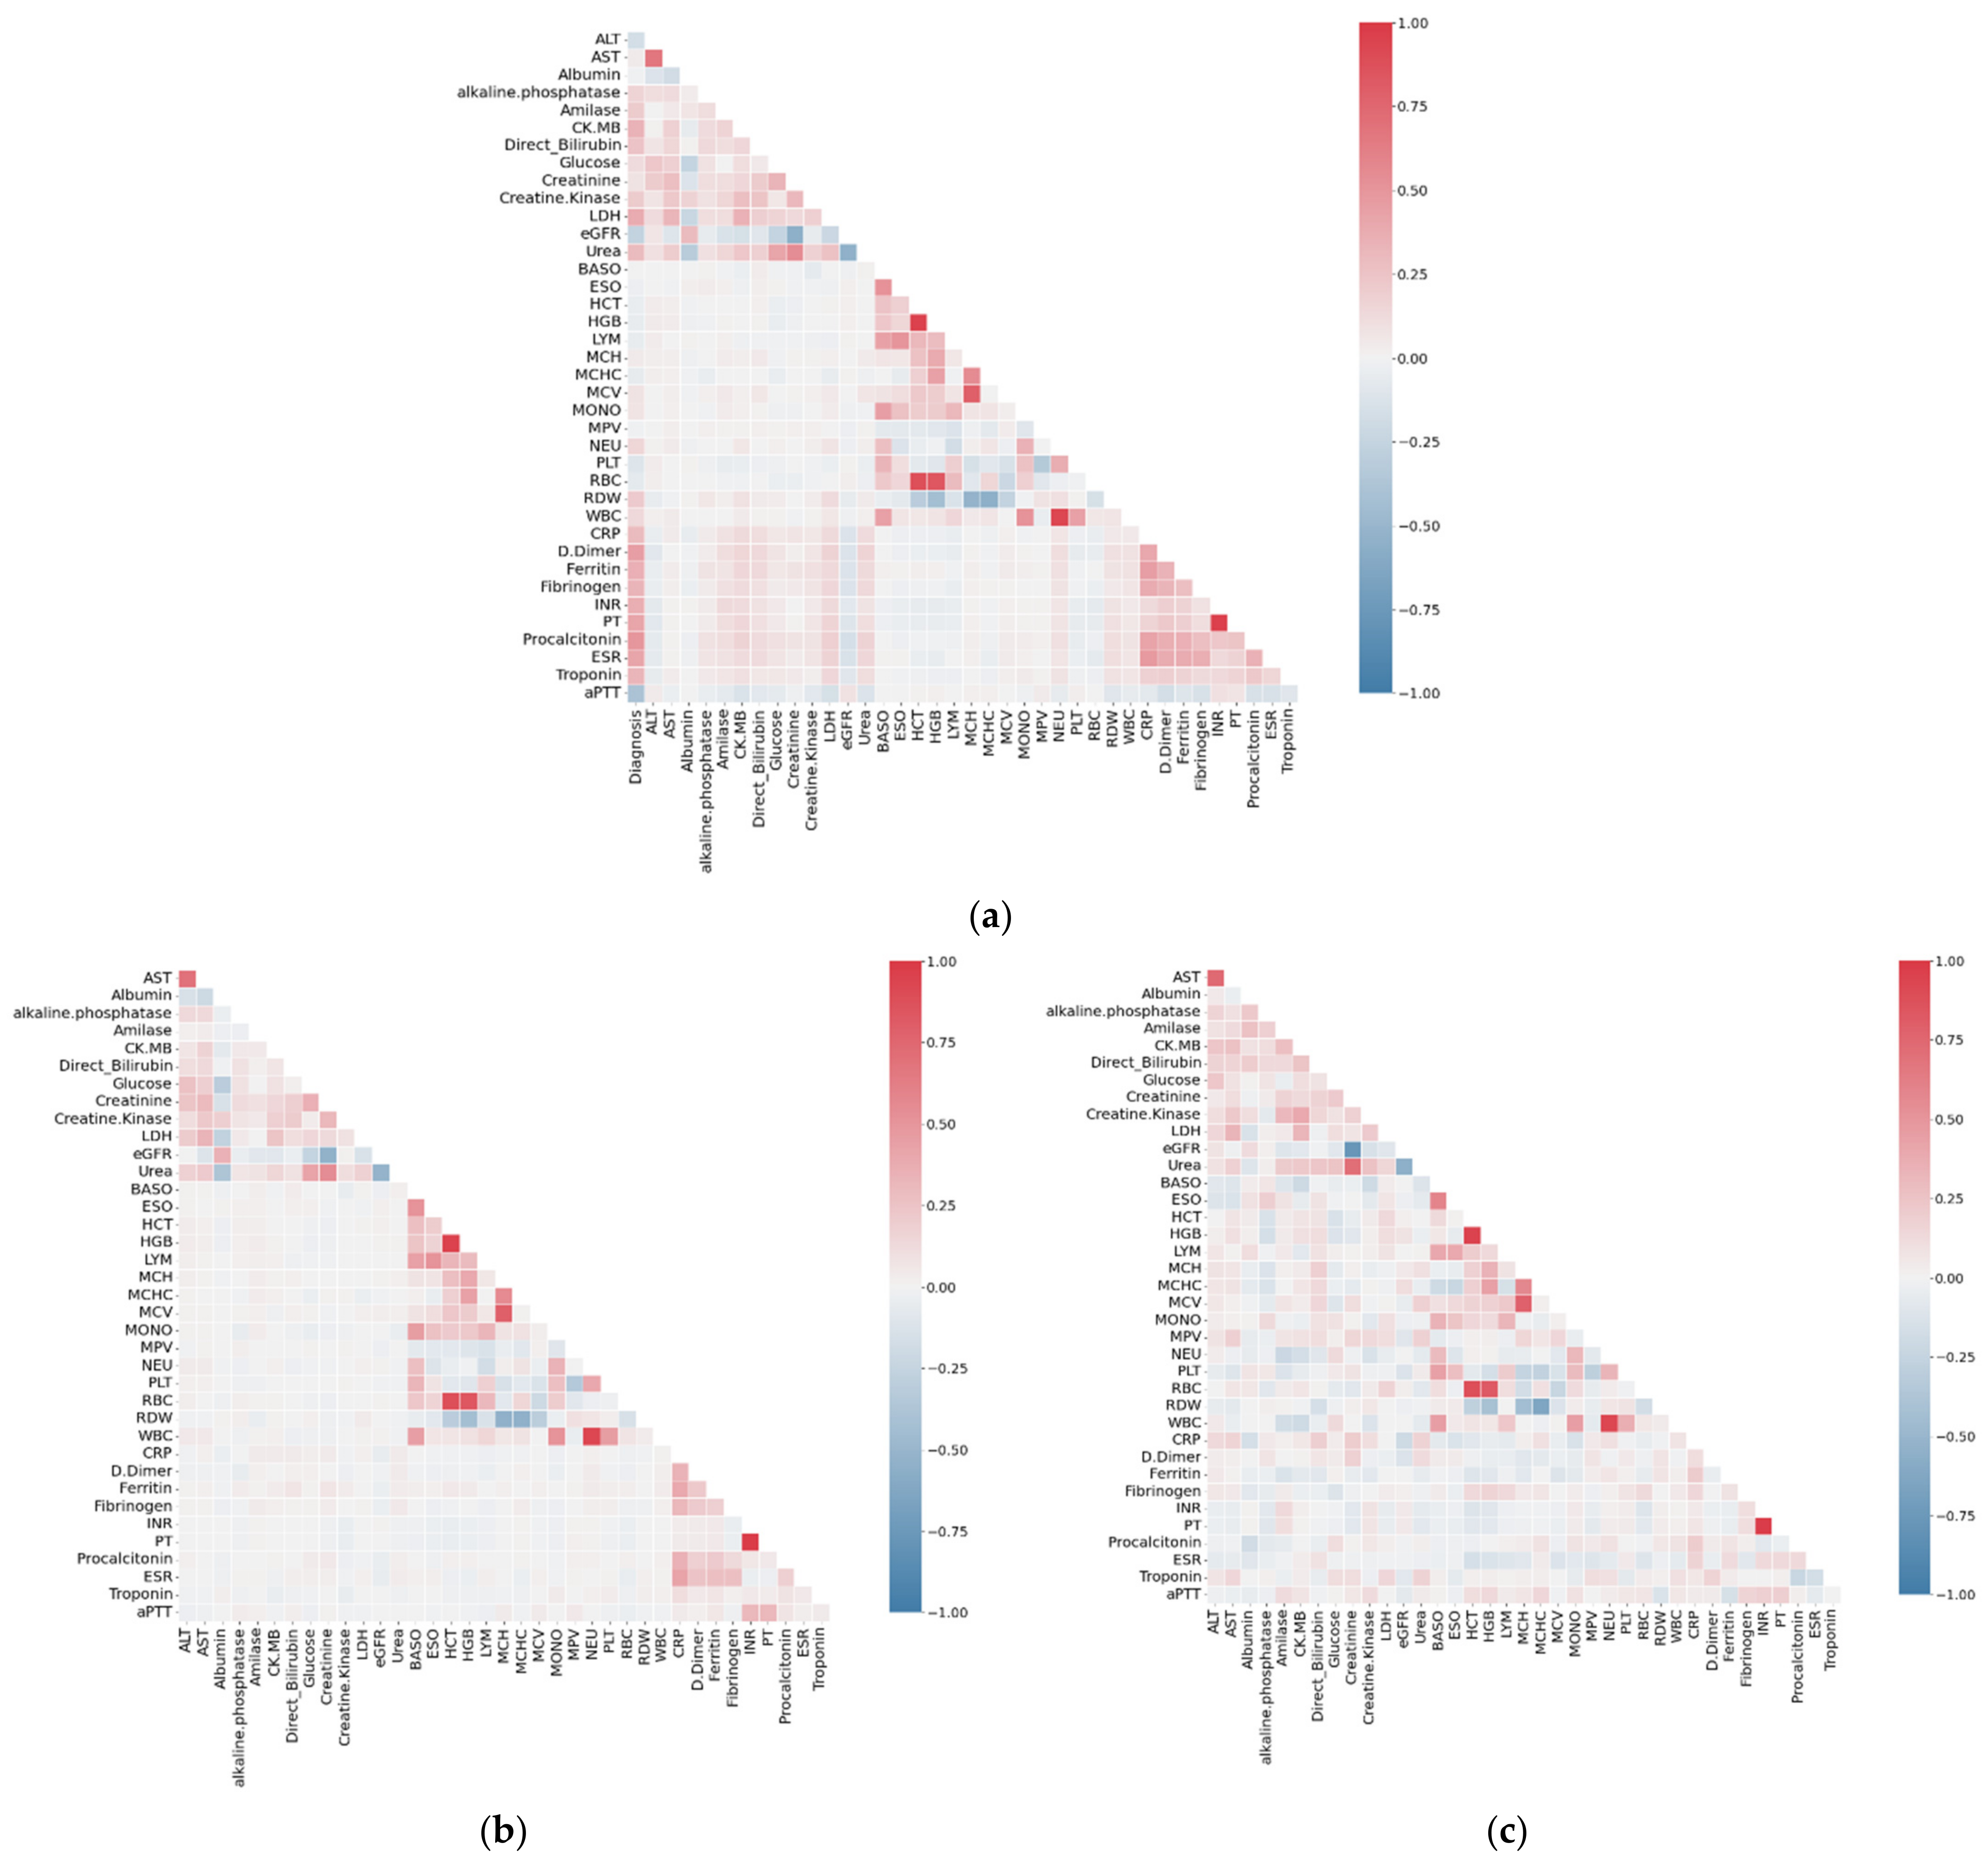
3.1. Correlation Analysis of Dataset SARS-CoV-2-RBV3
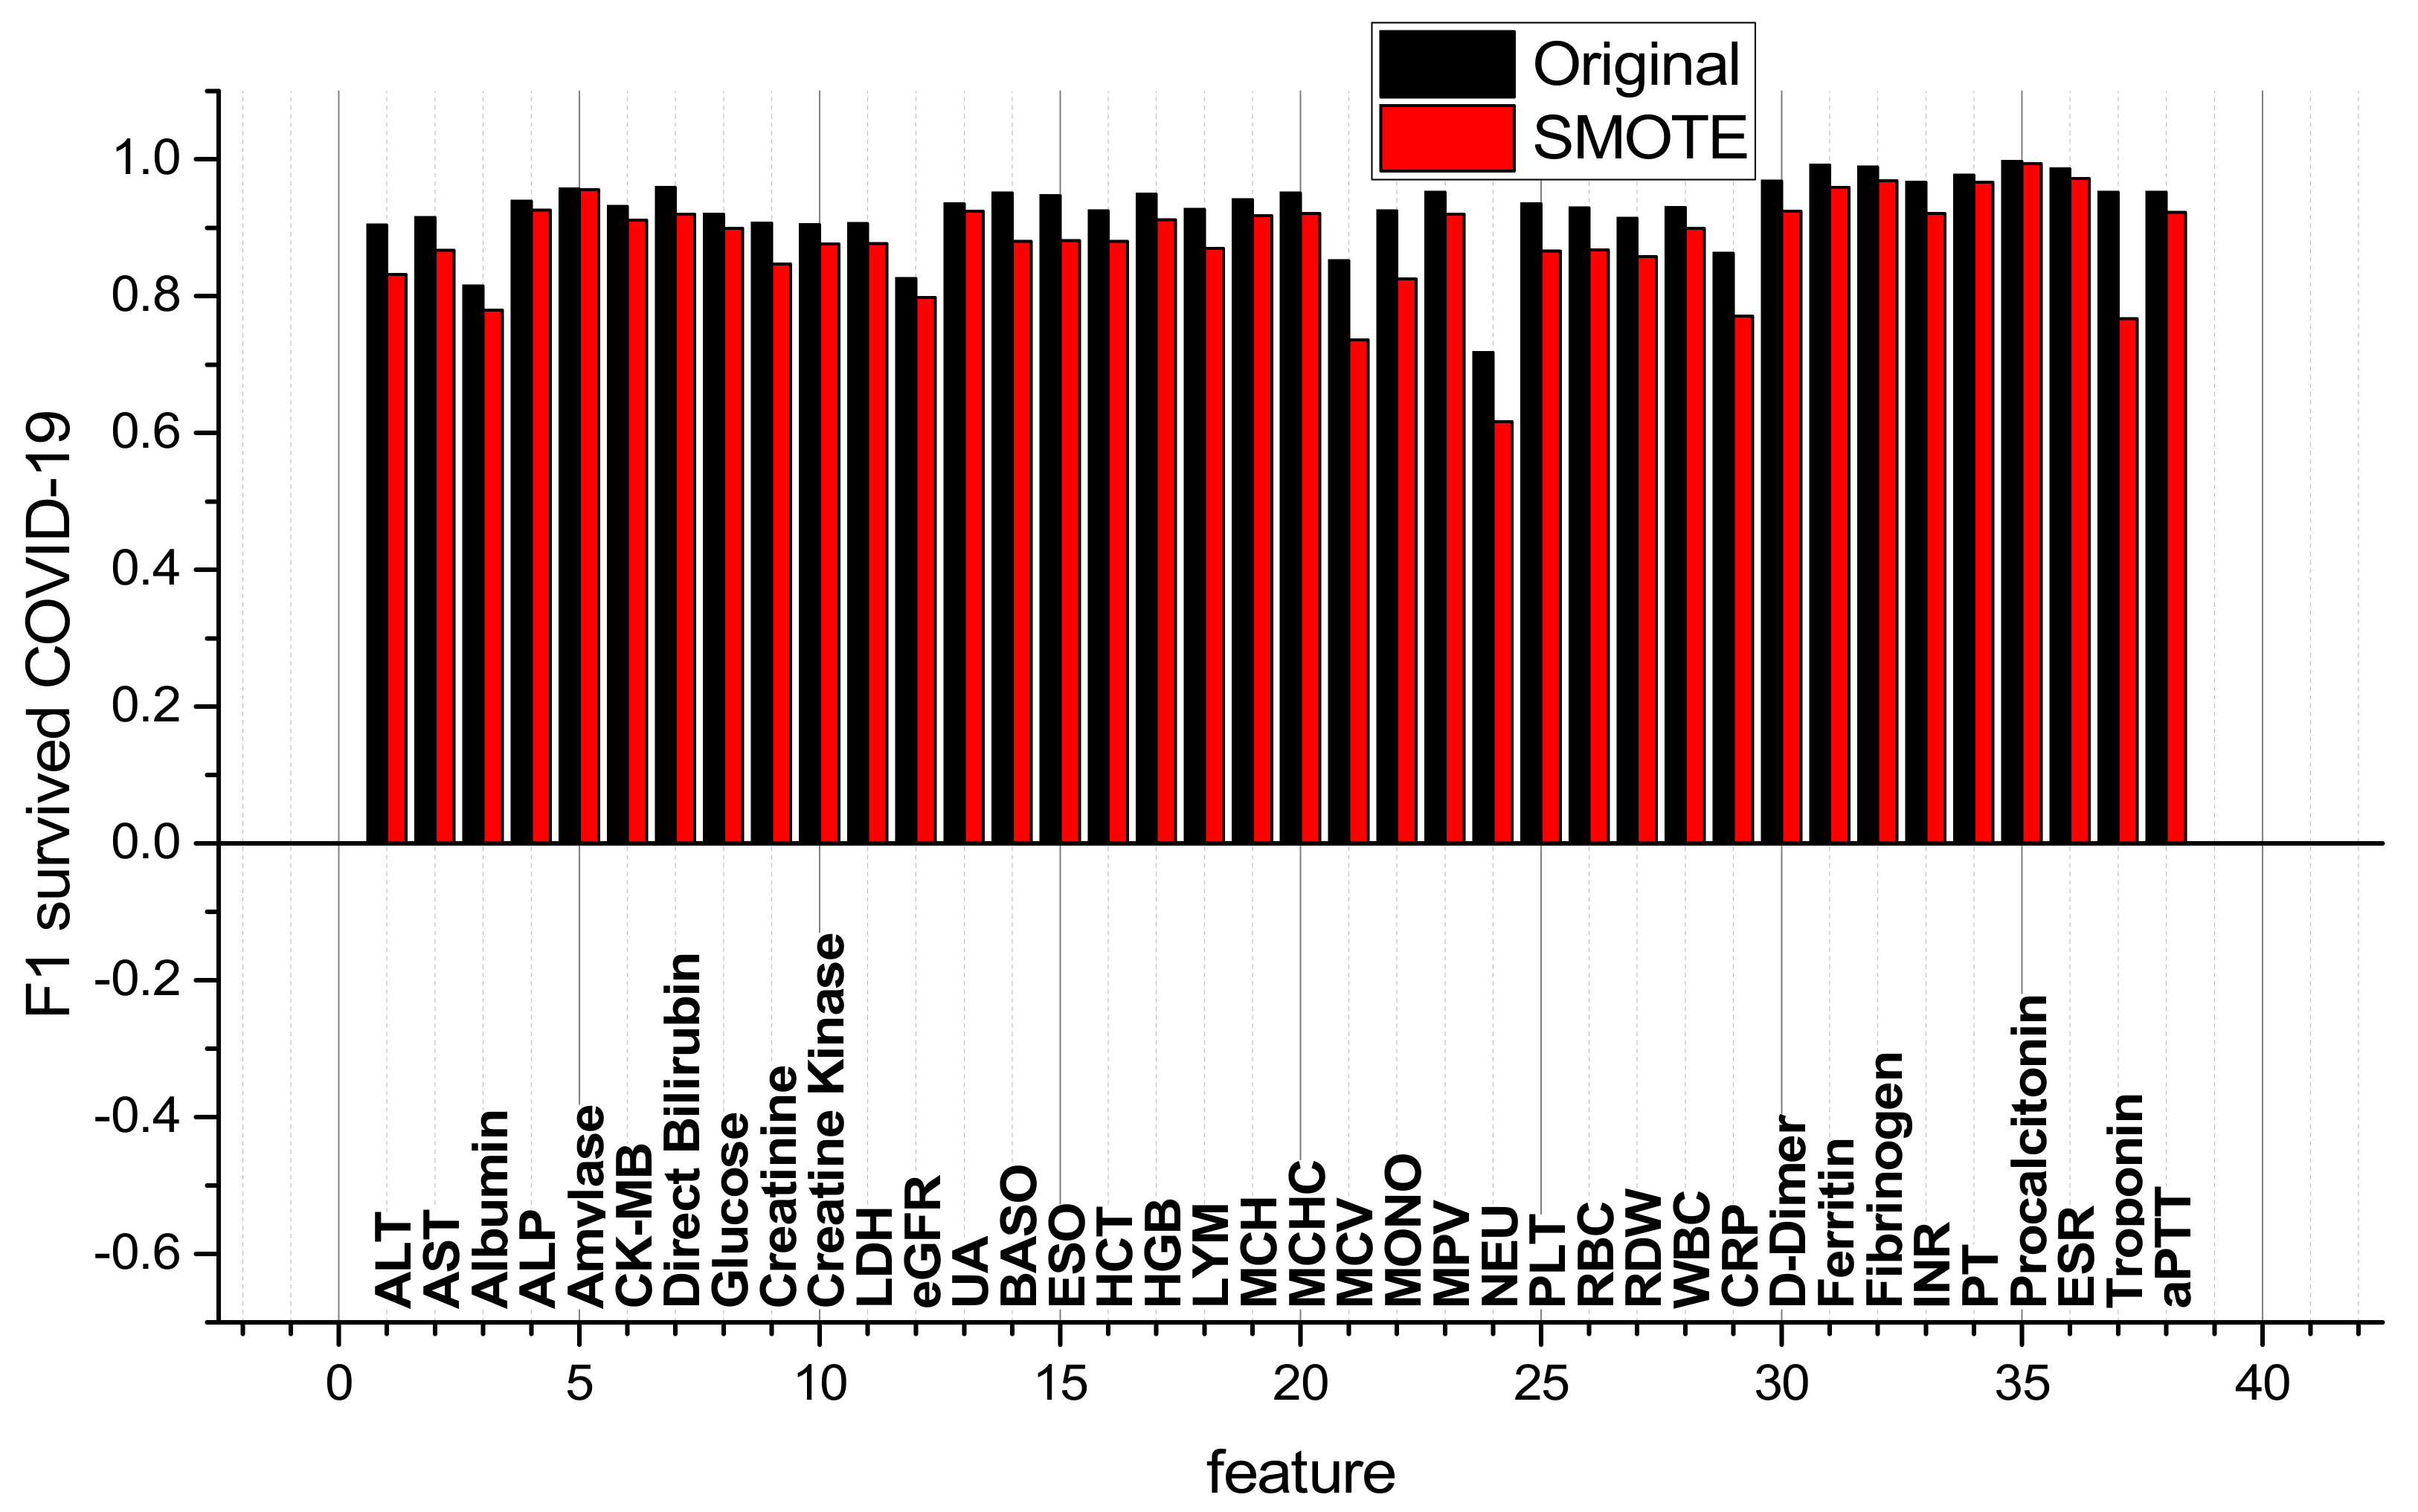
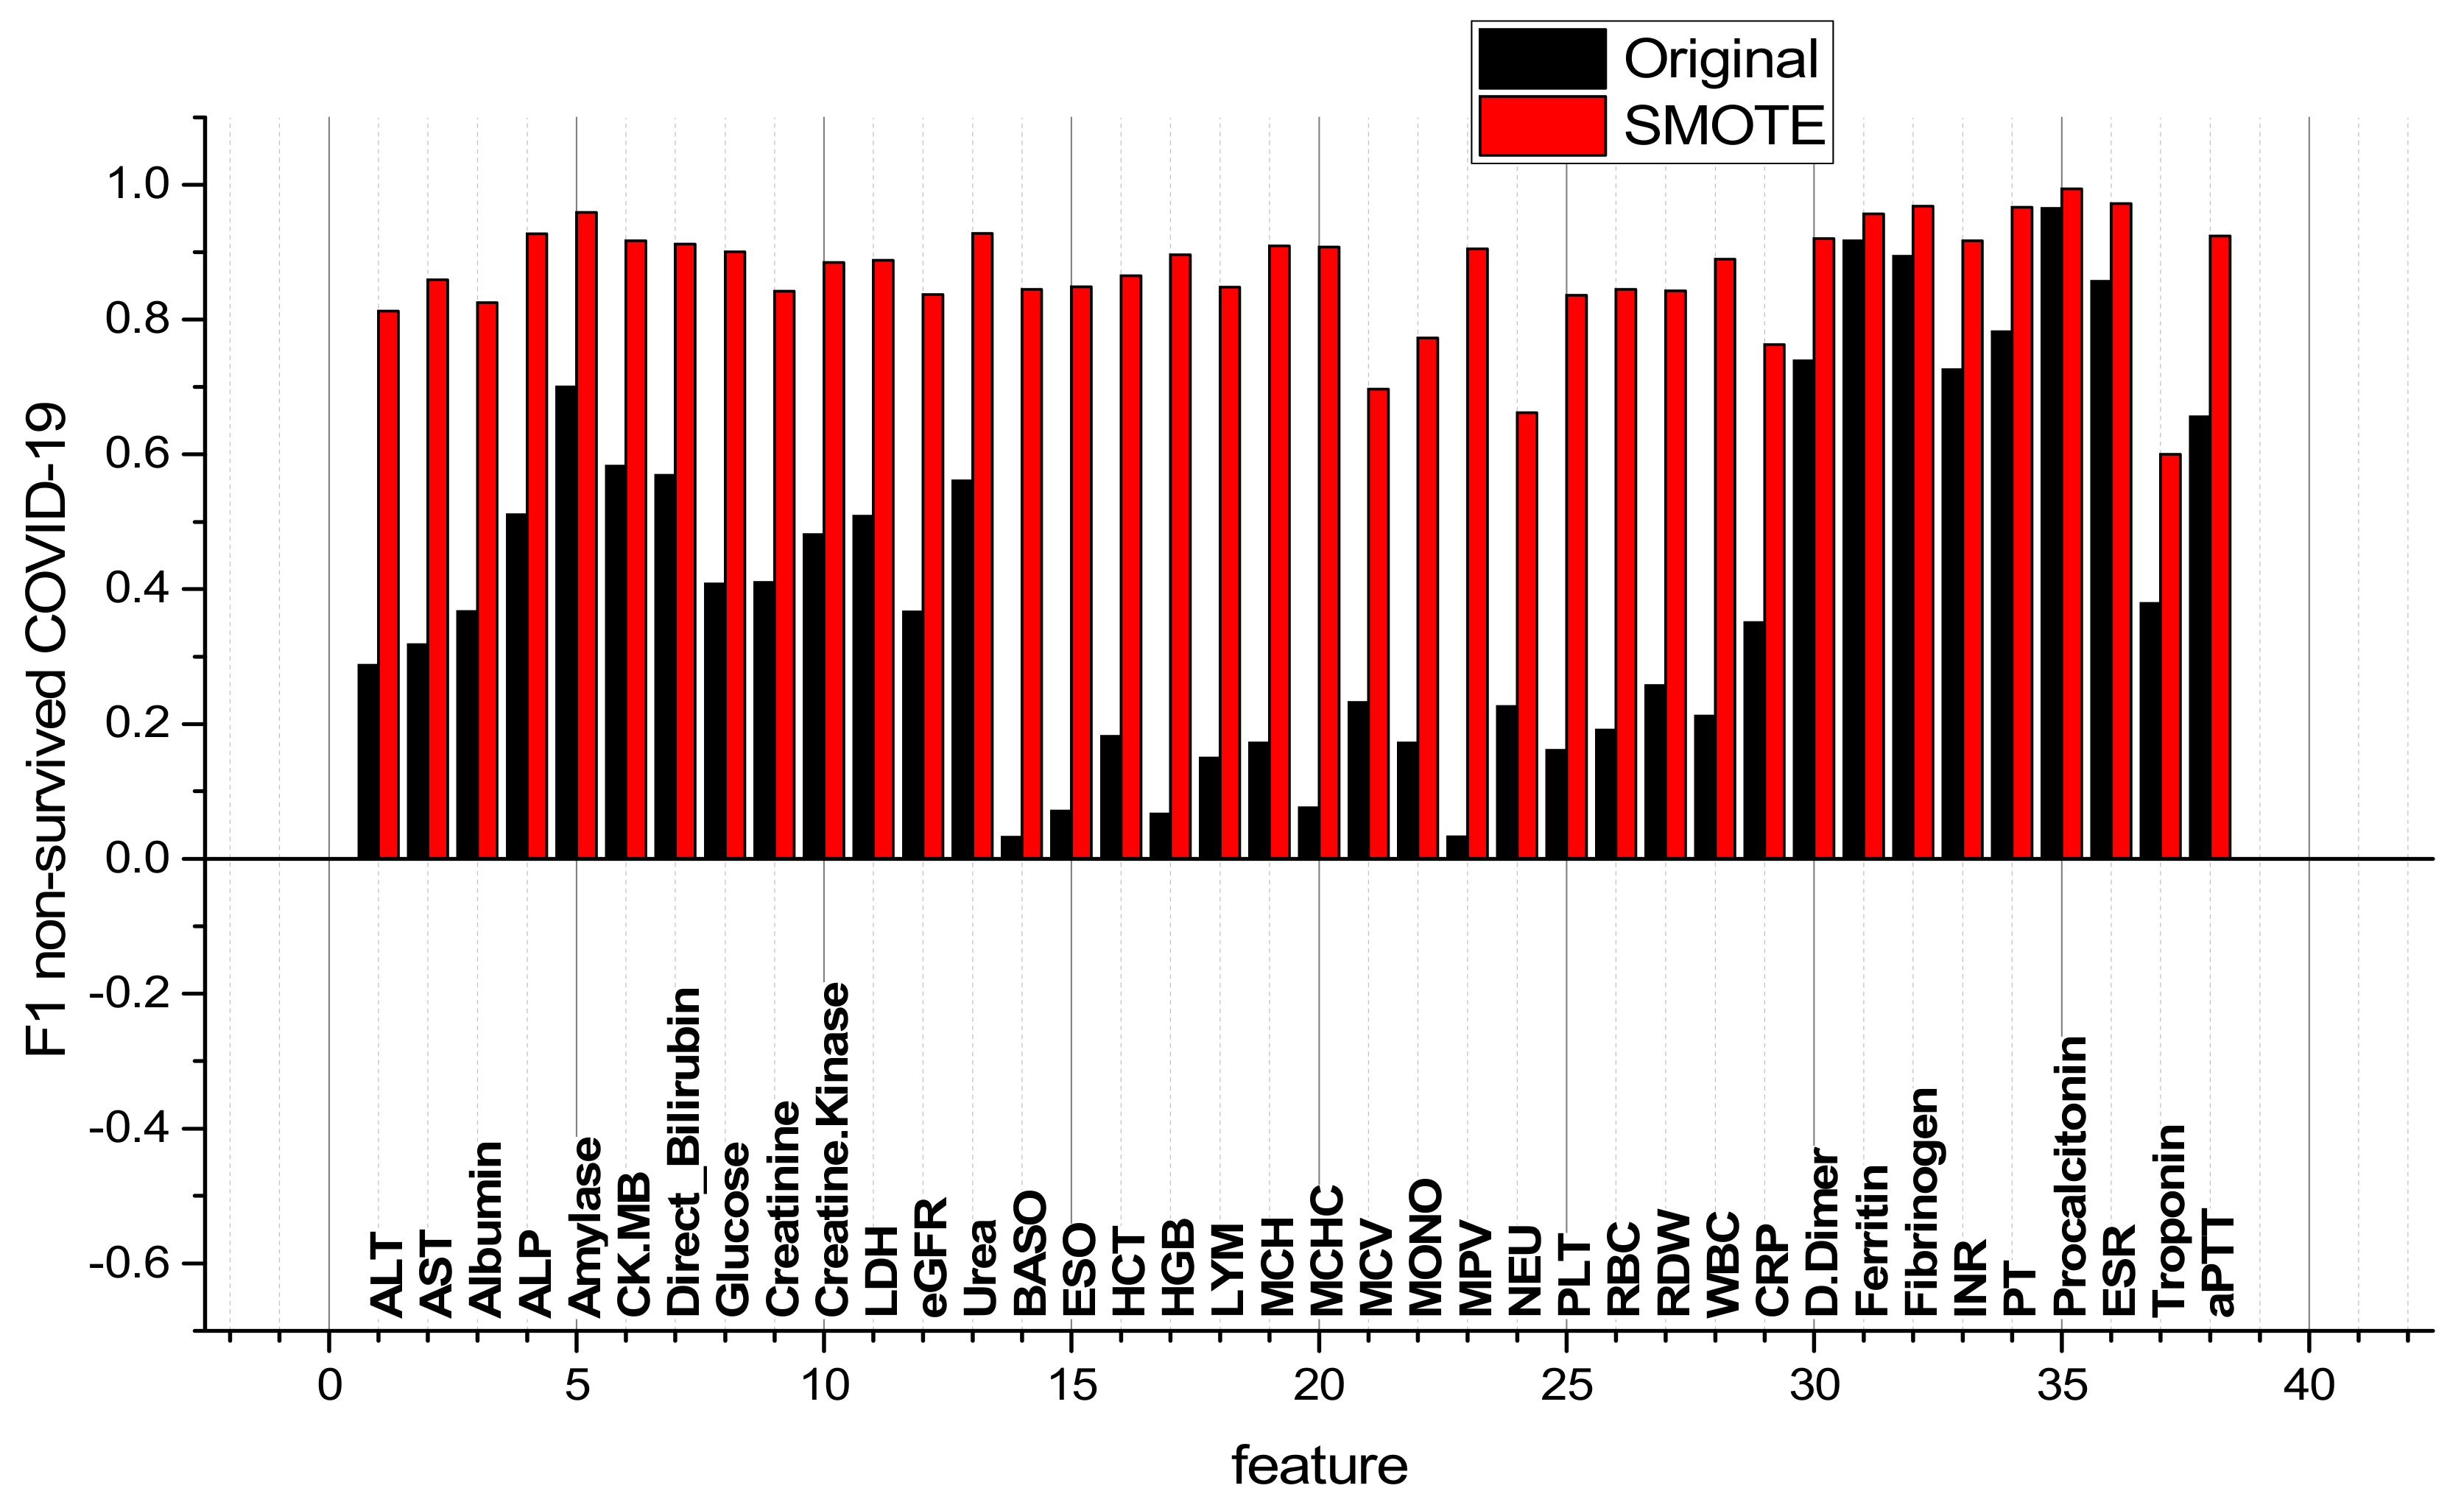
3.2. Comparison of RBV Features of Surviving and Non-Surviving COVID-19 Patients and Comparison of ML Classifiers
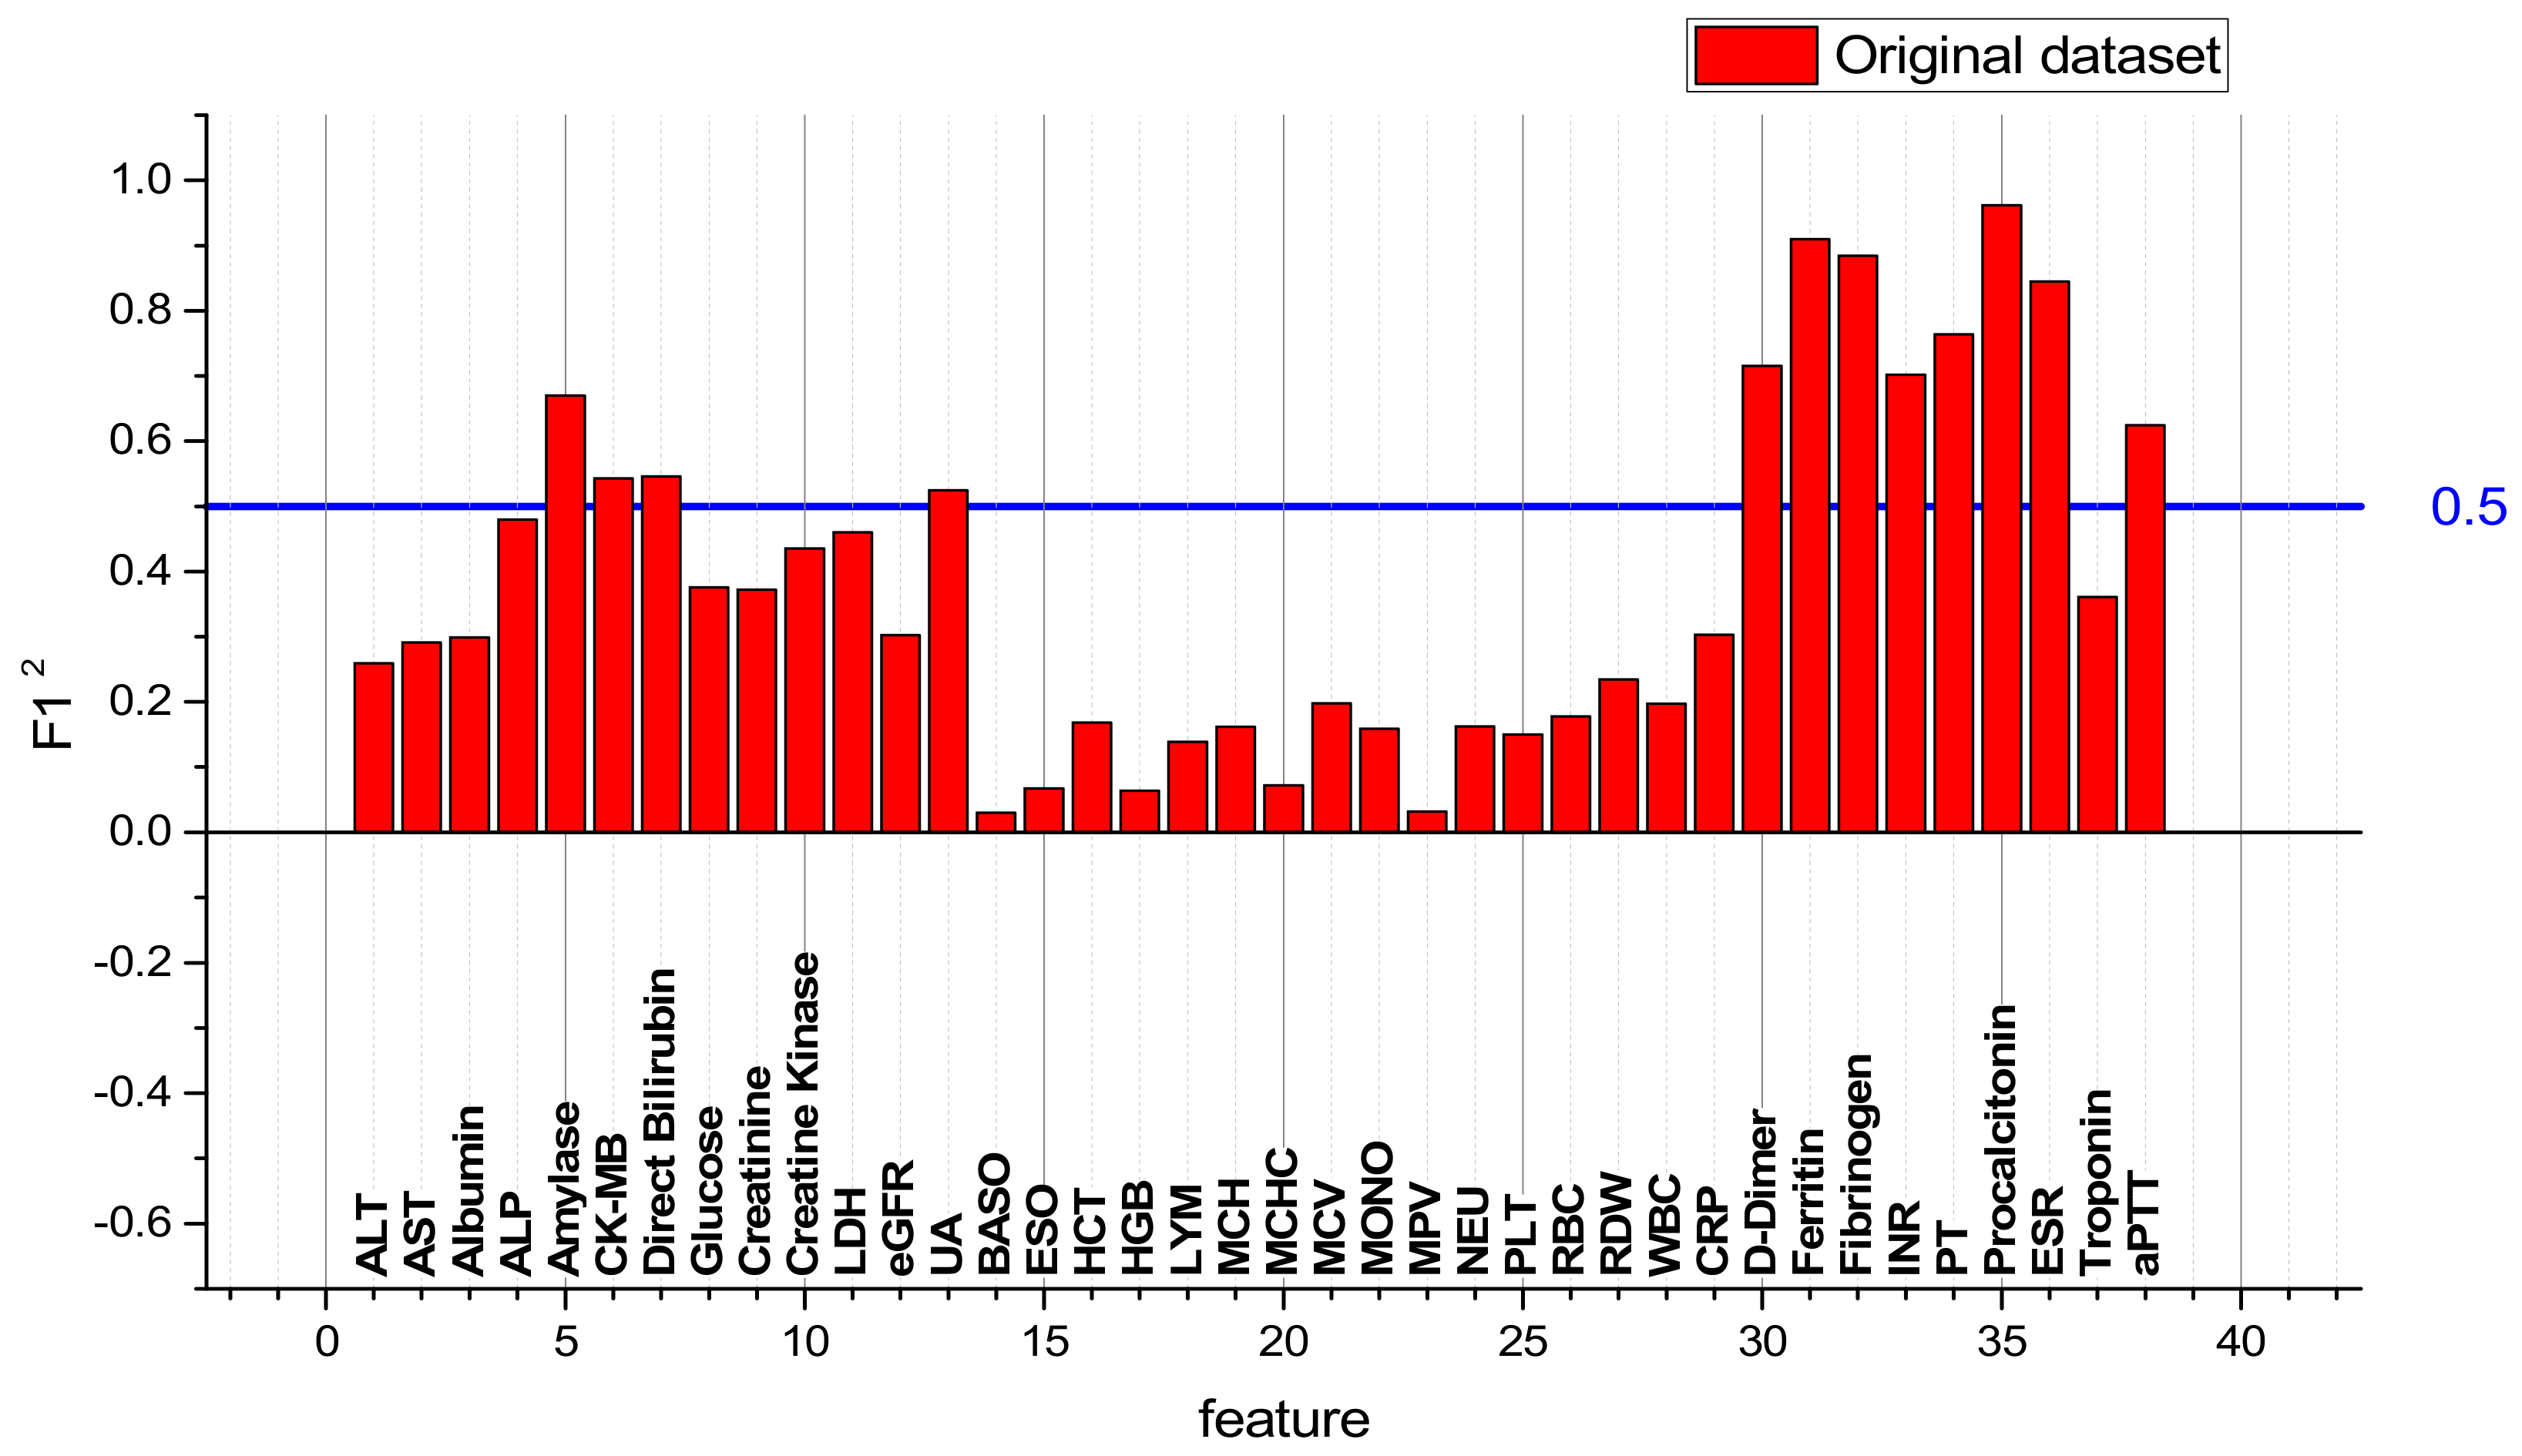
3.3. Investigation of the Effectiveness of the Models Operating on the One-Feature HGB Model
3.4. F12 Metric in the Detection of Patient Groups with the HGB Model, One-Threshold, and Two-Threshold Approaches
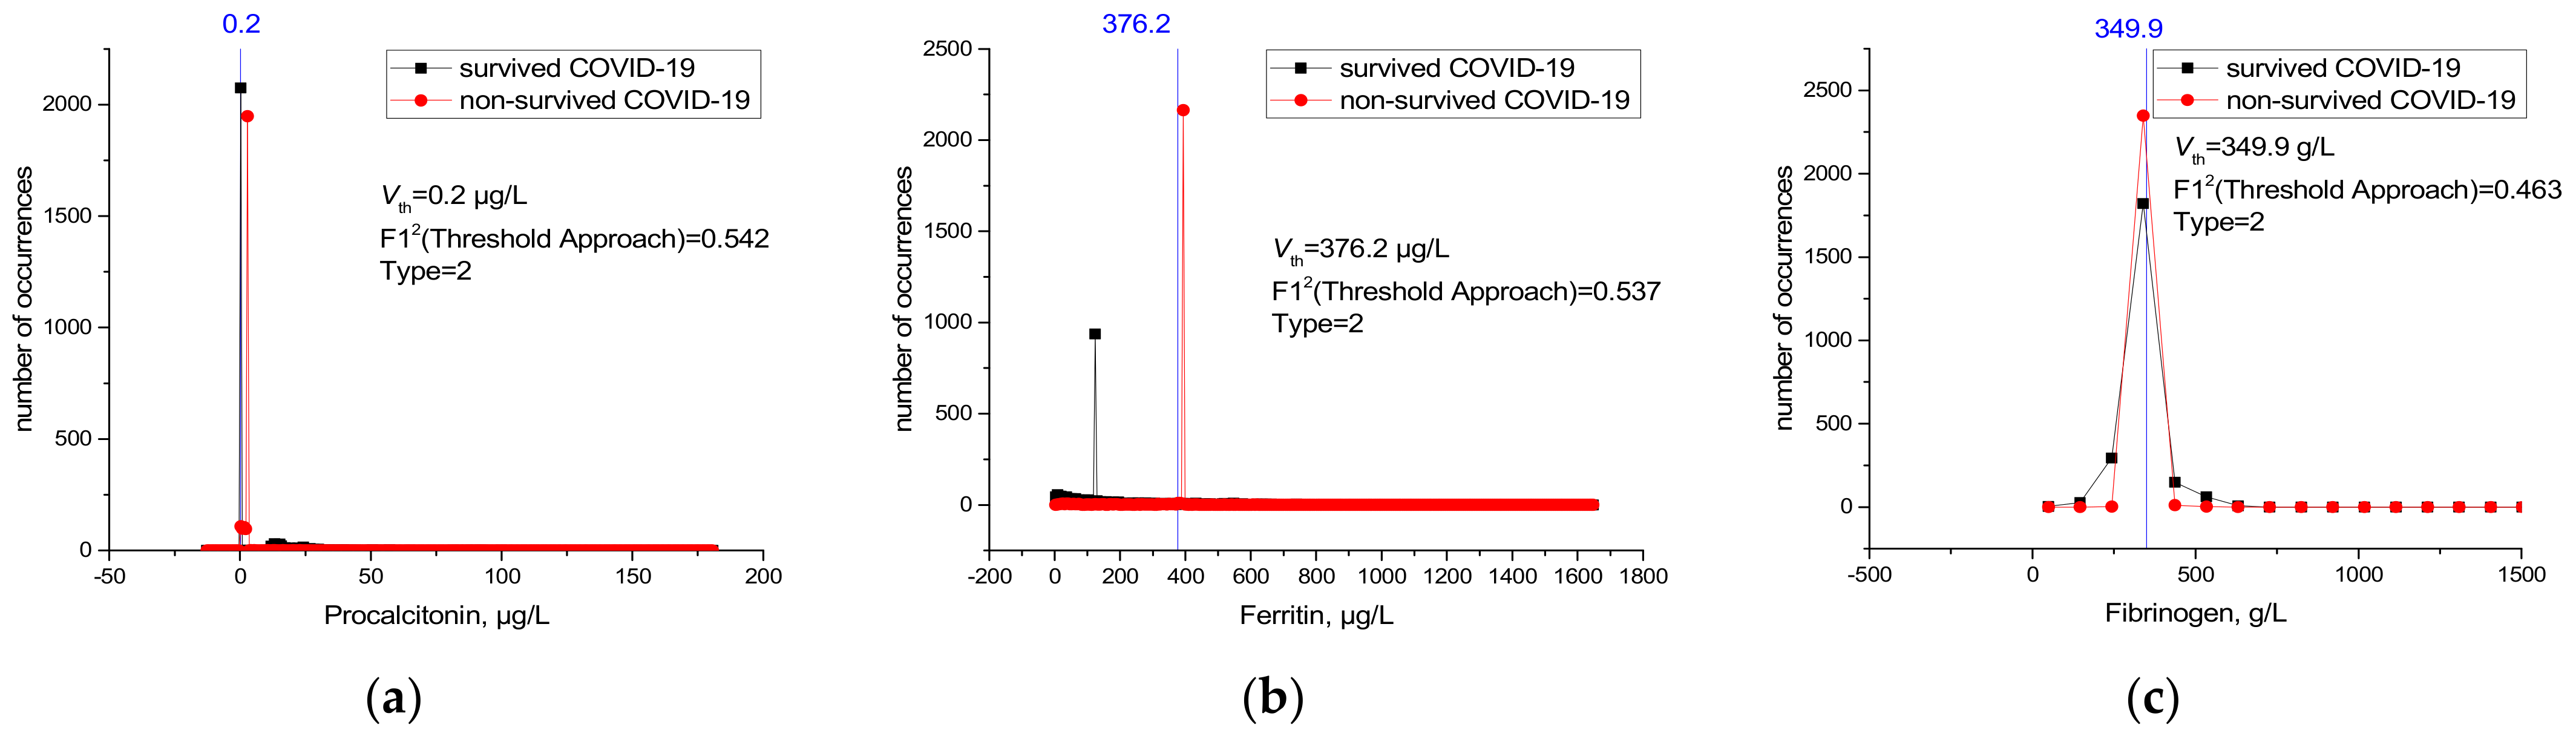
3.4.1. Threshold Approach
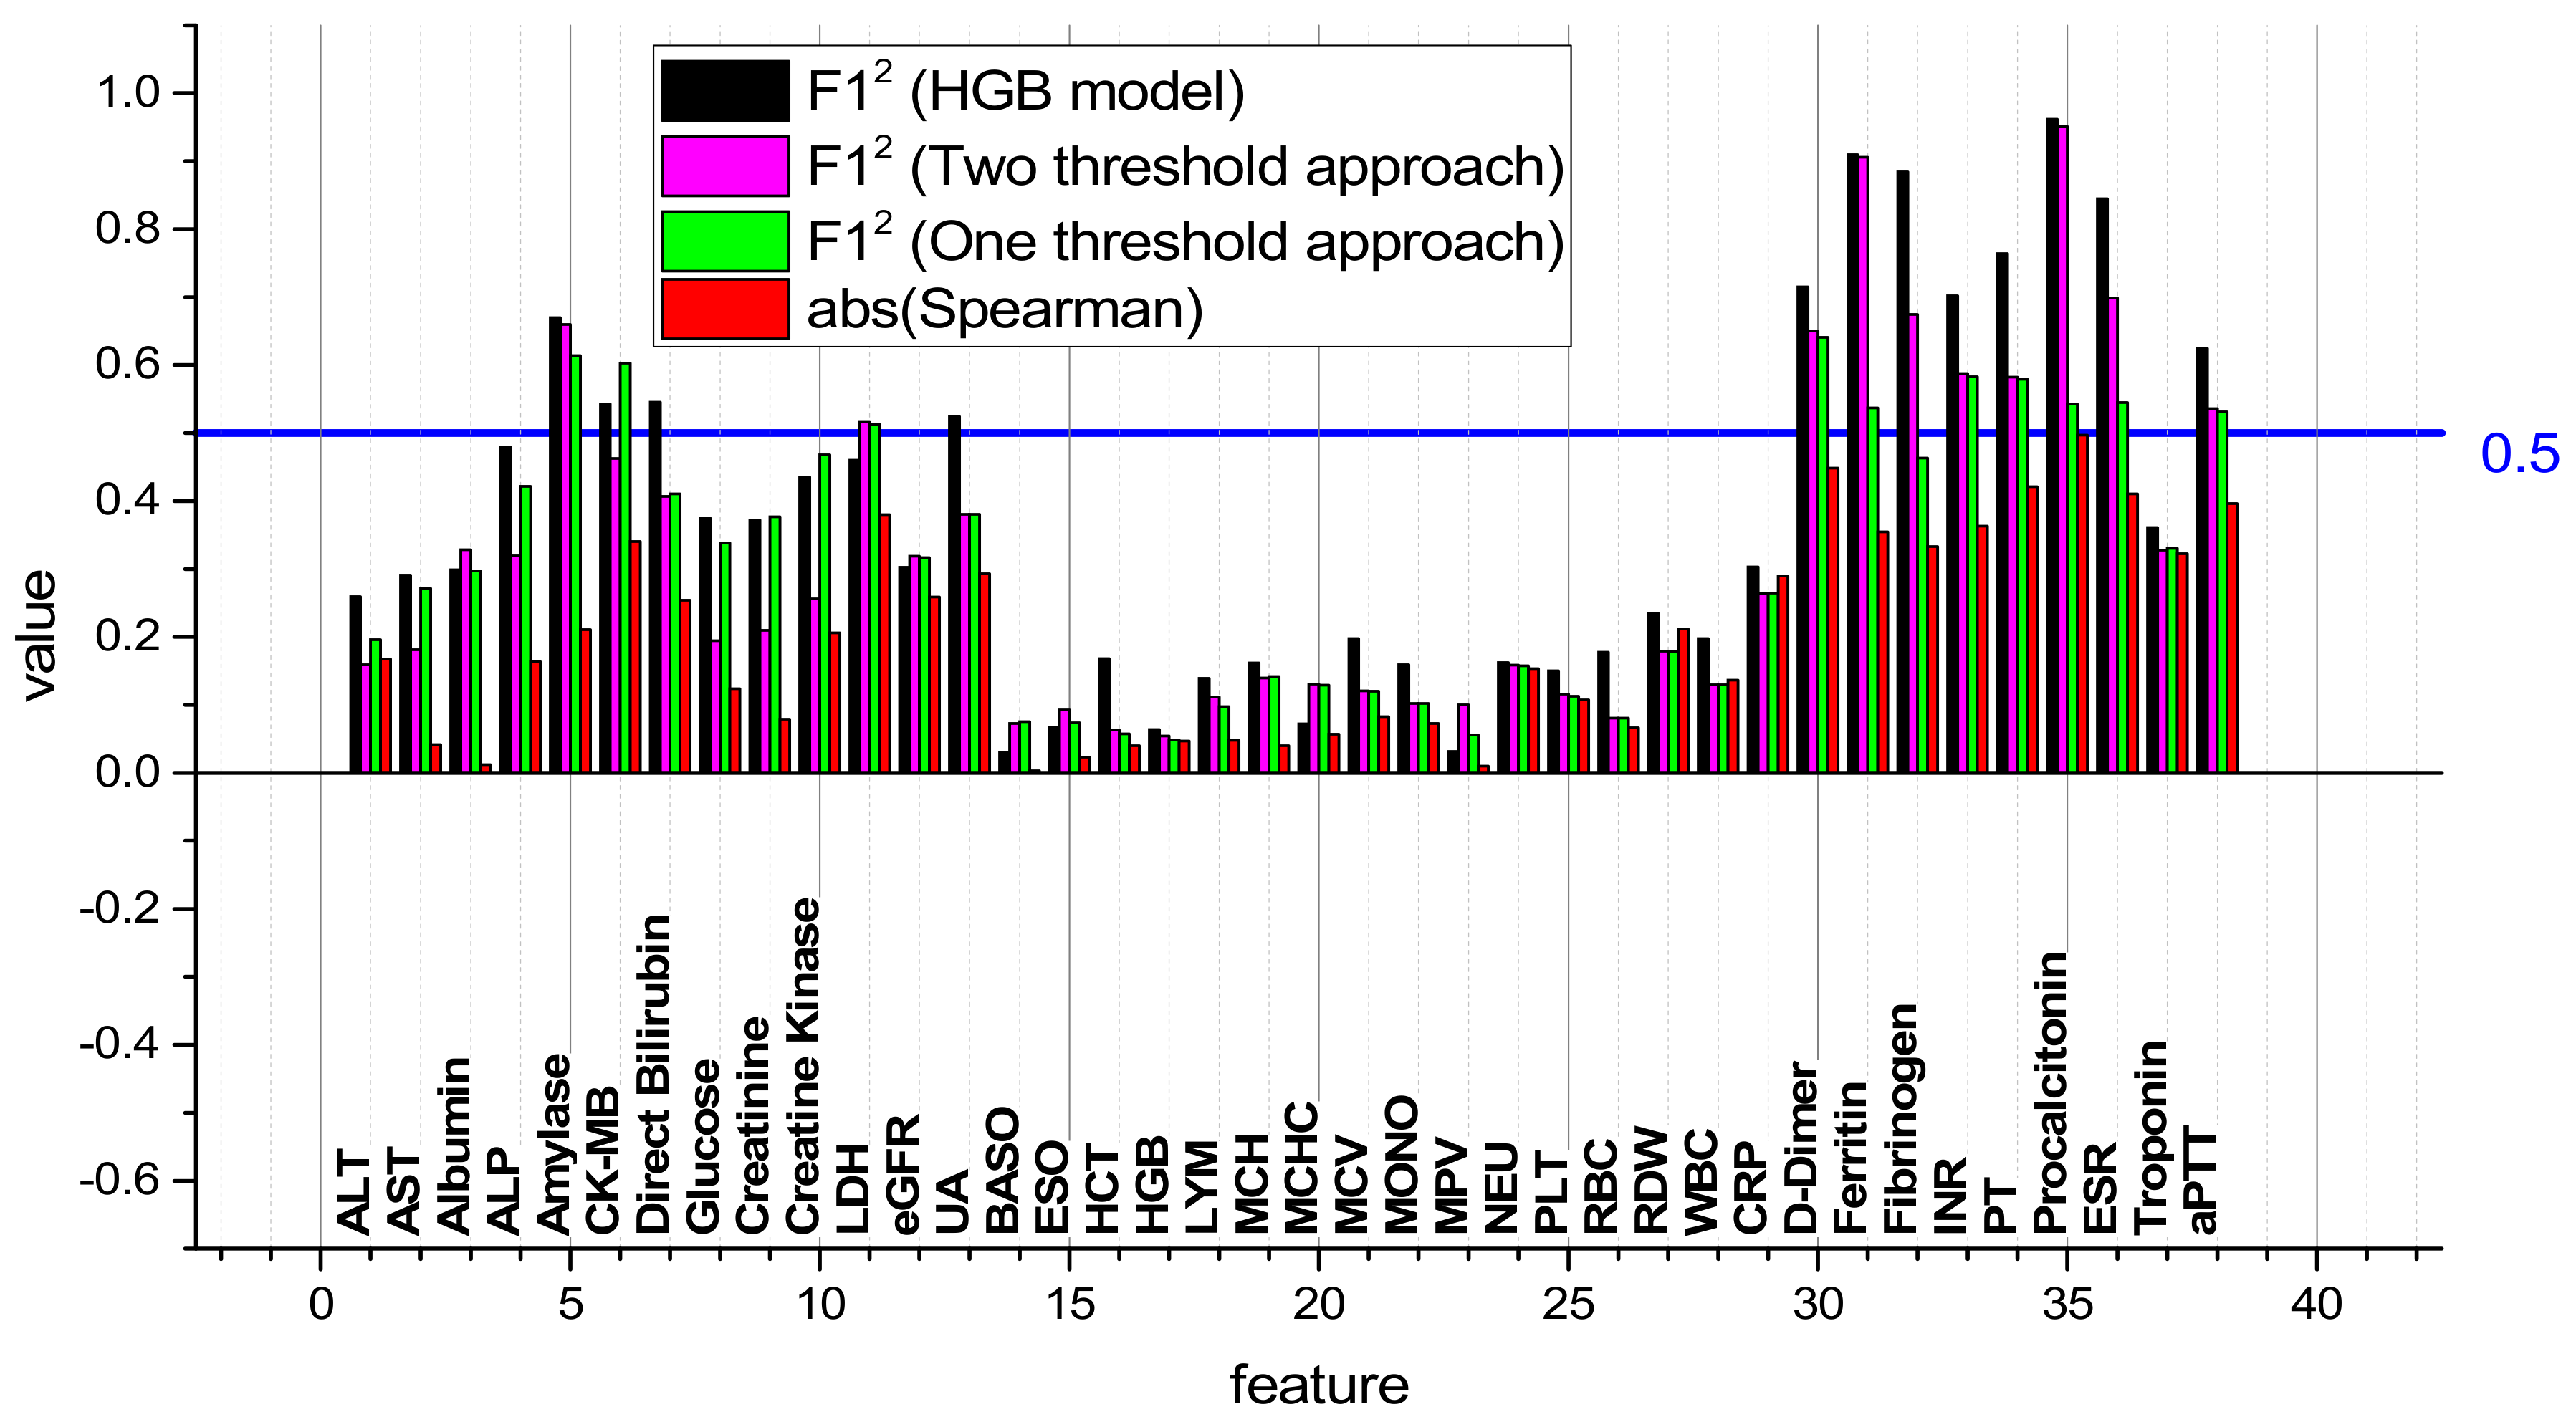
3.4.2. Comparison of Spearman Correlation and HGB Model and Threshold Approach
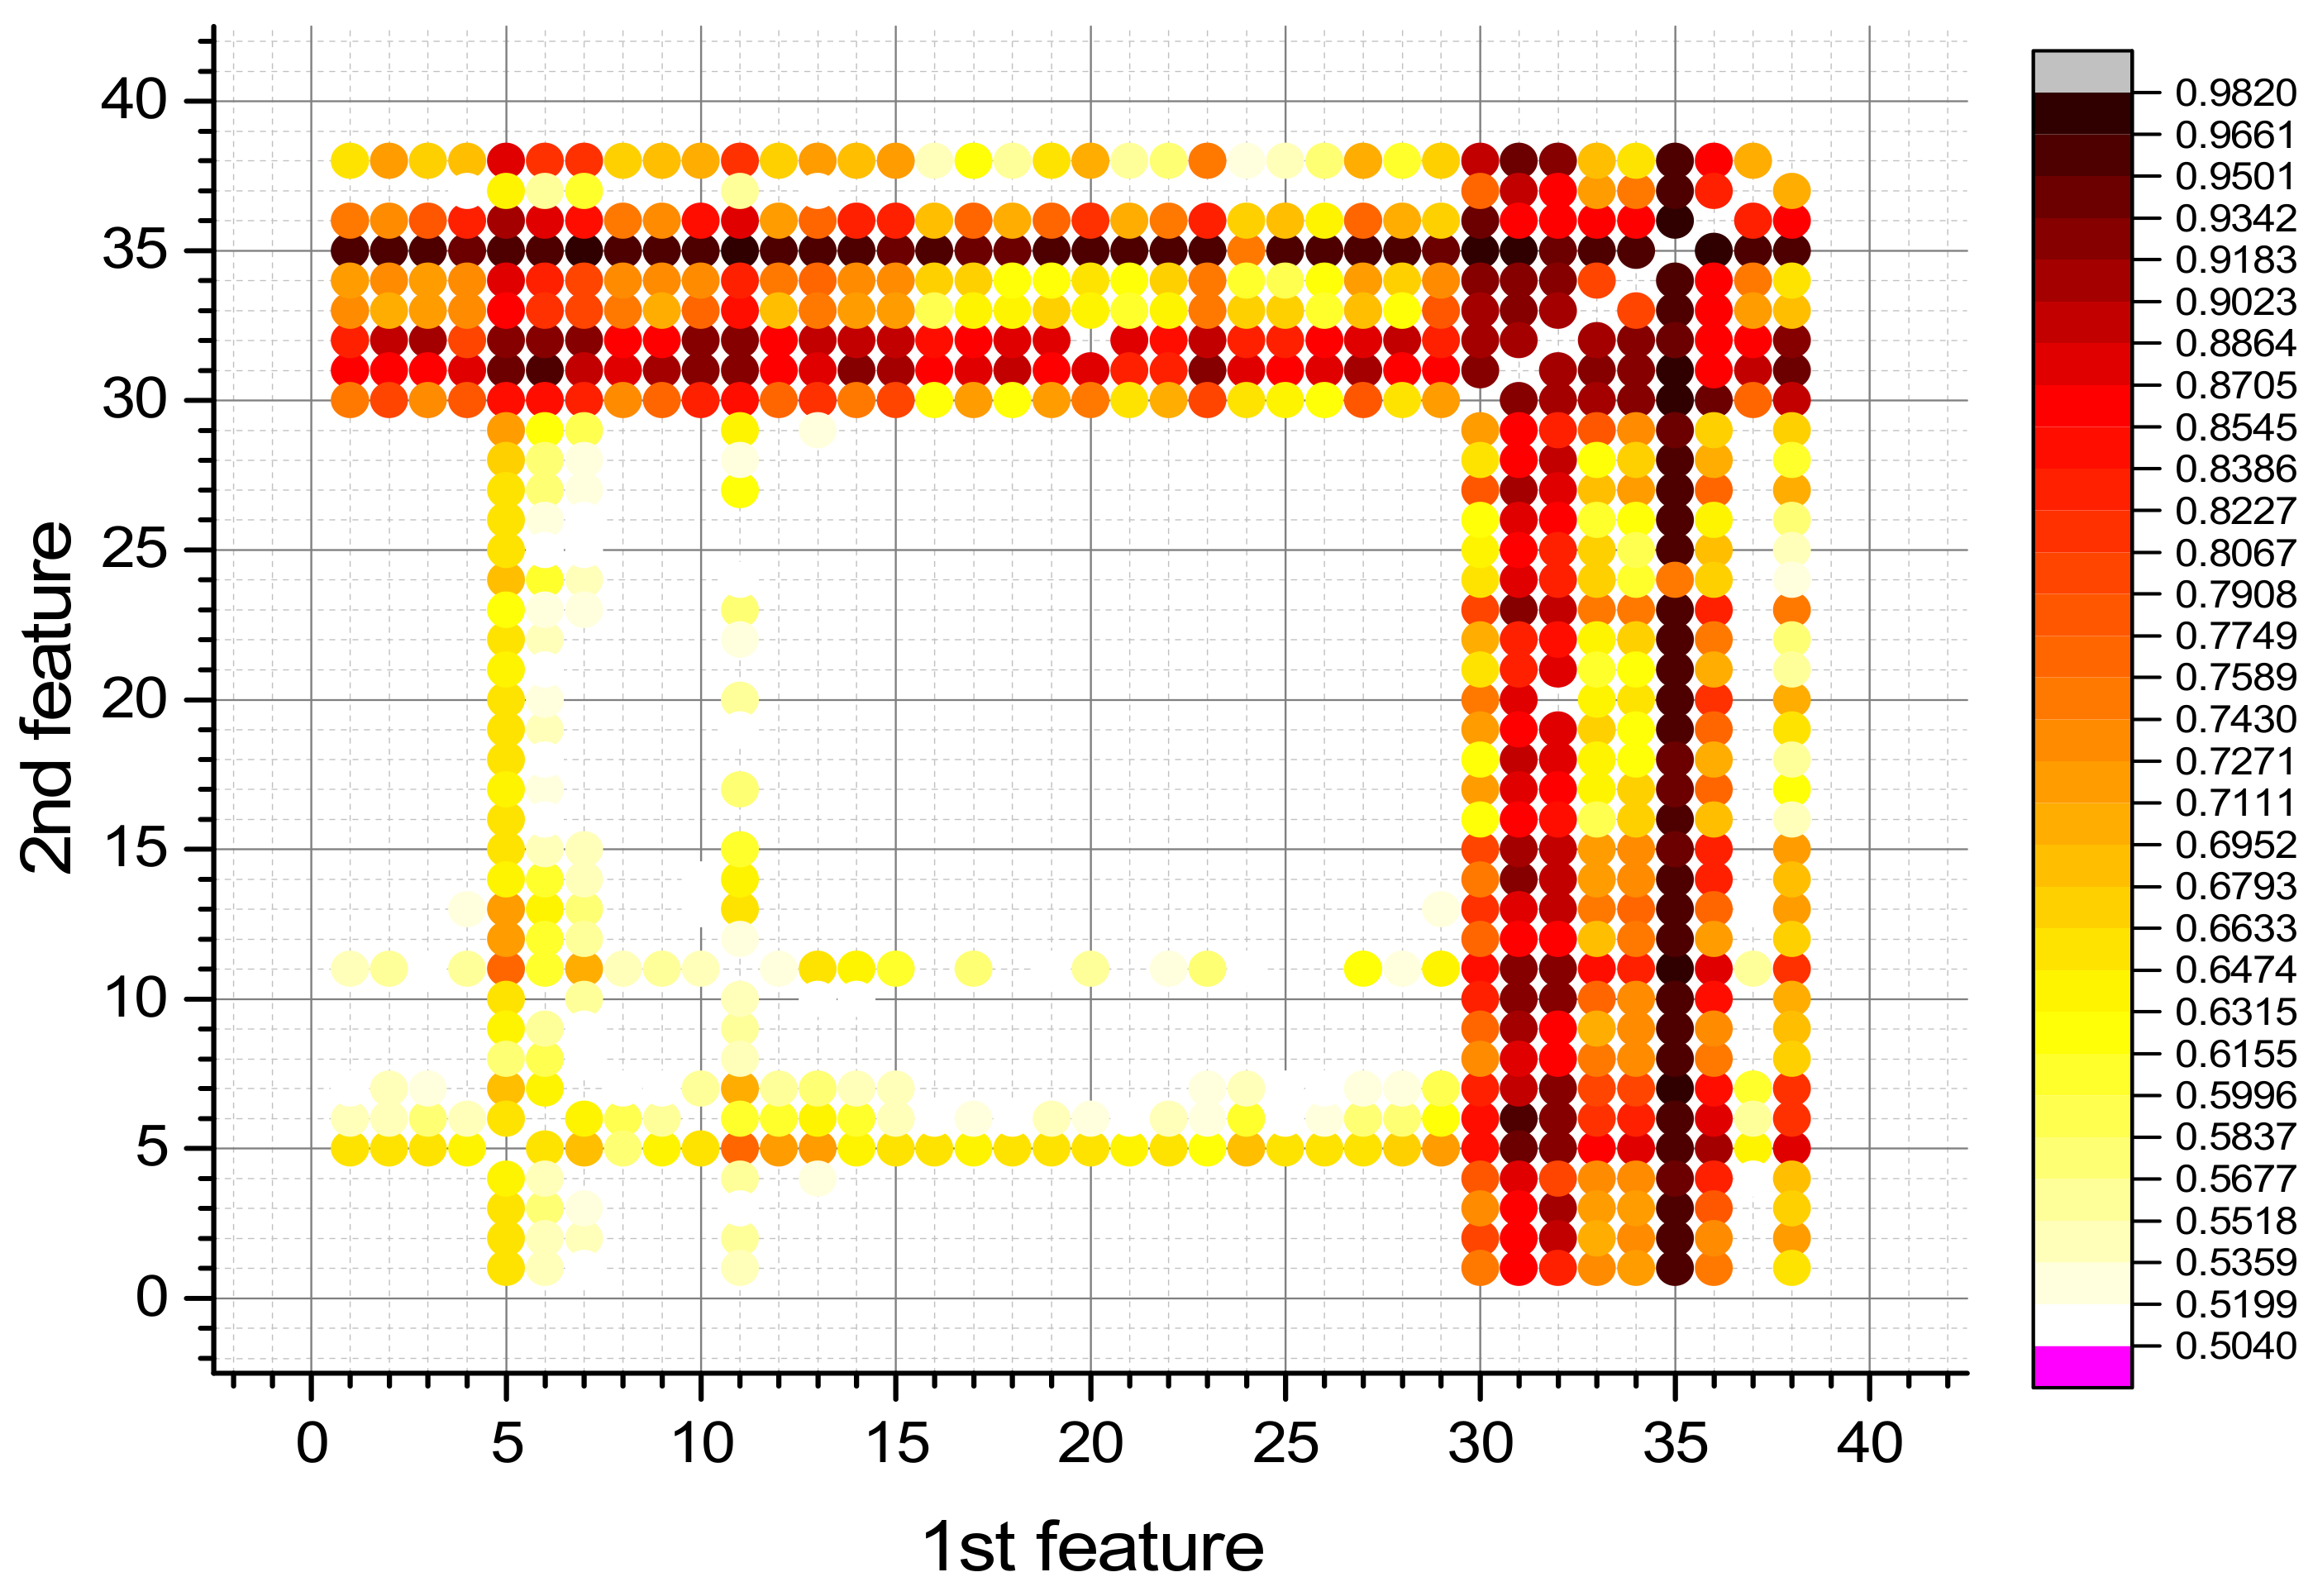
3.5. Investigation of the Effectiveness of the HGB Model Working on Two Features for the Detection of Surviving and Non-Surviving COVID-19
3.6. Concept of 1D and 2D Masks
3.6.1. 1D Mask of the HGB Model
3.6.2. 2D Mask of HGB Model
4. Discussion
5. Limitations of the Study
6. Conclusions
Supplementary Materials
Author Contributions
Funding
Institutional Review Board Statement
Informed Consent Statement
Data Availability Statement
Acknowledgments
Conflicts of Interest
Appendix A

| Precision | Recall | F1 | F12 | |||||
|---|---|---|---|---|---|---|---|---|
| № | Feature | Surv. | Non-Surv. | Surv. | Non-Surv. | Surv. | Non-Surv. | |
| 1 | ALT | 0.8558 | 0.3245 | 0.9292 | 0.1803 | 0.8909 | 0.2314 | 0.20615 |
| 2 | AST | 0.8904 | 0.3771 | 0.9369 | 0.2486 | 0.913 | 0.2981 | 0.27217 |
| 3 | Albumin | 0.6832 | 0.9341 | 0.9909 | 0.2216 | 0.8086 | 0.3581 | 0.28956 |
| 4 | ALP | 0.8794 | 0.623 | 0.9604 | 0.3331 | 0.918 | 0.4324 | 0.39694 |
| 5 | Amylase | 0.9112 | 0.9692 | 0.9968 | 0.5134 | 0.952 | 0.671 | 0.63879 |
| 6 | CK-MB | 0.8655 | 0.917 | 0.9909 | 0.3975 | 0.9239 | 0.554 | 0.51184 |
| 7 | D-Bil | 0.9602 | 0.5347 | 0.9554 | 0.5713 | 0.9578 | 0.5503 | 0.52708 |
| 8 | Glucose | 0.8583 | 0.535 | 0.9504 | 0.267 | 0.902 | 0.356 | 0.32111 |
| 9 | Creatinine | 0.8367 | 0.6227 | 0.9583 | 0.2699 | 0.8933 | 0.3763 | 0.33615 |
| 10 | CK | 0.8219 | 0.7678 | 0.9735 | 0.2964 | 0.8911 | 0.4267 | 0.38023 |
| 11 | LDH | 0.8498 | 0.8774 | 0.9867 | 0.3659 | 0.9126 | 0.5127 | 0.46789 |
| 12 | eGFR | 0.6849 | 0.9037 | 0.9868 | 0.2174 | 0.8082 | 0.3501 | 0.28295 |
| 13 | UA | 0.8824 | 0.7586 | 0.9743 | 0.3858 | 0.926 | 0.5106 | 0.47282 |
| 14 | BASO | 0.9953 | 0.0088 | 0.9124 | 0.0786 | 0.952 | 0.0157 | 0.01495 |
| 15 | EOS | 0.9818 | 0.013 | 0.9116 | 0.0533 | 0.9454 | 0.0208 | 0.01966 |
| 16 | HCT | 0.9057 | 0.0967 | 0.9123 | 0.0853 | 0.9088 | 0.0887 | 0.08061 |
| 17 | HGB | 0.9873 | 0.0264 | 0.9131 | 0.1552 | 0.9488 | 0.045 | 0.0427 |
| 18 | LYM | 0.8481 | 0.1971 | 0.9165 | 0.1071 | 0.8808 | 0.1382 | 0.12173 |
| 19 | MCH | 0.9543 | 0.1097 | 0.9175 | 0.1955 | 0.9355 | 0.1379 | 0.12901 |
| 20 | MCHC | 0.9797 | 0.0439 | 0.914 | 0.1375 | 0.9457 | 0.0663 | 0.0627 |
| 21 | MCV | 0.8079 | 0.2544 | 0.9182 | 0.115 | 0.8594 | 0.1581 | 0.13587 |
| 22 | MONO | 0.9061 | 0.1665 | 0.9185 | 0.1491 | 0.9122 | 0.1569 | 0.14312 |
| 23 | MPV | 0.9949 | 0.0043 | 0.912 | 0.1 | 0.9516 | 0.0083 | 0.0079 |
| 24 | NEU | 0.4962 | 0.6972 | 0.9442 | 0.1181 | 0.6503 | 0.2019 | 0.1313 |
| 25 | PLT | 0.8697 | 0.1671 | 0.9154 | 0.1103 | 0.8918 | 0.1319 | 0.11763 |
| 26 | RBC | 0.8837 | 0.1185 | 0.9122 | 0.0888 | 0.8976 | 0.1007 | 0.09039 |
| 27 | RDW | 0.9082 | 0.2454 | 0.9258 | 0.2067 | 0.9169 | 0.2241 | 0.20548 |
| 28 | WBC | 0.9154 | 0.1798 | 0.9206 | 0.1629 | 0.9178 | 0.1678 | 0.15401 |
| 29 | CRP | 0.7386 | 0.6888 | 0.961 | 0.2034 | 0.835 | 0.3136 | 0.26186 |
| 30 | D-dimer | 0.937 | 0.842 | 0.984 | 0.5677 | 0.9599 | 0.6769 | 0.64976 |
| 31 | Ferritin | 0.9852 | 0.9253 | 0.9928 | 0.8655 | 0.9889 | 0.8915 | 0.8816 |
| 32 | Fibrinogen | 0.9805 | 0.9562 | 0.9957 | 0.8274 | 0.9881 | 0.8863 | 0.87575 |
| 33 | INR | 0.9315 | 0.847 | 0.9844 | 0.548 | 0.9571 | 0.663 | 0.63456 |
| 34 | PT | 0.959 | 0.8253 | 0.9828 | 0.6588 | 0.9707 | 0.7312 | 0.70978 |
| 35 | Procalcitonin | 0.9992 | 0.9386 | 0.9941 | 0.991 | 0.9966 | 0.9635 | 0.96022 |
| 36 | ESR | 0.967 | 0.8684 | 0.9871 | 0.7229 | 0.9769 | 0.7868 | 0.76862 |
| 37 | Troponin | 0.967 | 0.2898 | 0.9339 | 0.4699 | 0.9501 | 0.3547 | 0.337 |
| 38 | aPTT | 0.8837 | 0.8862 | 0.9878 | 0.4266 | 0.9327 | 0.5747 | 0.53602 |
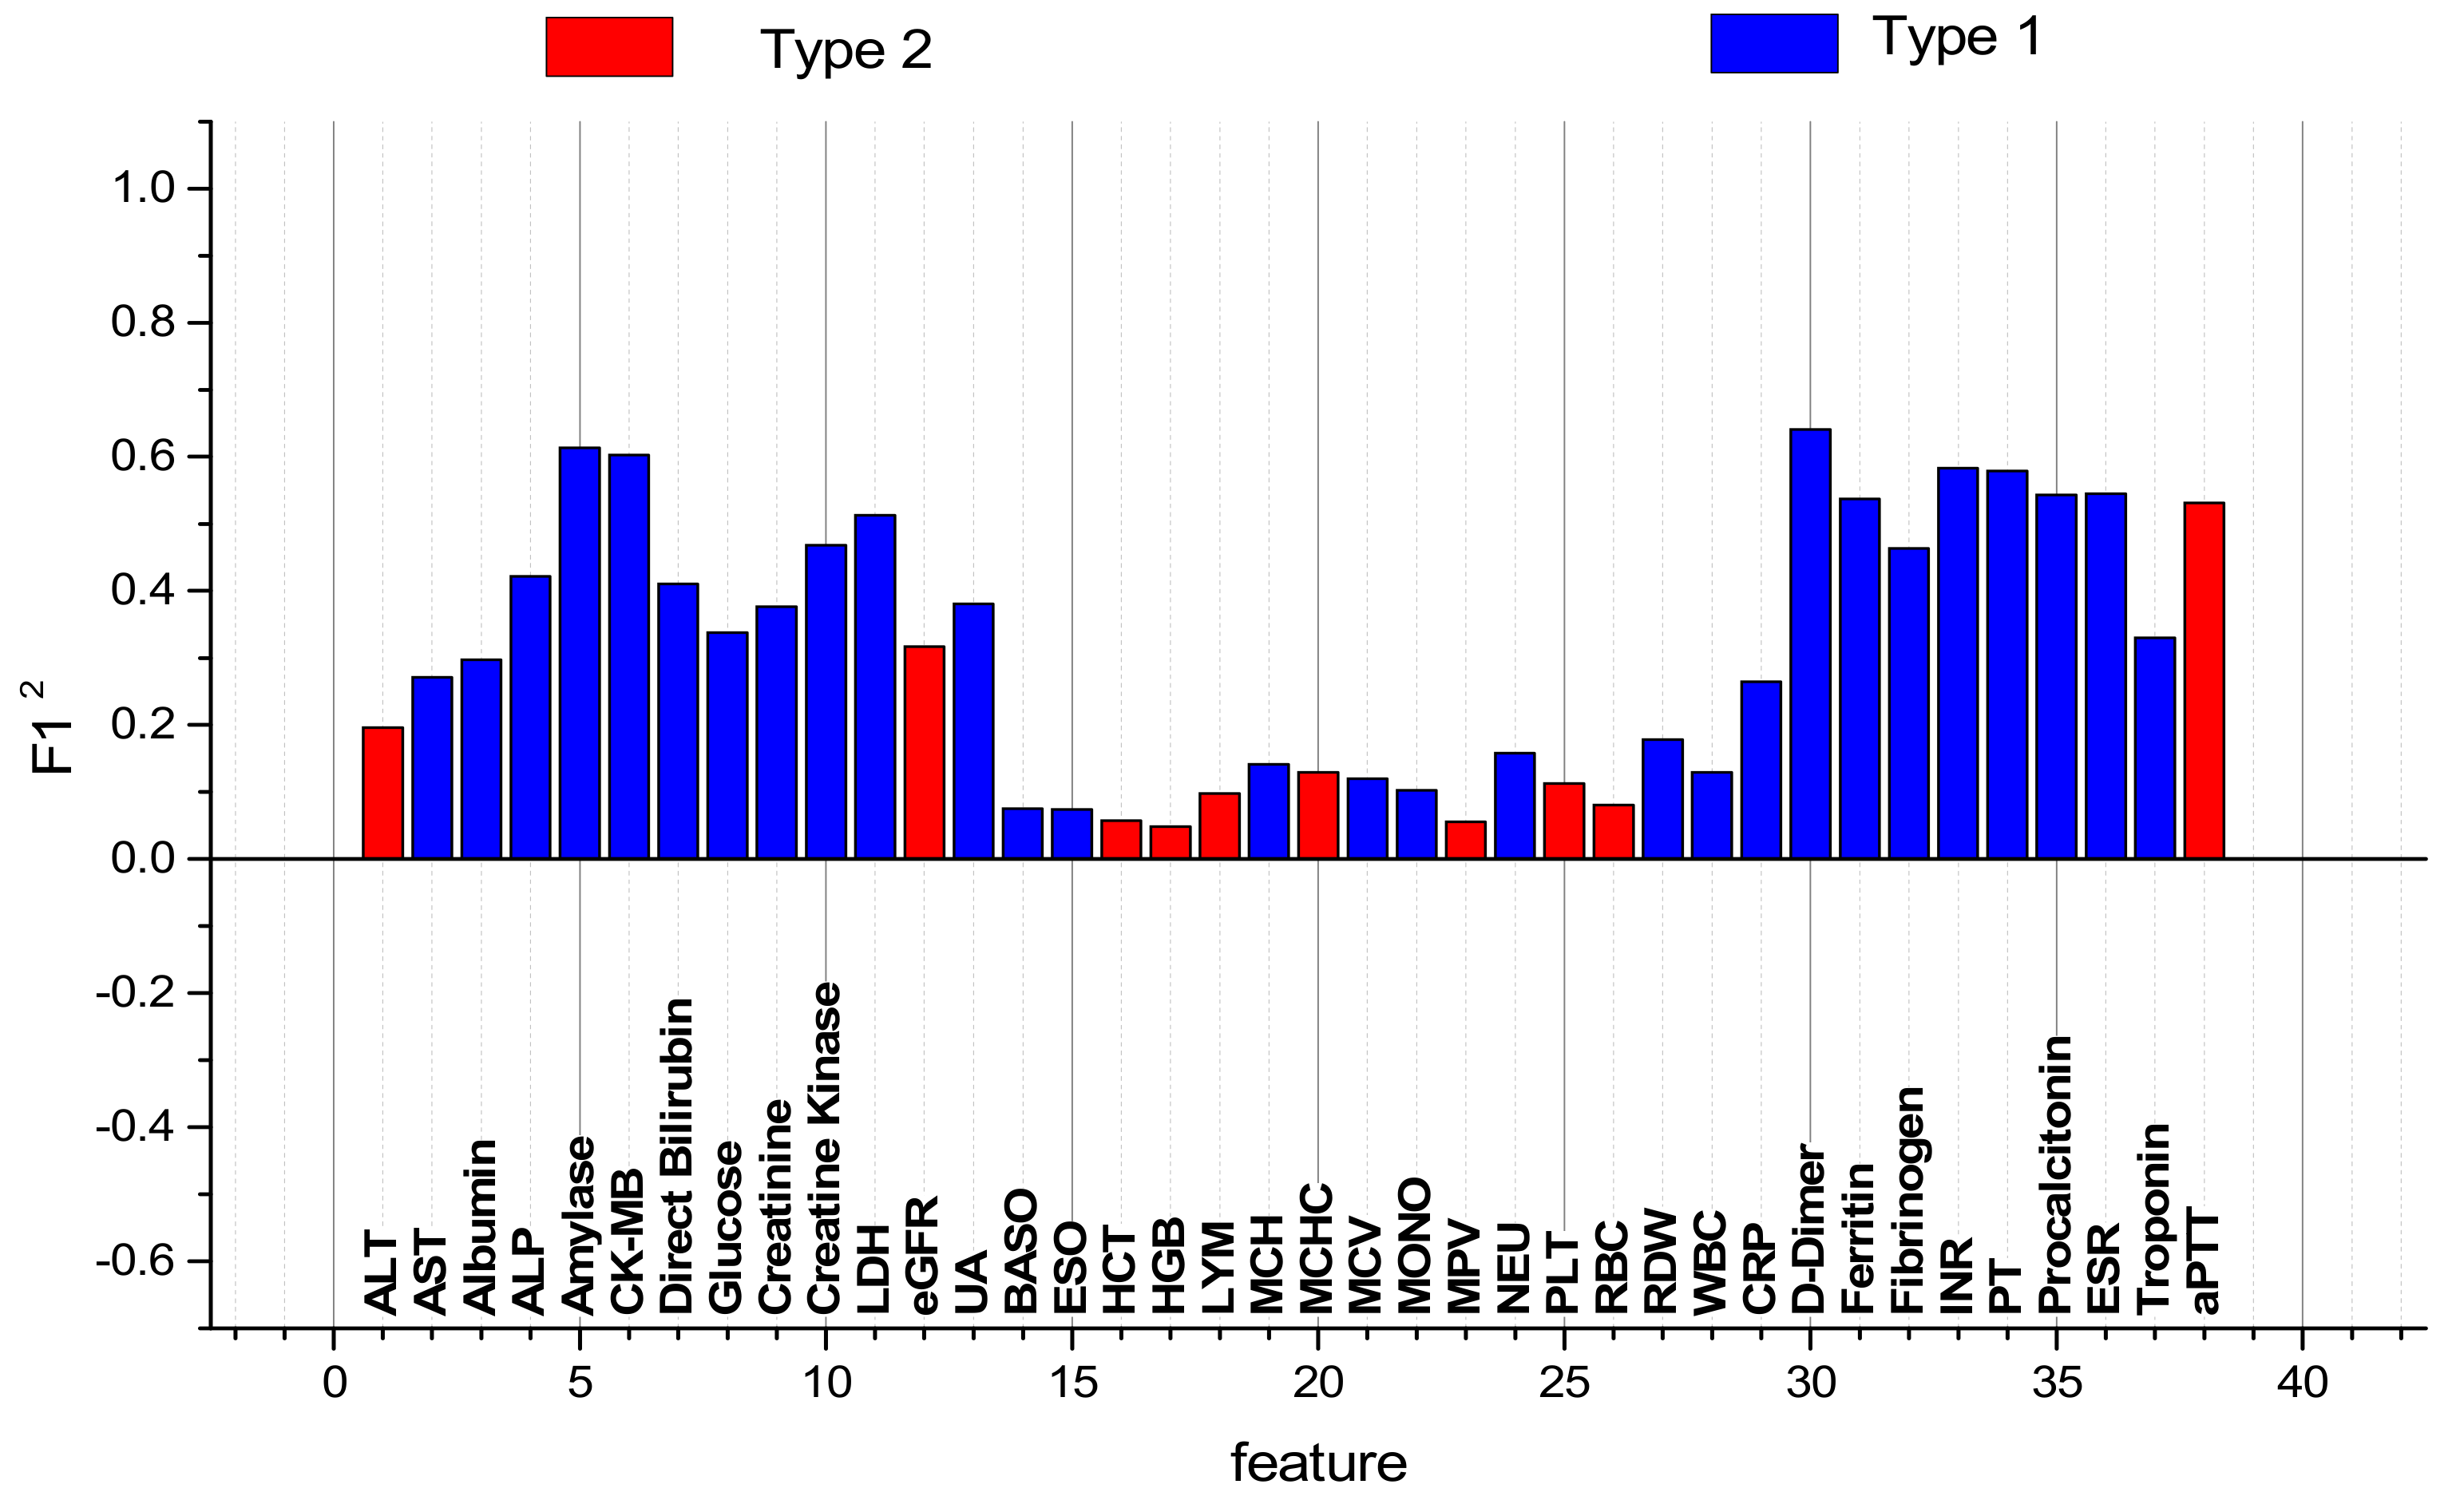
| Precision | Recall | F1 | F12 | ||||||||
|---|---|---|---|---|---|---|---|---|---|---|---|
| № | Feature (Units) | Type | Vth | Ath | Surv. | Non-Surv. | Surv. | Non-Surv. | Surv. | Non-Surv. | |
| 1 | ALT (U/L) | 1 | 34.84 | 0.649 | 0.648 | 0.665 | 0.952 | 0.157 | 0.771 | 0.254 | 0.19583 |
| 2 | AST (U/L) | 2 | 33.472 | 0.806 | 0.839 | 0.476 | 0.942 | 0.226 | 0.887 | 0.306 | 0.27142 |
| 3 | Albumin (g/L) | 2 | 49.08 | 0.918 | 0.988 | 0.206 | 0.927 | 0.632 | 0.956 | 0.311 | 0.29732 |
| 4 | ALP (U/L) | 2 | 85.305 | 0.868 | 0.893 | 0.618 | 0.96 | 0.362 | 0.925 | 0.456 | 0.4218 |
| 5 | Amylase (U/L) | 2 | 76.79 | 0.936 | 0.966 | 0.627 | 0.963 | 0.646 | 0.965 | 0.636 | 0.61374 |
| 6 | CK-MB (U/L) | 2 | 18.86 | 0.92 | 0.935 | 0.764 | 0.976 | 0.538 | 0.955 | 0.631 | 0.6026 |
| 7 | D-Bil. (mg/dL) | 2 | 0.12985 | 0.842 | 0.854 | 0.725 | 0.969 | 0.328 | 0.908 | 0.452 | 0.41042 |
| 8 | Glucose (mg/dL) | 2 | 136.854 | 0.834 | 0.862 | 0.554 | 0.951 | 0.283 | 0.904 | 0.374 | 0.3381 |
| 9 | Creatinine (mg/dL) | 2 | 1.16656 | 0.877 | 0.918 | 0.464 | 0.946 | 0.358 | 0.932 | 0.404 | 0.37653 |
| 10 | CK (U/L) | 2 | 116.1 | 0.887 | 0.912 | 0.631 | 0.962 | 0.414 | 0.936 | 0.5 | 0.468 |
| 11 | LDH (U/L) | 2 | 253.26 | 0.874 | 0.875 | 0.867 | 0.985 | 0.406 | 0.927 | 0.553 | 0.51263 |
| 12 | eGFR | 1 | 82.57429 | 0.77 | 0.772 | 0.751 | 0.969 | 0.245 | 0.859 | 0.369 | 0.31697 |
| 13 | UA (mg/dL) | 2 | 39.01 | 0.818 | 0.824 | 0.755 | 0.972 | 0.298 | 0.892 | 0.427 | 0.38088 |
| 14 | BASO (103/μL) | 2 | 0.01026 | 0.36 | 0.331 | 0.657 | 0.907 | 0.088 | 0.485 | 0.155 | 0.07517 |
| 15 | EOS (103/μL) | 2 | 0.01323 | 0.368 | 0.344 | 0.614 | 0.9 | 0.084 | 0.498 | 0.148 | 0.0737 |
| 16 | HCT (%) | 1 | 44.0946 | 0.261 | 0.203 | 0.854 | 0.934 | 0.096 | 0.334 | 0.172 | 0.05745 |
| 17 | HGB (g/L) | 1 | 15.3972 | 0.229 | 0.162 | 0.906 | 0.946 | 0.096 | 0.277 | 0.174 | 0.0482 |
| 18 | LYM (103/μL) | 1 | 1.72672 | 0.414 | 0.384 | 0.712 | 0.931 | 0.102 | 0.544 | 0.179 | 0.09738 |
| 19 | MCH (pg) | 2 | 29.6058 | 0.721 | 0.761 | 0.318 | 0.919 | 0.116 | 0.832 | 0.17 | 0.14144 |
| 20 | MCHC (g/dL) | 1 | 33.696 | 0.56 | 0.56 | 0.558 | 0.928 | 0.111 | 0.699 | 0.185 | 0.12931 |
| 21 | MCV (fL) | 2 | 83.7456 | 0.503 | 0.489 | 0.639 | 0.932 | 0.11 | 0.642 | 0.187 | 0.12005 |
| 22 | MONO (103/μL) | 2 | 0.45078 | 0.422 | 0.392 | 0.73 | 0.936 | 0.106 | 0.553 | 0.185 | 0.10231 |
| 23 | MPV (fL) | 1 | 11.0988 | 0.265 | 0.214 | 0.785 | 0.91 | 0.09 | 0.346 | 0.161 | 0.05571 |
| 24 | NEU (103/μL) | 2 | 4.379 | 0.571 | 0.56 | 0.691 | 0.948 | 0.134 | 0.704 | 0.224 | 0.1577 |
| 25 | PLT (103/μL) | 1 | 245.85 | 0.451 | 0.423 | 0.73 | 0.941 | 0.111 | 0.584 | 0.193 | 0.11271 |
| 26 | RBC (106/μL) | 1 | 5.06844 | 0.34 | 0.294 | 0.803 | 0.938 | 0.101 | 0.448 | 0.179 | 0.08019 |
| 27 | RDW (%) | 2 | 13.2096 | 0.598 | 0.585 | 0.73 | 0.956 | 0.148 | 0.726 | 0.246 | 0.1786 |
| 28 | WBC (103/μL) | 2 | 6.2006 | 0.492 | 0.468 | 0.738 | 0.948 | 0.12 | 0.626 | 0.207 | 0.12958 |
| 29 | CRP (mg/L) | 2 | 19.488 | 0.72 | 0.719 | 0.738 | 0.965 | 0.205 | 0.824 | 0.321 | 0.2645 |
| 30 | D-dimer (μg/L) | 2 | 1009.998 | 0.92 | 0.922 | 0.906 | 0.99 | 0.533 | 0.955 | 0.671 | 0.6408 |
| 31 | Ferritin (μg/L) | 2 | 376.2 | 0.878 | 0.871 | 0.94 | 0.993 | 0.419 | 0.928 | 0.579 | 0.53731 |
| 32 | Fibrinogen (mg/dL) | 2 | 349.98608 | 0.834 | 0.82 | 0.979 | 0.997 | 0.349 | 0.9 | 0.515 | 0.4635 |
| 33 | INR | 2 | 1.15151 | 0.909 | 0.918 | 0.811 | 0.98 | 0.495 | 0.948 | 0.615 | 0.58302 |
| 34 | PT (Sec) | 2 | 13.50512 | 0.901 | 0.903 | 0.88 | 0.987 | 0.471 | 0.943 | 0.614 | 0.579 |
| 35 | PCT (ng/mL) | 2 | 0.2 | 0.882 | 0.878 | 0.923 | 0.991 | 0.427 | 0.931 | 0.583 | 0.54277 |
| 36 | ESR (nm/hr) | 2 | 36.125 | 0.883 | 0.88 | 0.918 | 0.991 | 0.43 | 0.932 | 0.585 | 0.54522 |
| 37 | Troponin (ng/L) | 2 | 13.2 | 0.906 | 0.968 | 0.279 | 0.932 | 0.461 | 0.949 | 0.348 | 0.33025 |
| 38 | aPTT (Sec) | 1 | 32.4594 | 0.875 | 0.87 | 0.931 | 0.992 | 0.413 | 0.927 | 0.573 | 0.53117 |
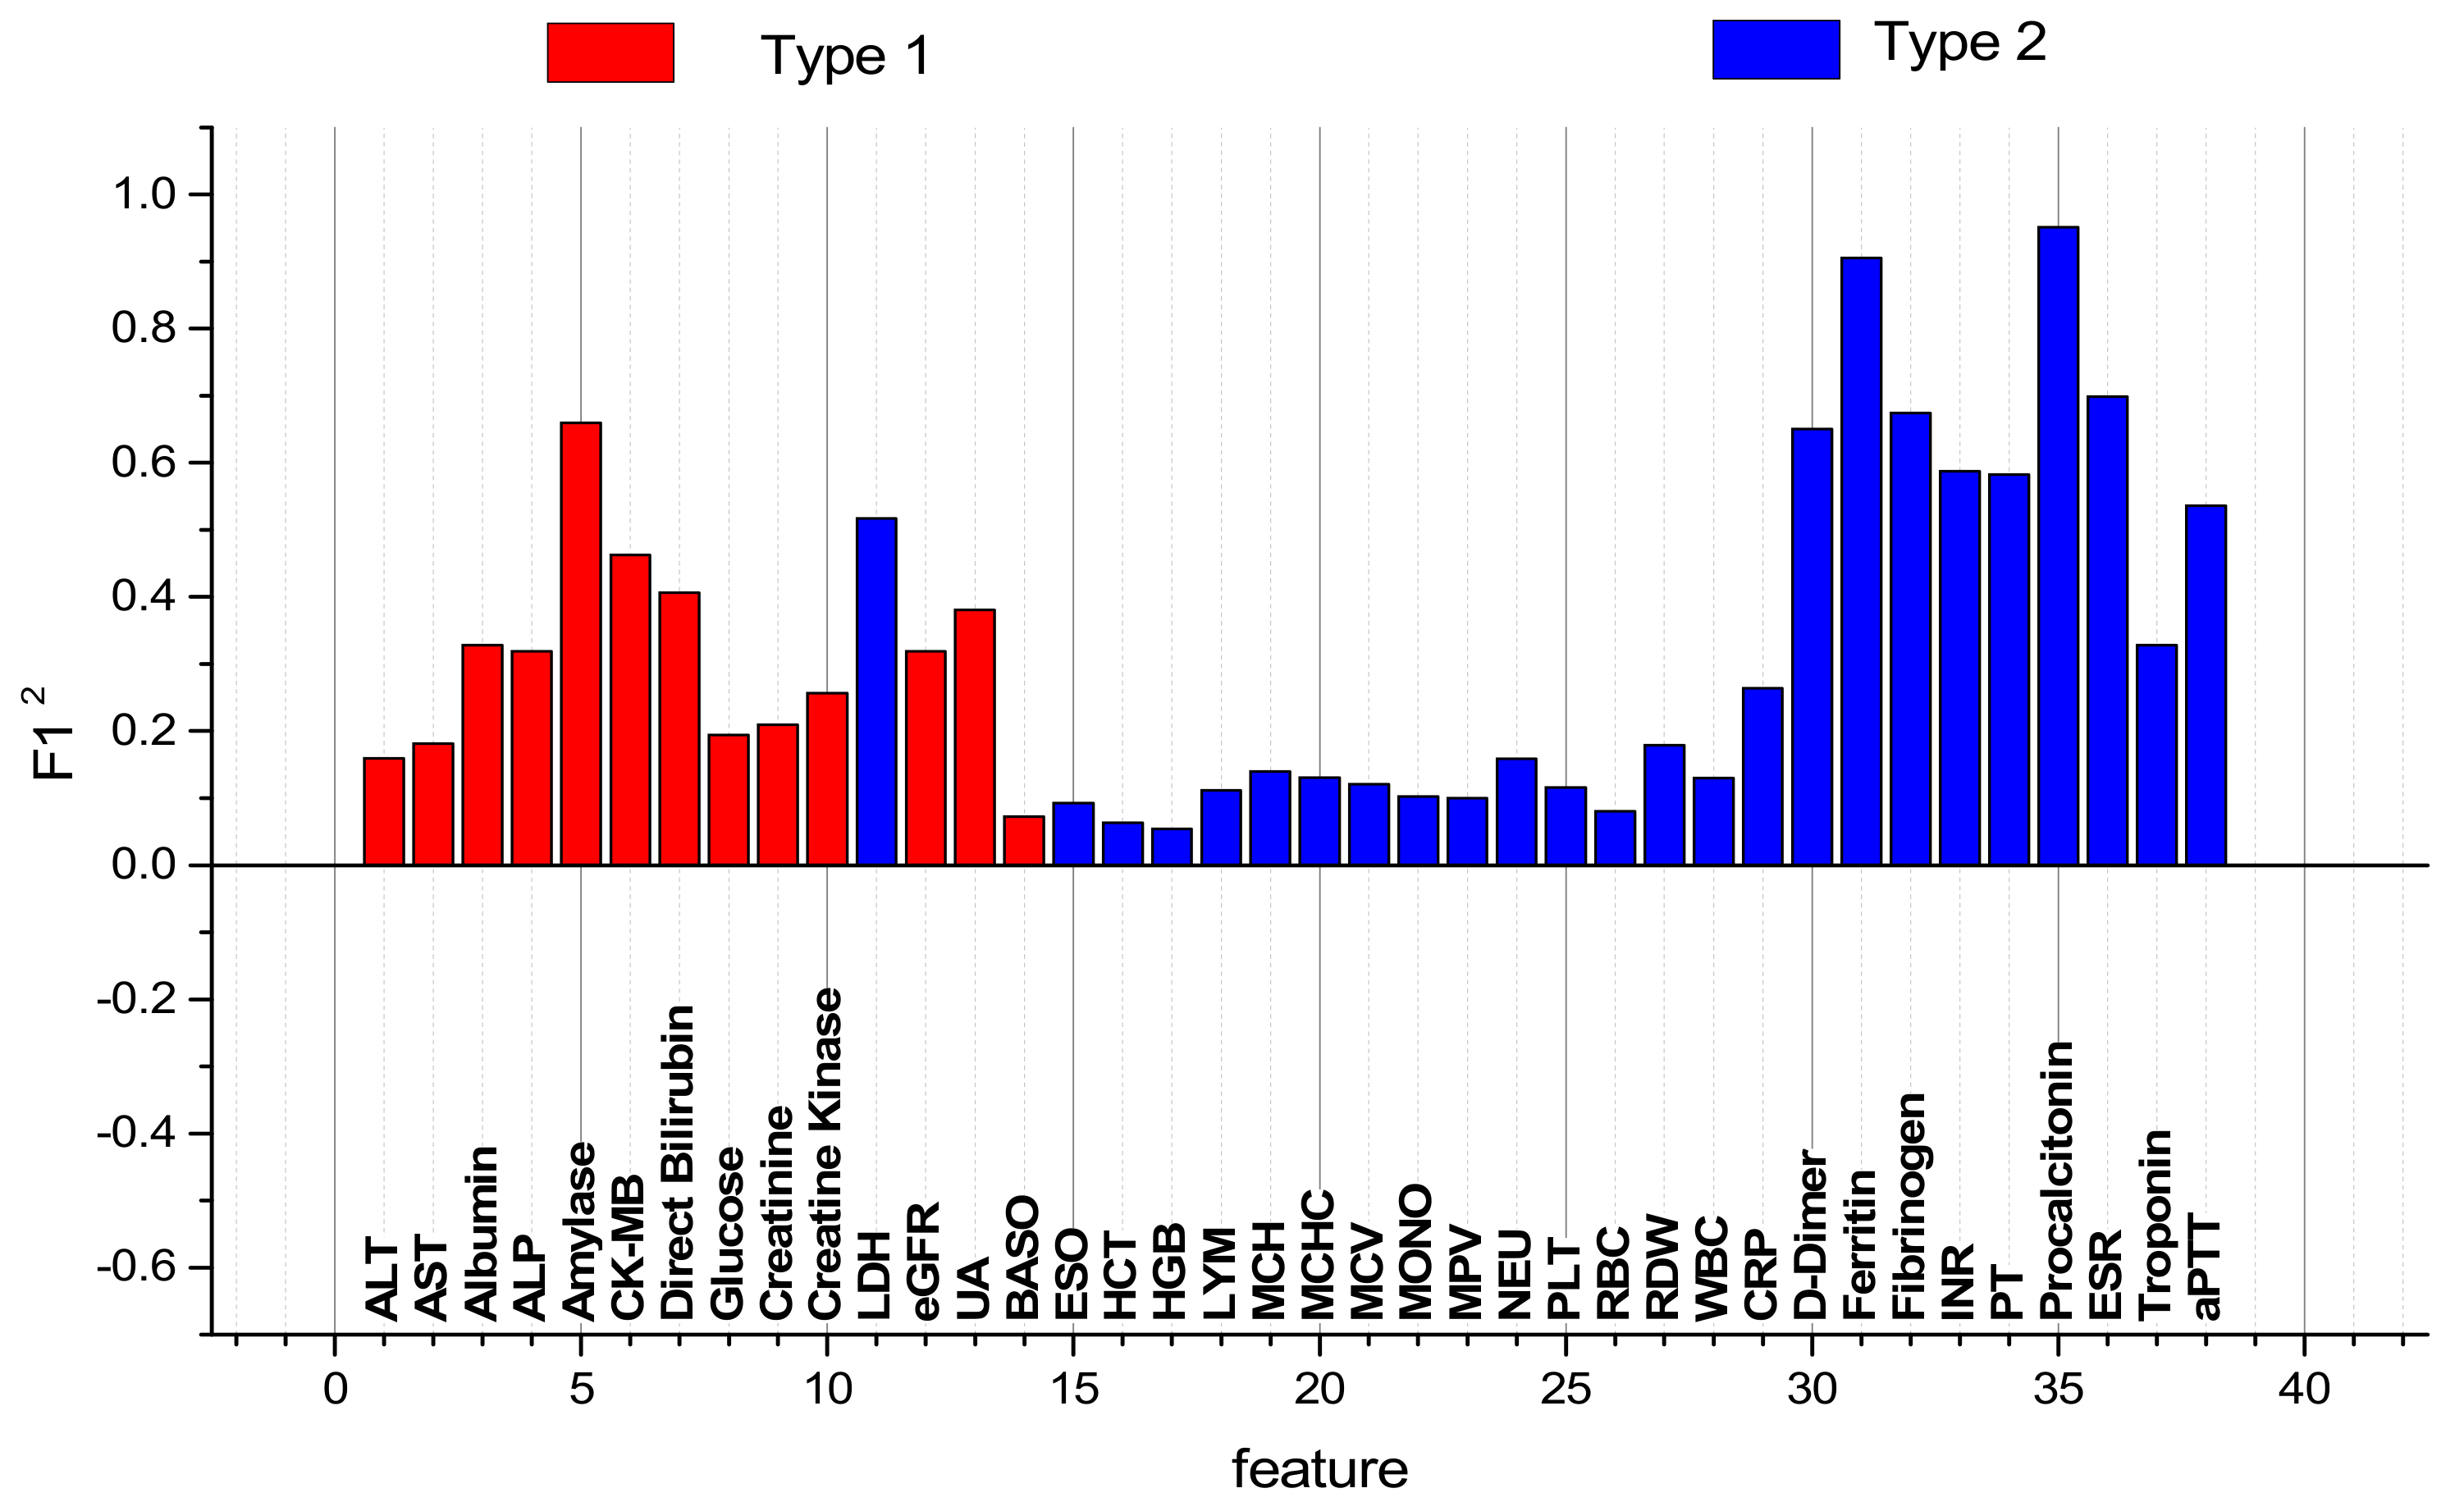
| Precision | Recall | F1 | F12 | |||||||||
|---|---|---|---|---|---|---|---|---|---|---|---|---|
| № | Feature (Units) | Type | Vth_1 | Vth_2 | Ath | Surv. | Non-Surv. | Surv. | Non-Surv. | Surv. | Non-Surv. | |
| 1 | ALT (U/L) | 1 | 34.84 | 35.36 | 0.518 | 0.483 | 0.876 | 0.975 | 0.143 | 0.646 | 0.246 | 0.15892 |
| 2 | AST (U/L) | 1 | 32.949 | 33.472 | 0.536 | 0.492 | 0.979 | 0.996 | 0.16 | 0.659 | 0.275 | 0.18123 |
| 3 | Albumin (g/L) | 1 | 36.81 | 49.08 | 0.808 | 0.826 | 0.627 | 0.957 | 0.262 | 0.887 | 0.37 | 0.32819 |
| 4 | ALP (U/L) | 1 | 83.582 | 85.305 | 0.725 | 0.701 | 0.97 | 0.996 | 0.242 | 0.823 | 0.388 | 0.31932 |
| 5 | Amylase (U/L) | 1 | 72.92 | 76.79 | 0.922 | 0.917 | 0.974 | 0.997 | 0.535 | 0.955 | 0.691 | 0.6599 |
| 6 | CK-MB (U/L) | 1 | 18.4 | 18.86 | 0.832 | 0.816 | 0.996 | 0.999 | 0.347 | 0.898 | 0.515 | 0.46247 |
| 7 | D-Bil. (mg/dL) | 1 | 0.04995 | 0.12985 | 0.836 | 0.845 | 0.747 | 0.971 | 0.322 | 0.904 | 0.45 | 0.4068 |
| 8 | Glucose (mg/dL) | 1 | 135.631 | 136.854 | 0.557 | 0.514 | 0.991 | 0.998 | 0.167 | 0.679 | 0.286 | 0.19419 |
| 9 | Creatinine (mg/dL) | 1 | 0.96492 | 1.16656 | 0.617 | 0.595 | 0.845 | 0.975 | 0.171 | 0.739 | 0.284 | 0.20988 |
| 10 | CK (U/L) | 1 | 92.88 | 116.1 | 0.663 | 0.636 | 0.931 | 0.989 | 0.201 | 0.774 | 0.331 | 0.25619 |
| 11 | LDH (U/L) | 2 | 253.26 | 597.64 | 0.876 | 0.877 | 0.867 | 0.985 | 0.411 | 0.928 | 0.557 | 0.5169 |
| 12 | eGFR | 1 | 82.5742 | 146.2250 | 0.77 | 0.772 | 0.755 | 0.97 | 0.246 | 0.859 | 0.371 | 0.31869 |
| 13 | UA (mg/dL) | 1 | 0 | 39.01 | 0.818 | 0.824 | 0.755 | 0.972 | 0.298 | 0.892 | 0.427 | 0.38088 |
| 14 | BASO (103/μL) | 1 | 0.00988 | 0.01026 | 0.322 | 0.277 | 0.777 | 0.926 | 0.096 | 0.426 | 0.17 | 0.07242 |
| 15 | EOS (103/μL) | 2 | 0.01323 | 0.11907 | 0.574 | 0.596 | 0.352 | 0.903 | 0.079 | 0.718 | 0.129 | 0.09262 |
| 16 | HCT (%) | 2 | 30.1257 | 44.0946 | 0.293 | 0.246 | 0.768 | 0.915 | 0.091 | 0.388 | 0.163 | 0.06324 |
| 17 | HGB (g/L) | 2 | 9.5128 | 15.3972 | 0.252 | 0.193 | 0.85 | 0.929 | 0.094 | 0.319 | 0.169 | 0.05391 |
| 18 | LYM (103/μL) | 2 | 0.59356 | 1.72672 | 0.481 | 0.466 | 0.635 | 0.928 | 0.105 | 0.62 | 0.18 | 0.1116 |
| 19 | MCH (pg) | 2 | 29.6058 | 35.6706 | 0.722 | 0.762 | 0.313 | 0.918 | 0.115 | 0.833 | 0.168 | 0.13994 |
| 20 | MCHC (g/dL) | 2 | 28.431 | 33.696 | 0.562 | 0.563 | 0.558 | 0.928 | 0.112 | 0.701 | 0.186 | 0.13039 |
| 21 | MCV (fL) | 2 | 83.7456 | 113.0624 | 0.503 | 0.489 | 0.639 | 0.932 | 0.11 | 0.642 | 0.188 | 0.1207 |
| 22 | MONO (103/μL) | 2 | 0.45078 | 6.70023 | 0.423 | 0.393 | 0.73 | 0.936 | 0.106 | 0.554 | 0.185 | 0.10249 |
| 23 | MPV (fL) | 2 | 9.9018 | 11.0988 | 0.539 | 0.549 | 0.438 | 0.908 | 0.087 | 0.685 | 0.146 | 0.10001 |
| 24 | NEU (103/μL) | 2 | 4.379 | 24.853 | 0.573 | 0.561 | 0.691 | 0.948 | 0.134 | 0.705 | 0.225 | 0.15862 |
| 25 | PLT (103/μL) | 2 | 108.025 | 245.85 | 0.474 | 0.453 | 0.687 | 0.936 | 0.11 | 0.611 | 0.19 | 0.11609 |
| 26 | RBC (106/μL) | 2 | 0.00722 | 5.06844 | 0.34 | 0.295 | 0.803 | 0.938 | 0.101 | 0.449 | 0.179 | 0.08037 |
| 27 | RDW (%) | 2 | 13.2096 | 21.1712 | 0.603 | 0.592 | 0.717 | 0.955 | 0.148 | 0.731 | 0.245 | 0.1791 |
| 28 | WBC (103/μL) | 2 | 6.2006 | 44.054 | 0.493 | 0.469 | 0.738 | 0.948 | 0.12 | 0.627 | 0.207 | 0.12979 |
| 29 | CRP (mg/L) | 2 | 19.488 | 252.938 | 0.722 | 0.721 | 0.73 | 0.964 | 0.205 | 0.825 | 0.32 | 0.264 |
| 30 | D-dimer (μg/L) | 2 | 1009.99 | 10742.70 | 0.923 | 0.925 | 0.906 | 0.99 | 0.544 | 0.956 | 0.68 | 0.65008 |
| 31 | Ferritin (μg/L) | 2 | 376.2 | 396 | 0.984 | 0.989 | 0.931 | 0.993 | 0.897 | 0.991 | 0.914 | 0.90577 |
| 32 | Fibrinogen (mg/dL) | 2 | 349.986 | 379.054 | 0.927 | 0.923 | 0.97 | 0.997 | 0.553 | 0.958 | 0.704 | 0.67443 |
| 33 | INR | 2 | 1.15151 | 10.4753 | 0.91 | 0.92 | 0.811 | 0.98 | 0.5 | 0.949 | 0.619 | 0.58743 |
| 34 | PT (Sec) | 2 | 13.5051 | 110.0950 | 0.902 | 0.904 | 0.88 | 0.987 | 0.475 | 0.944 | 0.617 | 0.58245 |
| 35 | PCT (ng/mL) | 2 | 0.2 | 5.2 | 0.992 | 1 | 0.918 | 0.992 | 0.995 | 0.996 | 0.955 | 0.95118 |
| 36 | ESR (nm/hr) | 2 | 36.125 | 56.625 | 0.939 | 0.944 | 0.888 | 0.988 | 0.609 | 0.966 | 0.723 | 0.69842 |
| 37 | Troponin (ng/L) | 2 | 13.2 | 3269.2 | 0.906 | 0.969 | 0.275 | 0.931 | 0.464 | 0.95 | 0.345 | 0.32775 |
| 38 | aPTT (Sec) | 2 | 22.1582 | 32.4594 | 0.878 | 0.873 | 0.927 | 0.992 | 0.419 | 0.929 | 0.577 | 0.53603 |
References
- Huyut, M.T.; Soygüder, S. The Multi-Relationship Structure between Some Symptoms and Features Seen during the New Coronavirus 19 Infection and the Levels of Anxiety and Depression Post-Covid. East J. Med. 2022, 27, 1–10. [Google Scholar] [CrossRef]
- Huyut, M.T.; Kocaturk, İ. The Effect of Some Symptoms and Features During the Infection Period on the Level of Anxiety and Depression of Adults After Recovery From COVID-19. Curr. Psychiatry Res. Rev. 2022, 18, 151–163. [Google Scholar] [CrossRef]
- Huyut, M.T. Automatic Detection of Severely and Mildly Infected COVID-19 Patients with Supervised Machine Learning Models. IRBM 2022, 1, 1–12. [Google Scholar] [CrossRef] [PubMed]
- Huyut, M.T.; İlkbahar, F. The Effectiveness of Blood Routine Parameters and Some Biomarkers as a Potential Diagnostic Tool in the Diagnosis and Prognosis of Covid-19 Disease. Int. Immunopharmacol. 2021, 98, 107838. [Google Scholar] [CrossRef]
- Feigin, E.; Levinson, T.; Wasserman, A.; Shenhar-Tsarfaty, S.; Berliner, S.; Ziv-Baran, T. Age-Dependent Biomarkers for Prediction of In-Hospital Mortality in COVID-19 Patients. J. Clin. Med. 2022, 11, 2682. [Google Scholar] [CrossRef] [PubMed]
- Ciotti, M.; Angeletti, S.; Minieri, M.; Giovannetti, M.; Benvenuto, D.; Pascarella, S.; Sagnelli, C.; Bianchi, M.; Bernardini, S.; Ciccozzi, M. COVID-19 Outbreak: An Overview. Chemotherapy 2020, 64, 215–223. [Google Scholar] [CrossRef]
- Richardson, S.; Hirsch, J.S.; Narasimhan, M.; Crawford, J.M.; McGinn, T.; Davidson, K.W.; Barnaby, D.P.; Becker, L.B.; Chelico, J.D.; Cohen, S.L.; et al. Presenting Characteristics, Comorbidities, and Outcomes among 5700 Patients Hospitalized with COVID-19 in the New York City Area. JAMA J. Am. Med. Assoc. 2020, 323, 2052–2059. [Google Scholar] [CrossRef]
- Asch, D.A.; Sheils, N.E.; Islam, M.N.; Chen, Y.; Werner, R.M.; Buresh, J.; Doshi, J.A. Variation in US Hospital Mortality Rates for Patients Admitted with COVID-19 during the First 6 Months of the Pandemic. JAMA Intern. Med. 2021, 181, 471–478. [Google Scholar] [CrossRef]
- Strålin, K.; Wahlström, E.; Walther, S.; Bennet-Bark, A.M.; Heurgren, M.; Lindén, T.; Holm, J.; Hanberger, H. Mortality Trends among Hospitalised COVID-19 Patients in Sweden: A Nationwide Observational Cohort Study. Lancet Reg. Health Eur. 2021, 4, 100054. [Google Scholar] [CrossRef]
- Strålin, K.; Wahlström, E.; Walther, S.; Bennet-Bark, A.M.; Heurgren, M.; Lindén, T.; Holm, J.; Hanberger, H. Mortality in Hospitalized COVID-19 Patients Was Associated with the COVID-19 Admission Rate during the First Year of the Pandemic in Sweden. Infect. Dis. 2022, 54, 145–151. [Google Scholar] [CrossRef]
- Zheng, Y.; Zhang, Y.; Chi, H.; Chen, S.; Peng, M.; Luo, L.; Chen, L.; Li, J.; Shen, B.; Wang, D. The Hemocyte Counts as a Potential Biomarker for Predicting Disease Progression in COVID-19: A Retrospective Study. Clin. Chem. Lab. Med. 2020, 58, 1106–1115. [Google Scholar] [CrossRef]
- Huyut, M.T.; Huyut, Z.; İlkbahar, F.; Mertoğlu, C. What Is the Impact and Efficacy of Routine Immunological, Biochemical and Hematological Biomarkers as Predictors of COVID-19 Mortality? Int. Immunopharmacol. 2022, 105, 108542. [Google Scholar] [CrossRef]
- Huyut, M.; Üstündaǧ, H. Prediction of Diagnosis and Prognosis of COVID-19 Disease by Blood Gas Parameters Using Decision Trees Machine Learning Model: A Retrospective Observational Study. Med. Gas Res. 2022, 12, 60–66. [Google Scholar] [CrossRef]
- Chen, N.; Zhou, M.; Dong, X.; Qu, J.; Gong, F.; Han, Y.; Qiu, Y.; Wang, J.; Liu, Y.; Wei, Y.; et al. Epidemiological and Clinical Characteristics of 99 Cases of 2019 Novel Coronavirus Pneumonia in Wuhan, China: A Descriptive Study. Lancet 2020, 395, 507–513. [Google Scholar] [CrossRef] [Green Version]
- Huyut, M.T.; Huyut, Z. Forecasting of Oxidant/Antioxidant Levels of COVID-19 Patients by Using Expert Models with Biomarkers Used in the Diagnosis/Prognosis of COVID-19. Int. Immunopharmacol. 2021, 100, 108127. [Google Scholar] [CrossRef]
- Tural Onur, S.; Altın, S.; Sokucu, S.N.; Fikri, B.İ.; Barça, T.; Bolat, E.; Toptaş, M. Could Ferritin Level Be an Indicator of COVID-19 Disease Mortality? J. Med. Virol. 2021, 93, 1672–1677. [Google Scholar] [CrossRef]
- Gómez-Pastora, J.; Weigand, M.; Kim, J.; Wu, X.; Strayer, J.; Palmer, A.F.; Zborowski, M.; Yazer, M.; Chalmers, J.J. Hyperferritinemia in Critically Ill COVID-19 Patients–Is Ferritin the Product of Inflammation or a Pathogenic Mediator? Clin. Chim. Acta 2020, 509, 249–251. [Google Scholar] [CrossRef]
- Perricone, C.; Bartoloni, E.; Bursi, R.; Cafaro, G.; Guidelli, G.M.; Shoenfeld, Y.; Gerli, R. COVID-19 as Part of the Hyperferritinemic Syndromes: The Role of Iron Depletion Therapy. Immunol. Res. 2020, 68, 213–224. [Google Scholar] [CrossRef]
- Luo, X.; Zhou, W.; Yan, X.; Guo, T.; Wang, B.; Xia, H.; Ye, L.; Xiong, J.; Jiang, Z.; Liu, Y.; et al. Prognostic Value of C-Reactive Protein in Patients with Coronavirus 2019. Clin. Infect. Dis. 2020, 71, 2174–2179. [Google Scholar] [CrossRef]
- Cecconi, M.; Piovani, D.; Brunetta, E.; Aghemo, A.; Greco, M.; Ciccarelli, M.; Angelini, C.; Voza, A.; Omodei, P.; Vespa, E.; et al. Early Predictors of Clinical Deterioration in a Cohort of 239 Patients Hospitalized for Covid-19 Infection in Lombardy, Italy. J. Clin. Med. 2020, 9, 1548. [Google Scholar] [CrossRef]
- Mertoglu, C.; Huyut, M.T.; Arslan, Y.; Ceylan, Y.; Coban, T.A. How Do Routine Laboratory Tests Change in Coronavirus Disease 2019? Scand. J. Clin. Lab. Investig. 2021, 81, 24–33. [Google Scholar] [CrossRef] [PubMed]
- Huyut, M.T.; Velichko, A. Diagnosis and Prognosis of COVID-19 Disease Using Routine Blood Values and LogNNet Neural Network. Sensors 2022, 22, 4820. [Google Scholar] [CrossRef] [PubMed]
- Mertoglu, C.; Huyut, M.T.; Olmez, H.; Tosun, M.; Kantarci, M.; Coban, T. COVID-19 Is More Dangerous for Older People and Its Severity Is Increasing: A Case-Control Study. Med. Gas Res. 2022, 12, 51–54. [Google Scholar] [CrossRef] [PubMed]
- Zhang, J.J.; Cao, Y.Y.; Tan, G.; Dong, X.; Wang, B.C.; Lin, J.; Yan, Y.Q.; Liu, G.H.; Akdis, M.; Akdis, C.A.; et al. Clinical, Radiological, and Laboratory Characteristics and Risk Factors for Severity and Mortality of 289 Hospitalized COVID-19 Patients. Allergy Eur. J. Allergy Clin. Immunol. 2021, 76, 533–550. [Google Scholar] [CrossRef] [PubMed]
- Ponti, G.; Maccaferri, M.; Ruini, C.; Tomasi, A.; Ozben, T. Biomarkers Associated with COVID-19 Disease Progression. Crit. Rev. Clin. Lab. Sci. 2020, 57, 389–399. [Google Scholar] [CrossRef]
- Feld, J.; Tremblay, D.; Thibaud, S.; Kessler, A.; Naymagon, L. Ferritin Levels in Patients with COVID-19: A Poor Predictor of Mortality and Hemophagocytic Lymphohistiocytosis. Int. J. Lab. Hematol. 2020, 42, 773–779. [Google Scholar] [CrossRef]
- Hou, H.; Zhang, B.; Huang, H.; Luo, Y.; Wu, S.; Tang, G.; Liu, W.; Mao, L.; Mao, L.; Wang, F.; et al. Using IL-2R/Lymphocytes for Predicting the Clinical Progression of Patients with COVID-19. Clin. Exp. Immunol. 2020, 201, 76–84. [Google Scholar] [CrossRef]
- Kaushal, K.; Kaur, H.; Sarma, P.; Bhattacharyya, A.; Sharma, D.J.; Prajapat, M.; Pathak, M.; Kothari, A.; Kumar, S.; Rana, S.; et al. Serum Ferritin as a Predictive Biomarker in COVID-19. A Systematic Review, Meta-Analysis and Meta-Regression Analysis. J. Crit. Care 2022, 67, 172–181. [Google Scholar] [CrossRef]
- Cheng, L.; Li, H.; Li, L.; Liu, C.; Yan, S.; Chen, H.; Li, Y. Ferritin in the Coronavirus Disease 2019 (COVID-19): A Systematic Review and Meta-Analysis. J. Clin. Lab. Anal. 2020, 34, 1–18. [Google Scholar] [CrossRef]
- Kukar, M.; Gunčar, G.; Vovko, T.; Podnar, S.; Černelč, P.; Brvar, M.; Zalaznik, M.; Notar, M.; Moškon, S.; Notar, M. COVID-19 Diagnosis by Routine Blood Tests Using Machine Learning. Sci. Rep. 2021, 11, 10738. [Google Scholar] [CrossRef]
- Podnar, S.; Kukar, M.; Gunčar, G.; Notar, M.; Gošnjak, N.; Notar, M. Diagnosing Brain Tumours by Routine Blood Tests Using Machine Learning. Sci. Rep. 2019, 9, 1–7. [Google Scholar] [CrossRef] [Green Version]
- Velichko, A.; Huyut, M.T.; Belyaev, M.; Izotov, Y.; Korzun, D. Machine Learning Sensors for Diagnosis of COVID-19 Disease Using Routine Blood Values for Internet of Things Application. Sensors 2022, 22, 7886. [Google Scholar] [CrossRef]
- Booth, A.L.; Abels, E.; McCaffrey, P. Development of a Prognostic Model for Mortality in COVID-19 Infection Using Machine Learning. Mod. Pathol. 2021, 34, 522–531. [Google Scholar] [CrossRef]
- Luo, Y.; Szolovits, P.; Dighe, A.S.; Baron, J.M. Using Machine Learning to Predict Laboratory Test Results. Am. J. Clin. Pathol. 2016, 145, 778–788. [Google Scholar] [CrossRef] [Green Version]
- Doğanay, F.; Elkonca, F.; Seyhan, A.U.; Yılmaz, E.; Batırel, A.; Ak, R. Shock Index as a Predictor of Mortality among the Covid-19 Patients. Am. J. Emerg. Med. 2021, 40, 106–109. [Google Scholar] [CrossRef]
- Zhang, S.; Huang, S.; Liu, J.; Dong, X.; Meng, M.; Chen, L.; Wen, Z.; Zhang, L.; Chen, Y.; Du, H.; et al. Identification and Validation of Prognostic Factors in Patients with COVID-19: A Retrospective Study Based on Artificial Intelligence Algorithms. J. Intensive Med. 2021, 1, 103–109. [Google Scholar] [CrossRef]
- Formica, V.; Minieri, M.; Bernardini, S.; Ciotti, M.; D’Agostini, C.; Roselli, M.; Andreoni, M.; Morelli, C.; Parisi, G.; Federici, M.; et al. Complete Blood Count Might Help to Identify Subjects with High Probability of Testing Positive to SARS-CoV-2. Clin. Med. J. R. Coll. Physicians Lond. 2020, 20, 114–119. [Google Scholar] [CrossRef]
- Banerjee, A.; Ray, S.; Vorselaars, B.; Kitson, J.; Mamalakis, M.; Weeks, S.; Baker, M.; Mackenzie, L.S. Use of Machine Learning and Artificial Intelligence to Predict SARS-CoV-2 Infection from Full Blood Counts in a Population. Int. Immunopharmacol. 2020, 86, 6705. [Google Scholar] [CrossRef]
- Avila, E.; Kahmann, A.; Alho, C.; Dorn, M. Hemogram Data as a Tool for Decision-Making in COVID-19 Management: Applications to Resource Scarcity Scenarios. PeerJ 2020, 2020, 9482. [Google Scholar] [CrossRef]
- Joshi, R.P.; Pejaver, V.; Hammarlund, N.E.; Sung, H.; Lee, S.K.; Furmanchuk, A.; Lee, H.-Y.; Scott, G.; Gombar, S.; Shah, N.; et al. A Predictive Tool for Identification of SARS-CoV-2 PCR-Negative Emergency Department Patients Using Routine Test Results. J. Clin. Virol. 2020, 129, 104502. [Google Scholar] [CrossRef]
- Zhu, J.S.; Ge, P.; Jiang, C.; Zhang, Y.; Li, X.; Zhao, Z.; Zhang, L.; Duong, T.Q. Deep-learning Artificial Intelligence Analysis of Clinical Variables Predicts Mortality in COVID-19 Patients. J. Am. Coll. Emerg. Physicians Open 2020, 1, 1364–1373. [Google Scholar] [CrossRef] [PubMed]
- Soltan, A.A.; Kouchaki, S.; Zhu, T.; Kiyasseh, D.; Taylor, T.; Hussain, Z.B.; Peto, T.; Brent, A.J.; Eyre, D.W.; Clifton, D. Artificial Intelligence Driven Assessment of Routinely Collected Healthcare Data Is an Effective Screening Test for COVID-19 in Patients Presenting to Hospital. medRxiv 2020, medRxiv:20148361. [Google Scholar]
- Soares, F. A Novel Specific Artificial Intelligence-Based Method to Identify COVID-19 Cases Using Simple Blood Exams. medRxiv 2020, medRxiv:20061036. [Google Scholar]
- Shapiro, S.S.; Wilk, M.B. An Analysis of Variance Test for Normality (Complete Samples). Biometrika 1965, 52, 591. [Google Scholar] [CrossRef]
- Mann, H.B.; Whitney, D.R. On a Test of Whether One of Two Random Variables Is Stochastically Larger than the Other. Ann. Math. Stat. 1947, 18, 50–60. [Google Scholar] [CrossRef]
- Lippi, G.; Plebani, M.; Henry, B.M. Thrombocytopenia Is Associated with Severe Coronavirus Disease 2019 (COVID-19) Infections: A Meta-Analysis. Clin. Chim. Acta 2020, 506, 145–148. [Google Scholar] [CrossRef]
- Vafadar Moradi, E.; Teimouri, A.; Rezaee, R.; Morovatdar, N.; Foroughian, M.; Layegh, P.; Rezvani Kakhki, B.; Ahmadi Koupaei, S.R.; Ghorani, V. Increased Age, Neutrophil-to-Lymphocyte Ratio (NLR) and White Blood Cells Count Are Associated with Higher COVID-19 Mortality. Am. J. Emerg. Med. 2021, 40, 11–14. [Google Scholar] [CrossRef]
- Guzik, T.J.; Mohiddin, S.A.; Dimarco, A.; Patel, V.; Savvatis, K.; Marelli-Berg, F.M.; Madhur, M.S.; Tomaszewski, M.; Maffia, P.; D’Acquisto, F.; et al. COVID-19 and the Cardiovascular System: Implications for Risk Assessment, Diagnosis, and Treatment Options. Cardiovasc. Res. 2020, 116, 1666–1687. [Google Scholar] [CrossRef]
- Song, H.; Kim, H.J.; Park, K.N.; Kim, S.H.; Oh, S.H.; Youn, C.S. Neutrophil to Lymphocyte Ratio Is Associated with In-Hospital Mortality in Older Adults Admitted to the Emergency Department. Am. J. Emerg. Med. 2021, 40, 133–137. [Google Scholar] [CrossRef]
- Mo, P.; Xing, Y.; Xiao, Y.; Deng, L.; Zhao, Q.; Wang, H.; Xiong, Y.; Cheng, Z.; Gao, S.; Liang, K.; et al. Clinical Characteristics of Refractory Coronavirus Disease 2019 in Wuhan, China. Clin. Infect. Dis. 2021, 73, E4208–E4213. [Google Scholar] [CrossRef] [Green Version]
- Tan, L.; Wang, Q.; Zhang, D.; Ding, J.; Huang, Q.; Tang, Y.Q.; Wang, Q.; Miao, H. Lymphopenia Predicts Disease Severity of COVID-19: A Descriptive and Predictive Study. Signal Transduct. Target. Ther. 2020, 5, 16–18. [Google Scholar] [CrossRef]
- Wu, C.; Chen, X.; Cai, Y.; Xia, J.; Zhou, X.; Xu, S.; Huang, H.; Zhang, L.; Zhou, X.; Du, C.; et al. Risk Factors Associated with Acute Respiratory Distress Syndrome and Death in Patients with Coronavirus Disease 2019 Pneumonia in Wuhan, China. JAMA Intern. Med. 2020, 180, 934–943. [Google Scholar] [CrossRef]
- Zhu, N.; Zhang, D.; Wang, W.; Li, X.; Yang, B.; Song, J.; Zhao, X.; Huang, B.; Shi, W.; Lu, R.; et al. A Novel Coronavirus from Patients with Pneumonia in China, 2019. N. Engl. J. Med. 2020, 382, 727–733. [Google Scholar] [CrossRef]
- Pribadi, R.R.; Simadibrata, M. Increased Serum Amylase and/or Lipase in Coronavirus Disease 2019 (COVID-19) Patients: Is It Really Pancreatic Injury? JGH Open 2021, 5, 190–192. [Google Scholar] [CrossRef]
- Ahmed, S.; Jafri, L.; Hoodbhoy, Z.; Siddiqui, I. Prognostic Value of Serum Procalcitonin in Covid-19 Patients: A Systematic Review. Indian J. Crit. Care Med. 2021, 25, 77–84. [Google Scholar] [CrossRef]
- Li, X.; Wang, L.; Yan, S.; Yang, F.; Xiang, L.; Zhu, J.; Shen, B.; Gong, Z. Clinical Characteristics of 25 Death Cases with COVID-19: A Retrospective Review of Medical Records in a Single Medical Center, Wuhan, China. Int. J. Infect. Dis. 2020, 94, 128–132. [Google Scholar] [CrossRef]
- Ke, C.; Wang, Y.; Zeng, X.; Yang, C.; Hu, Z. 2019 Novel Coronavirus Disease (COVID-19) in Hemodialysis Patients: A Report of Two Cases. Clin. Biochem. 2020, 81, 9–12. [Google Scholar] [CrossRef]
- Lippi, G.; Plebani, M. Procalcitonin in Patients with Severe Coronavirus Disease 2019 (COVID-19): A Meta-Analysis. Clin. Chim. Acta 2020, 505, 190–191. [Google Scholar] [CrossRef]
- Lin, L.; Lu, L.; Cao, W.; Li, T. Hypothesis for Potential Pathogenesis of SARS-CoV-2 Infection–a Review of Immune Changes in Patients with Viral Pneumonia. Emerg. Microbes Infect. 2020, 9, 727–732. [Google Scholar] [CrossRef] [Green Version]
- De Sousa Lima, M.E.; Barros, L.C.M.; Aragão, G.F. Could Autism Spectrum Disorders Be a Risk Factor for COVID-19? Med. Hypotheses 2020, 144, 109899. [Google Scholar] [CrossRef]
- Juneja, D.; Savio, R.D.; Srinivasan, S.; Pandit, R.A.; Ramasubban, S.; Reddy, P.K.; Singh, M.; Gopal, P.B.N.; Chaudhry, D.; Govil, D.; et al. Basic Critical Care for Management of COVID-19 Patients: Position Paper of Indian Society of Critical Care Medicine, Part-I. Indian J. Crit. Care Med. 2020, 24, S244–S253. [Google Scholar] [CrossRef] [PubMed]
- Henry, B.M.; De Oliveira, M.H.S.; Benoit, S.; Plebani, M.; Lippi, G. Hematologic, Biochemical and Immune Biomarker Abnormalities Associated with Severe Illness and Mortality in Coronavirus Disease 2019 (COVID-19): A Meta-Analysis. Clin. Chem. Lab. Med. 2020, 58, 1021–1028. [Google Scholar] [CrossRef] [PubMed]
- Torti, F.M.; Torti, S.V. Regulation of Ferritin Genes and Protein. Blood 2002, 99, 3505–3516. [Google Scholar] [CrossRef] [PubMed] [Green Version]
- Rosário, C.; Zandman-Goddard, G.; Meyron-Holtz, E.G.; D’Cruz, D.P.; Shoenfeld, Y. The Hyperferritinemic Syndrome: Macrophage Activation Syndrome, Still’s Disease, Septic Shock and Catastrophic Antiphospholipid Syndrome. BMC Med. 2013, 11, 185. [Google Scholar] [CrossRef] [PubMed] [Green Version]
- Kernan, K.F.; Carcillo, J.A. Hyperferritinemia and Inflammation. Int. Immunol. 2017, 29, 401–409. [Google Scholar] [CrossRef] [PubMed] [Green Version]
- Winata, S.; Kurniawan, A. Coagulopathy in COVID-19: A Systematic Review. Medicinus 2021, 8, 72. [Google Scholar] [CrossRef]


| № | Feature | № | Feature | № | Feature | № | Feature |
|---|---|---|---|---|---|---|---|
| 1 | ALT | 11 | LDH | 21 | MCV | 31 | Ferritin |
| 2 | AST | 12 | eGFR | 22 | MONO | 32 | Fibrinogen |
| 3 | Albumin | 13 | UA | 23 | MPV | 33 | INR |
| 4 | ALP | 14 | BASO | 24 | NEU | 34 | PT |
| 5 | Amylase | 15 | EOS | 25 | PLT | 35 | PCT |
| 6 | CK-MB | 16 | HCT | 26 | RBC | 36 | ESR |
| 7 | D-Bil | 17 | HGB | 27 | RDW | 37 | Troponin |
| 8 | Glucose | 18 | LYM | 28 | WBC | 38 | aPTT |
| 9 | Creatinine | 19 | MCH | 29 | CRP | ||
| 10 | CK | 20 | MCHC | 30 | D-dimer |
| № | № | Spearman Survived COVID-19 | Spearman Non-Survived COVID-19 | Change in the Correlation of Features, in Present of Non-Survived COVID-19 | Feature | Feature |
|---|---|---|---|---|---|---|
| 8 | 3 | −0.31194 | 0.01274 | Down | Glucose | Albumin |
| 13 | 3 | −0.3753 | −0.10287 | Down | UA | Albumin |
| 36 | 29 | 0.42911 | 0.16647 | Down | ESR | CRP |
| 10 | 5 | 0.05417 | 0.30605 | Up | CK | Amylase |
| 12 | 9 | −0.53482 | −0.77476 | Up | eGFR | Creatinine |
| 5 | 3 | −0.03084 | 0.26142 | Up | Amylase | Albumin |
| 12 | 3 | 0.3479 | 0.11987 | Down | eGFR | Albumin |
| 30 | 29 | 0.3365 | 0.1146 | Down | D-dimer | CRP |
| 6 | 5 | 0.05413 | 0.26867 | Up | CK-MB | Amylase |
| 32 | 30 | 0.21431 | −1.48572 × 10⁻⁴ | Down | Fibrinogen | D-dimer |
| 10 | 6 | 0.18243 | 0.39221 | Up | CK | CK-MB |
| 36 | 30 | 0.25085 | −0.04489 | Down | ESR | D-dimer |
| 24 | 5 | 0.00641 | −0.21234 | Up | NEU | Amylase |
| 14 | 6 | −0.00966 | −0.20355 | Up | BASO | CK-MB |
| 4 | 3 | −0.03222 | 0.22455 | Up | ALT | Albumin |
| 26 | 18 | 0.30758 | 0.1153 | Down | RBC | LYM |
| 9 | 1 | 0.24486 | 0.05265 | Down | Creatinine | ALT |
| 16 | 15 | 0.20104 | 0.01024 | Down | HCT | EOS |
| 9 | 2 | 0.30293 | 0.1127 | Down | Creatinine | AST |
| 17 | 14 | 0.24856 | 0.05841 | Down | HGB | BASO |
| 25 | 15 | 0.0849 | 0.27473 | Up | PLT | EOS |
| 25 | 20 | −0.08083 | −0.27021 | Up | PLT | MCHC |
| 7 | 3 | −0.0119 | 0.19865 | Up | D-Bil | Albumin |
| 20 | 15 | −0.04499 | −0.23071 | Up | MCHC | EOS |
| 31 | 29 | 0.3931 | 0.2085 | Down | Ferritin | CRP |
| 28 | 6 | 0.0179 | −0.20122 | Up | WBC | CK-MB |
| 27 | 21 | −0.30218 | −0.11908 | Down | RDW | MCV |
| 7 | 6 | 0.0635 | 0.24642 | Up | D-Bil | CK-MB |
| 36 | 32 | 0.27287 | −0.09309 | Down | ESR | Fibrinogen |
| 20 | 14 | 0.02204 | −0.1999 | Up | MCHC | BASO |
| 13 | 8 | 0.42328 | 0.24648 | Down | UA | Glucose |
| 15 | 4 | 0.01565 | 0.19167 | Up | EOS | ALT |
| 31 | 30 | 0.22095 | −0.04543 | Down | Ferritin | D-dimer |
| 6 | 1 | 0.06557 | 0.23993 | Up | CK-MB | ALT |
| 32 | 29 | 0.31919 | 0.14655 | Down | Fibrinogen | CRP |
| 23 | 2 | 0.00857 | 0.18043 | Up | MPV | AST |
| 3 | 2 | −0.20943 | −0.03802 | Down | Albumin | AST |
| 35 | 3 | −0.01609 | −0.18485 | Up | PCT | Albumin |
| 30 | 9 | −0.00743 | 0.17441 | Up | D-dimer | Creatinine |
| 23 | 13 | 0.00586 | 0.1727 | Up | MPV | UA |
| Surviving Group | Non-Surviving Group | ||||||
|---|---|---|---|---|---|---|---|
| Parameters (Units) | Median | Percentile 25 | Percentile 75 | Median | Percentile 25 | Percentile 75 | p |
| ALT (U/L) | 35.31 | 24.00 | 35.31 | 23.00 | 15.00 | 35.20 | <0.001 |
| AST (U/L) | 33.24 | 25.00 | 33.24 | 32.00 | 22.00 | 47.23 | 0.033 |
| Albumin (g/L) | 38.59 | 38.59 | 38.59 | 38.29 | 33.00 | 43.54 | 0.539 |
| ALP (U/L) | 84.10 | 84.10 | 84.10 | 103.23 | 72.00 | 103.23 | <0.001 |
| Amylase (U/L) | 73.70 | 73.70 | 73.70 | 101.00 | 58.00 | 107.62 | <0.001 |
| CK-MB (U/L) | 18.79 | 18.79 | 18.79 | 32.75 | 19.40 | 32.75 | <0.001 |
| D-Bil. (mg/dL) | 0.13 | 0.13 | 0.13 | 0.25 | 0.12 | 0.27 | <0.001 |
| Glucose (mg/dL) | 136.03 | 108.00 | 136.03 | 145.00 | 113.00 | 188.00 | <0.001 |
| Creatinine (mg/dL) | 1.14 | 0.90 | 1.14 | 1.11 | 0.86 | 1.64 | <0.001 |
| CK (U/L) | 104.26 | 83.00 | 104.26 | 220.00 | 79.00 | 350.53 | <0.001 |
| LDH (U/L) | 252.94 | 252.94 | 252.94 | 309.76 | 309.76 | 309.76 | <0.001 |
| eGFR | 82.74 | 82.74 | 85.10 | 62.16 | 44.47 | 82.50 | <0.001 |
| UA (mg/dL) | 38.80 | 32.00 | 38.80 | 56.74 | 39.13 | 75.95 | <0.001 |
| BASO (103/μL) | 0.02 | 0.01 | 0.04 | 0.021 | 0.014 | 0.044 | 0.869 |
| EOS (103/μL) | 0.04 | 0.01 | 0.12 | 0.03 | 0.00 | 0.12 | 0.232 |
| HCT (%) | 39.55 | 36.00 | 43.20 | 38.80 | 34.90 | 42.30 | 0.041 |
| HGB (g/L) | 13.30 | 12.00 | 14.65 | 13.10 | 11.50 | 14.50 | 0.016 |
| LYM (103/μL) | 1.46 | 0.99 | 2.03 | 1.32 | 0.85 | 1.88 | 0.015 |
| MCH (pg) | 28.60 | 27.30 | 29.60 | 28.80 | 27.20 | 30.10 | 0.041 |
| MCHC (g/dL) | 33.80 | 32.90 | 34.70 | 33.50 | 32.40 | 34.60 | 0.004 |
| MCV (fL) | 83.90 | 80.80 | 87.00 | 85.20 | 81.80 | 88.90 | <0.001 |
| MONO (103/μL) | 0.51 | 0.38 | 0.67 | 0.56 | 0.44 | 0.72 | <0.001 |
| MPV (fL) | 10.30 | 9.70 | 10.90 | 10.30 | 9.60 | 11.00 | 0.604 |
| NEU (103/μL) | 4.05 | 2.85 | 5.85 | 5.25 | 3.98 | 7.65 | <0.001 |
| PLT (103/μL) | 229.00 | 184.00 | 287.00 | 200.00 | 166.00 | 250.00 | <0.001 |
| RBC (106/μL) | 4.74 | 4.36 | 5.14 | 4.64 | 4.16 | 4.98 | 0.001 |
| RDW (%) | 13.10 | 12.50 | 13.90 | 14.00 | 13.20 | 15.40 | <0.001 |
| WBC (103/μL) | 6.50 | 5.00 | 8.30 | 7.80 | 6.20 | 10.10 | <0.001 |
| CRP (mg/L) | 6.76 | 3.02 | 23.50 | 72.00 | 17.10 | 72.00 | <0.001 |
| D-dimer (μg/L) | 441.00 | 441.00 | 441.00 | 1277.00 | 1277.00 | 1277.00 | <0.001 |
| Ferritin (μg/L) | 125.95 | 90.90 | 175.80 | 395.00 | 395.00 | 395.00 | <0.001 |
| Fibrinogen (mg/dL) | 321.10 | 321.10 | 321.10 | 350.00 | 350.00 | 350.00 | <0.001 |
| INR | 1.10 | 1.10 | 1.10 | 1.20 | 1.20 | 1.20 | <0.001 |
| PT (Sec) | 13.10 | 13.10 | 13.10 | 14.20 | 14.20 | 14.20 | <0.001 |
| PCT (ng/mL) | 0.12 | 0.12 | 0.12 | 2.75 | 2.53 | 2.75 | <0.001 |
| ESR (nm/hr) | 17.00 | 17.00 | 17.00 | 49.00 | 49.00 | 49.00 | <0.001 |
| Troponin (ng/L) | 16.12 | 10.00 | 19.00 | 53.27 | 15.00 | 75.00 | <0.001 |
| aPTT (Sec) | 32.75 | 32.75 | 32.75 | 32.00 | 32.00 | 32.00 | <0.001 |
| No | ML Models | F12 |
|---|---|---|
| 1 | Histogram-based Gradient Boosting (HGB) | 1.0000 |
| 2 | Adaboost (AB) | 0.9952 |
| 3 | Extra Trees (ET) | 0.9952 |
| 4 | K-nearest neighbors (KNN) | 0.9929 |
| 5 | Random Forest (RF) | 0.9928 |
| 6 | Support Vector Machine with Linear Kernel (SVM-LK) | 0.9904 |
| 7 | Multinomial Naive Bayes (MNB) | 0.9881 |
| 8 | Gaussian Naive Bayes (GNB) | 0.9646 |
| 9 | Stochastic Gradient Descent (SGD) | 0.9642 |
| 10 | Decision Tree (DT) | 0.9642 |
| 11 | Bernoulli Naive Bayes (BNB) | 0.9563 |
| 12 | Linear discriminant analysis (LDA) | 0.9431 |
| 13 | Support Vector Machine with non-linear Kernel (SVM-NLK) | 0.9428 |
| 14 | Multilayer Perceptron (MP) | 0.9011 |
| 15 | Passive-Aggressive (PA) | 0.8772 |
| 16 | Quadratic Discriminant Analysis (QDA) | 0.7212 |
| Feature Name | № | F12 HGB Model | F12 One-Threshold Approach | F12 Two-Threshold Approach |
|---|---|---|---|---|
| PCT | 35 | 0.9621 | 0.54277 | 0.95118 |
| Ferritin | 31 | 0.90966 | 0.53731 | 0.90577 |
| Fibrinogen | 32 | 0.88417 | 0.4635 | 0.67443 |
| ESR | 36 | 0.845 | 0.54522 | 0.69842 |
| PT | 34 | 0.76401 | 0.579 | 0.58245 |
| D-dimer | 30 | 0.71535 | 0.6408 | 0.65008 |
| INR | 33 | 0.70204 | 0.58302 | 0.58743 |
| Amylase | 5 | 0.6699 | 0.61374 | 0.6599 |
| aPTT | 38 | 0.62451 | 0.53117 | 0.53603 |
| D-Bil | 7 | 0.54567 | 0.41042 | 0.4068 |
| CK-MB | 6 | 0.54277 | 0.6026 | 0.46247 |
| UA | 13 | 0.52454 | 0.38088 | 0.38088 |
| Feature Pairs | Precision | Recall | F1 | F12 | ||||||
|---|---|---|---|---|---|---|---|---|---|---|
| Surv. | Non-Surv. | Surv. | Non-Surv. | Surv. | Non-Surv. | |||||
| D-dimer | PCT | 30 | 35 | 0.9979 | 0.9867 | 0.9987 | 0.9786 | 0.9983 | 0.9825 | 0.98083 |
| PCT | ESR | 35 | 36 | 0.997 | 0.9911 | 0.9992 | 0.9704 | 0.9981 | 0.9805 | 0.97864 |
| D-Bil | PCT | 7 | 35 | 0.9987 | 0.9735 | 0.9975 | 0.9866 | 0.9981 | 0.9798 | 0.97794 |
| Ferritin | PCT | 31 | 35 | 0.997 | 0.9868 | 0.9987 | 0.9699 | 0.9979 | 0.9782 | 0.97615 |
| LDH | PCT | 11 | 35 | 0.9992 | 0.9648 | 0.9966 | 0.991 | 0.9979 | 0.9774 | 0.97535 |
| PT | PCT | 34 | 35 | 0.9953 | 0.9781 | 0.9979 | 0.9536 | 0.9966 | 0.9654 | 0.96212 |
| PCT | aPTT | 35 | 38 | 0.9975 | 0.9564 | 0.9958 | 0.975 | 0.9966 | 0.9643 | 0.96102 |
| CK-MB | PCT | 6 | 35 | 0.9983 | 0.9473 | 0.995 | 0.983 | 0.9966 | 0.9641 | 0.96082 |
| INR | PCT | 33 | 35 | 0.9941 | 0.9868 | 0.9987 | 0.9435 | 0.9964 | 0.9641 | 0.96063 |
| MCH | PCT | 19 | 35 | 0.9992 | 0.9386 | 0.9941 | 0.991 | 0.9966 | 0.9635 | 0.96022 |
| ALT | PCT | 1 | 35 | 0.9992 | 0.9386 | 0.9941 | 0.991 | 0.9966 | 0.9635 | 0.96022 |
| MCV | PCT | 21 | 35 | 0.9992 | 0.9386 | 0.9941 | 0.991 | 0.9966 | 0.9635 | 0.96022 |
| eGFR | PCT | 12 | 35 | 0.9992 | 0.9386 | 0.9941 | 0.991 | 0.9966 | 0.9635 | 0.96022 |
| Creatinine | PCT | 9 | 35 | 0.9992 | 0.9386 | 0.9941 | 0.991 | 0.9966 | 0.9635 | 0.96022 |
| RBC | PCT | 26 | 35 | 0.9992 | 0.9386 | 0.9941 | 0.991 | 0.9966 | 0.9635 | 0.96022 |
| Glucose | PCT | 8 | 35 | 0.9992 | 0.9386 | 0.9941 | 0.991 | 0.9966 | 0.9635 | 0.96022 |
| UA | PCT | 13 | 35 | 0.9992 | 0.9386 | 0.9941 | 0.991 | 0.9966 | 0.9635 | 0.96022 |
| WBC | PCT | 28 | 35 | 0.9987 | 0.9386 | 0.9941 | 0.9863 | 0.9964 | 0.9614 | 0.95794 |
| BASO | PCT | 14 | 35 | 0.9987 | 0.9386 | 0.9941 | 0.9865 | 0.9964 | 0.9613 | 0.95784 |
| PLT | PCT | 25 | 35 | 0.9987 | 0.9386 | 0.9941 | 0.9865 | 0.9964 | 0.9613 | 0.95784 |
| RDW | PCT | 27 | 35 | 0.9987 | 0.9386 | 0.9941 | 0.9865 | 0.9964 | 0.9613 | 0.95784 |
| AST | PCT | 2 | 35 | 0.9987 | 0.9386 | 0.9941 | 0.9865 | 0.9964 | 0.9613 | 0.95784 |
| PCT | Troponin | 35 | 37 | 0.9983 | 0.9386 | 0.9941 | 0.9821 | 0.9962 | 0.9593 | 0.95565 |
| CK | PCT | 10 | 35 | 0.9979 | 0.9431 | 0.9945 | 0.978 | 0.9962 | 0.9593 | 0.95565 |
| MPV | PCT | 23 | 35 | 0.9983 | 0.9386 | 0.9941 | 0.9817 | 0.9962 | 0.9593 | 0.95565 |
| MONO | PCT | 22 | 35 | 0.9983 | 0.9386 | 0.9941 | 0.9819 | 0.9962 | 0.9593 | 0.95565 |
| Albumin | PCT | 3 | 35 | 0.9992 | 0.9297 | 0.9933 | 0.9912 | 0.9962 | 0.958 | 0.95436 |
| MCHC | PCT | 20 | 35 | 0.9987 | 0.9298 | 0.9933 | 0.9878 | 0.996 | 0.9566 | 0.95277 |
| CK-MB | Ferritin | 6 | 31 | 0.9924 | 0.987 | 0.9987 | 0.9271 | 0.9955 | 0.9558 | 0.9515 |
| Amylase | PCT | 5 | 35 | 0.9966 | 0.9474 | 0.995 | 0.9648 | 0.9958 | 0.9554 | 0.95139 |
| HCT | PCT | 16 | 35 | 0.9979 | 0.9343 | 0.9937 | 0.9792 | 0.9958 | 0.9549 | 0.95089 |
| Ferritin | aPTT | 31 | 38 | 0.9915 | 0.9825 | 0.9983 | 0.9258 | 0.9949 | 0.9511 | 0.94625 |
| EOS | PCT | 15 | 35 | 0.997 | 0.9343 | 0.9937 | 0.9688 | 0.9954 | 0.9506 | 0.94623 |
| HGB | PCT | 17 | 35 | 0.9979 | 0.9253 | 0.9929 | 0.9768 | 0.9954 | 0.9495 | 0.94513 |
| LYM | PCT | 18 | 35 | 0.9962 | 0.9386 | 0.9941 | 0.9604 | 0.9951 | 0.9488 | 0.94415 |
| D-dimer | ESR | 30 | 36 | 0.9911 | 0.9825 | 0.9983 | 0.9161 | 0.9947 | 0.9477 | 0.94268 |
| CRP | PCT | 29 | 35 | 0.9958 | 0.9386 | 0.9941 | 0.9579 | 0.9949 | 0.9468 | 0.94197 |
Publisher’s Note: MDPI stays neutral with regard to jurisdictional claims in published maps and institutional affiliations. |
© 2022 by the authors. Licensee MDPI, Basel, Switzerland. This article is an open access article distributed under the terms and conditions of the Creative Commons Attribution (CC BY) license (https://creativecommons.org/licenses/by/4.0/).
Share and Cite
Huyut, M.T.; Velichko, A.; Belyaev, M. Detection of Risk Predictors of COVID-19 Mortality with Classifier Machine Learning Models Operated with Routine Laboratory Biomarkers. Appl. Sci. 2022, 12, 12180. https://doi.org/10.3390/app122312180
Huyut MT, Velichko A, Belyaev M. Detection of Risk Predictors of COVID-19 Mortality with Classifier Machine Learning Models Operated with Routine Laboratory Biomarkers. Applied Sciences. 2022; 12(23):12180. https://doi.org/10.3390/app122312180
Chicago/Turabian StyleHuyut, Mehmet Tahir, Andrei Velichko, and Maksim Belyaev. 2022. "Detection of Risk Predictors of COVID-19 Mortality with Classifier Machine Learning Models Operated with Routine Laboratory Biomarkers" Applied Sciences 12, no. 23: 12180. https://doi.org/10.3390/app122312180