Article

Molecular Dynamics Study of Interfacial Properties for Crude Oil with Pure and Impure CH4

1
College of Petroleum Engineering, Xi’an Shiyou University, Xi’an 710065, China
2
Research Institute of Petroleum Exploration & Development, PetroChina, Beijing 100083, China
3
College of Engineering, China University of Geoscience, Wuhan 430074, China
*
Author to whom correspondence should be addressed.
Appl. Sci. 2022, 12(23), 12239; https://doi.org/10.3390/app122312239
Submission received: 14 October 2022 / Revised: 17 November 2022 / Accepted: 23 November 2022 / Published: 29 November 2022
(This article belongs to the Special Issue Approaches and Development in Enhancing Oil Recovery (EOR))

Abstract

:
Gas injection has received increasing attention as one of the key technologies to enhance oil recovery. When gas is dissolved in crude oil, it will accelerate the flow of crude oil by reducing the density, viscosity, interfacial tension (IFT), and other properties of crude oil, so IFT is one of the main factors affecting the recovery of the gas drive. The interfacial properties of CH4, one of the principal associated hydrocarbon gases, with crude oil remain unclear. In this study, molecular dynamics (MD) simulations were used to determine the IFTs of pure and impure CH4 with n-decane as well as the IFTs of the ternary systems CH4 + n-hexane + n-decane and CH4 + n-decane + n-nonadecane. Additionally, investigating factors including pressure, temperature, gas composition, and crude oil composition reveals the mechanisms affecting the interfacial properties of CH4 and crude oil. The results demonstrate that CO2 significantly lowers the IFT of CH4 + n-decane; the effect of crude oil components on IFT varies with the properties of the crude oil and, generally speaking, IFT is greater for crude oils containing heavy components than for those containing light components; the effect of temperature on the IFT of the CH4 + n-decane system is more pronounced at low pressure and decreases with increasing pressure. This study contributes to understanding the behavior of CH4 and oil systems in the formation and could be used to enhance the oil recovery technology.

1. Introduction

The use of CH4 gas as a driving medium is unaffected by the low permeability or salinity of formation water, and it is easily accessible in most oil fields [1]. If it can achieve a miscible phase state with the crude oil and remove the influence of IFT, it will be able to maximize the replacement of residual oil in the reservoir and thus improve crude oil recovery. Therefore, the behavior of the CH4–crude oil interface is crucial to the investigation of increased crude oil recovery.
IFT is the mechanical description of interfacial properties for gas–liquid systems; the common laboratory measurement methods are the capillary rise, maximum bubble, and suspension drop [2,3,4,5]. Compared to experimental studies, which lack a microscopic understanding of interfacial phenomena, molecular simulation methods have the advantages of low cost and few restrictions, and can provide direct microscopic information. Therefore, the research on gas–liquid interfacial properties can be carried out using molecular simulation methods [6]. The gas–liquid coexistence phase can be directly partitioned using MD methods to determine the surface tension and microscopic characteristics near the gas–liquid interface [7,8,9]. With the development of MD, more and more scholars have conducted simulation studies of gas–liquid interface phenomena. Through simulations, Thompson et al. [10] found that the surface tension of droplets is related to the pressure tensor component of the normal direction. Mecke et al. [11] investigated the effect of the cutoff radius size on the interfacial properties using the MD method. Following this, many researchers used the MD method to calculate and analyze the variation patterns of density, pressure tensor, and surface tension of L-J fluids in gas–liquid phase equilibrium [12,13,14]. Frezzotti et al. [15] investigated and discussed the effect of boundary conditions on the properties of the gas–liquid interface using the MD method. Chilukoti et al. [16] simulated and studied the structure of various alkanes at the gas–liquid interface and their diffusion ability in the interfacial layer. They found that the ordering and chain conformations of different alkanes at the interface are very similar at the same temperatures.
Several researchers have conducted experimental studies and molecular simulations related to the IFT of methane and alkane systems. Weinaugl et al. [17] measured the IFT from 258.15 K to 313.15 K and 0.28 MPa to 8.48 MPa and summarized the variation of the IFT of the CH4+C3H8 binary system. Amin et al. [18] measured the CH4 IFT in an equilibrium system with other small molecule alkanes and theoretically preliminarily examined the impact of pressure and temperature on the IFT. Miqueu et al. [19] successfully studied the IFT of binary mixture systems with CH4 + C5H12, CH4 + C7H16, and CH4 + C10H22 at 310.93 K using the Peng–Robinson equation. Ramĺrez-Verduzco et al. [20] constructed functions based on conditions such as concentration and temperature, using a basic thermodynamic model that correlates IFT, surface concentration, and relative Gibbs adsorption isotherms. Pereira et al. [21] considered the IFT model containing a combination of parachor, linear gradient theory, density gradient theory approach, and Peng–Robinson 1978 EoS (VT-PPR78 EoS) and evaluated the predictive power of the model for IFTs of 16 binary mixtures. Choudhary et al. [22] used MD simulations to study the IFT of CH4+C10H22 under geological conditions in the temperature range of 313–442 K. Klein et al. [23] investigated the effect of six gases, He, H2, CO2, N2, CO, and CH4, on the IFT of n-hexadecane using equilibrium molecular dynamics (EMD) and analyzed and summarized the effect of gas concentration and system temperature on the IFT of binary mixtures. De Lara et al. [24] used MD simulations to investigate the wettability of the interface between crude oil and CH4. The effects of temperature and pressure on the physicochemical properties of the interface between CH4 and crude oil were then determined. It is to be noted that the investigation of the effects of crude oil components and gas composition on the microscopic properties of the CH4+ alkane interface has been rare, both of which are critical for understanding the CH4 oil drive mechanism.
In this study, MD simulations determined the IFTs of several types of CH4+alkane systems, and the microscopic mechanisms affecting IFT were disclosed based on the molecular details provided by the simulations. Section 2 introduces the molecular models and simulation details used in this study. Section 3 investigates the effects of temperature, pressure, injected gas components, and crude oil components on IFT. Then, it is explained how these factors affect interfacial properties using parameters such as number density distribution, mean square displacement, and radial distribution function.

2. Methodology

2.1. Molecular Model

All simulations were performed with LAMMPS [25]. All alkanes (n-hexane, n-decane, and n-nonadecane) used the NERD model [26], which calculates gas–liquid equilibrium curves close to experimental data. Usually, one atom is used to represent CH3 and CH2 in the NERD model. The CH4 molecule was modeled by the TraPPE-UA model [27], which uses one atom to represent CH4. Finally, the CO2 molecule used the ZHU flexible model [28], which considers the molecular structure characteristics of supercritical CO2 and allows accurate prediction of the saturated gas–liquid phase density.

2.2. Force Field

The molecular force field includes the molecular interaction potential, van der Waals potential, and Coulomb potential, as shown in Equations (1)–(8).
U t o t a l = U c o u l + U v d w + U s t r e t c h + U b e n d + U t o r s i o n
Coulomb’s action potential is based on Coulomb’s law.
U c o u l = q i q j 4 π ε 0 r i j
where q i and   q j are the charge of atom i and atom j , ε 0 is the dielectric constant, and r i j is the distance between the two atoms.
Van der Waals forces are calculated using the 12-6 Lennard-Jones potential function.
U v d w = 4 ε i j [ ( σ i j r i j ) 12 ( σ i j r i j ) 6 ]
where ε i j is the well depth for short-range interactions and σ i j is the core diameter of the L-J potential.
The L-J parameters between different atoms are obtained by mixing rule calculations, and the common mixing rule, the Lorentz–Berthelot mixing rule [29], is shown in Equations (4) and (5).
σ i j = σ i + σ j 2
ε i j = ε i ε j
The molecular interaction potential includes bond stretching potential, bond angle bending potential, and dihedral angle torsion potential. In this study, harmonic is used to describe the bond stretching and bond angle bending potentials, and opls is used to describe the dihedral angle torsion potential. The bond stretching potential is shown in Equation (6).
U s t r e t c h = K r ( r r 0 ) 2
The bond angle bending potential is shown in Equation (7).
U b e n d = K θ ( θ θ 0 ) 2
The dihedral angle torsion potential is shown in Equation (8).
U t o r s i o n = V 0 + V 1 ( 1 + cos ψ ) + V 2 [ 1 cos ( 2 ψ ) ] + V 3 [ 1 + cos ( 3 ψ ) ]
where r 0 , r represent the known bond length and equilibrium bond length, θ 0 , θ represent the known bond angle and equilibrium bond angle, K r , K θ , and V n represent bond stretch potential constant, bond angle bending potential constant, and dihedral angle torsion potential constant.
The non-bonded and bonded parameters for each of the force fields used in this work are listed in Table 1 and Table 2.

2.3. Simulation Details

As shown in Figure 1, the gas–liquid system consists of a liquid alkane in the middle and a gas on both sides, and the dimensions of the simulation cell are Lx × Ly × Lz = 5 × 5 × 30 nm3. The systems considered in this study include the binary system of CH4+n-decane, and the ternary systems of CH4 + CO2 + n-decane, CH4 + n-hexane + n-decane, and CH4 + n-decane + n-nonadecane. The simulation is performed on a mixture containing more than 10,000 atoms, where the number of alkane molecules is constant at 800, and the pressure of the system is controlled by varying the number of gas molecules introduced.
The configuration snapshots were created using OVITO software (Version 2.9.0) [30].
A Nosé–Hoover thermostat was used throughout the MD simulations to keep the temperature constant [31,32]. The particle–particle–particle–mesh (PPPM) summation method was used for the long-range force electrostatic interactions, with an accuracy of 1.0 × 10⁻⁴ [33]. The cell parallel to the interface direction was 5 × 5 nm2 and the cutoff radius for non-bonding interaction forces was 2 nm (Approx.6σ), these values were chosen to reduce the truncation and system size effects in the interface property calculations [34,35,36]. The simulation time step was 1 fs. The entire simulation time comprised 10 ns of relaxation time and 30 ns of production time, with statistics at 10 ps intervals, and the IFT of the system was calculated.
The IFT was calculated as Equation (9) [37].
γ = = 1 2 [ P z z ( P x x + P y y ) 2 ] L Z
where γ is the IFT, P N ( z ) and P T ( z ) are the normal and tangential pressures, P α α is the amount on the diagonal of the pressure tensor, and L Z is the length of the simulated system in the z-direction.
The variation of the mean square displacement (MSD) with time characterizes the diffusion behavior of the atoms [38]. The expression for MSD is as follows.
M S D ( t ) = | r i ( t ) r i ( 0 ) | 2
where r i ( 0 ) represents the position of atom i at the initial moment and r i ( t ) represents the position of atom i at the moment t .
The radial distribution function is the probability of the appearance of another atom j at a distance r around atom i . It can also be interpreted as the ratio of the regional density to the average density of the system [39]. It can reflect fluid molecules’ aggregation properties and analyze the fluid’s microstructure. The expression is shown in Equation (11).
g ( r ) = d N ρ 4 π r 2 d r
where N is the number of atoms, ρ is the system density, and r is the distance between two atoms.

3. Results and Discussion

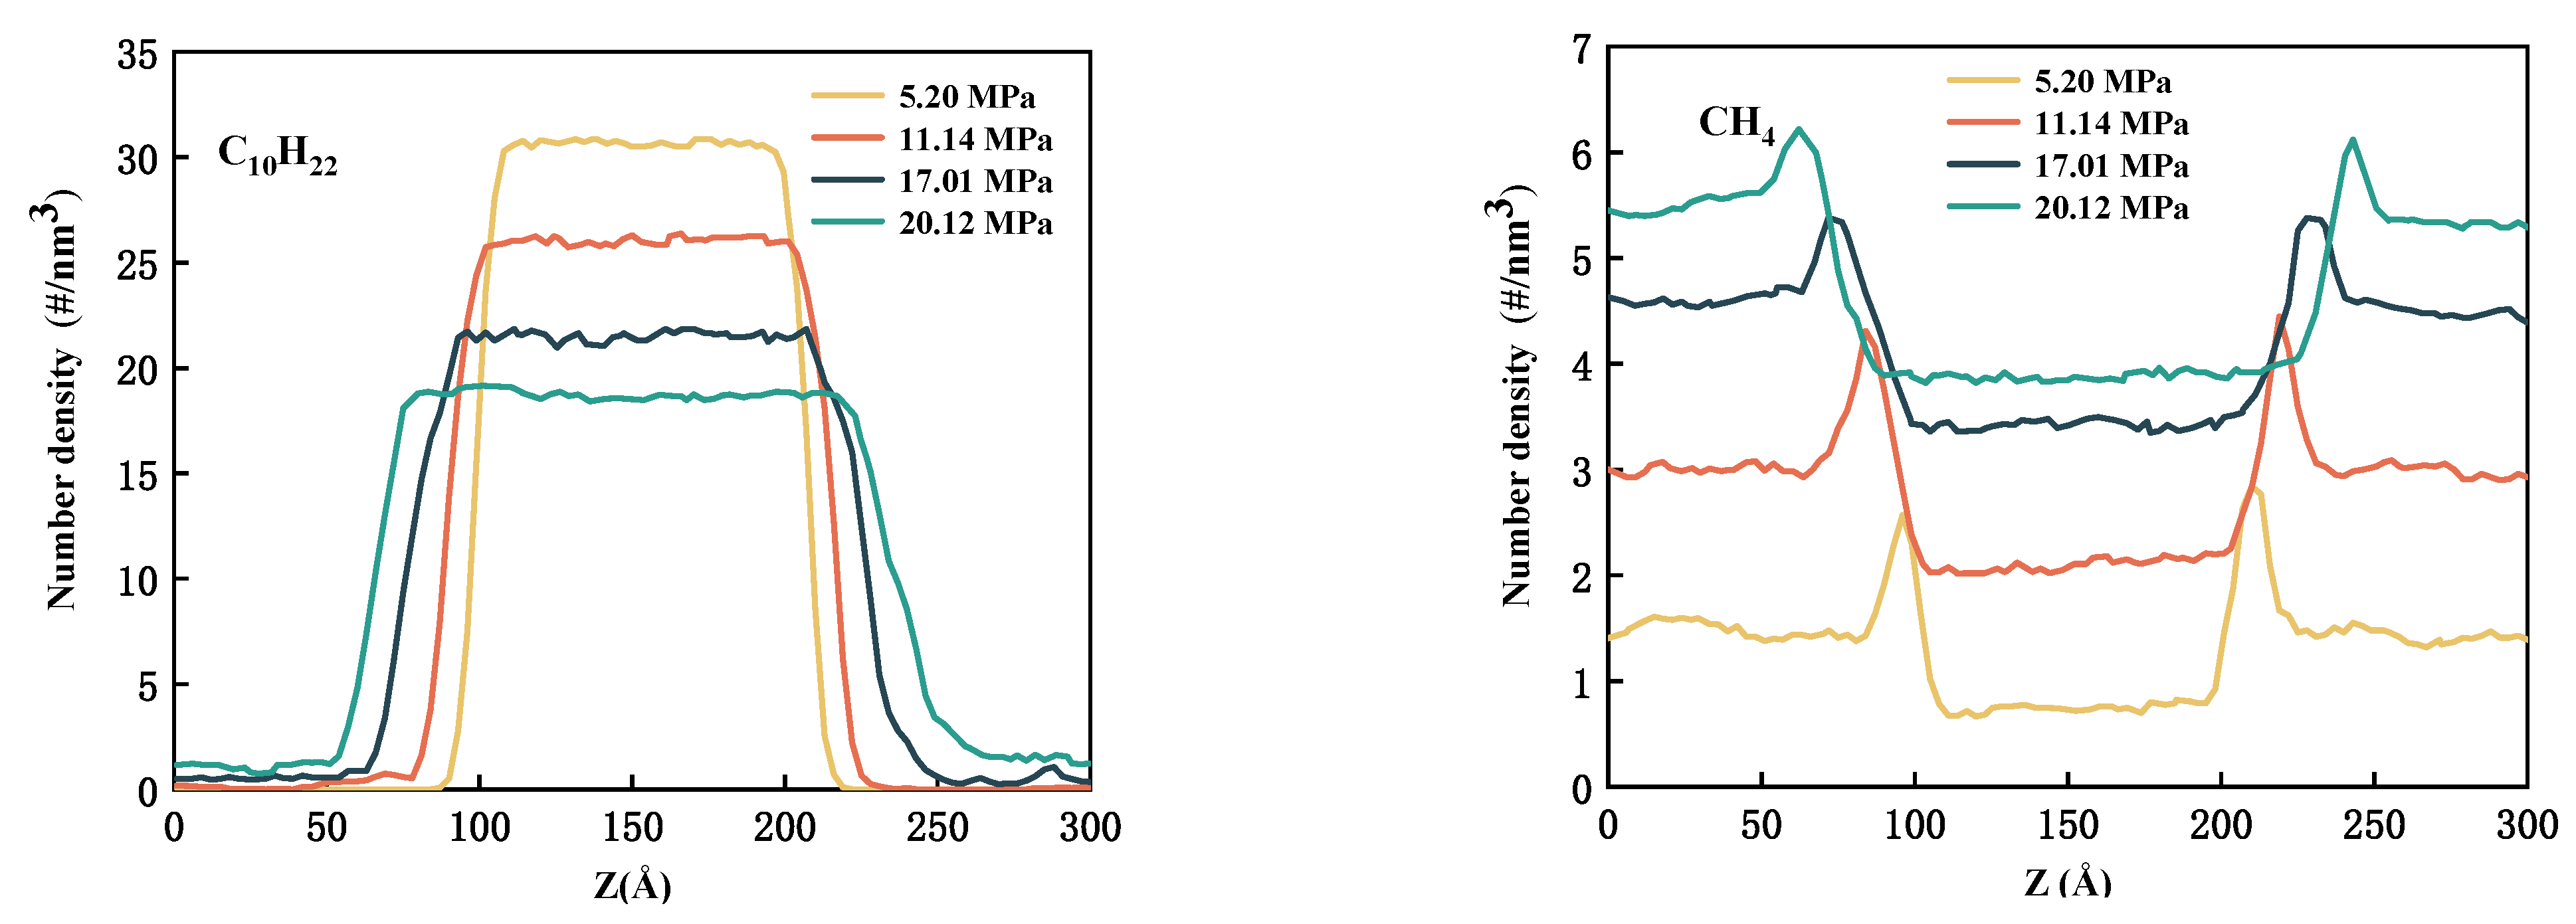
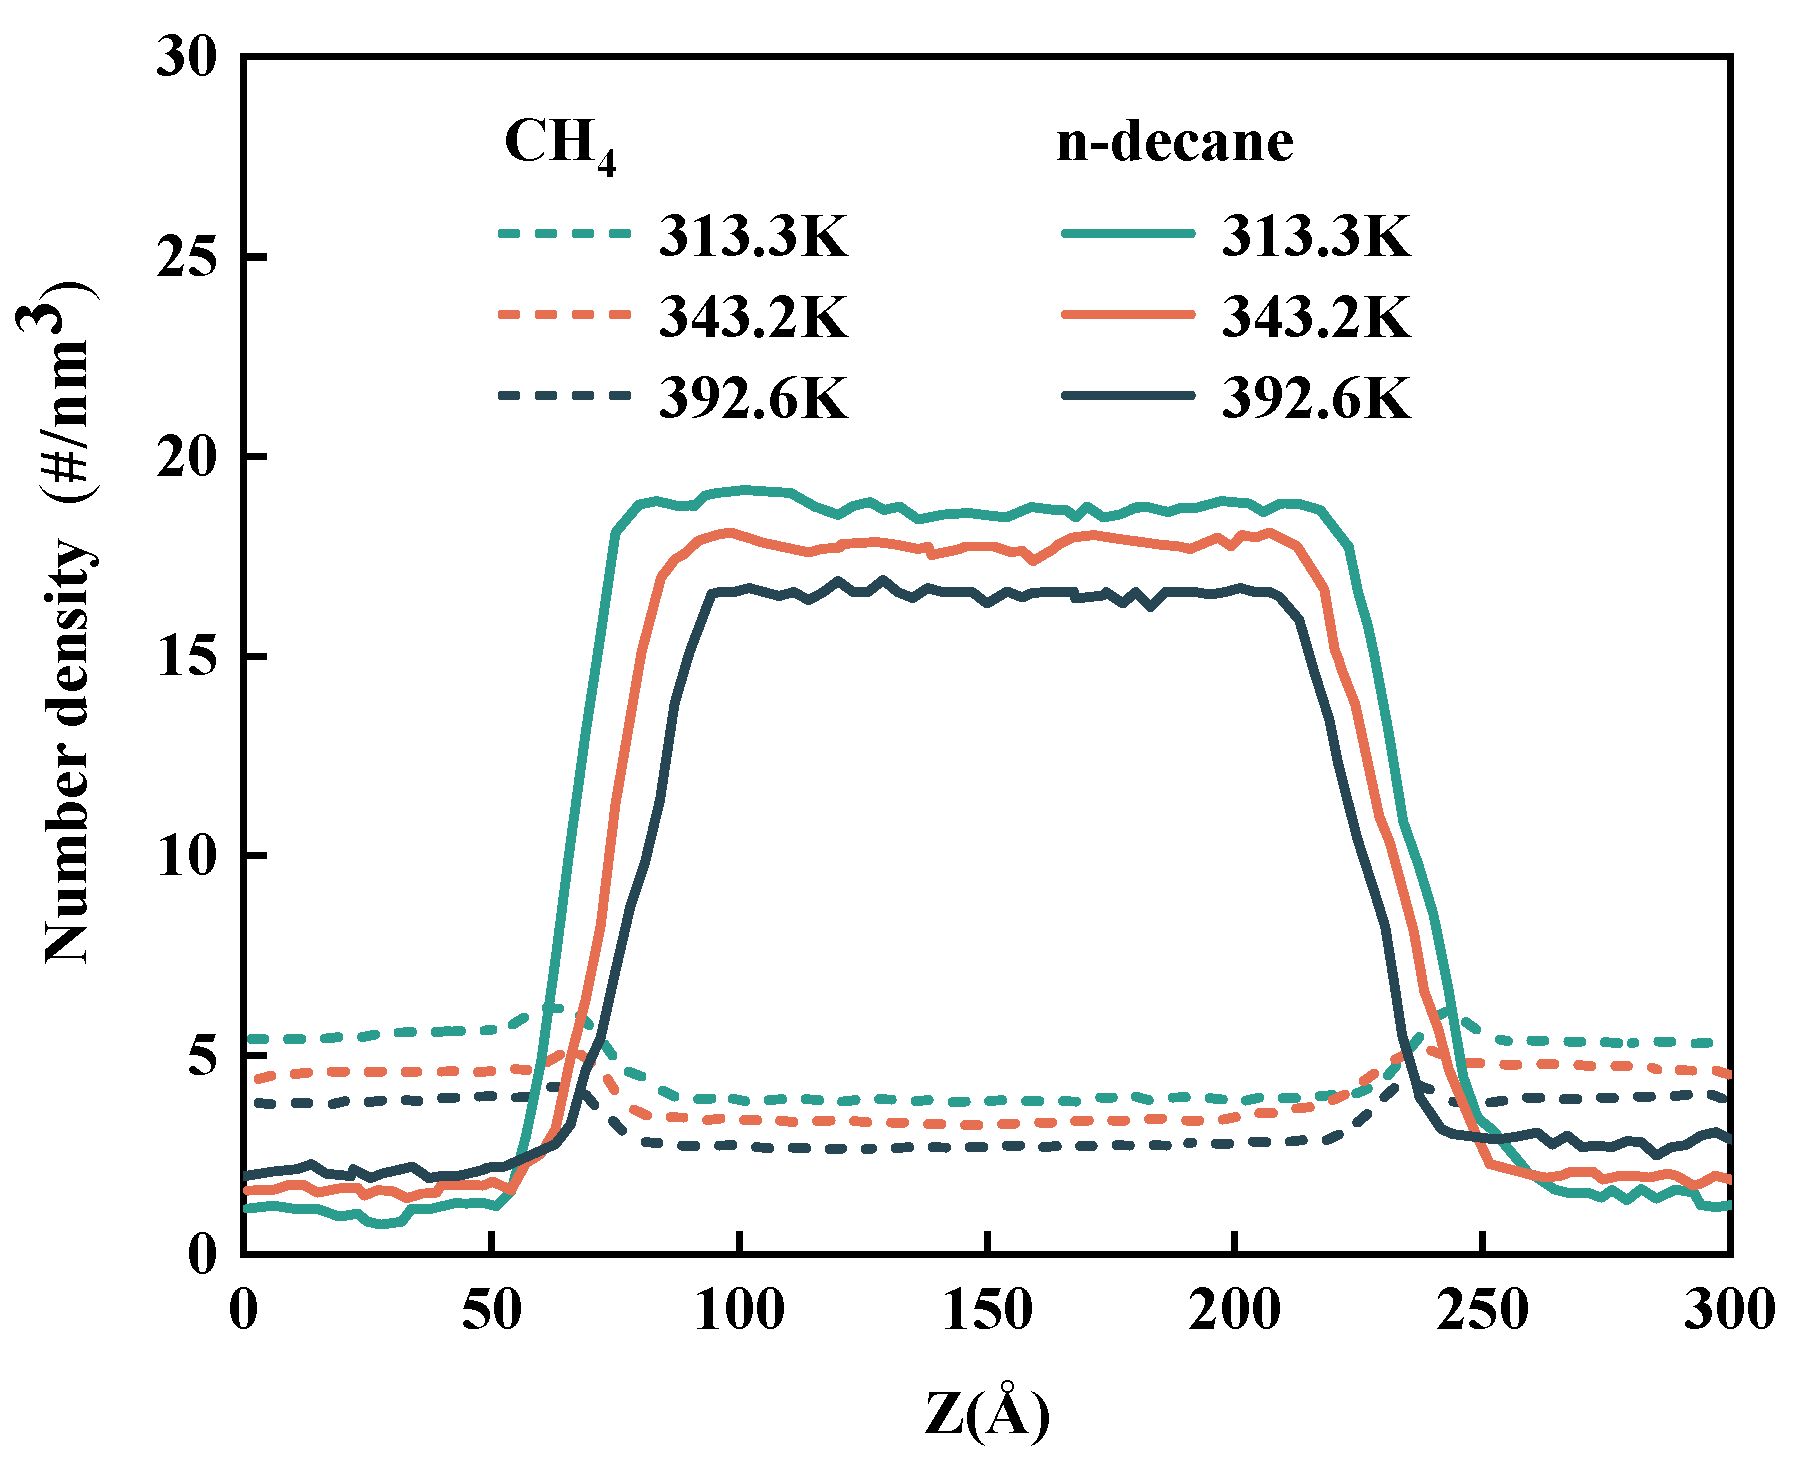
3.1. Density Profile

Figure 2 shows the equilibrium states of the CH4 + n-decane system at 313.3 K and different pressure conditions. The methane molecules gather at the gas–liquid interface, and the number of molecules gathered at the interface increases with increasing pressure. The number density distribution curve can clearly show the interfacial structure of alkane and methane. Figure 3 shows the density distribution of CH4 and n-decane along the vertical interface direction after the final equilibrium of the system at 313.3 K. As the system pressure increases, part of CH4 dissolves into the n-decane system, decreasing the density of n-decane, and the volume in the liquid phase gradually expands. While part of the n-decane component evaporates into the gas phase, the density of the gas phase then increases, and the phase interface gradually becomes thicker.
Figure 4 shows the number density distribution of CH4 and n-decane at the gas–liquid interface at different temperatures at 20.12 MPa. The number density distribution of n-decane in the liquid phase shows a decreasing trend with the temperature increase under the high-pressure condition but changes little. At the same time, the number density of CH4 also tends to become smaller with the temperature rise. Figure 5 and Figure 6 illustrate that after adding CO2 to the CH4 + n-decane system, the CO2 in the CH4/CO2 mixture is preferentially dissolved in n-decane; the dissolution of CO2 and CH4 makes the phase interface of the liquid phase broader. Additionally, after reaching equilibrium, more CO2 than CH4 is enriched at the interface, indicating that CO2 is more lipophilic than CH4.

3.2. Interfacial Tension

The predicted IFT for the CH4+n-decane mixed system at various temperatures is shown in Figure 7. The MD simulation data have very little error with the experimental data reported by Pereira [13] and the MD simulation results of Choudhary et al. [22]. The IFT decreases as the system pressure rises. It is worth noting that at low pressure, the system’s IFT decreases more with increasing temperature, whereas the IFT remains constant at high pressure. Figure 8 shows that adding CO2 to the CH4 and n-decane system reduces the IFT of the system. This phenomenon can be explained by interfacial density enrichment (e.g., Figure 5 and Figure 6), where both CH4 and CO2 aggregate at the liquid phase interface, and the CO2 aggregation density is higher than that of CH4, making the liquid phase interface more blurred, and the system’s IFT decreases. Figure 9 shows the change in system IFT for different crude oil components. The addition of n-hexane reduces IFT compared to n-nonadecane, which demonstrates that n-hexane and n-nonadecane have opposing effects on the IFT of the CH4+n-decane system.

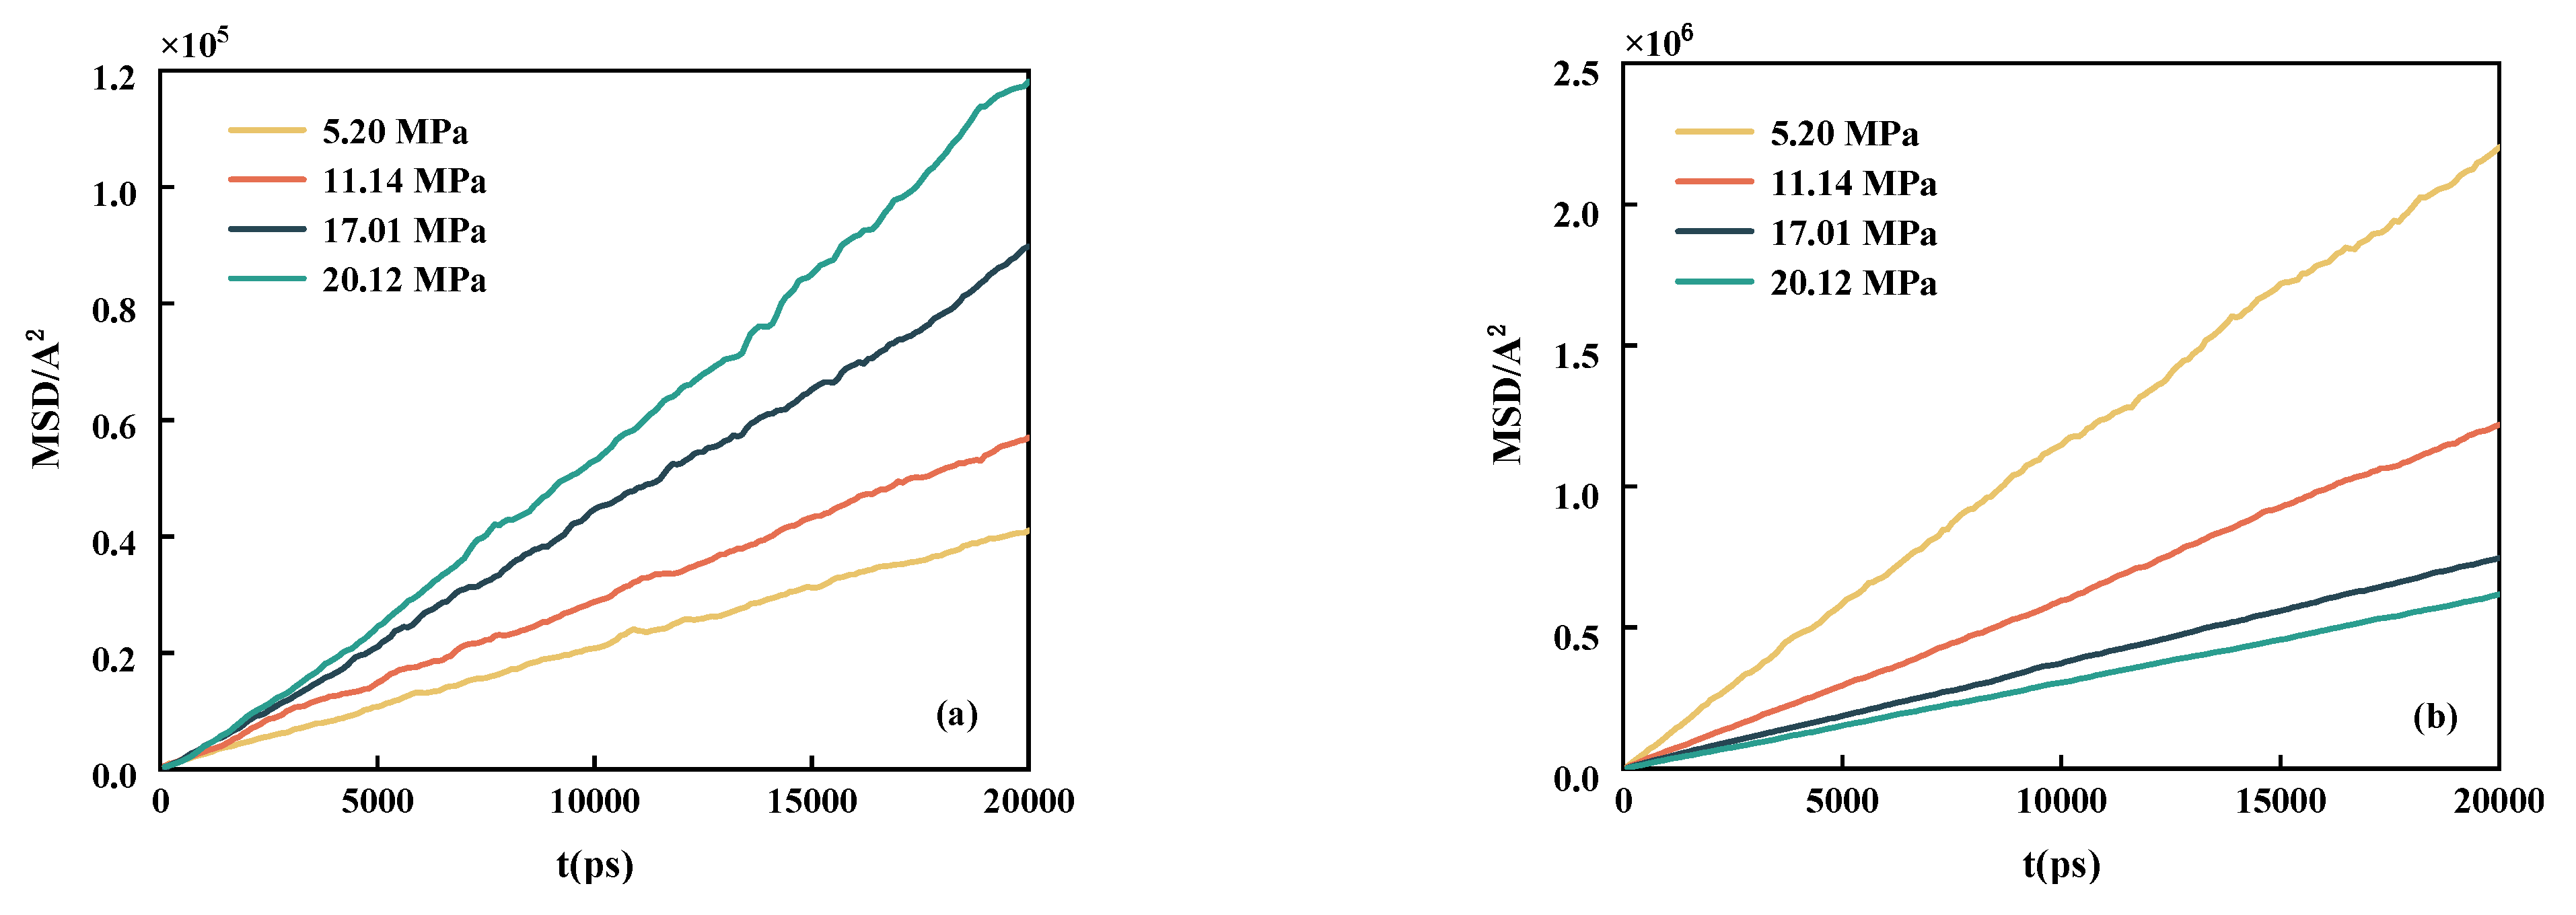
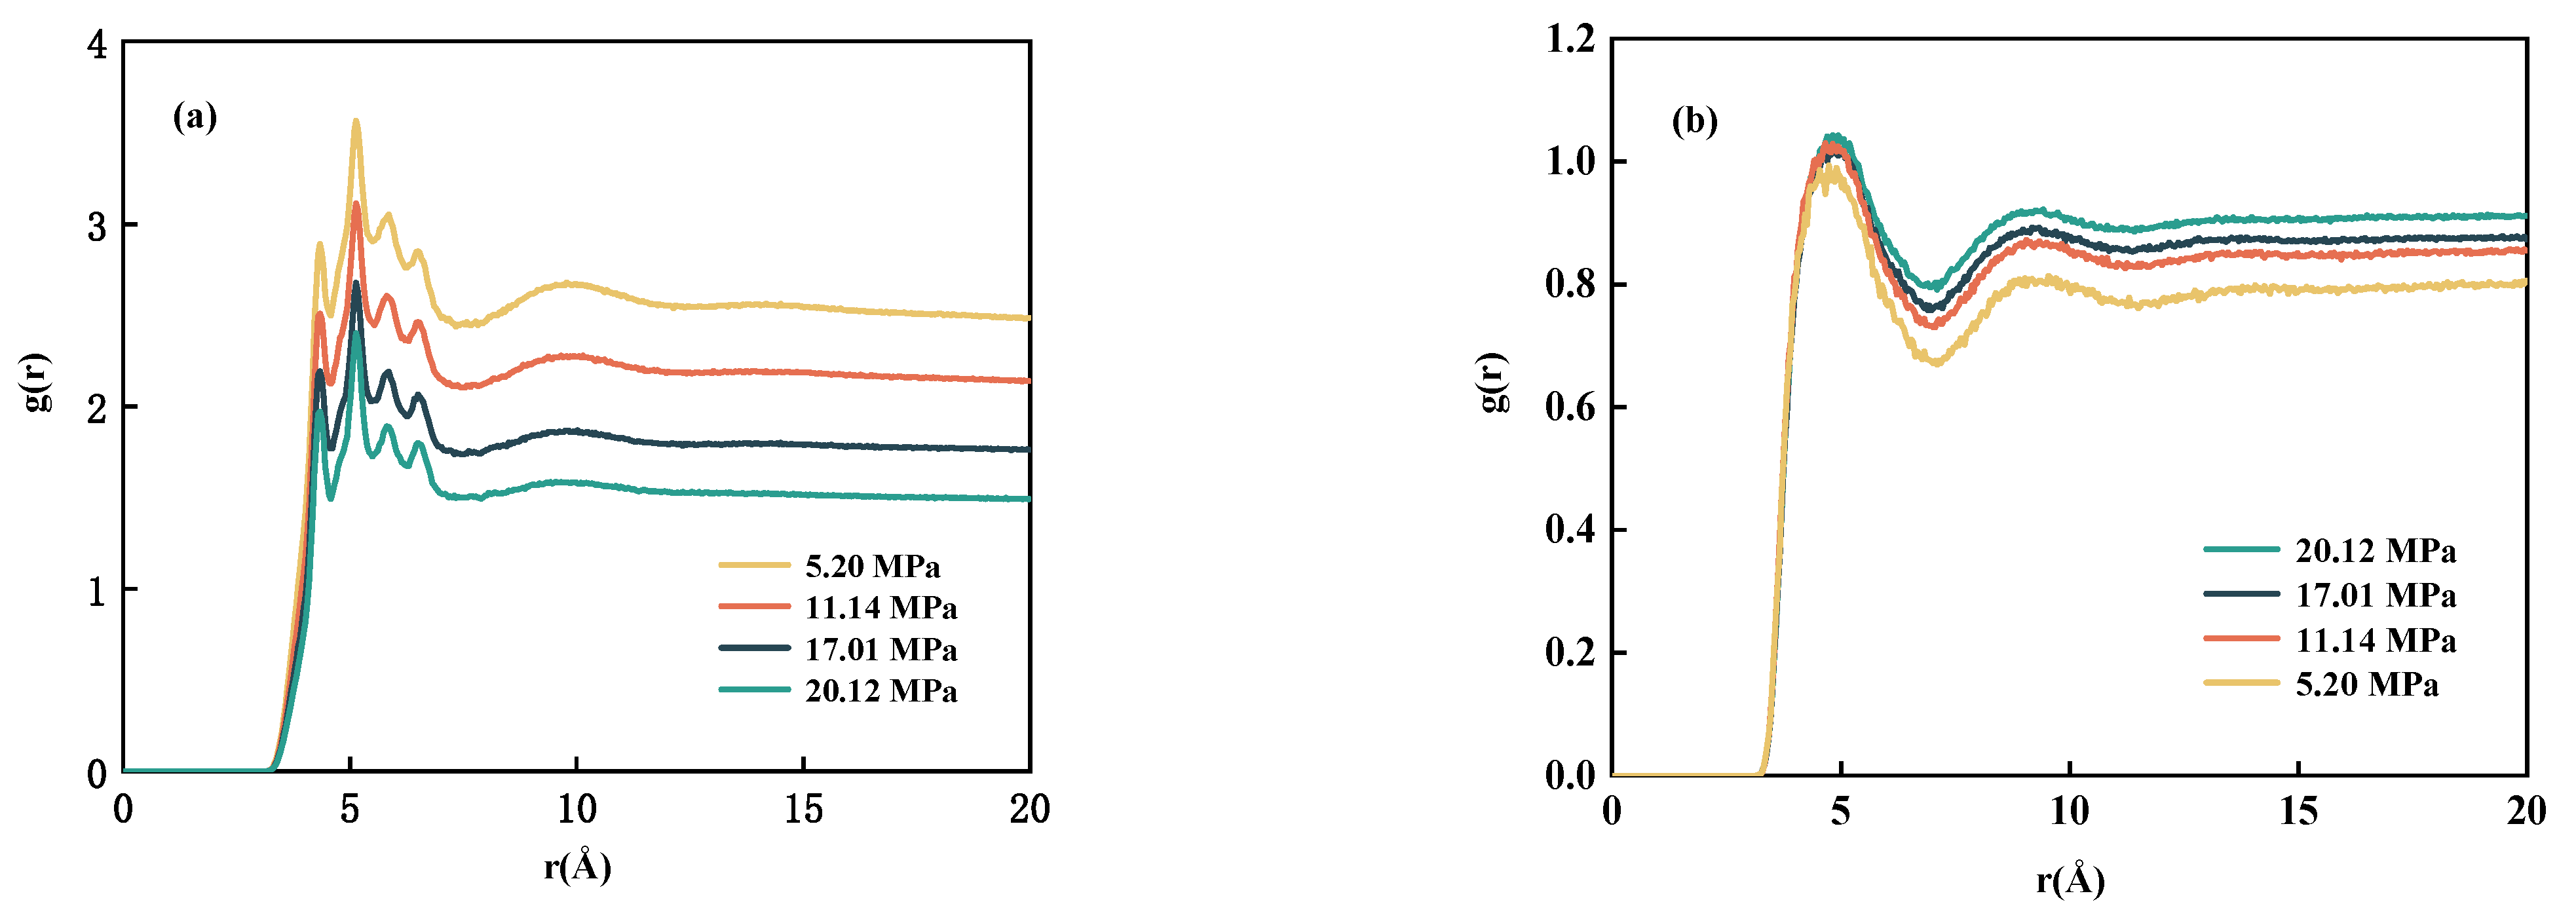
3.3. Diffusion Properties

The mean square displacement (MSD) of n-decane and CH4 of the binary system at various pressures was computed to study the diffusion properties of n-decane and the impact of CH4 on diffusion properties. As shown in Figure 10, the diffusion rate of n-decane gradually increases as CH4 solubility increases. At the same time, as the pressure increases, the influence of the interaction force between n-decane and CH4 becomes more robust, and more and more n-decane molecules will occupy the adsorption sites of methane molecules. This behavior reduces the space available for CH4 molecules to move freely, and more collisions between CH4 molecules increase the spatial site resistance, ultimately leading to a rapid decrease in diffusion rate.
The radial distribution functions of CH4 and n-decane in the binary system under different pressures were analyzed to understand further the effect of microstructural changes on the diffusion of n-decane after the dissolution of CH4, as shown in Figure 11. As the system pressure rises, the amount of n-decane surrounding the n-decane gradually decreases while CH4 increases, indicating that more and more CH4 molecules are dissolved into n-decane. The ability of n-decane to diffuse is also enhanced because CH4 has a higher intrinsic diffusion coefficient than n-decane.
Figure 12 shows the radial distribution function between n-decane-CH4 and n-decane-CO2 at 313.3 K and 11.14 MPa. N-decane interacts with CO2 more potently than CH4, resulting in a large number of CO2 molecules gathering around n-decane, limiting CH4 flow and decreasing the diffusion capacity of CH4 molecules. This result indicates that the interaction of carbon dioxide with n-decane is greater than that of CH4.
In order to investigate further into the molecular distribution of CH4 and the various crude oil components, the radial distribution functions of the various alkanes were calculated. In Figure 13a, the peak of the radial distribution function decreases as the number of alkane carbon atoms increases. Furthermore, as shown in Figure 13b, the peak of the n-decane-n-hexane curve is higher than the peak of the n-decane-n-nonadecane curve, indicating that n-hexane is more prone to weakening the interactions between n-decane molecules and thus aggregation around n-decane. It is further inferred that the light components aggregate more easily with each other and are more conducive to reaching a miscible state.

4. Conclusions

This study calculated the IFT between injected gas and crude oil using an MD simulation. The calculated IFT of the binary system of CH4 + n-decane was in good agreement with the experimental data. The results indicate that MD simulation has good feasibility and accuracy in predicting IFT and is an alternative to experimental methods. The effects of pressure, temperature, gas composition, and crude oil composition on IFT are investigated, and the results show that:
  • With rising pressure and falling temperature, there will be more CH4 enrichment at the interface. It is worth noting that after adding CO2 to CH4, the accumulation of CO2 at the interface is greater than that of CH4.
  • Under low pressure, the IFT of the CH4+n-decane system decreases dramatically as temperature rises. The IFT remains unchanged as the temperature rises when pressure is high.
  • The addition of CO2 can lower the IFT of the CH4+n-decane system. The IFT is affected in the opposite way by the addition of n-hexane and n-nonadecane, with the former having a lower IFT and the latter having a greater IFT.
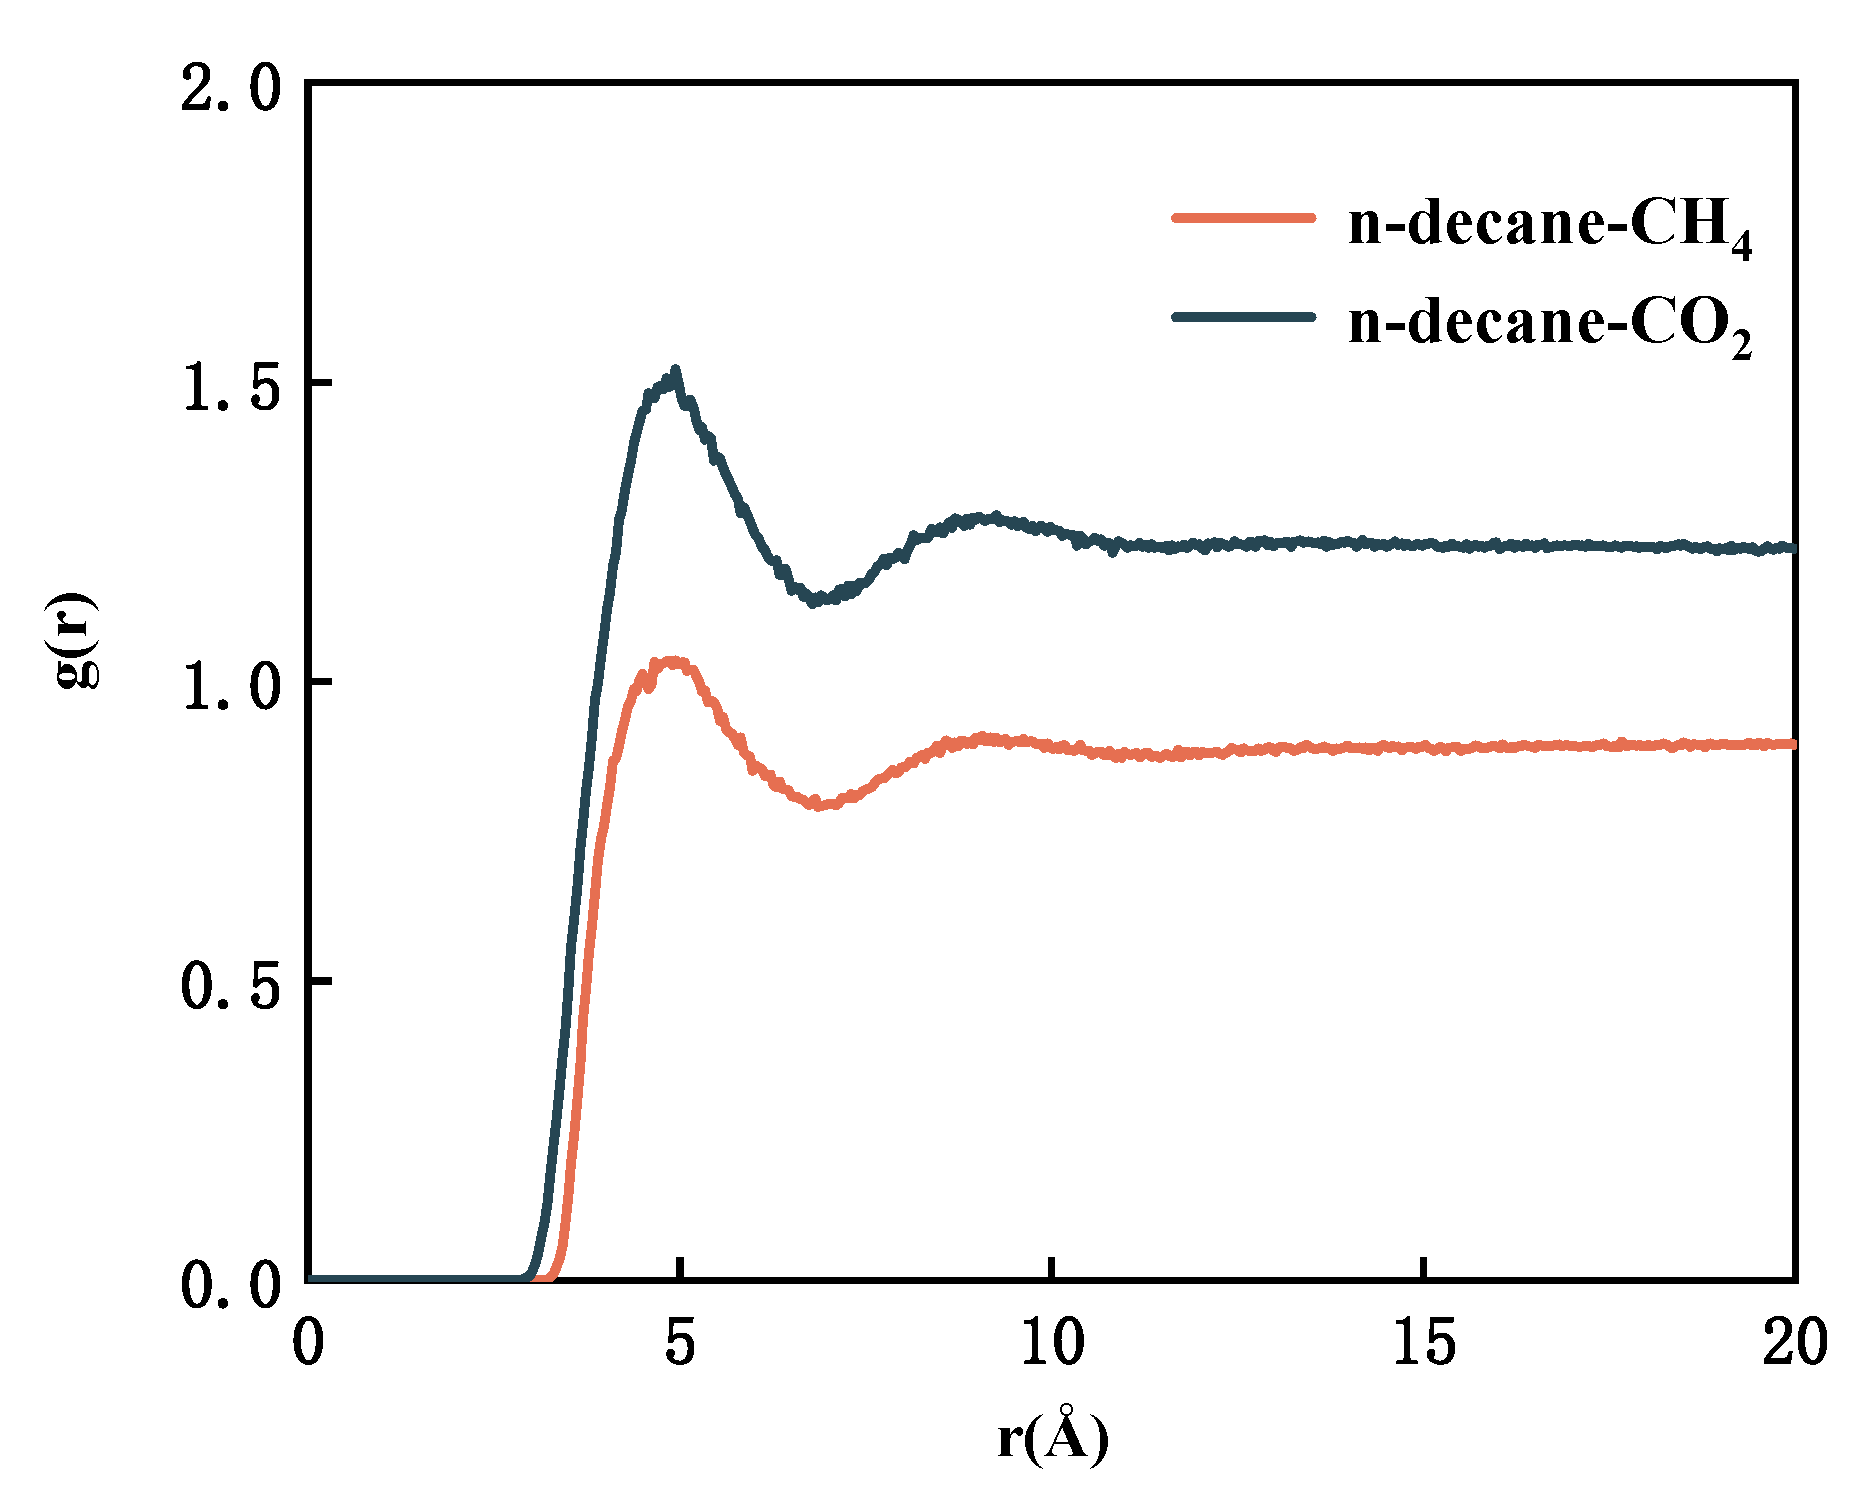
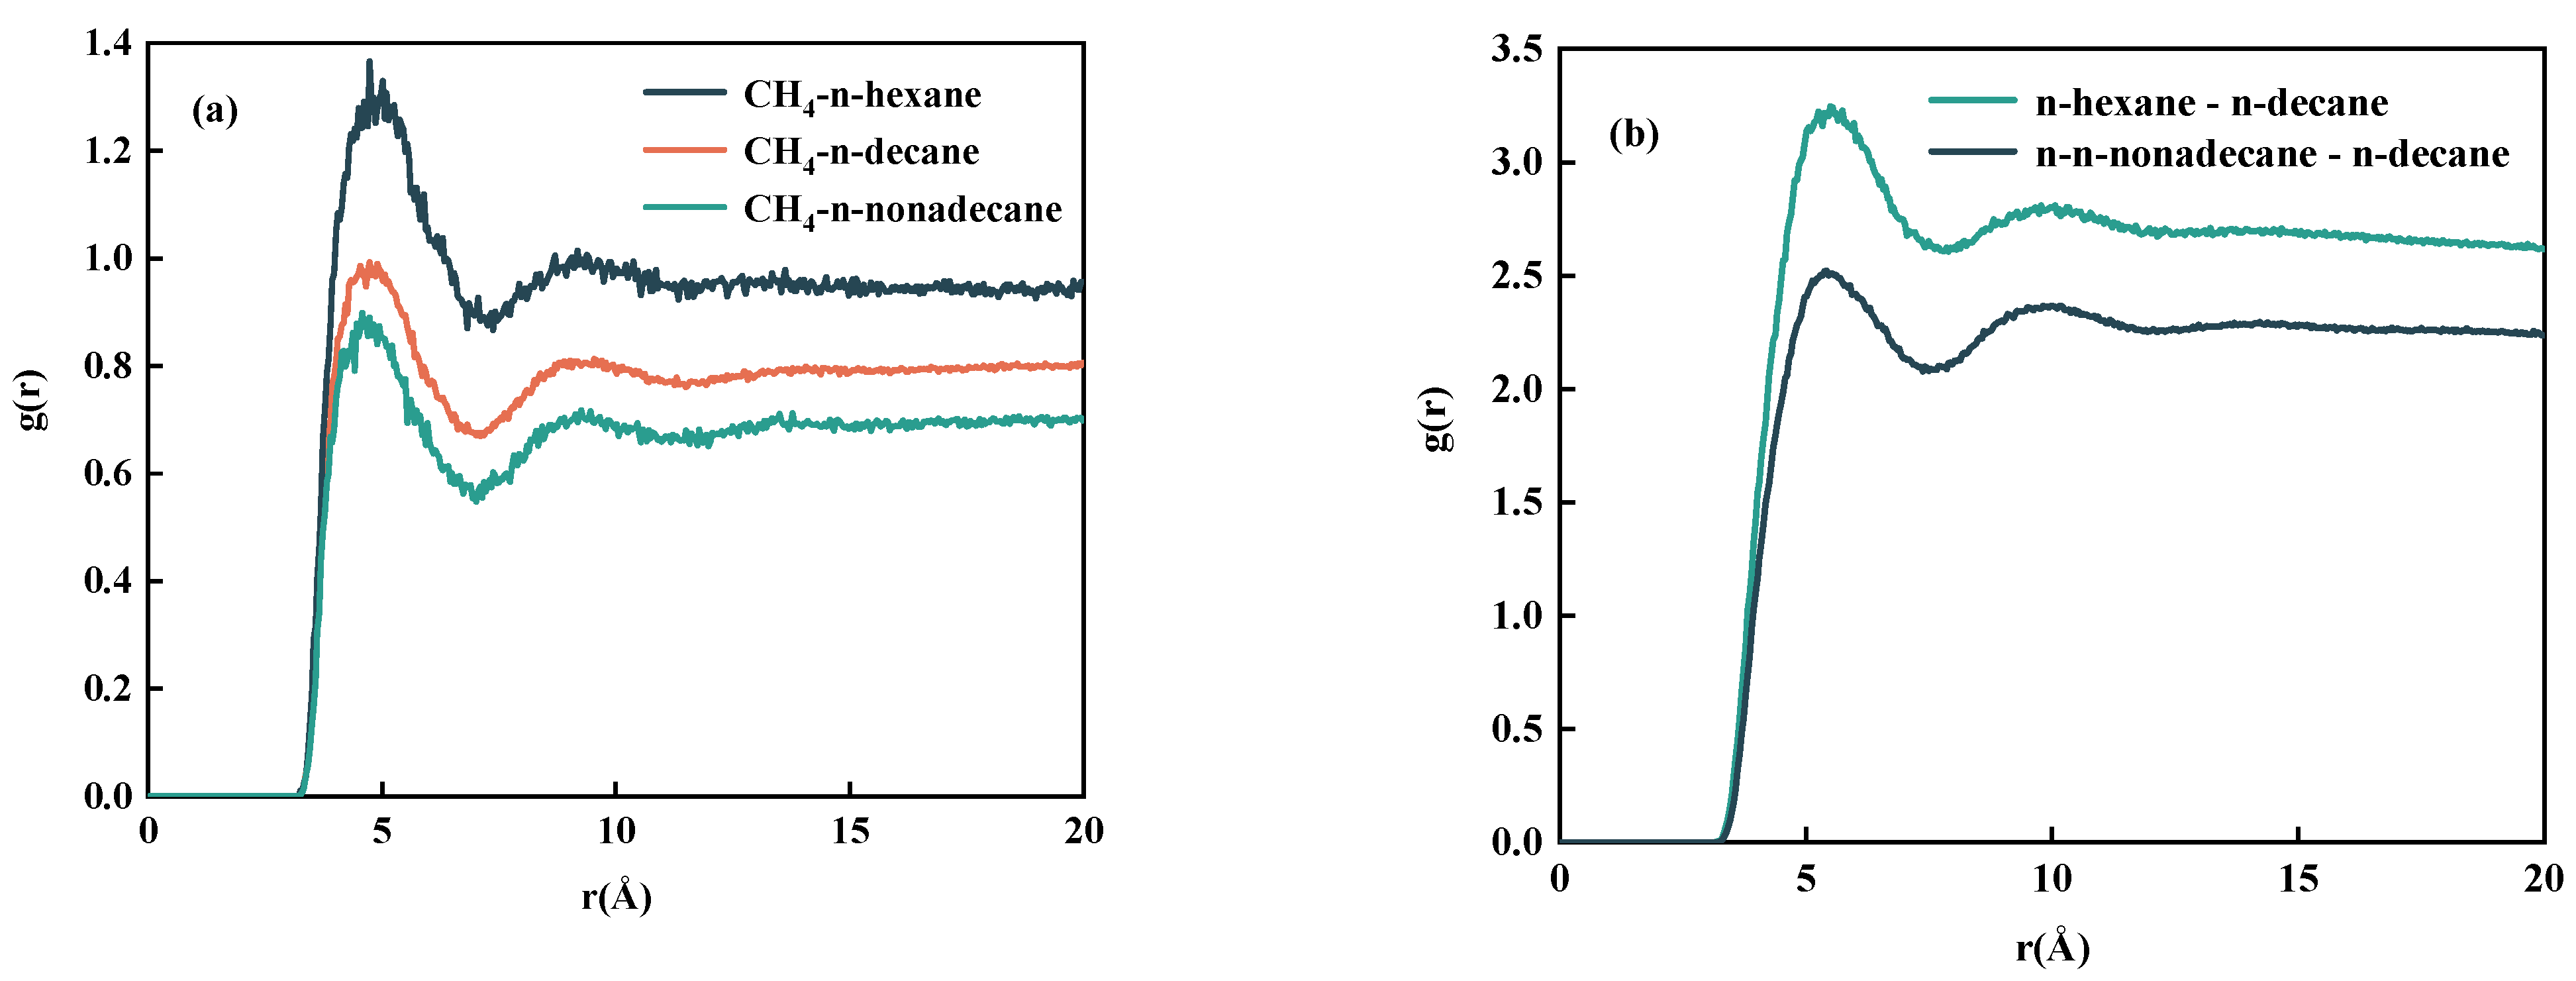
  • By studying the diffusion properties, it was discovered that CH4 can weak the interaction between n-decane, thereby increasing its diffusion ability. One significant finding is that the interaction between n-decane and CO2 is significantly more potent than that of CH4. Simultaneously, systems containing lighter components are more easily aggregated around CH4 and dissolved in CH4.

Author Contributions

Conceptualization, Z.D.; Methodology, X.M.; Software, X.M.; Validation, H.X.; Investigation, S.Q.; Data curation, X.M.; Writing—original draft, X.M.; Writing—review & editing, Z.D.; Visualization, Z.L.; Supervision, W.L.; Project administration, Z.W. and G.L. All authors have read and agreed to the published version of the manuscript.

Funding

This study was financially supported by the Xi’an Shiyou University Postgraduate Innovation and Practice Training Program (Project No. YCS21213159).

Institutional Review Board Statement

Not applicable.

Informed Consent Statement

Not applicable.

Data Availability Statement

Not applicable.

Conflicts of Interest

The authors declare no conflict of interest.

References

  1. Wankui, G.; Guangzhi, L. Gas Injection Enhanced Recovery Technology; Petroleum Industry Press: Beijing, China, 2003; pp. 2–7. [Google Scholar]
  2. Baidakov, V.G.; Khotienkova, M.N. Capillary constant and surface tension of propane (R-290) with helium dissolved in it. Int. J. Refrig. 2019, 98, 261–265. [Google Scholar] [CrossRef]
  3. Fukuta, M.; Sumiyama, J.; Motozawa, M.; Yanagisawa, T. Surface tension measurement of oil/refrigerant mixture by maximum bubble pressure method. Int. J. Refrig. 2017, 73, 125–133. [Google Scholar] [CrossRef]
  4. Fainerman, V.B.; Miller, R.; Joos, P. The measurement of dynamic surface tension by the maximum bubble pressure method. Colloid Polym. Sci. 1994, 272, 731–739. [Google Scholar] [CrossRef]
  5. Andreas, J.M.; Hauser, E.A.; Tucker, W.B. Boundary tension by pendant drops. J. Phys. Chem. 1938, 42, 1001–1019. [Google Scholar] [CrossRef]
  6. Wakayama, N.I. Effect of a decreasing magnetic field on the flow of nitrogen gas. Chem. Phys. Lett. 1991, 185, 449–451. [Google Scholar] [CrossRef]
  7. Chapela, G.A.; Martínez-Casas, S.E.; Varea, C. Square well orthobaric densities via spinodal decomposition. J. Chem. Phys. 1987, 86, 5683–5688. [Google Scholar] [CrossRef]
  8. Chapela, G.A.; Saville, G.; Thompson, S.M.; Rowlinson, J.S. Computer simulation of a gas–liquid surface. Part 1. J. Chem. Soc. Faraday Trans. 1977, 73, 1133–1144. [Google Scholar] [CrossRef]
  9. Nijmeijer, M.J.P.; Bakker, A.F.; Bruin, C.; Sikkenk, J.H. A molecular dynamics simulation of the Lennard-Jones liquid–vapor interface. J. Chem. Phys. 1988, 89, 3789–3792. [Google Scholar] [CrossRef]
  10. Thompson, S.M.; Gubbins, K.E.; Walton, J.P.R.B.; Chantry, R.A.R.; Rowlinson, J.S. A molecular dynamics study of liquid drops. J. Chem. Phys. 1984, 81, 530–542. [Google Scholar] [CrossRef]
  11. Mecke, M.; Winkelmann, J.; Fischer, J. Molecular dynamics simulation of the liquid-vapor interface: The Lennard-Jones fluid. J. Chem. Phys. 1997, 107, 9264–9270. [Google Scholar] [CrossRef]
  12. Bhansali, A.P.; Bayazitoglu, Y.; Maruyama, S. Molecular dynamics simulation of an evaporating sodium droplet. Int. J. Therm. Sci. 1999, 38, 66–74. [Google Scholar] [CrossRef]
  13. Trokhymchuk, A.; Alejandre, J. Computer simulations of liquid/vapor interface in Lennard-Jones fluids: Some questions and answers. J. Chem. Phys. 1999, 111, 8510–8523. [Google Scholar] [CrossRef]
  14. Mecke, M.; Winkelmann, J.; Fischer, J. Molecular dynamics simulation of the liquid-vapor interface: Binary mixtures of Lennard-Jones fluids. J. Chem. Phys. 1999, 110, 1188–1194. [Google Scholar] [CrossRef]
  15. Frezzotti, A. Boundary conditions at the vapor-liquid interface. Phys. Fluids 2011, 23, 030609. [Google Scholar] [CrossRef]
  16. Chilukoti, H.K.; Kikugawa, G.; Ohara, T. A molecular dynamics study on transport properties and structure at the liquid-vapor interfaces of alkanes. Int. J. Heat Mass Tran. 2013, 59, 144–154. [Google Scholar] [CrossRef]
  17. Weinaug, C.F.; Katz, D.L. Surface Tensions of Methane-Propane Mixtures. Ind. Eng. Chem. 1943, 35, 239–246. [Google Scholar] [CrossRef]
  18. Amin, R.; Smith, T.N. Interfacial tension and spreading coefficient under reservoir conditions. Fluid Phase Equilibria 1998, 142, 231–241. [Google Scholar] [CrossRef]
  19. Miqueu, C.; Mendiboure, B.; Graciaa, C.; Lachaise, J. Modeling of the surface tension of binary and ternary mixtures with the gradient theory of fluid interfaces. Fluid Phase Equilibria 2004, 218, 189–203. [Google Scholar] [CrossRef]
  20. Ramírez-Verduzco, L.F.; Romero-Martínez, A.; Trejo, A. Prediction of the surface tension, surface concentration, and the relative Gibbs adsorption isotherm of binary liquid systems. Fluid Phase Equilibria 2006, 246, 119–130. [Google Scholar] [CrossRef]
  21. Pereira, L.M.C.; Chapoy, A.; Burgass, R.; Tohidi, B. Measurement and modeling of high pressure density and interfacial tension of (gas + n -alkane) binary mixtures. J. Chem. Thermodyn. 2016, 97, 55–69. [Google Scholar] [CrossRef]
  22. Choudhary, N.; Narayanan Nair, A.K.; Che Ruslan, M.F.A.; Sun, S. Bulk and interfacial properties of decane in the presence of carbon dioxide, methane, and their mixture. Sci. Rep. 2019, 9, 19784. [Google Scholar] [CrossRef] [PubMed] [Green Version]
  23. Klein, T.; Lenahan, F.D.; Kerscher, M.; Jander, J.H.; Rausch, M.H.; Koller, T.M. Viscosity and Interfacial Tension of Binary Mixtures of n-Hexadecane with Dissolved Gases Using Surface Light Scattering and Equilibrium Molecular Dynamics Simulations. J. Chem. Eng. Data 2021, 66, 3205–3218. [Google Scholar] [CrossRef]
  24. De Lara, L.S.; Michelon, M.F.; Miranda, C.R. Molecular Dynamics Studies of Fluid/Oil Interfaces for Improved Oil Recovery Processes. J. Phys. Chem. B 2012, 116, 14667–14676. [Google Scholar] [CrossRef] [PubMed]
  25. Plimpton, S. Fast Parallel Algorithms for Short-Range Molecular Dynamics. J. Comput. Phys. 1995, 117, 1–19. [Google Scholar] [CrossRef] [Green Version]
  26. Nath, S.K.; Escobedo, F.A.; de Pablo, J.J. On the simulation of vapor-liquid equilibria for alkanes. J. Chem. Phys. 1998, 108, 9905–9911. [Google Scholar] [CrossRef]
  27. Martin, M.G.; Siepmann, J.I. Transferable Potentials for Phase Equilibria. 1. United-Atom Description of n-Alkanes. J. Phys. Chem. B 1998, 102, 2569–2577. [Google Scholar] [CrossRef]
  28. Zhu, A.; Zhang, X.; Liu, Q.; Zhang, Q. A Fully Flexible Potential Model for Carbon Dioxide. Chin. J. Chem. Eng. 2009, 17, 268–272. [Google Scholar]
  29. Stanishneva-Konovalova, T.B.; Sokolova, O.S. Molecular dynamics simulations of negatively charged DPPC/DPPI lipid bilayers at two levels of resolution. Comput. Theor. Chem. 2015, 1058, 61–66. [Google Scholar] [CrossRef]
  30. Stukowski, A. Visualization and analysis of atomistic simulation data with OVITO–the Open Visualization Tool. Model. Simul. Mater. Sci. Eng. 2010, 18, 015012. [Google Scholar] [CrossRef]
  31. Hoover, W.G.; Ladd, A.J.C.; Moran, B. High-Strain-Rate Plastic Flow Studied via Nonequilibrium Molecular Dynamics. Phys. Rev. Lett. 1982, 48, 1818–1820. [Google Scholar] [CrossRef]
  32. Nosé, S. A unified formulation of the constant temperature molecular dynamics methods. J. Chem. Phys. 1984, 81, 511–519. [Google Scholar] [CrossRef]
  33. Pollock, E.L.; Glosli, J. Comments on P3M, FMM, and the Ewald method for large periodic Coulombic systems. Comput. Phys. Commun. 1996, 95, 93–110. [Google Scholar] [CrossRef] [Green Version]
  34. Müller, E.A.; Mejía, A. Interfacial properties of selected binary mixtures containing n-alkanes. Fluid Phase Equilibria 2009, 282, 68–81. [Google Scholar] [CrossRef] [Green Version]
  35. Bresme, F.; Chacón, E.; Tarazona, P.; Tay, K. Intrinsic Structure of Hydrophobic Surfaces: The Oil-Water Interface. Phys. Rev. Lett. 2008, 101, 056102. [Google Scholar] [CrossRef] [Green Version]
  36. Bresme, F.; Chacón, E.; Tarazona, P. Force-field dependence on the interfacial structure of oil–water interfaces. Mol. Phys. 2010, 108, 1887–1898. [Google Scholar] [CrossRef]
  37. Zhang, Y.; Feller, S.E.; Brooks, B.R.; Pastor, R.W. Computer simulation of liquid/liquid interfaces. I. Theory and application to octane/water. J. Chem. Phys. 1995, 103, 10252–10266. [Google Scholar] [CrossRef]
  38. Smith, F.T. Atomic Distortion and the Combining Rule for Repulsive Potentials. Phys. Rev. A 1972, 5, 1708–1713. [Google Scholar] [CrossRef]
  39. Mo, Z.; Zhu, X.; Wang, G.; Han, W.; Guo, R. Molecular dynamics simulation on the interaction between single-walled carbon nanotubes and binaphthyl core-based chiral phenylene dendrimers. J. Mater. Res. 2014, 29, 2156–2161. [Google Scholar] [CrossRef]
Figure 1. Gas–oil phase simulation systems: (a) CH4 + n-decane binary mixture system, (b) CH4 + CO2 + n-decane ternary mixed system.
Applsci 12 12239 g001
Figure 2. Snapshot of the equilibrium state of CH4 + n-decane at 313.3 K.
Applsci 12 12239 g002
Figure 3. Number density distribution of CH4/n-decane at different pressures at 313.3 K. (The # symbol in the unit represents the number of molecules).
Applsci 12 12239 g003
Figure 4. Number density distribution of CH4/n-decane at different temperatures at 20.12 MPa. (The # symbol in the unit represents the number of molecules).
Applsci 12 12239 g004
Figure 5. Number density distribution of CH4/n-decane before and after CO2 injection at 313.3 K, 11.14 MPa. (The # symbol in the unit represents the number of molecules).
Applsci 12 12239 g005
Figure 6. Number density distribution of CH4/CO2/n-decane at 313.3 K,11.14 MPa. (The # symbol in the unit represents the number of molecules).
Applsci 12 12239 g006
Figure 7. IFT of CH4/n-decane at different temperatures. The solid symbols represent the results from the MD simulations, experimental results of Pereira [13] are shown as open symbols, and the plus sign indicates the results of MD simulations by Choudhary et al. [22].
Applsci 12 12239 g007
Figure 8. IFT of CH4/n-decane before and after CO2 injection at 313.3 K.
Applsci 12 12239 g008
Figure 9. IFT of different component systems at 313.3 K.
Applsci 12 12239 g009
Figure 10. MSD of n-decane/CH4 at different pressures at 313.3 K. (a) N-decane; (b) CH4.
Applsci 12 12239 g010
Figure 11. Radial distribution function of n-decane/CH4 (313.3K). (a) N-decane-n-decane; (b) n-decane-CH4.
Applsci 12 12239 g011
Figure 12. Radial distribution function between n-decane-CH4 and n-decane-CO2. in the system at 313.3 K, 11.14 MPa.
Applsci 12 12239 g012
Figure 13. Radial distribution function of different component systems at 313.3 K, 5.2 MPa. (a) CH4-n-hexane, CH4-n-decane, CH4-n-nonadecane; (b) n-decane-n-hexane, n-decane-n-nonadecane.
Applsci 12 12239 g013
Table 1. Parameters for non-bonded interactions.
MolecularAtomσ (nm)εij (KJ·mol−1)qi (e)Model
n-decaneC(CH3)0.39100.86470NERD [26]
C(CH2)0.39300.38080
CH4C(CH4)0.37301.23000TraPPE-UA [27]
CO2C0.28000.23397+0.6512ZHU [28]
O0.30280.66824−0.3256
Table 2. Parameters for bonded interactions.
Stretchr0 (nm) k i j b (KJ·mol−1·nm−2)
CHx-CHy0.154080,235.028
C-O0.116260,000
Bendθ0 (°) k θ (KJ·mol−1·rad−2)
CHx-CH2-CHy114.0519.657
O-C-O180110
TorsionV0 (KJ·mol−1)V1 (KJ·mol−1)V2 (KJ·mol−1)V3 (KJ·mol−1)
CHx-CH2-CH2-CHy05.9038−1.133913.159
Note: x = 2 or 3, y = 2 or 3.
Publisher’s Note: MDPI stays neutral with regard to jurisdictional claims in published maps and institutional affiliations.

