Article

Experimental Study on Torsional Shear Testing of Asphalt Mixture

1
School of Transportation and Logistics, Dalian University of Technology, Dalian 116024, China
2
Department of Road and Bridge Engineering, Liaoning Provincial College of Communications, Shenyang 110122, China
3
The Key Laboratory of Road and Traffic Engineering, Ministry of Education, Tongji University, 4800 Cao’an Road, Shanghai 201804, China
4
School of Civil Engineering, Shenyang Jianzhu University, Shenyang 110168, China
*
Author to whom correspondence should be addressed.
Appl. Sci. 2022, 12(23), 12242; https://doi.org/10.3390/app122312242
Submission received: 12 October 2022 / Revised: 26 November 2022 / Accepted: 27 November 2022 / Published: 29 November 2022
(This article belongs to the Special Issue Advanced Technologies in Asphalt Materials)

Abstract

:
In order to research investigations on the shear behavior of asphalt mixture, a new shear testing device is developed which can apply torque to a prismatic specimen. This test configuration incorporates a loading application and instrumentation systems to measure and record the response of these mixtures. The loading application can be subjected to individual or combined axial and torsional loads; in particular, the axial load can be dynamically controlled to remain constant. The paper first uses the mechanical theory to analyze the stress state of a prismatic specimen under a torsional load in unconfined compression and confined compression, respectively, and illustrates the influence factor, the shear strength parameter, and the failure criterion for the torsional shear test of the asphalt mixture. Then, the size and the preparation procedure of specimen are explained, and the experimental plan is described. Finally, the torsional shear test apparatus is used to conduct two types of shear tests of asphalt mixtures. The type I test in unconfined compression consists of two conditions: under a constant loading speed (2.4 rad/min) at four temperatures (30 C, 40 C, 50 C, and 60 C), and under a constant temperature (40 C) at three loading speeds (2.4 rad/min, 4.0 rad/min, and 8.5 rad/min). The type II test in confined compression is performed under a loading speed of 2.4 rad/min and a temperature of 40 C, at 0.125 MPa, 0.200 MPa, 0.355 MPa, 0.465 MPa, and 0.570 MPa normal stress levels, respectively. The results prove that (1) temperatures, loading speeds, and normal stress levels are the issues to be considered on torsional shear testing; (2) the pure shear model can be realized by the prismatic specimen, therefore, the cohesion average value obtained is 0.519 MPa; (3) the compression-shear model can be achieved by the prismatic specimen similarly, so the cohesion and the friction angle are simulated based on the Mohr–Coulomb failure criterion, which are 0.546 MPa and 44.15°, respectively; and (4) at the high temperature and low normal stress level, the Mohr–Coulomb failure criterion does not agree well with measured data, so the nonlinear failure envelope should not be ignored.

1. Introduction

Under a moving wheel load on pavement, the tire–pavement contact stress is in complex stress conditions [1]. The pavement surface is subjected to three-dimensional stress conditions, including vertical normal stress, longitudinal shear stress, and horizontal shear stress. During braking and turning, the shear stress exerted by wheels is more significant [2]. Research has shown that it is sufficient to accurately characterize the mechanical behavior of an asphalt mixture under three-dimensional stress for pavement response prediction and pavement design.
At present, the shear test of asphalt mixtures mainly includes direct/indirect shear test, uniaxial shear test, triaxial compression test, and torsional shear test.
The direct shear test is the compressional shear test in which a horizontal load is applied to the specimen in an unconfined compression load. The indirect shear test uses the inclined shear fixture to generate a certain angle between the specimen and the vertical axial force direction and to conduct the shear test by axial loads. The direct/indirect shear test has been widely used in the study of the interlayer shear performance of pavement structure (including the base course). The instruments and equipment adopted include self-developed equipment, improved geotechnical direct shear instrument, and fixture design on MTS or UTM. Superpave Shear Tester (SST), one of the testing device results of the Strategic Highway Research Program (SHRP) study, has been further improved based on the principle of a direct shear test by adding vertical dynamic loads, pressure, and temperature control. This testing device is capable of using both static and dynamic loadings in confined and unconfined conditions.
The uniaxial shear test uses the Material Testing machine (MTS) or the Universal Testing Machine (UTM) with a servocontrol system to conduct static shear strength test and repeat shear test on a cylinder or hollow cylinder. In the cylinder uniaxial shear test or uniaxial penetration test, a stainless-steel indenter of a certain size is inserted into a cylindrical specimen to obtain the cohesion and the angle of internal friction from the measured penetration strength [3]. In the hollow cylinder uniaxial shear test, a hollow cylindrical specimen with limited inner and outer sides is adopted, and an axial load is applied to the inner wall of the specimen to achieve shear failure [4].
The triaxial compression test is a classic test to investigate the shear performance of asphalt mixtures, which can control the temperatures, internal and external pressures, and loading speeds. By applying axial and radial compression loads, the Mohr circle is obtained, and the cohesion and the angle of internal friction are calculated according to the Mohr–Coulomb criterion to obtain the shear strength of the material.
The torsional shear test applies torsion loads on the specimen; it was used in early research to study the plastic yield of metal materials. In 1986, Sousa [5] at the University of California, Berkeley, USA, designed and constructed a hollow cylinder test to first develop the dynamic shear performance of the asphalt concrete under torsion loads. There were two forms of torsion test of the asphalt mixture: laboratory test and in situ test. Zahw [6] applied torsion loads through laboratory test equipment to measure the shear characteristics of pavement specimens. Abd [7] designed the CISST, which directly measured the in situ shear characteristics of asphalt concrete. Goodman [8] extended the idea of applying torsion on the pavement surface and developed InSiSST to obtain the pure shear stress. In 2009, ASTM International published the DSR test method (ASTM D7552) [9] for the dynamic shear rheological test of asphalt mixtures, which could conduct dynamic shear modulus test and torsion creep test of asphalt mixtures, among other tests. Li Yuhua [10] developed a torsional shear piece of equipment, which could conduct compression torsion failure test and creep test for asphalt or an asphalt mixture. Ragnia [11] applied shear–torque tests to assess the fatigue behavior of double-layered asphalt specimens.
In addition, on the basis of a torsional shear test, a triaxial compression load control system was added to form a torsional shear triaxial test. The different internal and external pressures being applied to a hollow cylinder in the test used a four-way loading system simultaneously or individually, which was an ideal test to study the development of the influence of intrinsic anisotropy and stress path correlation of asphalt mixtures. Over years of experimental research at the University of Nottingham to simulate the stress condition of a pavement surface under a moving vehicle, the authors in [12] have implemented a wide range of stress path tests using multiobjective apparatus for measuring the comprehensive mechanical properties of asphalt mixtures.
Overall, the characteristics of the proposed torsional shear stress of the torsion test compared with other tests are as follows: (1) The pure shear state is obtained in the torsional shear test in unconfined compression. (2) The normal stress of cross sections is uniform in the torsional shear test under confined compression. (3) The mechanical theory of torsional shear tests can be used in the in-situ test to evaluate the shear strength and the permanent deformation of the pavement.

2. The Torsional Shear Testing Device and the Specimen Size

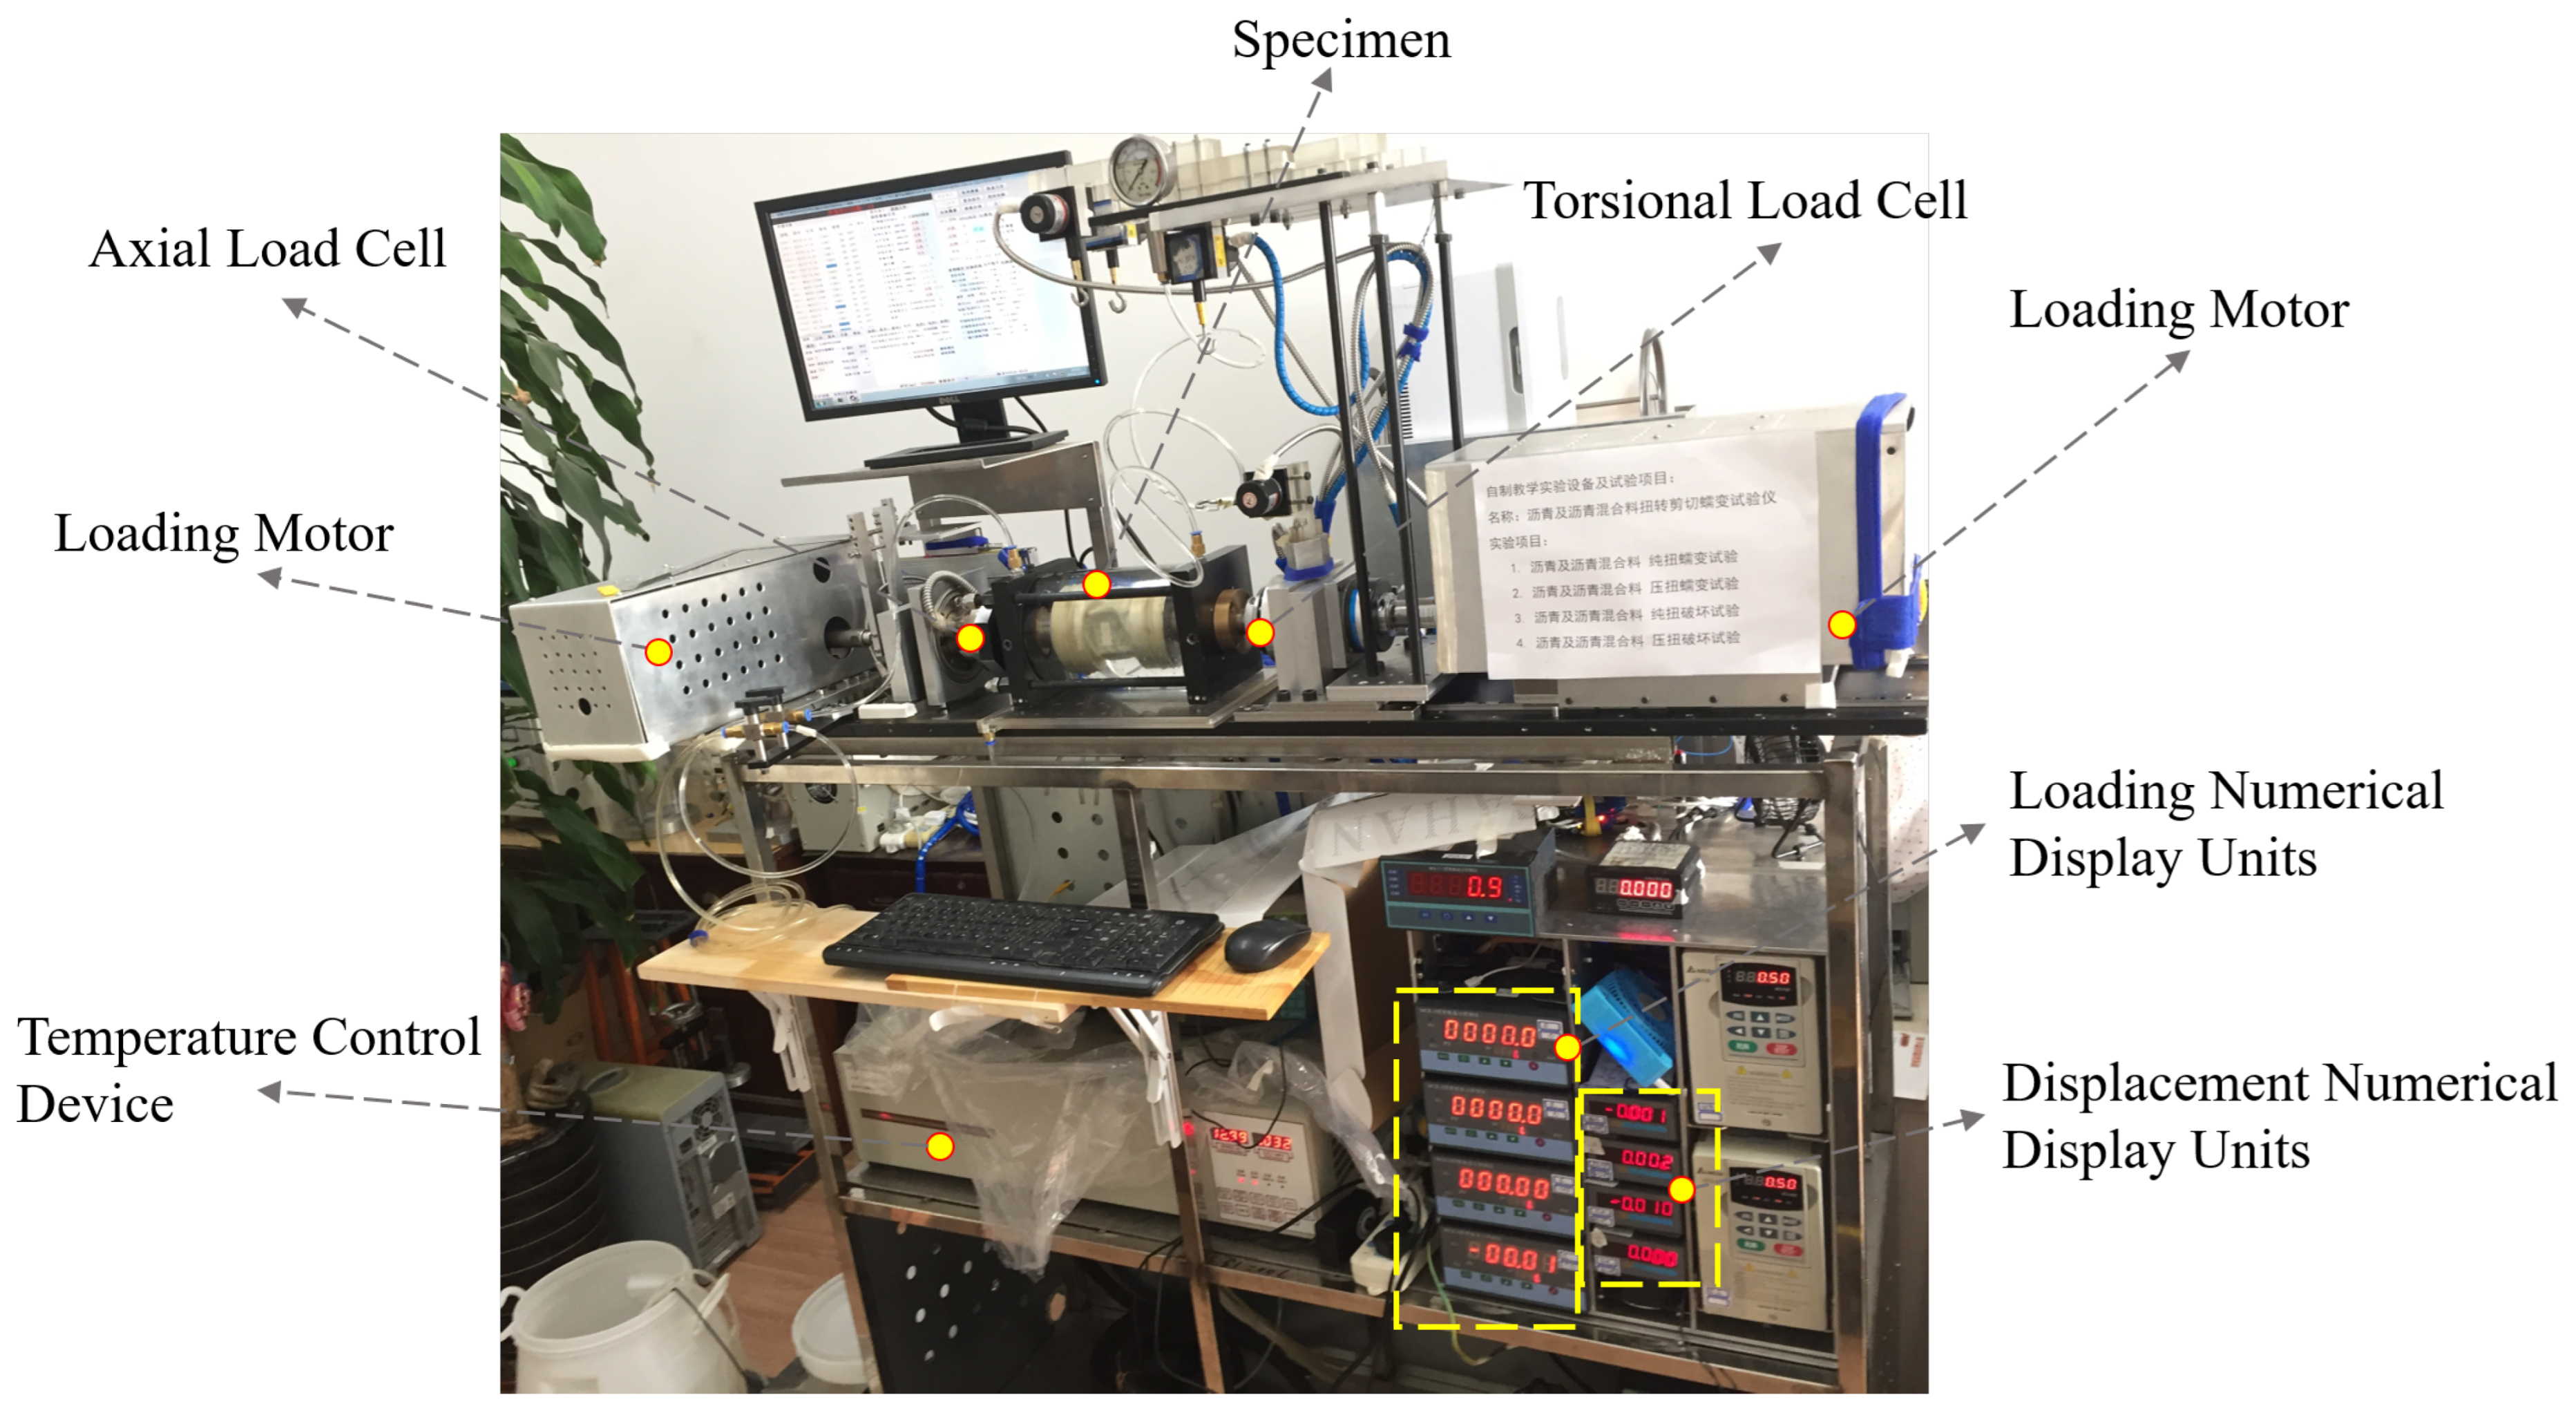
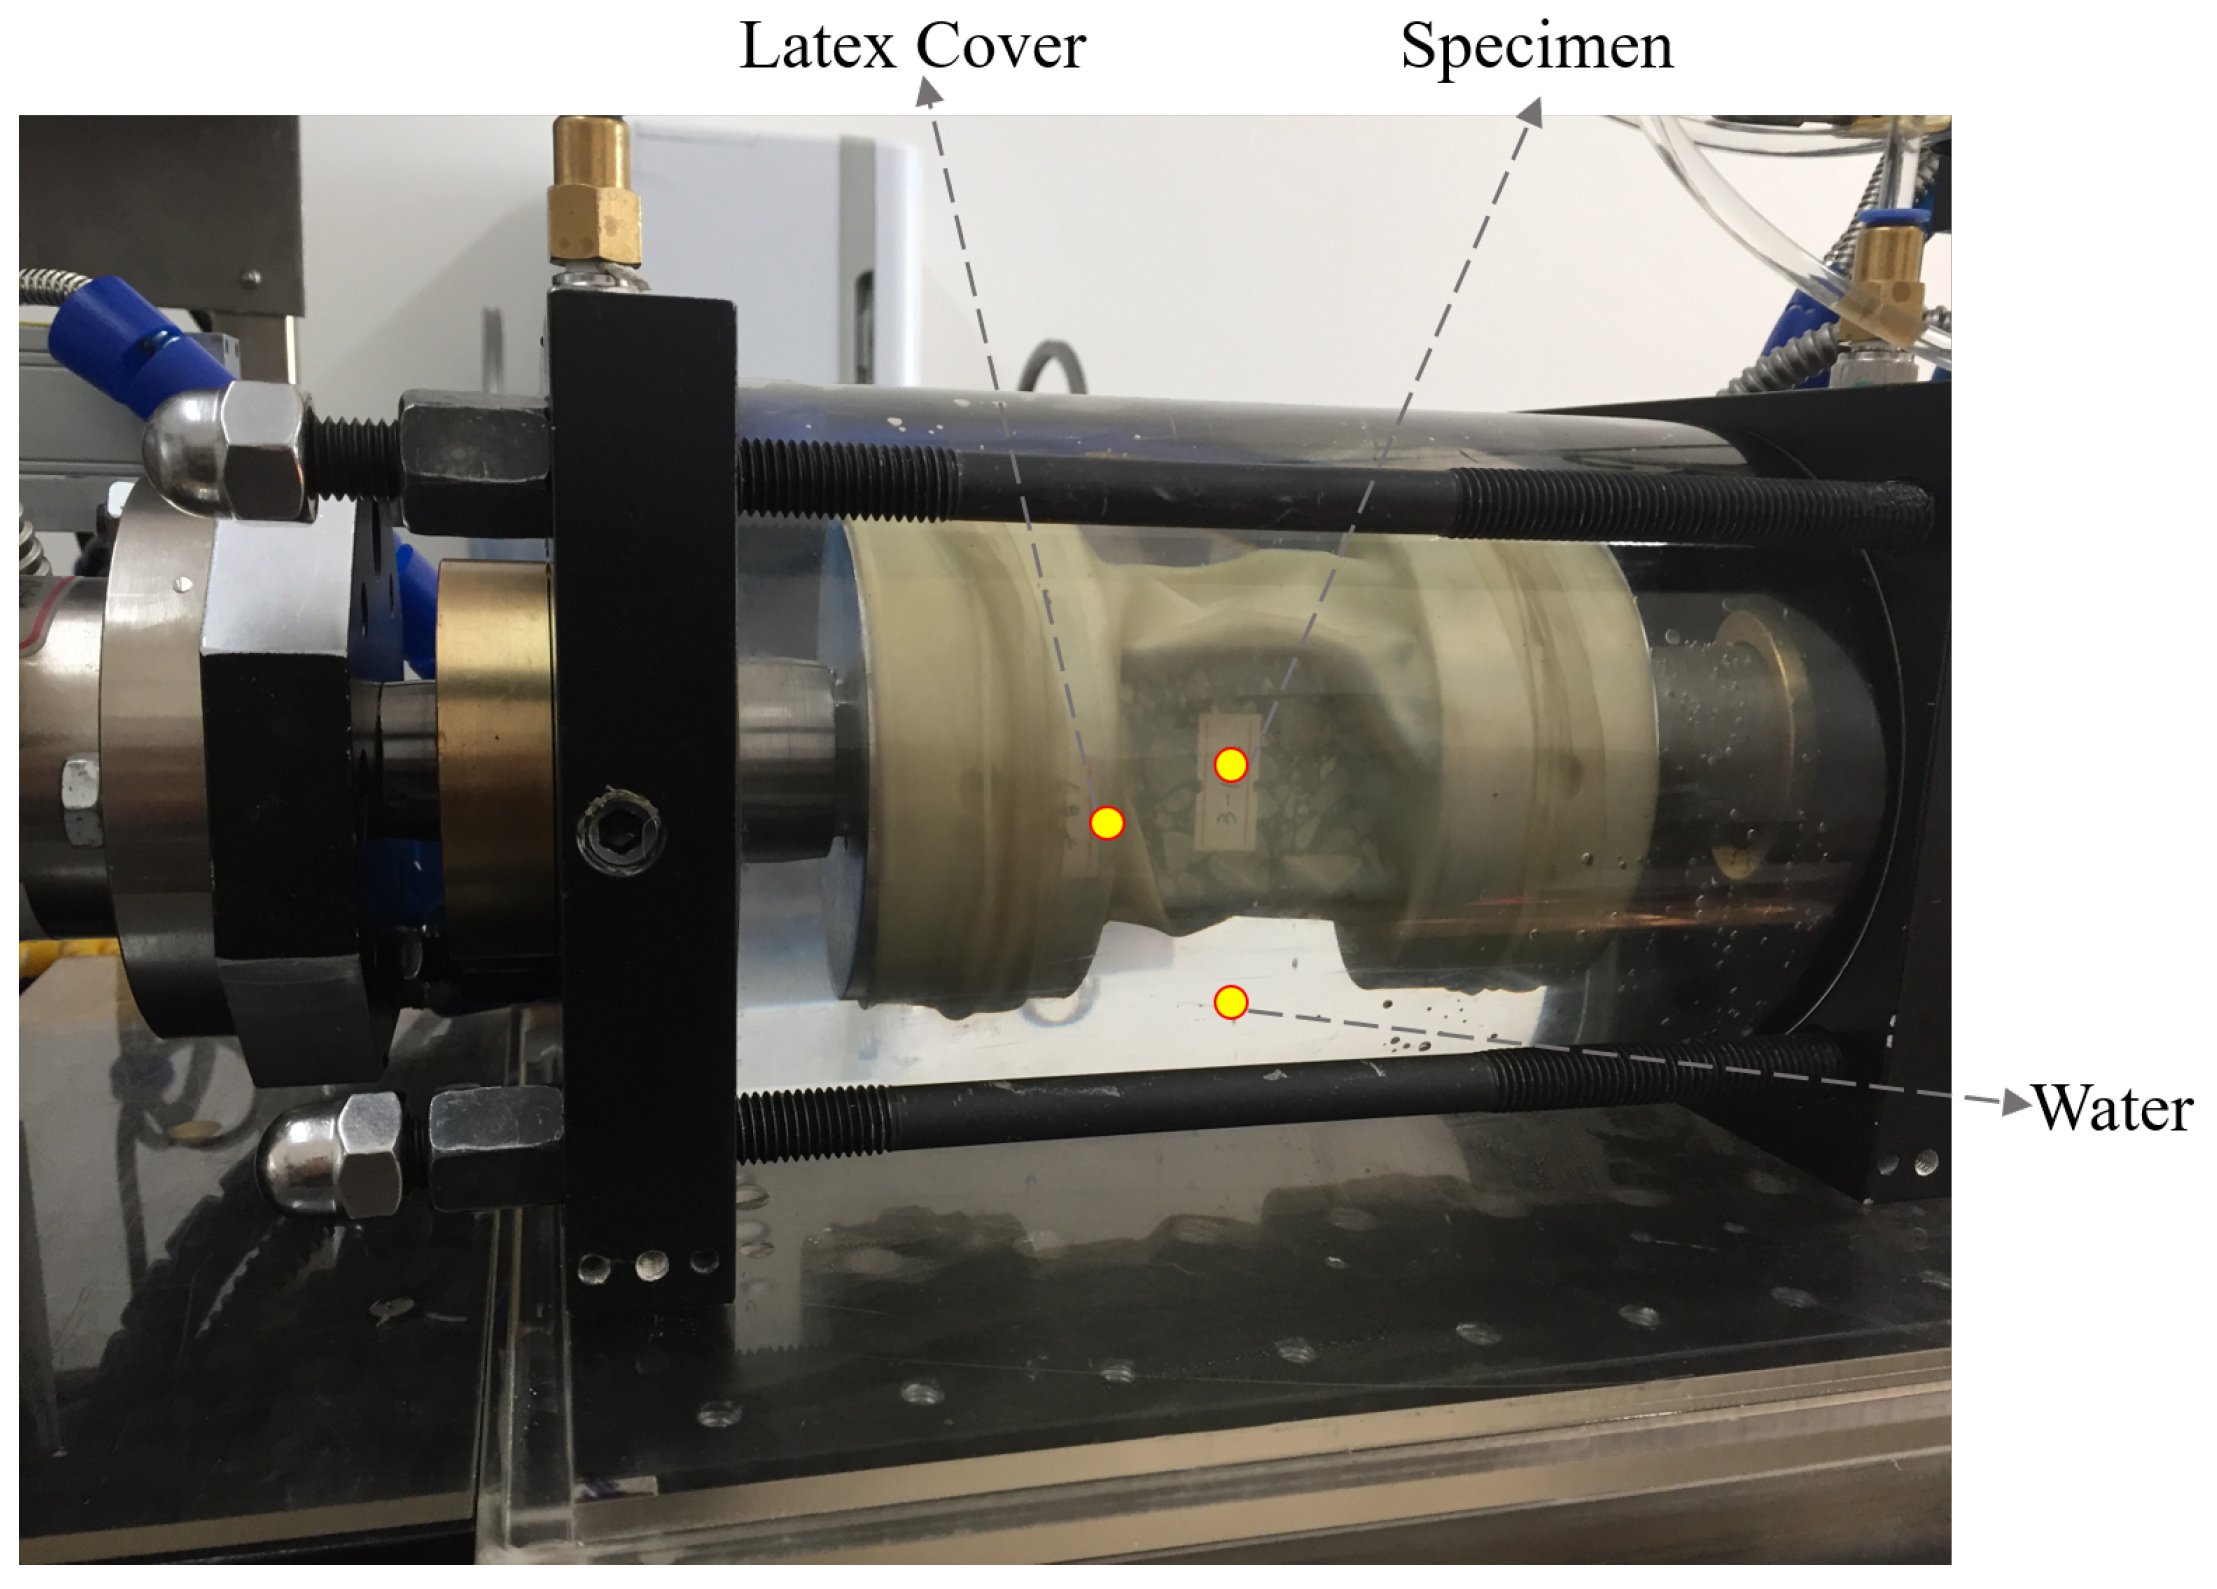
2.1. The Torsional Shear Testing Device

Based on an apparatus to evaluate shear properties of asphalt mixtures developed by Li Yuhua at the Dalian University of Technology in 2006, the torsional shear testing device was improved as shown in Figure 1. This apparatus is able to apply axial and torsional loads simultaneously or independently on the asphalt mixture’s prismatic specimen at high temperature. The maximum axial and torsional loads are 2000 N and 100 N·m, respectively. In order to obtain their corresponding calibration constants, the horizontal and radial deformations are measured by using two displacement sensors, respectively. The measuring range of these sensors is between 0 and 50 mm with a resolution of 0.01 mm.

2.2. The Option of Specimen Size

As the size of the specimen depends on the size of the aggregate particle, and the end effects of the specimen are considered to be of such importance, the specimen’s geometry is related to the measurement of the deformation and stress of the material.
The majority wall thickness criterion was established in an earlier experiment in soil materials research, where the magnitude of the wall thickness was related to the size of the aggregate particle. Saada [13] suggested that the minimum specimen cross section was 10 to 25 times the average sized aggregate. According to Japanese standards for laboratory shear tests using hollow cylinders, the minimum wall thickness is 5 times the maximum-sized aggregate when well-graded samples are used [14]. However, the soil specimen achieves this wall thickness criterion simply, as the asphalt mixture differs from the soil when the sized aggregate is excessively large. The height of the specimen must be large enough to minimize the end effects. Lade [15] demonstrated that the influence of the specimen height in a torsional shear test is negligible when the height is 4 times the average of the radius. Saada [13] revealed the height was negligible when it was is 1.5 or more times the average of the radius, since the increases in the precision of the gauge stress was not obvious.
As asphalt mixtures are different than soils and granular materials, initial experimental work to apply torsional loads selected cylinder specimens which were glued into end platens by using a binder such as epoxy resin. The results revealed that the mordanting area was dependent on the bonding strength and increased as the binder increased. Most test specimens subjected to axial symmetry loads were damaged at the end platen and this did not accurately trace the theoretical failure position. The specimens were under an additional confined boundary deformation since the influence of the bonding force could not be ignored.
According to the American standards of bituminous mixtures for repeated torsional shear tests using a dynamic shear rheometer (ASTM D7552) [9] on prismatic specimens with a geometry of 50 mm in height and a sectional size of 10 mm × 12 mm, and according tot the Chinese standard test methods of bituminous mixtures [16] for uniaxial compression tests (T 0714) using a prismatic specimen with a geometry of 80 mm in height, with both side lengths of 40 mm, this paper used prismatic test specimens with a particular jig and fixture on the loading platens which clamped the specimen ends. The prismatic test specimens of AC13 used were 40 mm for the side length for a maximum nominal aggregate size ratio of 3, and used a height of 120 mm, which was 3 times the side length.

3. The Mechanical Theory of Torsional Shear Tests

An asphalt mixture is a viscoelastic–viscoplastic material which mainly depends on the temperature and strain of loading. The behavior of asphalt mixtures at low temperature under very small strain conditions is primarily linear viscoelastic, but at high temperature under large strain conditions, it is significantly viscoplastic [17]. According to the elastic–viscoelastic correspondence principle, and the assumptions that the material is homogeneous and isotropic, the general viscoelastic solution can be obtained from the corresponding elastic solution and the time factor [17]. The material was considered linear elastic based on the assumption that the loading time was less than the relaxation time.

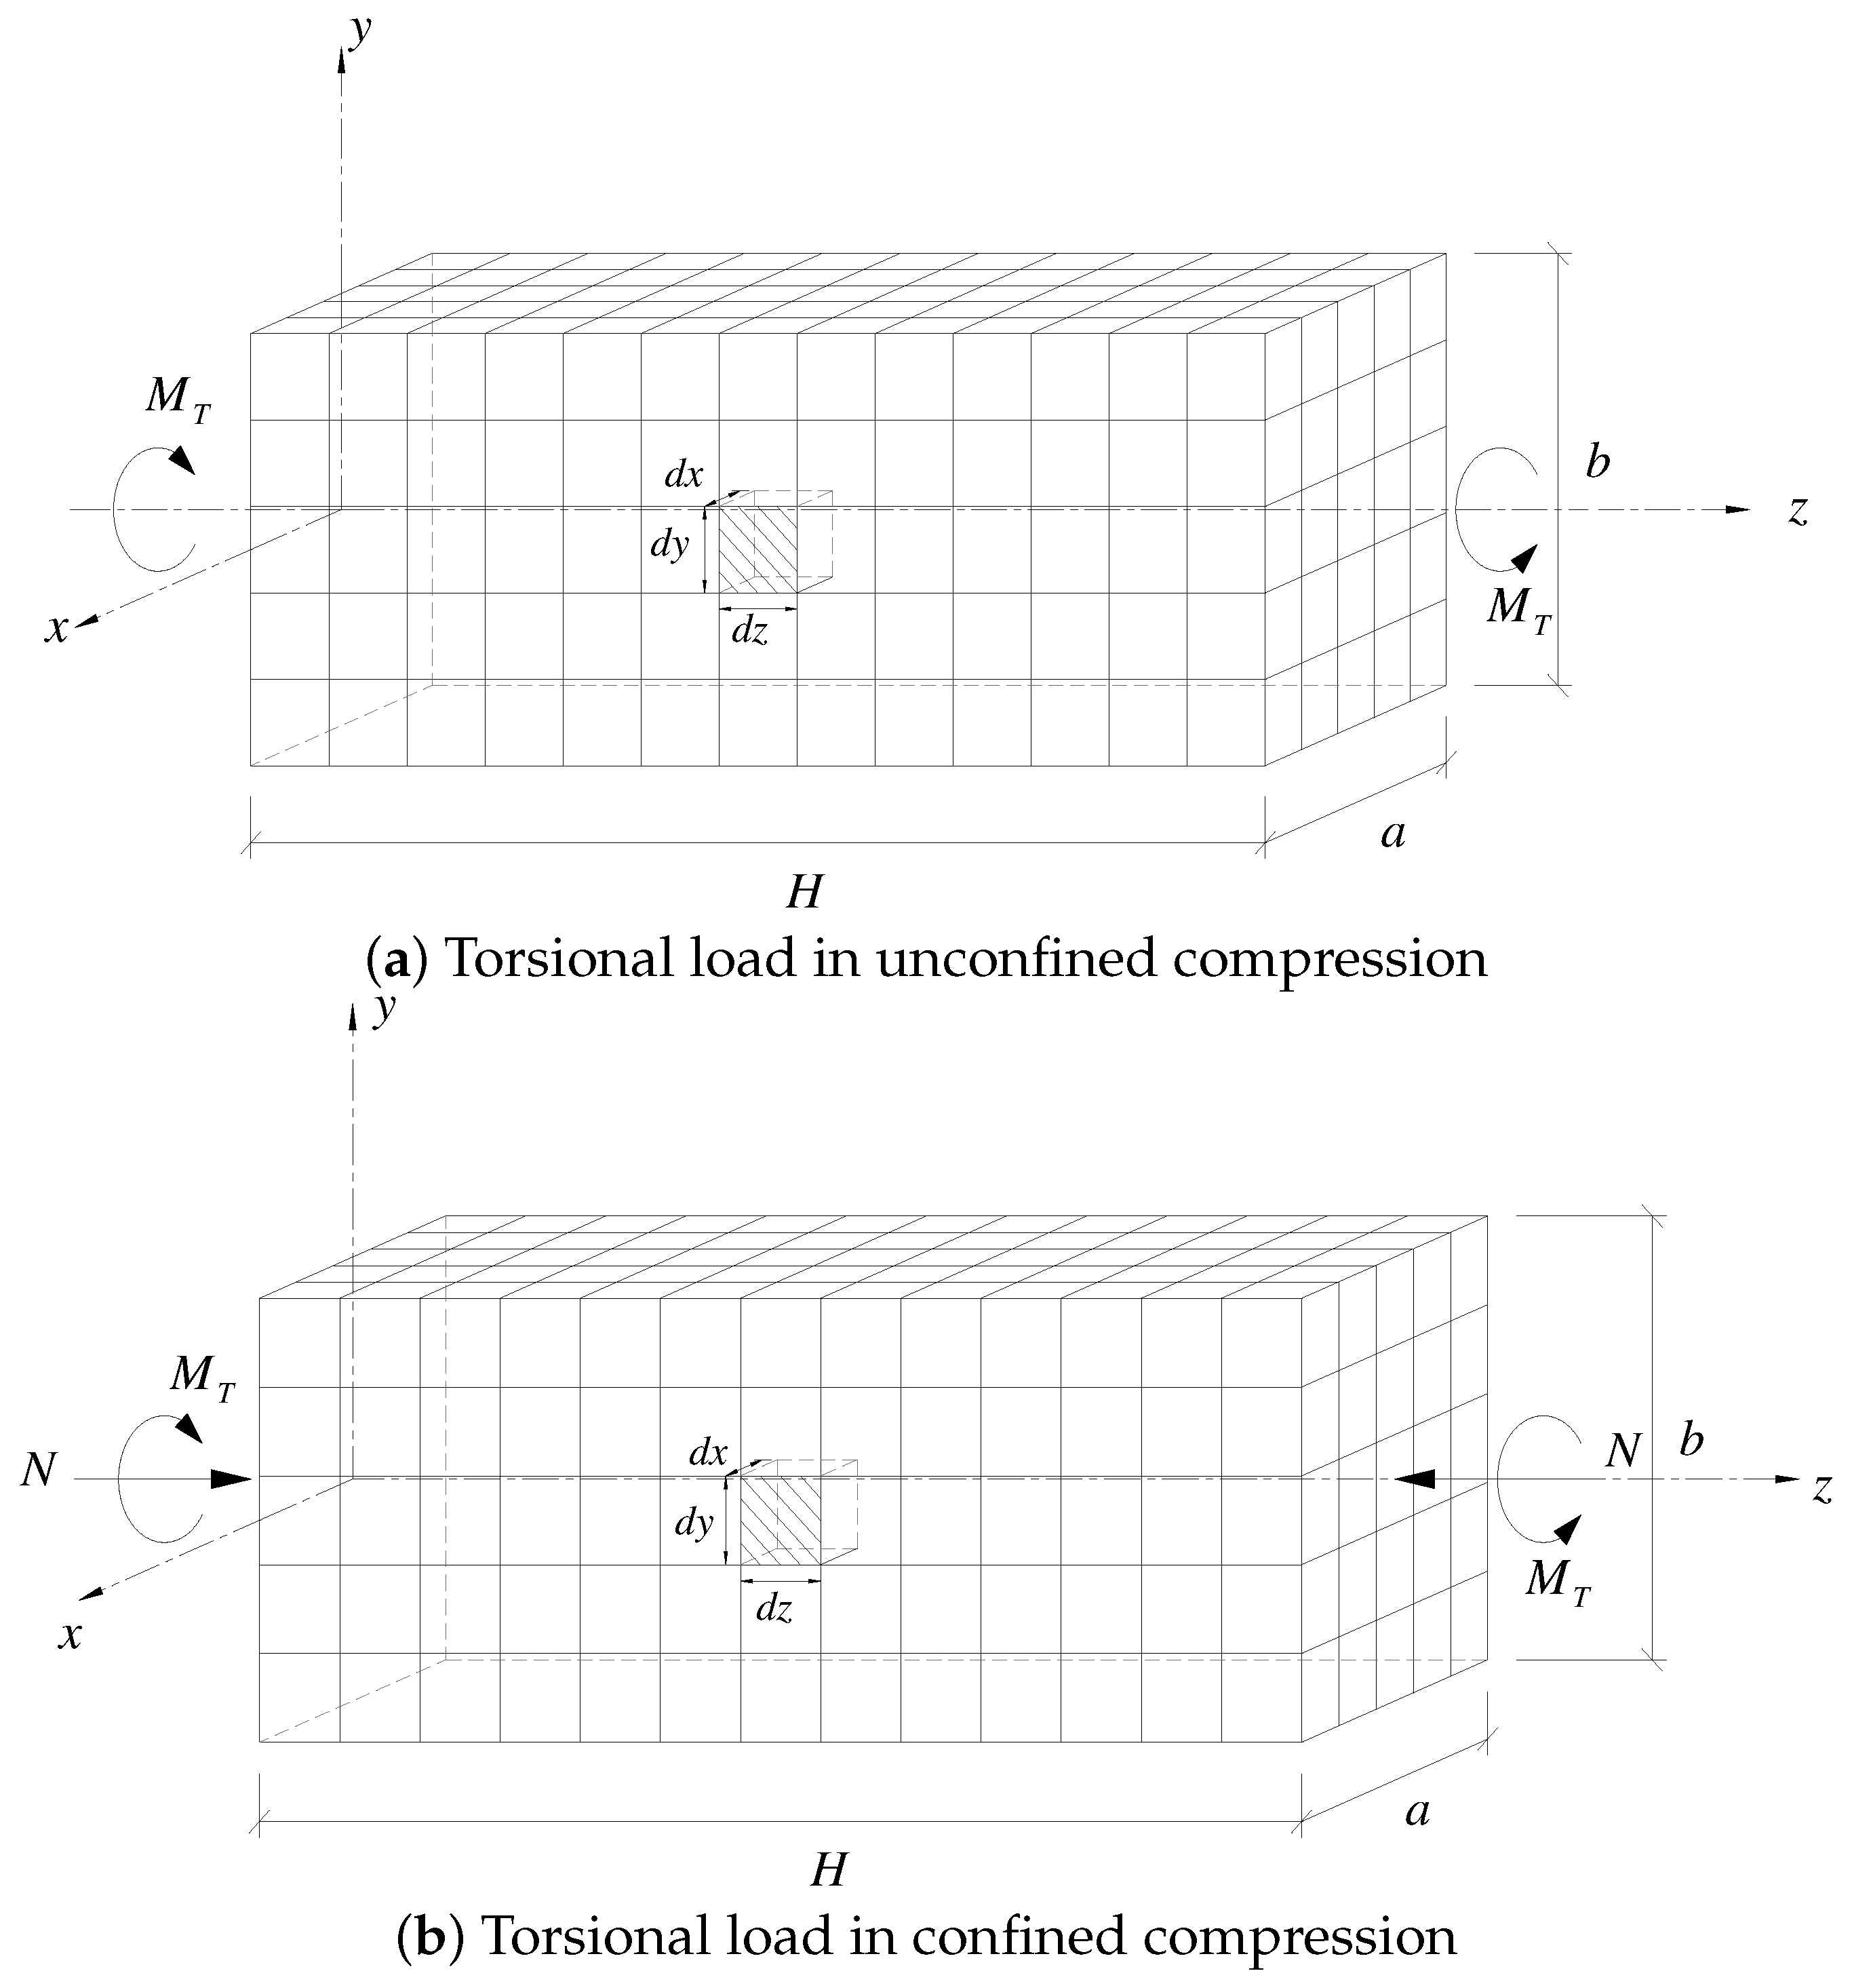
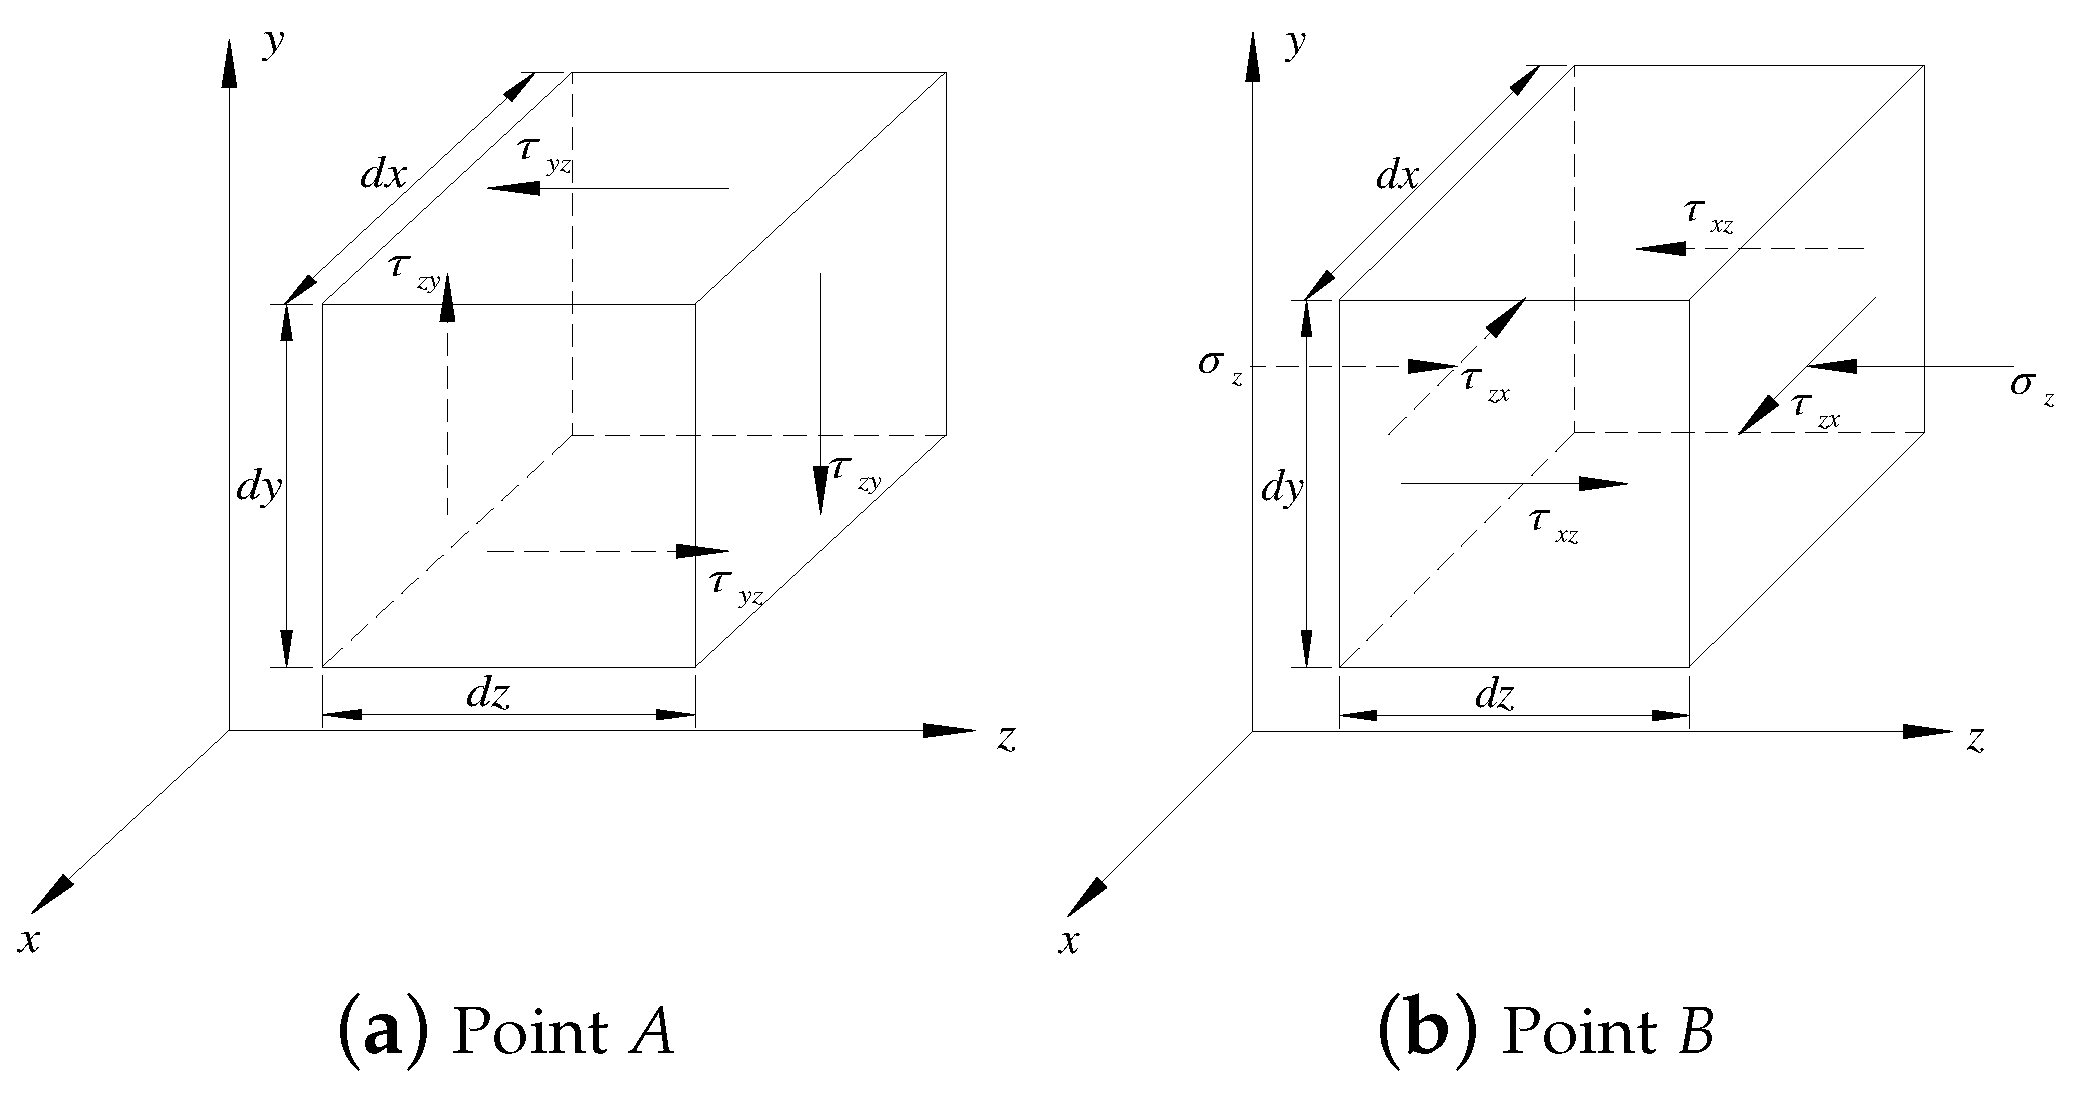
3.1. The Analysis of Torsional Stress for a Prism

Based on the theory of linear elasticity methods, the torque causes the warping of the prism’s cross sections, this does not coincide with the hypothesis of planar cross sections (Bernoulli’s hypothesis). The torsion moment is applied to the prism without confined compression at the end. Since any cross-sectional planes have the same shape, the warping of the boundary plane is free. The condition that there is only shear stress without normal stress in the cross section means pure torsion, i.e., the external force is a torsional load in unconfined compression. On the other hand, the torsion moment is applied to the prism with confined compression at the end, since any warp of the cross-sectional planes has a different shape, the normal stress arises at the boundary plane. The condition that there is shear stress with normal stress in the cross section means direct (simple) shear, i.e., the external force is a torsional load in confined compression. The geometric sizes of the prismatic specimen designed in the torsional shear test are equal: H = 120 mm, a = 40 mm, and b = 40 mm, in which H is the height, and a and b are the big and small sides of the rectangular cross section, respectively. The type of external forces is divided into two cases: firstly, the shear stress only exists in the prismatic specimen subjected to torsional ( M T ) loads in the case of unconfined compression, as shown in Figure 2a; secondly, the normal and shear stresses exist in the prismatic specimen subjected to axial (N) and torsional ( M T ) loads in the case of confined compression, as shown in Figure 2b.

3.1.1. Torque in Unconfined Compression

The prismatic bar torque theory, originally proposed by Saint-Venant in 1853, was used to solve the boundary conditions of the torsion function and A. Clebsch applied a conjugate function to simplify the boundary conditions. Under the rectangular coordinates of Figure 3, and according to Saint-Venant’s torsion function, the stress of any point of the cross section is expressed as follows:
τ z x = G ω φ x y τ z y = G ω φ x + x σ x = σ y = σ z = τ x y = 0
where ω is the angle of twist per unit length, φ x , y denotes the torsion function, and G denotes the shear modulus. In general, φ x , y is rather complicated but as a plane harmonic function, accordingly, it may be written in the form of conjugate function Ψ x , y = ψ x , y x 2 + y 2 / 2 , a rectangular cross section; Ψ is an even function of x , y ; hence, it is assumed in the form of Equation (2):
Ψ = 1 4 b 2 + 1 2 x 2 y 2 + n = 1 , 3 , A n cosh n π x b cos n π y b 1 2 x 2 + y 2
The conjugate function may be represented either in terms of stress or torque (see Equations (3)–(6)).
τ z x G ω = 2 y π b n = 1 , 3 , n A n cosh n π x b sin n π y b
τ z y G ω = π b n = 1 , 3 , n A n sinh n π x b cos n π y b
T G ω = a b 3 3 1 192 π 5 b a n = 1 , 3 , 1 n 5 tanh n π a 2 b
A n = 1 ( n + 1 ) / 2 8 b 2 π 3 n 3 s e c h n π a 2 b
The shearing stress vector is tangent to the boundary of the rectangular cross section. The shear stress is zero at external corners, and the maximum shear stress occurs in the middle portion of the bigger side of the rectangle in Figure 3. The shear stresses at points A, A , B, and B are expressed as follows:
τ z x x = 0 , y = b / 2 = α A M T a b 2
τ z y x = a / 2 , y = 0 = α B M T a b 2
For a = b = 0.04 m, it yields α A = α B = 4.804 . With Equations (7) and (8), the maximum shear stress of a straight bar with rectangular cross section is equal to τ z x m a x = τ z y m a x = 7.50625 × 10 2 M T , where the unit of moment M T is the newton-meter (N·m) and the unit of shear stress τ is the megapascal (MPa).

3.1.2. Torque in the Confined Compression

The normal stress distribution for the cross section is caused both by the compressive load and the warping by the torsional load. With the increase of the torque in the confined compression test, the additional normal stress is increasing. Hence, the dynamic compression load must be applied on the cross section to maintain the theoretical normal stress constant.
The three-dimensional stress of the element of points A and B is shown in Figure 4. The element is subjected to the normal stress ( σ z ) and the shear stress ( τ z x or τ z y ). The radial stress and the circumferential stress are equal to zero. The shear stress can be expressed by the same formulas for the torque in the unconfined compression and the normal stress can be written as follows:
σ z = N A
where A is the cross-sectional area and N is the compression load in the direction of the z axis.

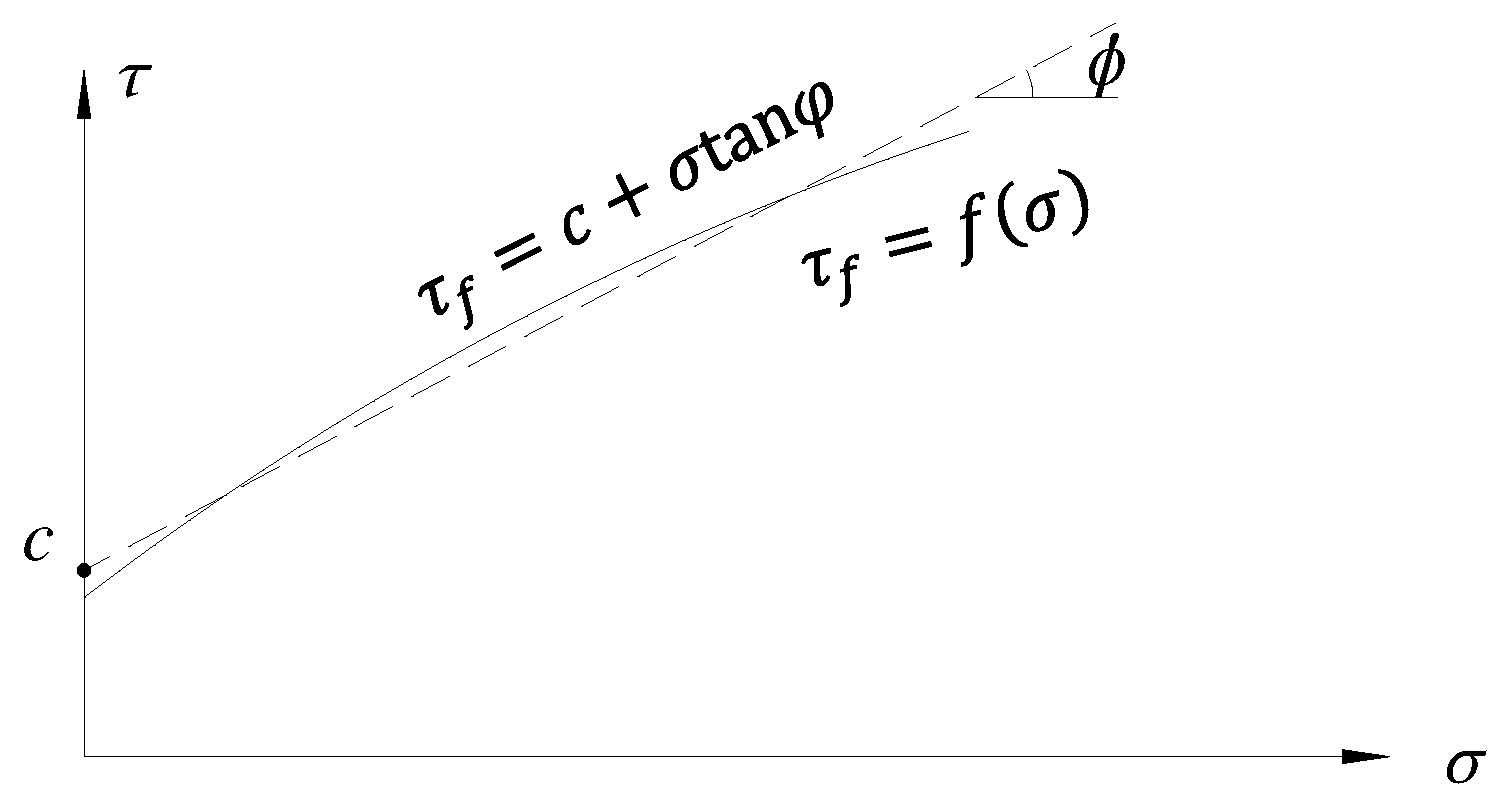
3.2. Failure Criteria of Asphalt Mixture

The compressive strength and the tensile strength are important mechanical properties of asphalt mixtures. The compressive strength mainly relates to the aggregate skeleton and is measured in a uniaxial compression test, and the tensile strength mostly reflects the strength of the binder and is measured in a traditional test as a direct tensile test or a bending test. However, the shear strength can better represent the strength of the asphalt mixture of aggregate materials and binder. Shearing forces or stresses have to overcome both the interlocking of the aggregate structure and the cohesive forces of the binder [8].
The Mohr–Coulomb criterion is the failure criterion most used in a shear failure test to represent asphalt mixtures. The Mohr–Coulomb criterion can be express as follows:
τ f = c + σ tan φ
where τ f is the critical shear stress, σ is the normal stress on the failure plane, c is the cohesion, and φ is the angle of internal friction. These parameters are illustrated in Figure 5. The cohesion c indicates that even if the normal stress is zero, a certain shear stress is necessary to produce shear failure [18].

4. Materials and Specimen Preparation

4.1. Materials Preparation

4.1.1. Modified Asphalt Binder

For the test, we chose a modified asphalt binder whose optimum binder content was determined earlier by the Marshall method to be 5% by weight of the total mix.

4.1.2. Aggregate Gradation of Asphalt Mixtures

The asphalt mixture AC-13 is the traditional type of surface course. Table 1 shows the aggregate gradation for the asphalt mixture AC-13 used in the torsional shear testing.

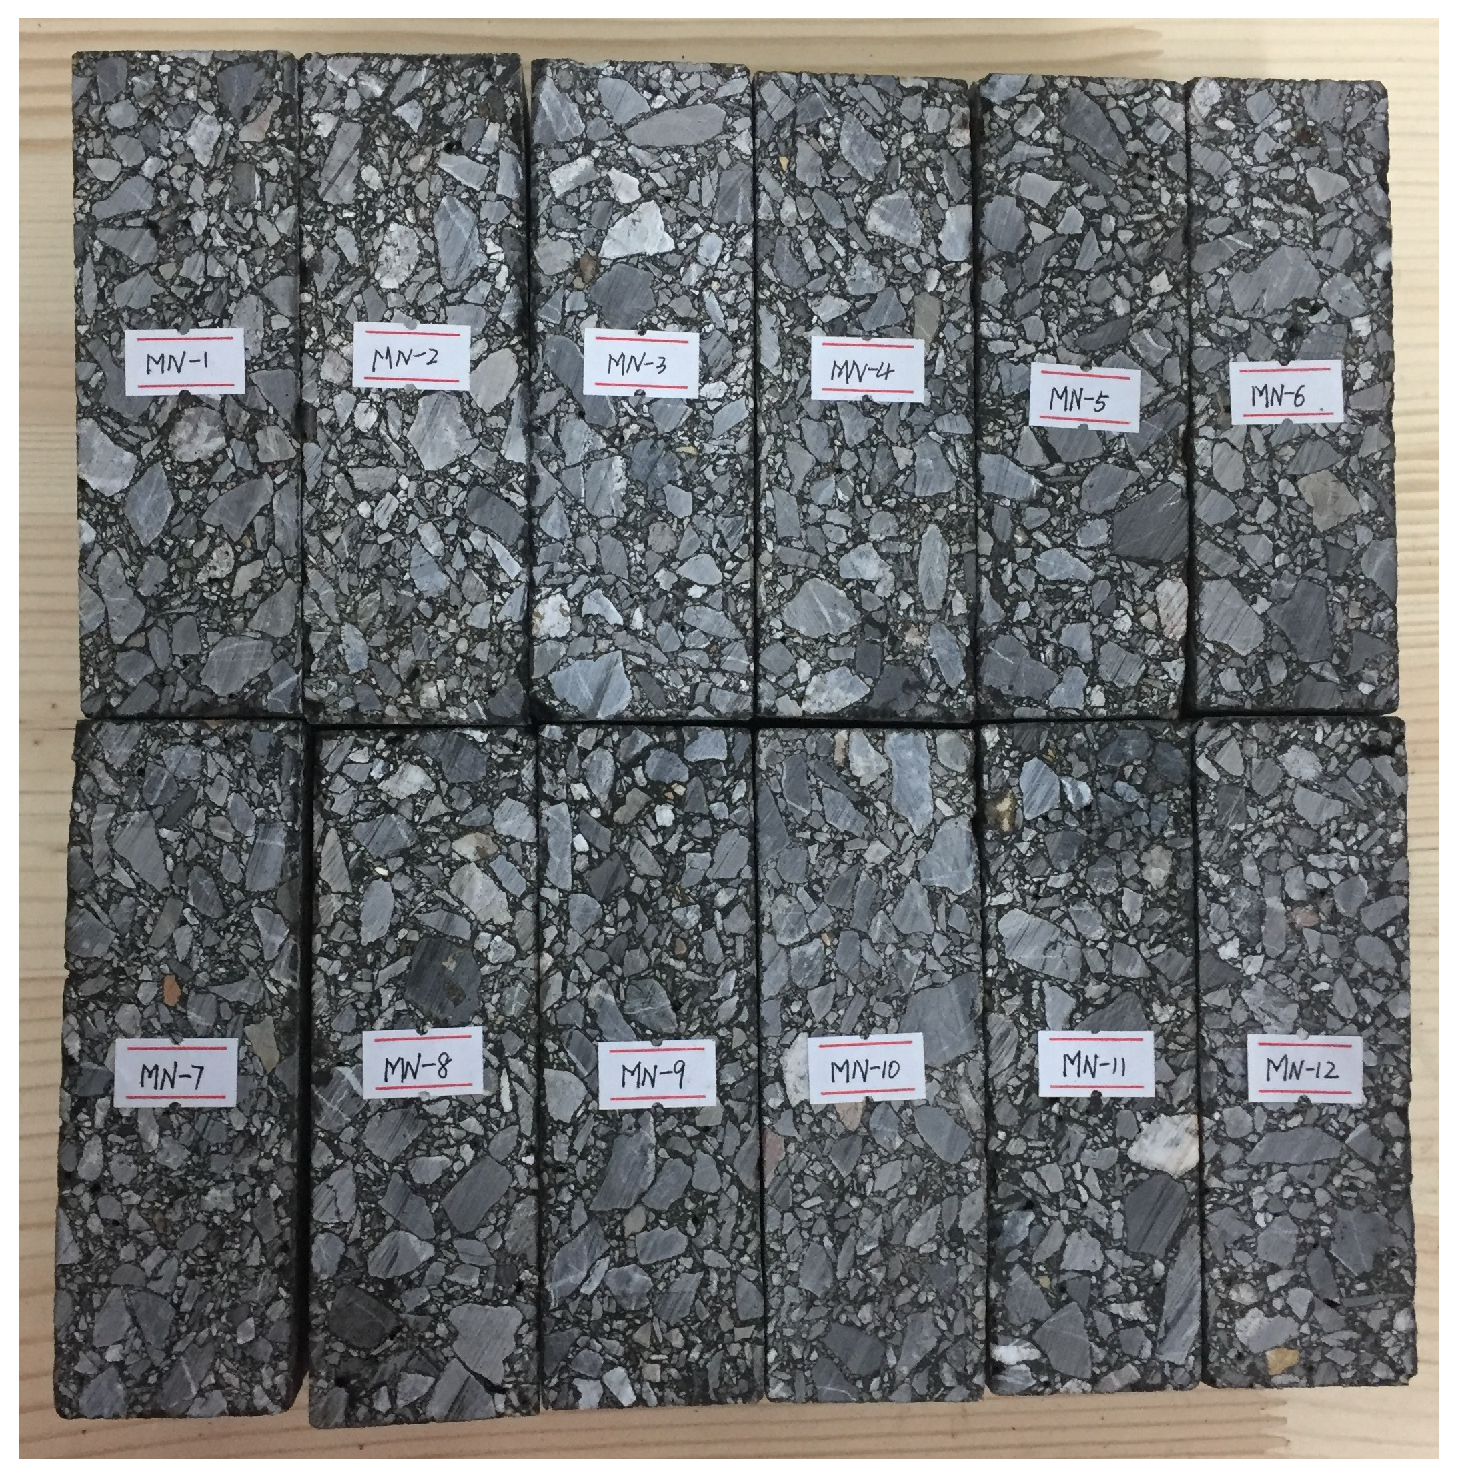
4.2. Specimen Preparation

By rolling wheel mix design methods to produce specimens in the laboratory, using Chinese standard (T 0703) [16], we formed a slab with a dimension of 300 mm in both side lengths, a thickness of 50 mm, and an air void content of 4.4%. The properties of the specimen asphalt mixture are shown in Table 2.
The slab was cut into twelve prismatic specimens along the direction of the rolling wheel, as illustrated in Figure 6; each specimen was 40 mm in both side lengths and 120 mm in height.

5. Experimental Plans

The torsional shear test included two types to study the failure envelope modeled by the stress point on the failure plane. The type I test in unconfined compression was used to evaluate the influence of the temperature and the loading speed on the cohesion, which was one of the shear strength parameters. The type II test in confined compression was used to evaluate the effects of the magnitude of normal stress on the shear strength.
At high temperature, the static shear loading results in significant damage of asphalt mixtures. A temperature of 40 C for the experimental plan was set in this paper. To be aware of the various results of failure tests, the strain rate of the torsional shear test in this paper was 0.01 per second compared with a corresponding strain rate of 0.0085 per second, i.e., the loading speed was 50.8 mm/min for the triaxial compression test of Tan et al. [19], as well as a corresponding strain rate 0.01 per second, i.e., the loading speed was 50 mm/min for the uniaxial compression test of the Chinese standard (T 0714) [16]. A rapid loading pattern was selected away from the viscous response of creep. The measurement of the loading speed of the torsional shear testing device was 2.4 rad/min with an unloading period, which corresponded to a strain rate of 0.01 per second. The test consisted of a set of four specimens to collect three valid data points. The temperature of the specimens and jigs were controlled by a heated air system device for 4 h before testing, as shown in Figure 7. Under constant temperature conditions, the experimental work was accomplished in 1 min to avoid the laboratory temperature effect on the response of the material.

6. Experimental Results

6.1. Results of the Torsional Shear Test in Unconfined Compression

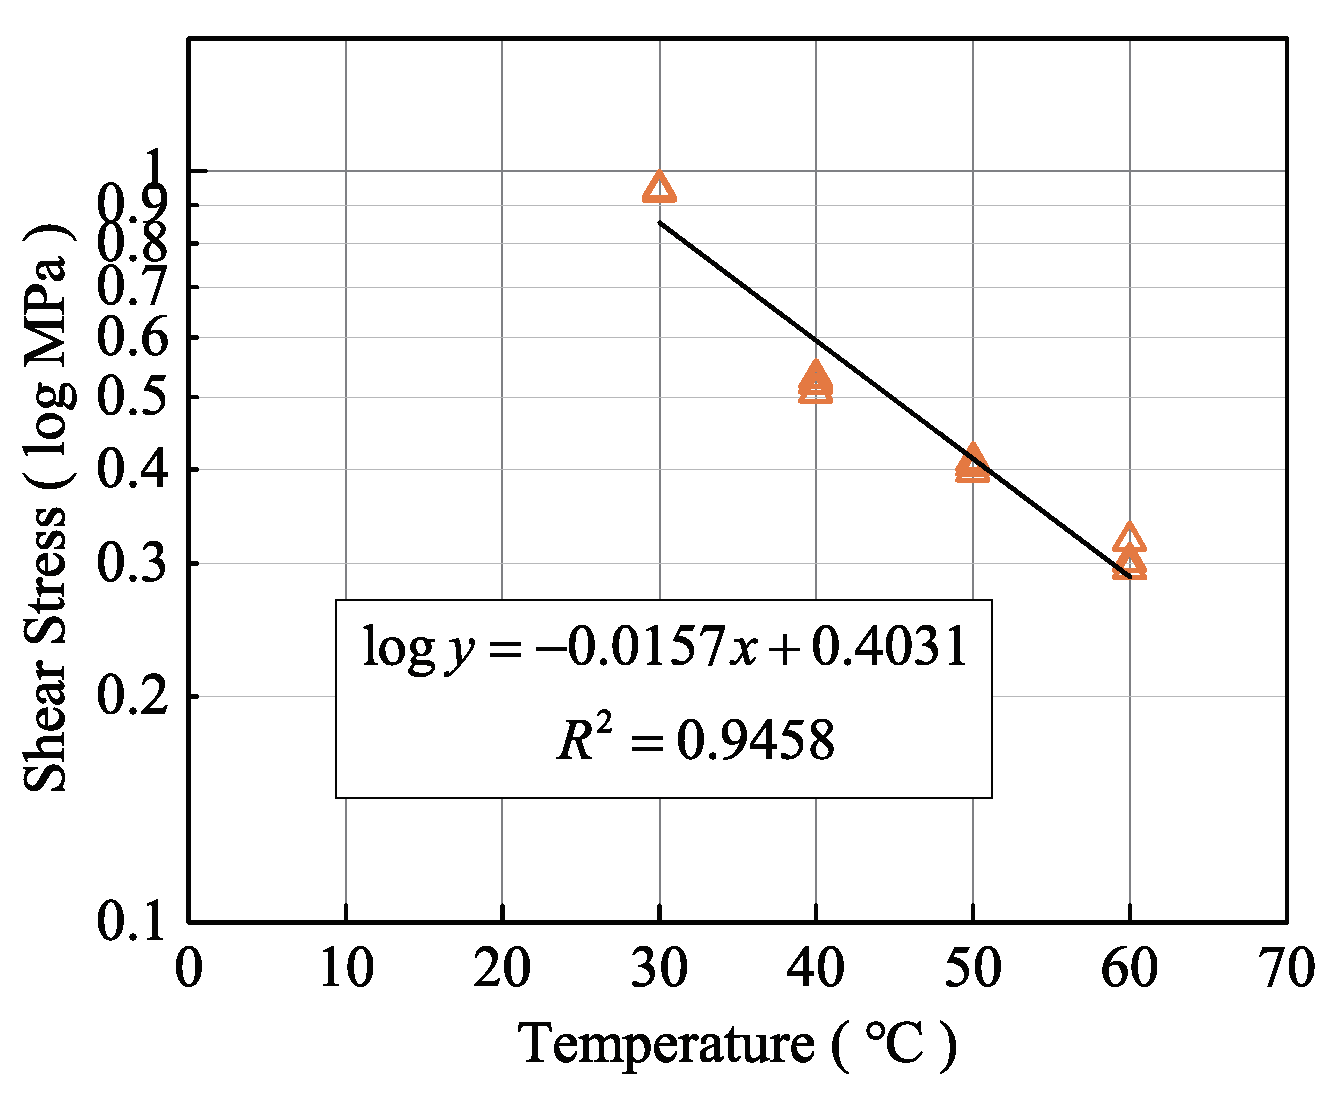
6.1.1. Effects of the Test Temperature

At the constant loading speed (2.4 rad/min) with four temperatures (30 C, 40 C, 50 C, and 60 C), the stress–time curves of the torsional shear test in unconfined compression are shown in Figure 8. At the constant loading speed, the shear strength decreased with the increasing temperature. The maximum shear stress of various specimens at different temperatures is shown in Table 3.

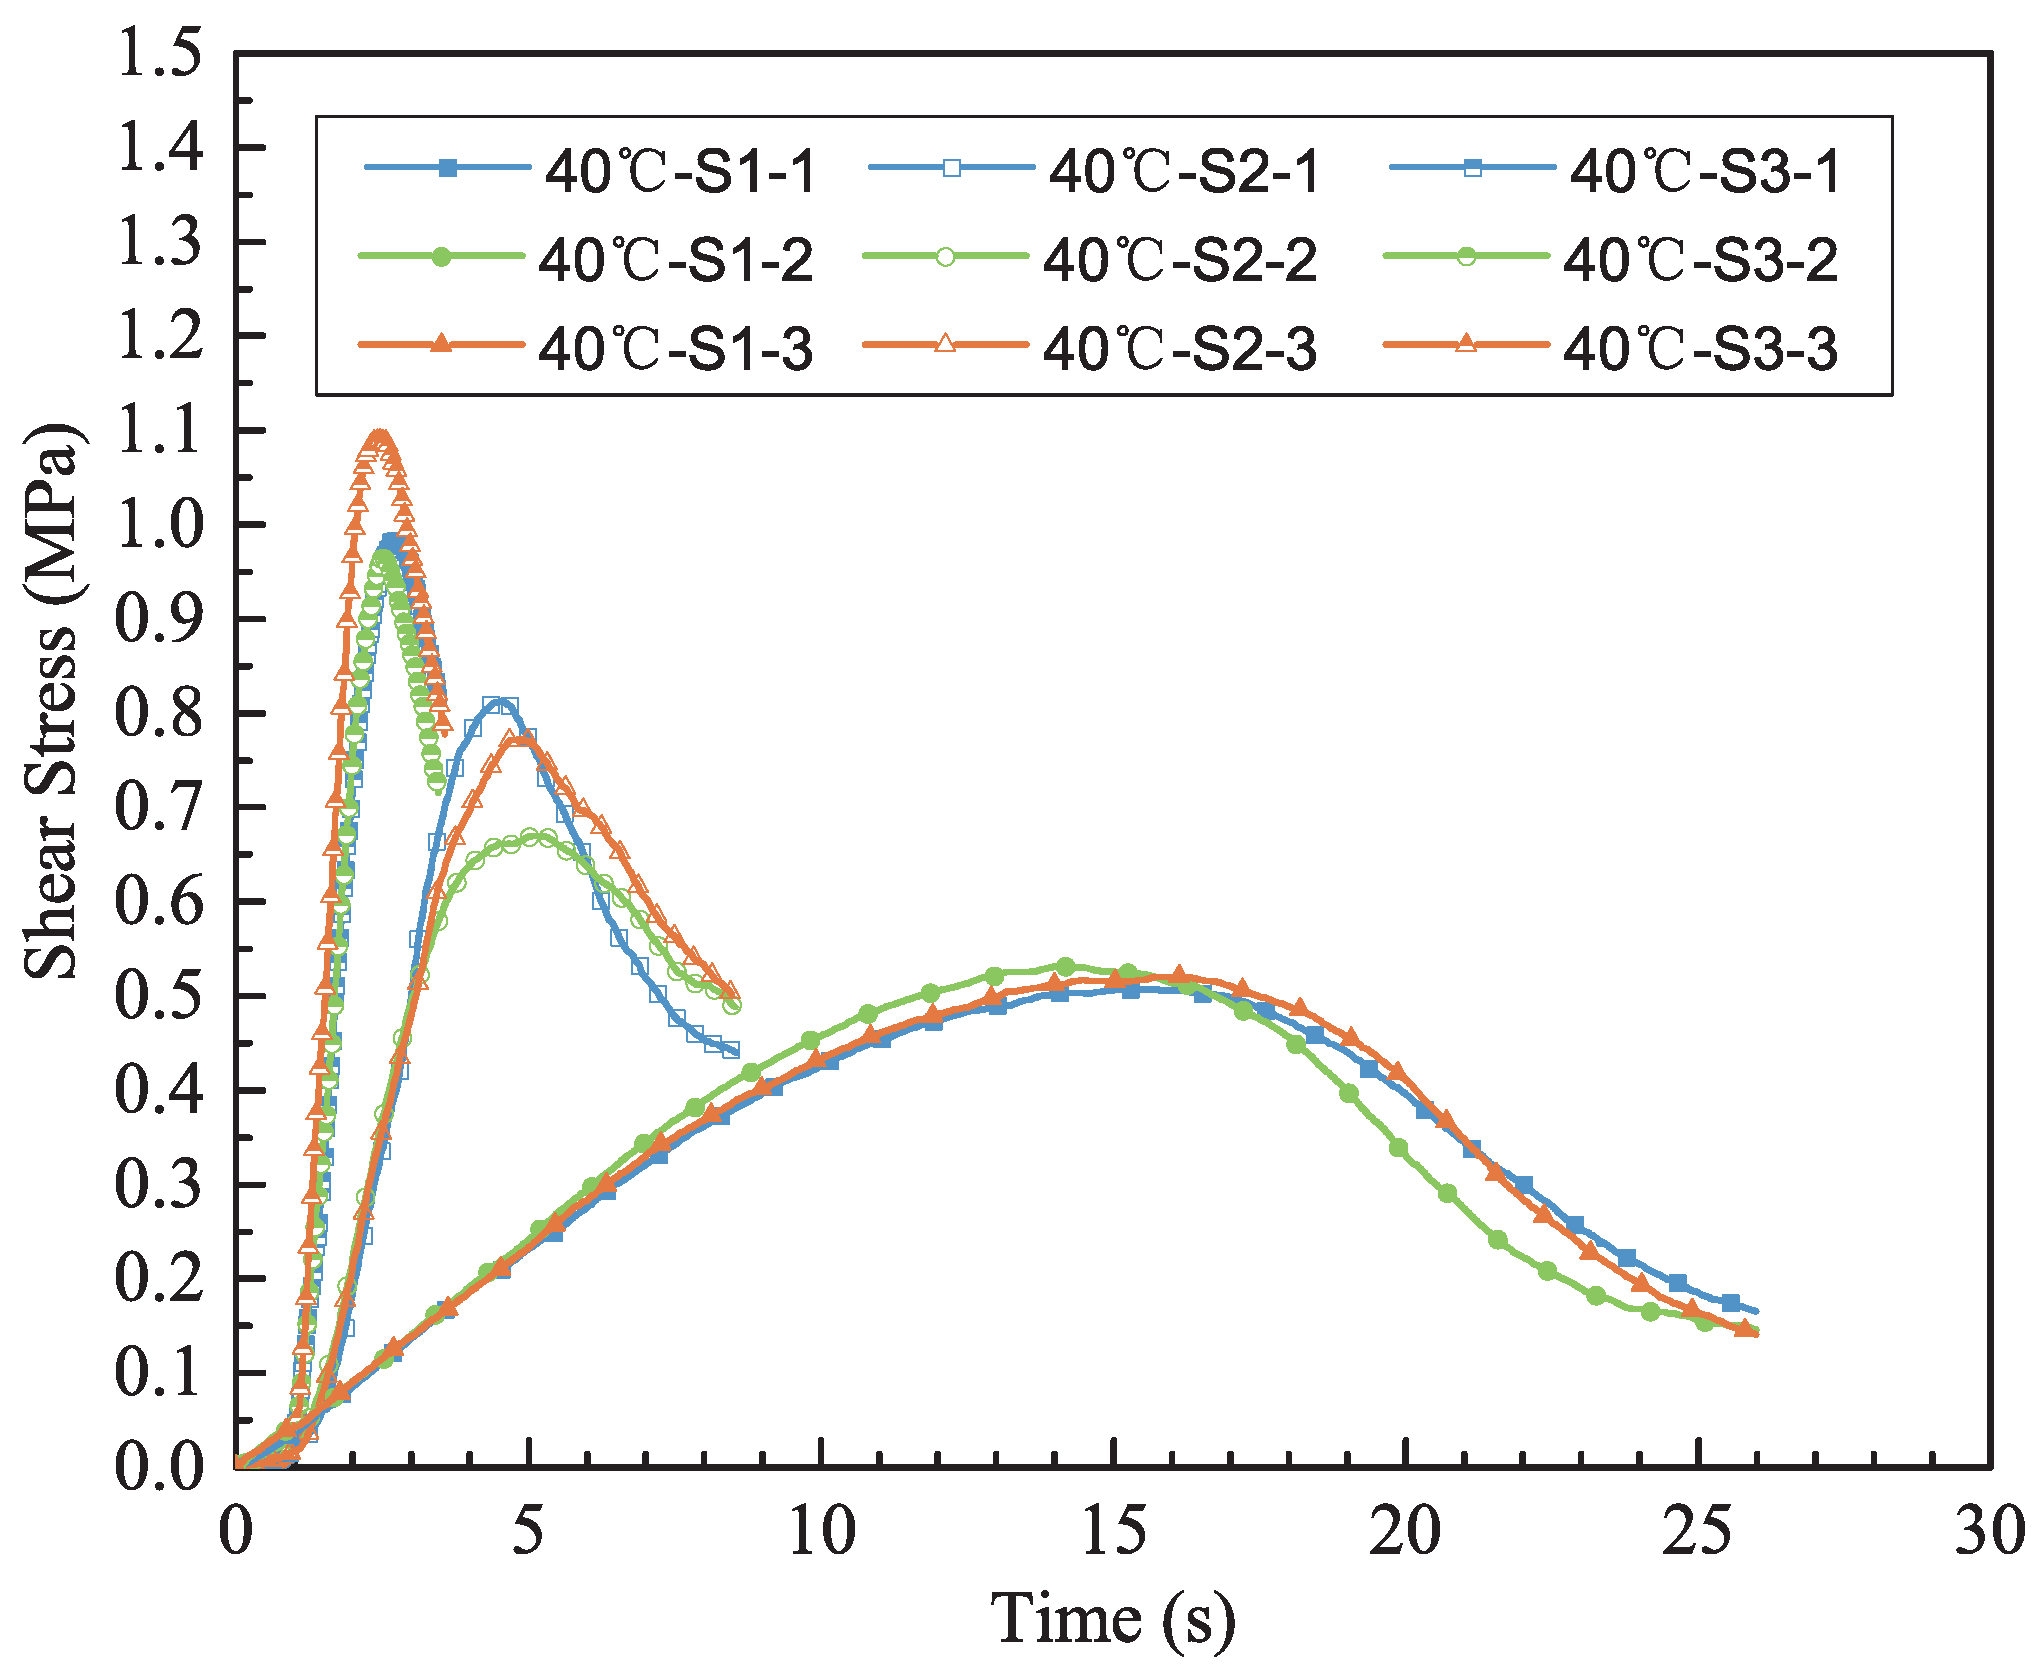
6.1.2. Effects of the Loading Speed

At a constant temperature (40 C) with three loading speeds (2.4 rad/min, 4.0 rad/min, and 8.5 rad/min), the stress–time curves of the torsional shear test in unconfined compression are shown in Figure 9. At a constant temperature, the shear strength increased according to the loading speeds. The maximum shear stress of various specimens at different loading speeds is shown in Table 4.

6.2. Results of the Torsional Shear Test in Confined Compression

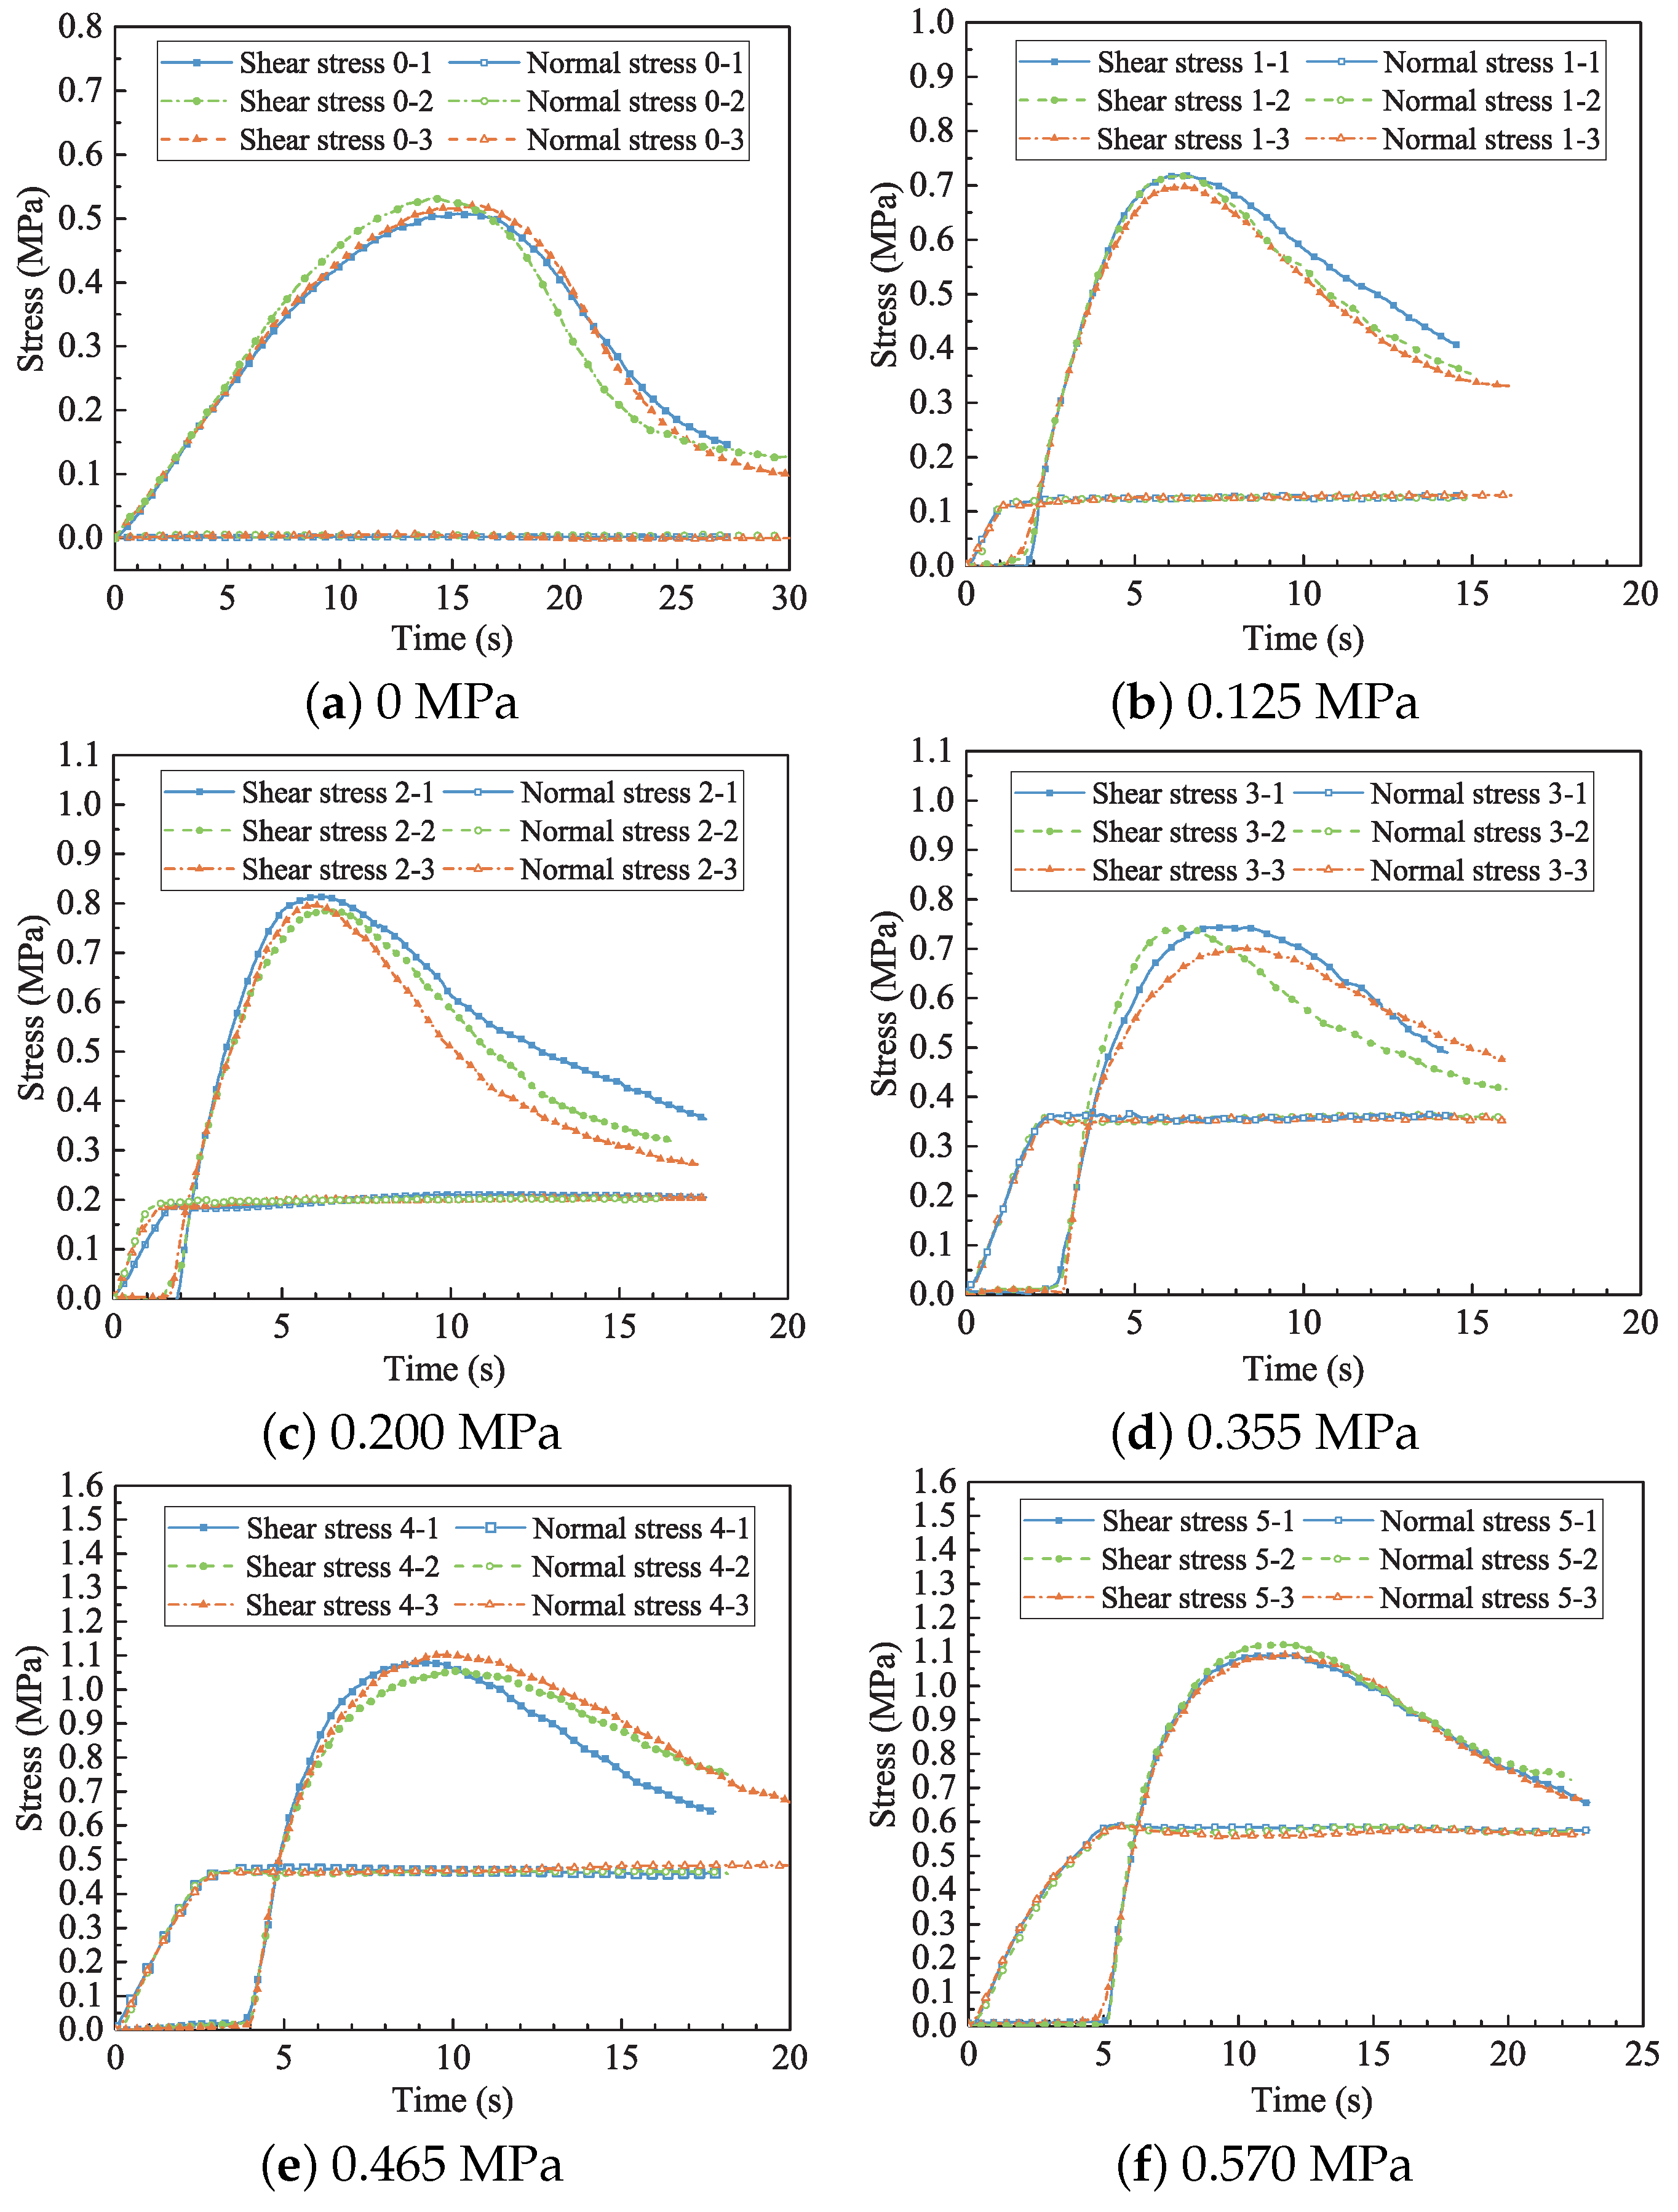
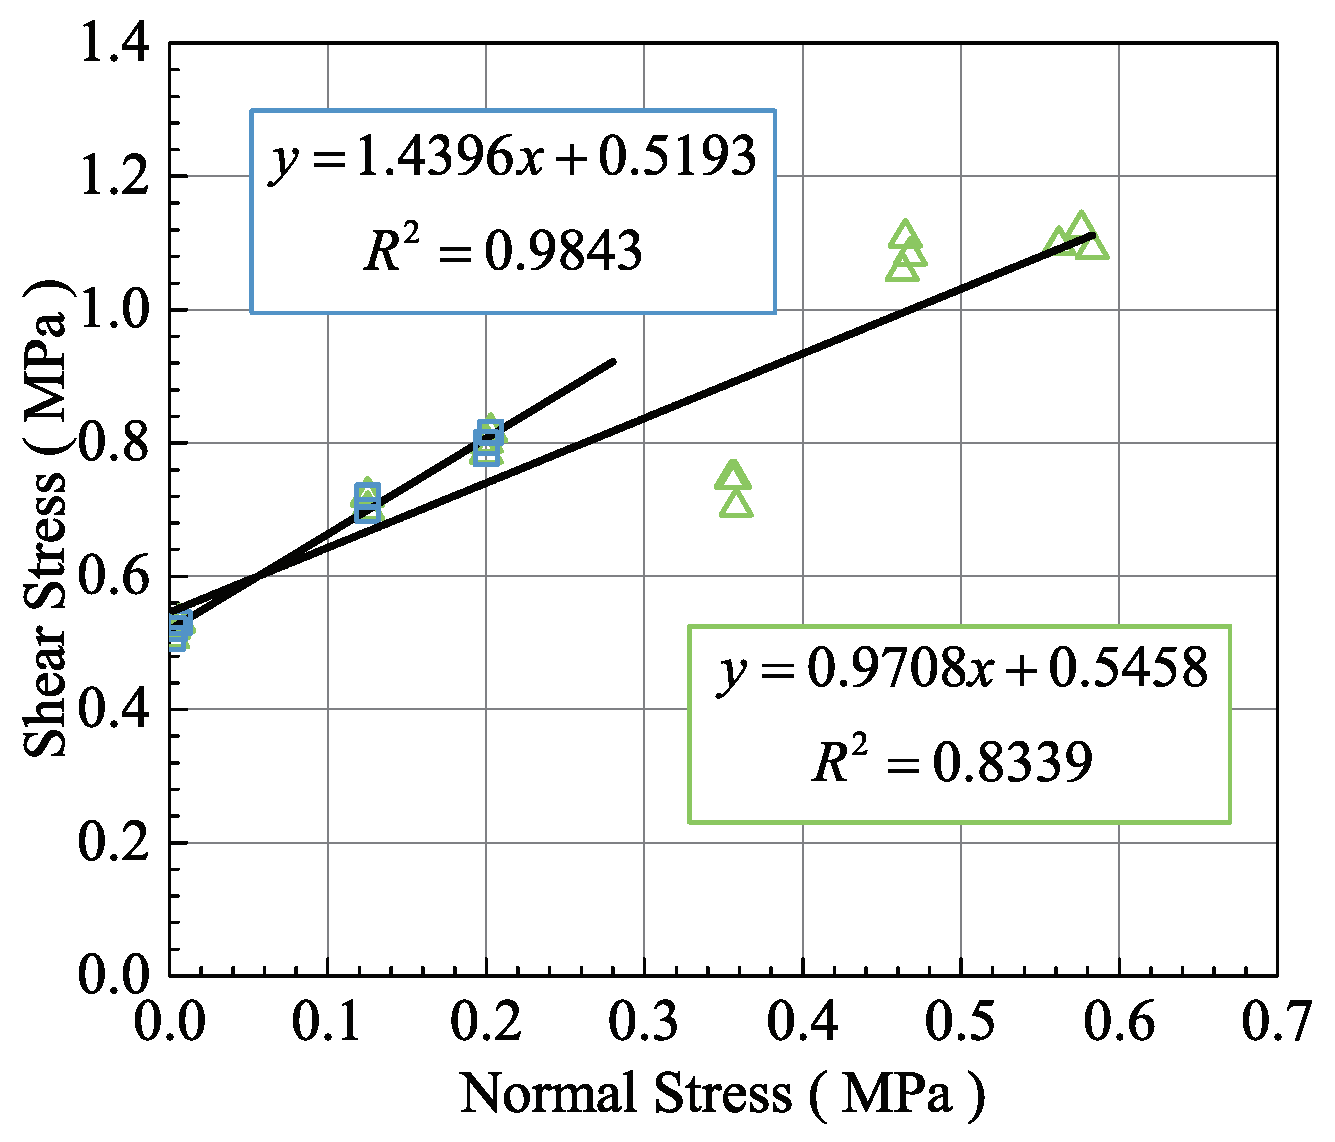
Effects of the Normal Stress

Uniaxial compressive strength tests were conducted at a temperature of 40 C with a strain rate 0.01 per second to obtain the compressive strength of the prismatic specimen. Five normal stress levels (0.125 MPa, 0.200 MPa, 0.355 MPa, 0.465 MPa, and 0.570 MPa) were selected for a compressive strength ranging from 10 to 45%. The stress–time curves of the torsional shear test including the unconfined and confined compression conditions are shown in Figure 10. At a constant temperature and loading speed, the shear strength increased according to normal stress levels. The maximum shear stress of various specimens at different normal stress levels is shown in Table 5.

7. Analyses of the Torsional Shear Test
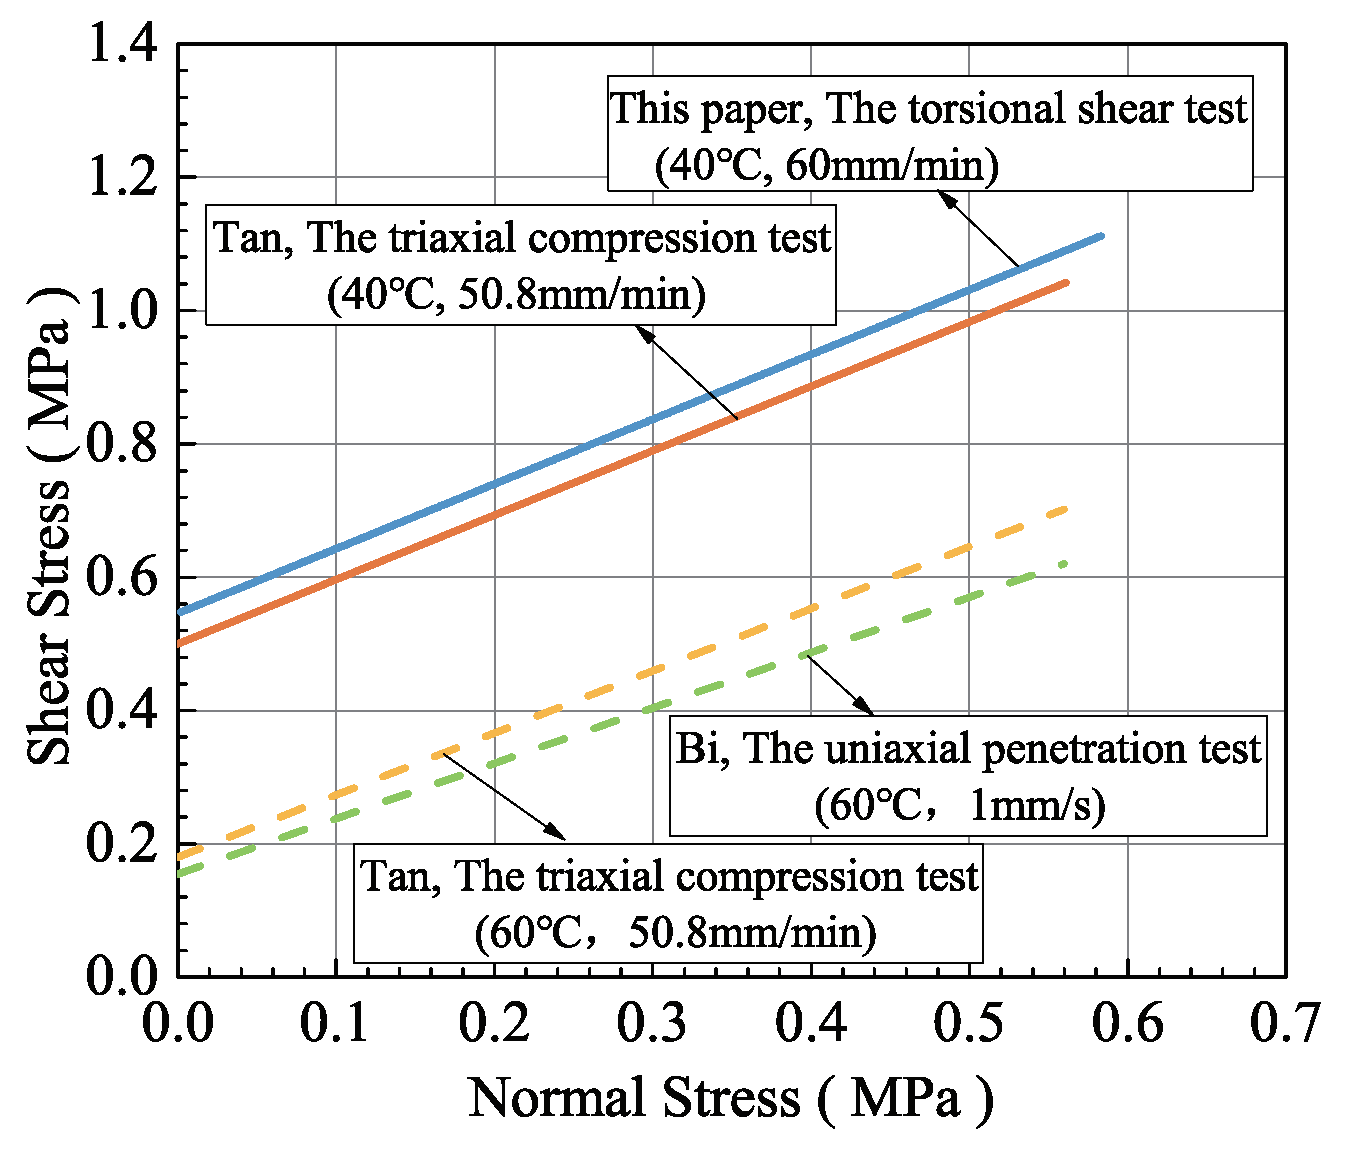
7.1. Cohesion

The cohesion c and the angle of internal friction φ can be determined from the intercept and slope of the Mohr’s failure envelope, respectively. The cohesion c is the shear strength obtained by the pure shear test. The cohesion c analysis is performed based on the torsional shear test in unconfined compression, as an independent strength parameter. The form of the shear strength τ f represents the relationship with the temperature T and the relationship with the loading speed ν . The shear strength τ f is the function described in Equations (11) and (12).
log τ f T = a T + b
τ f ν = a ν b
By inserting the test data from Table 3 and Table 4 into Equations (11) and (12), respectively, the fitting results of the maximum shear stress were obtained and are shown in Figure 11 and Figure 12. The linear regression functions, showing a good agreement with the temperature T or loading speed ν , are illustrated in Table 6. The mean of the maximum shear stress was obtained by the torsional shear test in unconfined compression under a constant loading speed (2.4 rad/min) at 40 C. The cohesion c for the shear strength by the type I test was measured as 0.519 MPa.

7.2. The Angle of Internal Friction

Based on the test data of the Mohr–Coulomb failure criterion from Table 6, the fitting results of the maximum shear stress are illustrated in Figure 13. The linear regression function was obtained from Equation (13):
τ f = 0.9708 σ + 0.5458
It is apparent from the above result that the cohesion c was 0.546 MPa, the angle of internal friction φ was 44.15° ( tan φ = 0.9708), and the coefficient of determination R 2 was equal to 0.8339. The result measured was less than approximately 9% of the fitting result, which satisfied the nonlinear theory of the shear failure envelope.
Comparing the earlier test to assess the shear failure envelope of the asphalt mixture AC-13, the triaxial compression test conducted by Tan et al. [19] at two temperatures (40 C and 60 C) and a loading speed of 50.8 mm/min obtained a cohesion c of 0.50 MPa and 0.18 MPa, respectively, and an angle of internal friction φ of 44° and 43°, respectively. The uniaxial penetration test conducted by Bi et al. [20] at a temperature of 60 C and a loading speed of 1 mm/s obtained a cohesion of 0.1543 MPa and an angle of internal friction of 39.75°. The cohesion c was dependent on the temperature and/or loading speed. The cohesion c and the angle of internal friction φ measured in the torsional shear test were in agreement with the triaxial compression test and the uniaxial penetration test of Figure 14.
Earlier tests were conducted at high confinement and obtained the shear parameter; however, this test was conducted at both high confinement and low confinement and indicated that the coefficient of determination was less than that of earlier tests. Based on the test data at three normal stress levels (0, 0.125 and 0.200) of the Mohr–Coulomb failure criterion from Table 5, the fitting results of the maximum shear stress are illustrated in Figure 13. The cohesion c was taken from the mean of the maximum shear stress of three specimens as 0.519 MPa. The linear regression function was obtained from Equation (14):
τ f = 1.4396 σ + 0.5193
It is apparent from the above results that the cohesion c was 0.519 MPa, the angle of internal friction φ was 55.21° ( tan φ = 1.4396), and the coefficient of determination R 2 was equal to 0.9843. The test data at three normal stress levels (0, 0.125 and 0.200) yielded an angle of internal friction φ which was 25% larger than the test data at six normal stress levels (0, 0.125, 0.200, 0.355, 0.465, and 0.570 MPa). That is because the aggregate particles are difficult to compact at low confinement, which is mainly controlled by the dilation in the improvement of the shear strength. Hence, the angle of internal friction was a nonlinear parameter. The Mohr–Coulomb failure criterion did not satisfy the shear damage at low confinement.

8. Conclusions

From these analytical investigations of the temperature, the loading speed, and the normal stress level, the following conclusions can be drawn:
  • Temperatures and loading speeds are the issue to consider on the torsional shear test in unconfined compression. The viscoplastic behavior of asphalt mixtures is considered to be of much importance.
  • For the prismatic specimen in the torsional shear test in confined compression, the normal stress can be dynamically controlled to reach conditions of combined axial and torsional loads.
  • The cohesion of experimental measurements was 9% smaller than the simulated one. The magnitude of the normal stress was significantly affected by the shear stress strength. The nonlinearity of Mohr’s failure envelope should be considered at a low normal stress level.
There was the same initial loading speed of compression in confined compression but different axial loads applied to the specified normal stress level, which caused a time interval of normal stress loads. The asphalt mixture at high temperature exhibited viscoelastic behavior characteristics; however, the stress energy during this time interval showed an instability of the shear strength, which should be solved in further investigation.

Author Contributions

Methodology, J.C. and Y.L. (Yongjun Liu); Software, Y.L. (Yuhua Li) and Y.S.; Investigation, W.W.; Data curation, G.W.; Writing—original draft, G.W.; Writing—review & editing, G.W. and Y.L. (Yuhua Li); Project administration, J.C.; Funding acquisition, Y.L. (Yuhua Li). All authors have read and agreed to the published version of the manuscript.

Funding

This research was funded by the National Natural Science Foundation of China, grant number 51878121, 51878122 and 51808098.

Institutional Review Board Statement

Not applicable.

Informed Consent Statement

Not applicable.

Data Availability Statement

The raw/processed data required to reproduce these findings cannot be shared at this time as the data also form part of an ongoing study.

Acknowledgments

This study was funded by the National Natural Science Foundation of China, grant numbers 51878121, 51878122 and 51808098. Their support is gratefully acknowledged.

Conflicts of Interest

The authors declare no conflict of interest.

References

  1. Novak, M.; Birgisson, B.; Roque, R.; Choubane, B. One-Way and Two-Way Directional Heavy-Vehicle Simulator Loading: Effects on Rutting in Hot-Mix Asphalt Pavements. Transp. Res. Rec. J. Transp. Res. Board 2004, 1896, 208–214. [Google Scholar] [CrossRef]
  2. Yoo, P.J.; Al-Qadi, I.L.; Elseifi, M.A.; Janajreh, I. Flexible pavement responses to different loading amplitudes considering layer interface condition and lateral shear forces. Int. J. Pavement Eng. 2006, 7, 73–86. [Google Scholar] [CrossRef]
  3. Ministry of Transport of the People’s Republic of China. Specifications for Design of Highway Asphalt Pavement: JTG D50-2017(EN); China Road and Bridge Corporation: Beijing, China, 2017.
  4. Zak, J.; Monismith, C.L.; Coleri, E.; Harvey, J. Uniaxial Shear Tester—New test method to determine shear properties of asphalt mixtures. Road Mater. Pavement Des. 2017, 18, 87–103. [Google Scholar] [CrossRef]
  5. Sousa, J.; Monismith, C.L. Dynamic Properties of Asphalt Concrete. J. Test. Eval. 1988, 16, 350–363. [Google Scholar]
  6. Zahw, M. Development of Testing Framework for Evaluation of Rutting Resistance of Asphalt Mixes. Ph.D. Thesis, Al-Azhar University, Cairo, Egypt, Carleton University, Ottawa, ON, Canada, 1995. [Google Scholar]
  7. Abd El Nabi, R. Influence of Highway Geometry on Distress of Asphalt Concrete Pavements. Ph.D. Thesis, Zagazig University, Zagazig, Egypt, Carleton University, Ottawa, ON, Canada, 1995. [Google Scholar]
  8. Goodman, S.N. Design, Development and Validation of the In-Situ Shear Stiffness Test (InSiSSTtm) Facility for Asphalt Concrete Pavements. Ph.D. Thesis, Carleton University, Ottawa, ON, Canada, 2000. [Google Scholar]
  9. ASTM. Standard Test Method for Determining the Complex Shear Modulus (G*) of Bituminous Mixtures Using Dynamic Shear Rheometer: D7552-09; ASTM International: West Conshohocken, PA, USA, 2014. [Google Scholar]
  10. Li, Y.H. Study on Experimental Method and Rotational Shear Testing Apparatus of Asphalt and Asphalt Mixtures. Ph.D. Thesis, Dalian University of Technology, Dalian, China, 2013. (In Chinese). [Google Scholar]
  11. Ragni, D.; Takarli, M.; Petit, C.; Graziani, A.; Canestrari, F. Use of acoustic techniques to analyse interlayer shear-torque fatigue test in asphalt mixtures. Int. J. Fatigue 2020, 131, 105356. [Google Scholar] [CrossRef]
  12. Brown, S.F.; Brodrick, B.V.; Tekieli, K.; Collop, A.C. A torsional hollow cylinder research apparatus for studying the permanent deformation characteristics of asphalt. Road Mater. Pavement Des. 2013, 14, 65–85. [Google Scholar] [CrossRef]
  13. Saada, A.S.; Townsend, F.C. State of the art: Laboratory strength testing of soils. In Laboratory Shear Strength of Soil; Yong, R.N., Townsend, F.C., Eds.; ASTM: West Conshohocken, PA, USA, 1981; pp. 7–77. [Google Scholar]
  14. Kuwano, J.; Katagiri, M.; Kita, K.; Nakano, M.; Kuwano, R. A review of Japanese standards for laboratory shear tests. In Advanced Laboratory Stress-Strain Testing of Geomaterials; Tatsuoka, F., Shibuya, S., Kuwano, R., Eds.; Routledge: London, UK, 2001; pp. 53–64. [Google Scholar]
  15. Lade, P.V. Torsion shear apparatus for soil testing. In Laboratory Shear Strength of Soil; Yong, R.N., Townsend, F.C., Eds.; ASTM: Philadelphia, PA, USA, 1981; pp. 145–163. [Google Scholar]
  16. Ministry of Transport of the People’s Republic of China. Standard Test Methods of Bitumen and Bituminous Mixtures for Highway Engineering: JTG E20-2011; China Communications Press: Beijing, China, 2011. (In Chinese)
  17. Benedetto, H.D.; Gabet, T.; Grenfell, J.; Perraton, D.; Sauzéat, C.; Bodin, D. Mechanical Testing of Bituminous Mixtures. In Advances in Interlaboratory Testing and Evaluation of Bituminous Materials; Partl, M.N., Bahia, H.U., Canestrari, F., De la Roche, C., Benedetto, H.D., Piber, H., Sybilski, D., Eds.; Springer: Dordrecht, The Netherlands; Heidelberg, Germany; New York, NY, USA; London, UK, 2012; pp. 143–256. [Google Scholar]
  18. Budhu, M. Soil Mechanics and Foundations, 3rd ed.; John Wiley & Sons Inc: Hoboken, NJ, USA, 2010. [Google Scholar]
  19. Tan, S.A.; Low, B.H.; Fwa, T.F. Behavior of asphalt concrete mixtures in triaxial compression. J. Test. Eval. 1994, 22, 195–203. [Google Scholar]
  20. Bi, Y.F.; Sun, L.J. Research on test method of asphalt mixture’s shearing properties. J. Tongji Univ. (Nat. Sci.) 2005, 33, 1036–1040. (In Chinese) [Google Scholar]
Figure 1. The torsional shear testing device.
Applsci 12 12242 g001
Figure 2. Application of the differential load on a prismatic specimen.
Applsci 12 12242 g002
Figure 3. Stress distribution under the torsional load across the prism section.
Applsci 12 12242 g003
Figure 4. Stress regimes of the element.
Applsci 12 12242 g004
Figure 5. Mohr’s failure envelope.
Applsci 12 12242 g005
Figure 6. Dimensions of the cutting sample into the shape of a prism.
Applsci 12 12242 g006
Figure 7. Experimental specimen.
Applsci 12 12242 g007
Figure 8. Time dependency of shear stress at four temperature.
Applsci 12 12242 g008
Figure 9. Time dependency of shear stress at three loading speeds.
Applsci 12 12242 g009
Figure 10. Time dependency of the shear stress at six normal stress levels.
Applsci 12 12242 g010
Figure 11. Test temperatures dependency of shear stress.
Applsci 12 12242 g011
Figure 12. Test speeds’ dependency of shear stress.
Applsci 12 12242 g012
Figure 13. Normal stress dependency of shear stress.
Applsci 12 12242 g013
Figure 14. The failure envelope of different shear tests.
Applsci 12 12242 g014
Table 1. Aggregate gradation for the asphalt mixture.
Sieve size (mm)16.013.29.54.752.361.180.60.30.150.075
Passing by weight (%)10098.476.644.331.422.616.211.58.65.7
Table 2. Properties of the specimen asphalt mixture.
PropertyValue
Air void content, %4.4
Marshall stability, kN9.96
Marshall stability, mm3.0
Voids in mineral aggregate (VMA), %15.6
Voids filled with asphalt (VFA), %71.6
Table 3. The maximum shear stress of various specimens at different temperatures.
SpecimenT τ max SpecimenT τ max
No.( C)(MPa)No.( C)(MPa)
30 C-S1-1300.94140 C-S1-1400.507
30 C-S1-2300.94640 C-S1-2400.530
30 C-S1-3300.93840 C-S1-3400.521
50 C-S1-1500.40560 C-S1-1600.295
50 C-S1-2500.39860 C-S1-2600.322
50 C-S1-3500.41160 C-S1-3600.302
Table 4. The maximum shear stress of various specimens at different loading speeds.
SpecimenLoading Speed τ max SpecimenLoading Speed τ max
No.(rad/min)(MPa)No.(rad/min)(MPa)
40 C-S2-13.980.84240 C-S3-18.420.983
40 C-S2-23.650.66840 C-S3-28.360.964
40 C-S2-33.670.78640 C-S3-38.451.090
Table 5. The maximum shear stress of various specimens at different normal stress levels.
Specimen σ τ max Specimen σ τ max Specimen σ τ max
No.(MPa)(MPa)No.(MPa)(MPa)No.(MPa)(MPa)
0-10.0020.5071-10.1250.7212-10.2030.816
0-20.0060.5301-20.1250.7192-20.2000.784
0-30.0030.5211-30.1250.6992-30.2000.800
3-10.3570.7464-10.4681.0815-10.5831.091
3-20.3550.7464-20.4631.0585-20.5761.121
3-30.3580.7044-30.4651.1085-30.5621.097
Table 6. The fitting function of the cohesion with the temperature/loading speed.
Loading ConditionLinear Regression FunctionCoefficient of Determination R 2
ω = 2.4 rad/min log c = 0.0157 T + 0.4031 0.9458
T = 40 C c = 0.3998 ω 0.4433 0.9093
Publisher’s Note: MDPI stays neutral with regard to jurisdictional claims in published maps and institutional affiliations.

