Article

Assessing the Crashworthiness Analysis on Frontal and Corner Impacts of Vehicle on Street Poles Using FEA

1
Automotive and Marine Department, College of Technological Studies, PAAET, Kuwait City 70654, Kuwait
2
LaunchTech Solutions, Abu Dhabi P.O. Box 148410, United Arab Emirates
3
Mechanical Power and Refrigeration Department, College of Technological Studies, PAAET, Kuwait City 70654, Kuwait
*
Author to whom correspondence should be addressed.
Appl. Sci. 2022, 12(23), 12287; https://doi.org/10.3390/app122312287
Submission received: 24 October 2022 / Revised: 11 November 2022 / Accepted: 16 November 2022 / Published: 1 December 2022

Abstract

:
The impact analysis of vehicle collision on street poles was investigated, as well as an assessment of which type of impact—frontal or corner—contributes to the most damages on both the car and the streetlamp. This work was accomplished using Abaqus/Explicit software to numerically simulate the crashes at three different velocities, 12, 17, and 22 m·s−1, and extract relations such as the energy models, the specific energy absorption (SEA) of the materials tested, and the impact forces. Two materials were used for the street pole: aluminum Al-6061 and ASTM A36 grade steel. Findings such as the influence of the SEA on the vehicle’s velocity, the relationship between the deformation of the street pole and the vehicle’s velocity, as well as the improvement of previously studied models by including damage parameters are presented.

1. Introduction

Crashworthiness analysis is vital to find solutions that protect passengers from serious harm and to identify the best techniques for reducing the degree of damage the automobile sustains when it collides with an obstruction or another vehicle.
However, another important aspect of crashworthiness analysis that is gaining interest among researchers is the reduction in impulsive effects towards the driver. This is usually caused by the immediate reaction forces applied by these obstacles. If these mitigations can be researched further, it would reduce the costs of repairs that transportation authorities and utility providers must bear for assets such as damaged streetlights, traffic lights, speeding cameras, and other transportation obstacles and electric pylons.
In 2018 alone, sudden deviations of vehicles were a major cause of accidents in the United Arab Emirates, with about 780 reported cases (Federal Competitiveness and Statistics Centre [1]). Many of them are recorded to have collided with road barricades, speed trap cameras, and streetlamp poles, Figure 1.
Since these accidents are considered as frontal or corner impacts, it is recommended to assess the crashworthiness of such scenarios using numerical methods. These numerical simulations were conducted using the commercial software solver Abaqus 2021/Explicit, while the conditions of these simulations were controlled using industry standards published by the local transportation authorities in Kuwait and the UAE. Furthermore, published data by international organizations such as the Euro NCAP and the NHTSA were used in this paper. Using these resources to produce a crashworthiness simulation was in pursuit of the following objectives:
  • Assessing the damage of both the street pole and the vehicle during impact. The geometry and material definition of the street poles are comprehensively defined in detail to provide the results and compare them to accidents alongside experimental and numerical data of this nature.
  • Analyzing whether a frontal or corner collision will cause higher damage on the street pole, the car, and even possibly both through qualitative FEA results.
While the methodology of these simulations is similar to previous studies conducted by Gopalakrishna et al. [2], Long et al. [3], and Long et al. [4], this paper also introduces collisions with street poles made of two common materials, one being of steel and the other being of aluminum. The latter is a material that is currently widely used as an ideal material for many modern streetlights.

2. Literature Review

2.1. Constitutive Equations

According to Deb [7], the absorbed energy is an important result to extract when performing crashworthiness analysis of vehicle–object collisions. These results are needed to understand the magnitude of energy and find strategies to mitigate the impact force or the absorbed energy of the vehicle. This can be expressed using Equation (1).
E a = F × d = M a × d
where E a is the absorbed energy, F is the impact force, and d is the maximum plastic deformation. The model also includes all forms of non-linearity (geometric, material, and contact), as is expected in real-world scenarios. The non-linear physical properties will significantly influence the outcome of the crashworthiness results. Material non-linearity, for instance, will not be constant for the entire history of the material’s stress–strain curve, due to effects such as plasticity and damage. Therefore, the material’s behavior must be expressed with a non-linear form of Newton’s Second Law, shown in Equation (2).
m x ¨ + k x x = F t
where m is the total mass of the system; x ¨ is the instantaneous acceleration, which is a second-order derivative of the displacement x ; k x is the spring constant (if k does not vary with displacement) or the linear elastic properties of the system; and F t is the instantaneous force at every increment, with respect to time, t . Similarly, compressive impacts are expected in such crashworthiness analysis. Therefore, geometric non-linearity must be considered, and its equation is expressed in Equation (3).
m x ¨ + k x + a x 2 = F t
where k a x 2 represents non-linearity terms of the elastic properties. When the gap between two bodies is close enough to initiate contact, non-linearity due to contact forces occurs. The contact force, according to Deb [7], is also an implicit function of time where F x t is denoted and F x is considered geometric. Through the non-linear function F x , we can use Equation (4), as demonstrated by Sun et al. [8], to integrate F x and output the total absorbed energy during the crashworthiness analysis.
E a = 0 d F x d x
The absorbed energy of the material can then be extracted using Equation (5).
S E A = E a M
where M is the mass of the material used in the simulation. In this paper, the mass of the material is assigned to the car’s outer shell and the street pole. These values are important to understand how much impact energy the materials can mitigate during the collision.

2.2. Literature Analysis of Experimental Data

Some of the main experimental data include those published by Li et al. [9], Sun et al. [8], Ispas and Nastasoiu [10], and Miscia et al. [11]. While the paper produced by Ispas and Nastasoiu [10] contained an articulate methodology of how frontal crashworthiness experiments are conducted, noteworthy results for validation purposes were not available. This is because the reference only focused on the extraction of impact accelerations, which is beyond the scope of this work. This paper only focuses on identifying and analyzing sources of high-impact forces and energies exerted on the vehicle, so that further research may be conducted to protect the driver as much as possible. Some properties that were noted from this reference included the range of vehicle velocities. These velocities provided a good starting point on relative testing speeds of the vehicle that must be virtually simulated to obtain a reliable set of results. Such crashworthiness analysis, according to Ispas and Nastasoiu [10], should record impact velocities of at least 10 m·s−1 and up to 25 m·s−1.
Furthermore, according to crashworthiness experiments of previous frontal and corner collisions conducted by the Euro NCAP (2021), evidence suggests that the vehicle tires and the internal components within the car’s hood exhibit rigidity towards propagating any further deformation on the vehicle; therefore, it is imperative that the numerical simulations include the tire and an equivalent model of the hood component. Otherwise, the results may not be consistent with experimental values.
On the other hand, the experiments carried out by Sun et al. [8] constitute a good introductory reference to understand lateral impact velocities and their effect on vehicle deformation. For instance, under a 15 m·s−1 impact, the maximum forces exerted on a steel-based obstruction model exceeds 30 kN. Therefore, this paper covers comprehensive simulations and analysis of forces exhibited on a vehicle during such impact velocities. The data extracted from these simulations are then compared to the data presented by Sun et al. [8] as a means for validation. Moreover, the results of similar tests conducted by Miscia et al. [11] can also be used as a means of validation since this reference covers tests on aluminum equivalents of street poles. Unlike steel, this reference produced by Miscia et al. [11] suggests that the reaction forces are much less on the vehicle if it collides with a street pole made of aluminum alloys. Maximum reaction forces from this reference peak at about 8.5 kN. Therefore, the two above-mentioned references are important to substantiate a need to simulate crashworthiness of a vehicle with street poles using two distinct materials. The effects of the collision must be studied to understand how various materials affect the outcome. Physical or mechanical properties that contribute to the variation in impact forces are also identified in this paper.

2.3. Literature Analysis of Simulation Data

The first primary data based on simulation results were the initial numerical studies conducted by Abdel-Nasser et al. [12]. This reference was also the main source of inspiration towards the production of this paper. The simulation was conducted with a simple street pole which was collided with a car shell body. While the initial analysis highlighted the deformations of street light street poles after vehicle impact, the simulation needed to be further improved by adding additional rigidity. This can be achieved through the inclusion of the tires and the vehicle’s internal components. This reference is also used to validate the paper’s results as well as to improve other factors of this topic such as varying collision types and materials of the pole.
Other influences on this current study and the methodologies of this paper’s simulation models are credited towards the works conducted by Long et al. [3], Baranowski and Damaziak [13], Elmarakbi et al. [14], and Deb [7]. Firstly, the reference of Gopalakrishna et al. [2] details the collision of a vehicle’s shell impacting a rigid street pole to understand the worst-case scenario on the deformation of the shell. This paper produces a good insight on understanding which material is well suited for a vehicle’s shell to absorb large energies transferred during the impact. However, there is no study on how the magnitude of the impact changes if the street pole was declared to be a deformable body rather than a rigid one. This is important as it clarifies if the street pole’s material, the coefficient of friction between the street pole and the vehicle, and the shearing between the two objects might deviate the results of the crashworthiness analysis. Furthermore, other important parameters, such as the mass of the overall shell structure, were not included in the model. It is unsure whether the paper uses the mass of the body or has added a point mass to imitate the total momentum of the vehicle before a crash occurs. Therefore, with the lack of momentum in this simulation model, the impact’s energy results in this reference are believed to be lesser than the results of actual impact analysis.
A crashworthiness model presented in a paper authored by Long et al. [4] uses the explicit dynamics method to model the deformation of the side panel of a vehicle onto a street pole at a velocity of 8 m·s−1. Some key aspects from this paper include the contribution of other components in the vehicle that also absorb the impact energy from the collision. However, as is the case highlighted in the reference published by Gopalakrishna et al. [2], the car did not include mass properties. However, the author did justify that this was so that frictional losses would be neglected in the simulations. Another important note that was mentioned in this reference was that the crash was carried out on a street pole with rigid body properties while the car shell’s material only included the elastic properties. This means that the actual results may differ from the results published in this reference. It is imperative that the study in this paper should include a street pole that has a deformable shell on its geometry as well as elastic-plastic properties on both the car and the pole so that realistic results can be obtained to accurately understand the damage that occurs to both the car and the street pole. Overall, it is predicted that actual deformations of the vehicle’s shell are slightly lower than the results shown by Long et al. [4], since both the street pole and vehicle will be considered deformable. Therefore, the impact energies will be spread according to the models’ mechanical properties compared to the energies being applied dominantly on the vehicle due to the pole’s rigid body properties.
A similar model presented by Wang et al. [15] that simulates a vehicle’s collision with a street pole via a side crash is compared to the model proposed by Long et al. [4]. The results show that there are consistent similarities in the deformation of the vehicle after the crash. Long’s paper suggests that the vehicle door impact created deformations of about 215 mm as the vehicle impacts a rigid street pole. Wang’s paper demonstrated that at the Level 2 and Level 3 references of the car’s door panel, the deformations of the vehicle reached 300 mm. The differences exist due to the difference in reference material for the door panel, where Wang’s simulation had a vehicle based on a steel type while Long’s simulation was made from aluminum alloys. However, Wang et al. [15] also includes a side impact simulation with both parts (the car and street pole) being deformable structures. From this paper, the results show that there is about 215 mm of deformation on the vehicle, further proving that deformation values would be lower if Long’s simulation did not include rigid body properties on the steel pole.
Two crashworthiness models conducted by Samaan and Sennah [16] and Elmarakbi et al. [14] were also analyzed in order to support the objectives of this project. Using the finite element method, Samaan and Sennah [16] were able to extract results of the internal energy absorbed by the street pole on various boundary conditions. The internal energies for a street pole being collided by a vehicle under fixed boundary conditions should be expected to be around 20 MJ. Since the model presented in this paper contains a fixed boundary condition placed on the base of the street pole, the results of the internal energy produced by Samaan and Sennah [16] will have to be compared to prove that validation has been conducted. The internal energy that is absorbed by the street pole in this paper will be compared to the internal energy data provided by Samaan and Sennah [16]. Further validations by comparing the deformation results of the street pole after collision to the results published by Elmarakbi et al. [14] will also be conducted to further complement the results’ accuracy. Therefore, after a thorough literature study of previous simulations and experiments of similar crashworthiness analysis, we extracted results such as the absorbed energy of the street pole as well as the deformations of the street pole after impact to prove validation and build on the accuracy of using such models to virtually resemble experimental scenarios.

3. Methodology

3.1. D Model

The main components of the vehicle that was modeled are the car hood, an equivalent shape of the interior engine components, and the wheels. The model was built in CATIA V5-6R2020 to utilize the advanced surfacing tools for the car’s complexed shape. Firstly, the overall dimensions of the car’s hood are roughly 1.25 m × 1.41 m × 0.48 m in length, width, and height, respectively. Interior features and a few exterior features are excluded from the model due to their insignificance to the column-focused scope of this study. The body was created as a “shell” with the actual thickness to be assigned in Abaqus CAE. Generative Shape Design workbench was used to create all surface features. Symmetry was utilized in the model creation, and the final topology after applying symmetry is shown in Figure 2.
The other components that are included in the car model are the wheels and the interior components. These were designed to represent rigidity for the vehicle, as explained in Section 2.2. The engine and the bar supporting the engine were modeled as solids, and the tire was modeled as a shell. The graphical representation of these components can be found in Figure 3. These models were also designed using the CATIA V5-6R2020 solution.
Another main component of this simulation, aside from the vehicle itself, is the impacted street pole. The pole’s geometry is based on a 22-metre street light pole that is commonly found along the national highways of GCC countries. The dimensions of the street pole were declared according to recommendations provided by the Municipality of Kuwait City through the forms of blueprints and engineering diagrams. Other important parameters of the street pole included the thickness of the street pole, which was stated to be 5.5 mm thick, as well as the diameter, which was about 250 mm. The graphical representations of the street pole’s geometry can be viewed in Figure 4. Due to the simplicity of this geometry, the model was created within Abaqus/CAE.

3.2. FEA Model

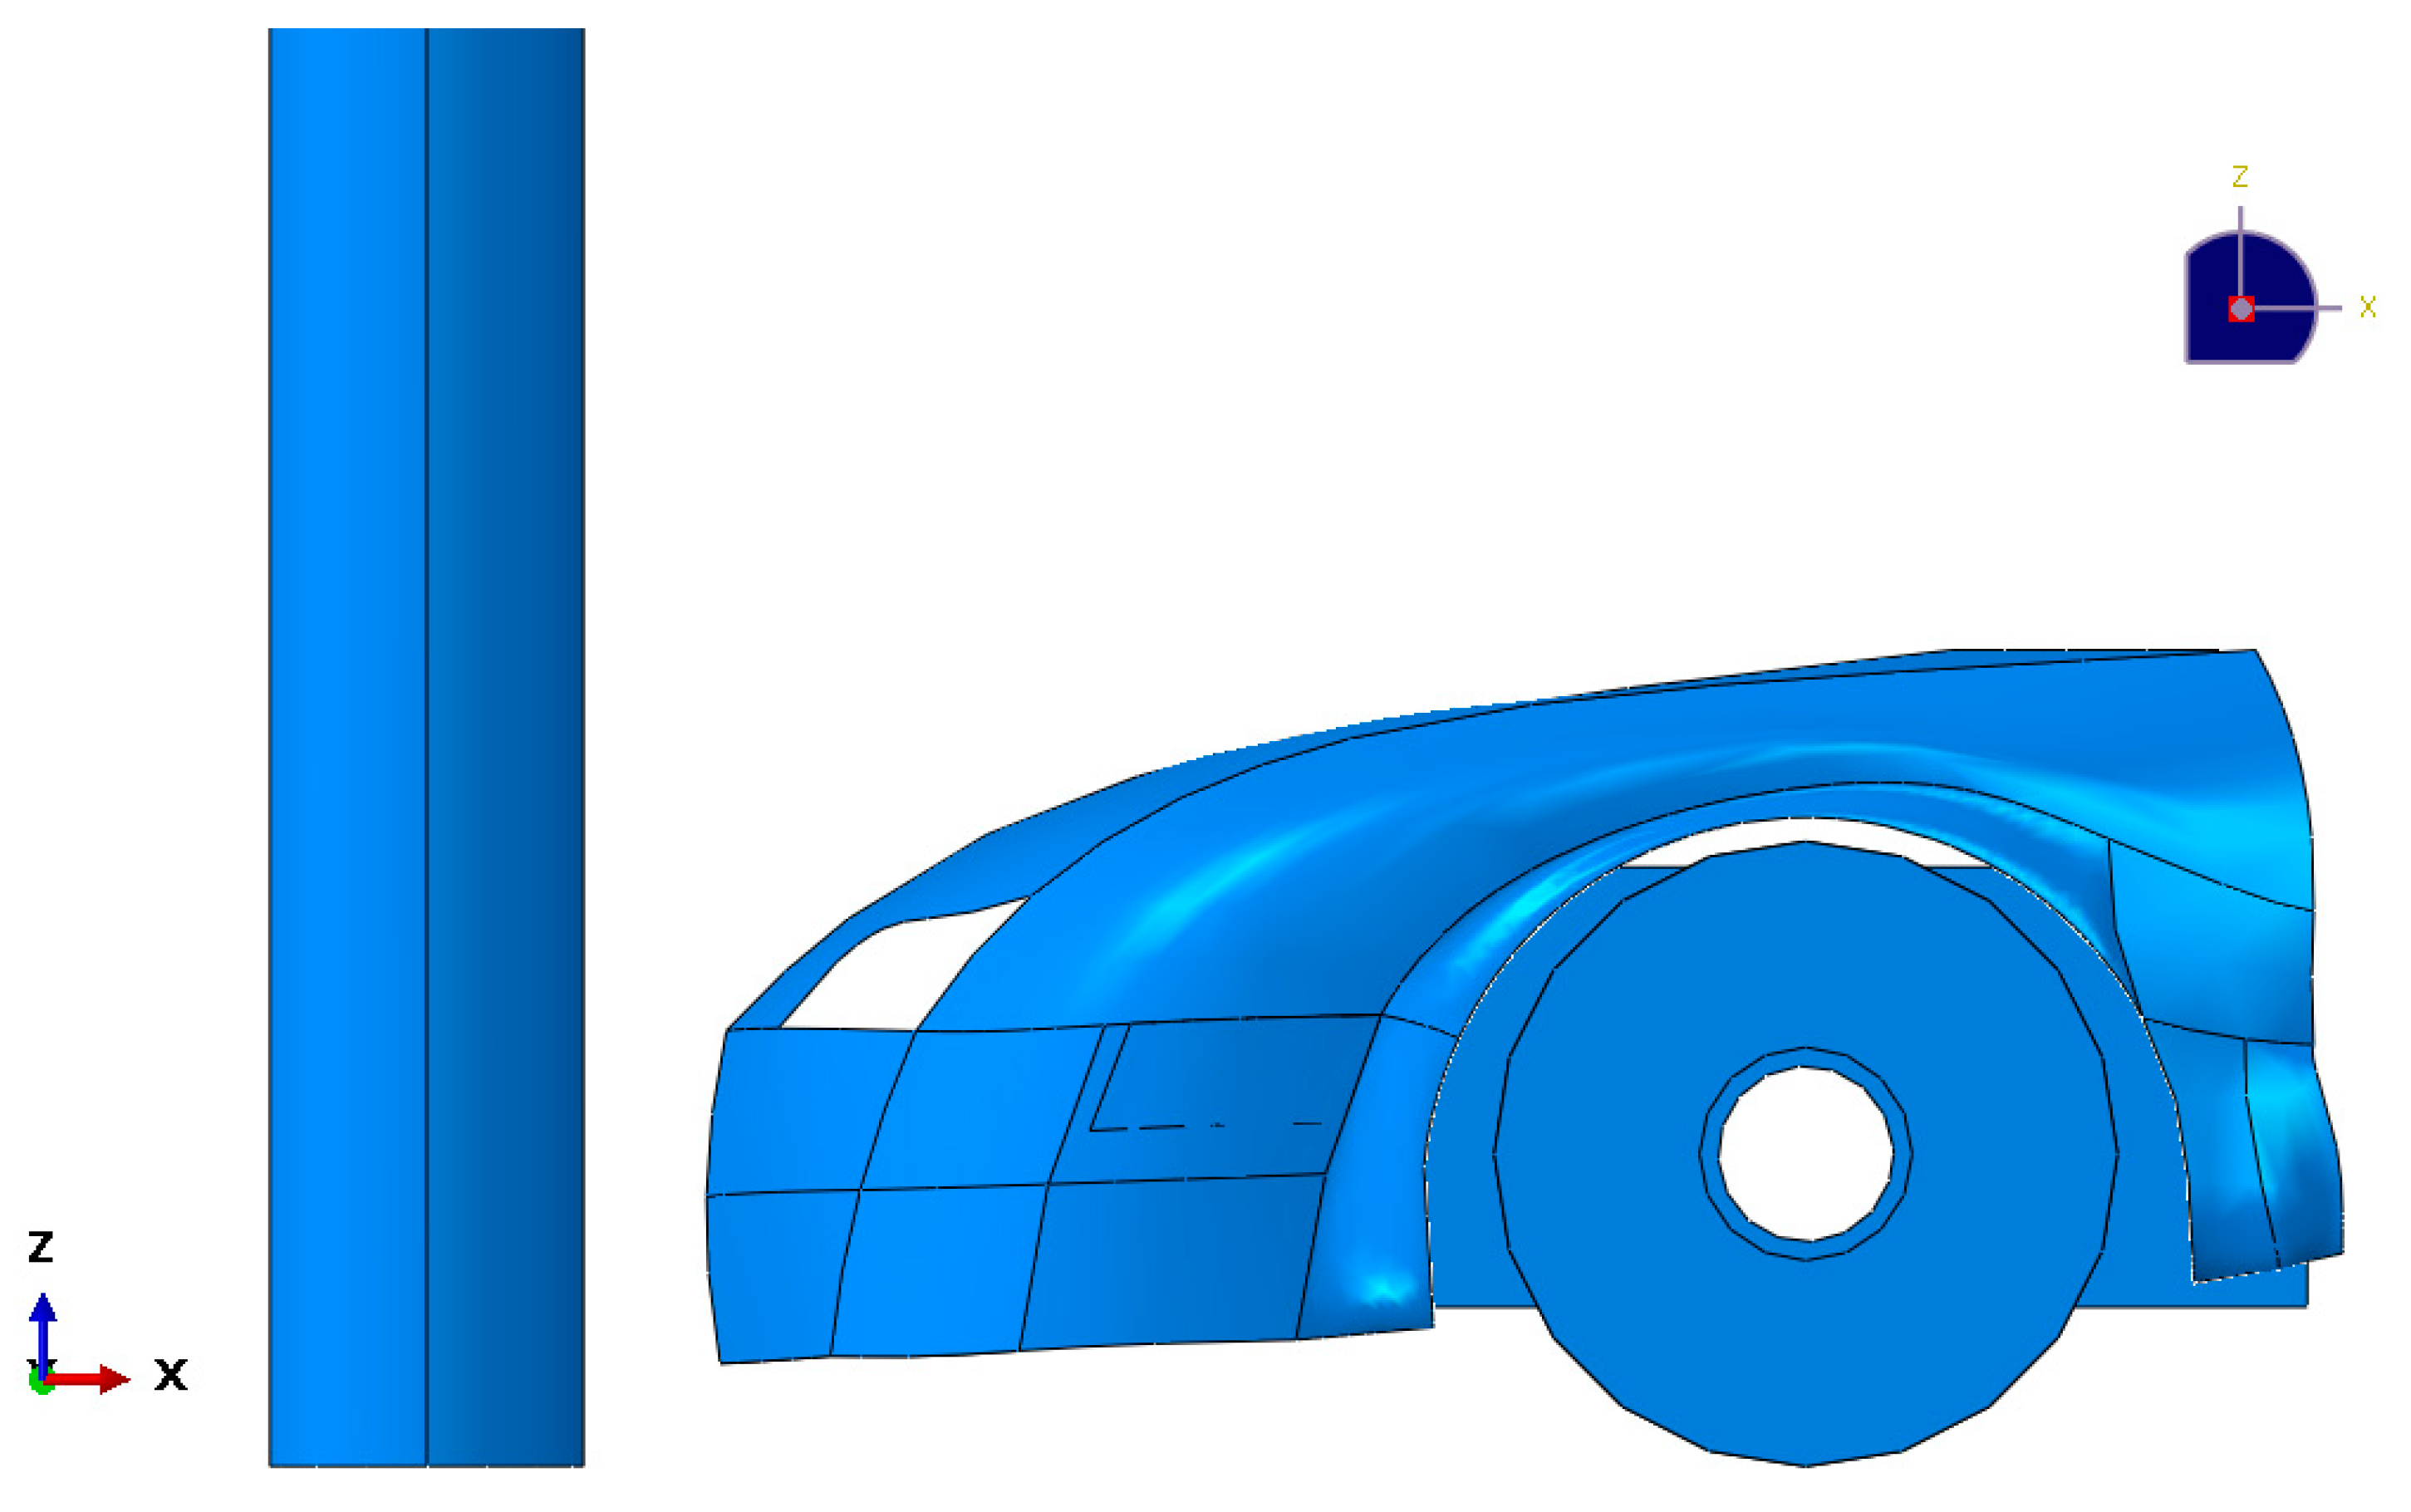
For the project to meet the regulative standards of car collisions, two types of collisions had to be modeled using the Abaqus/Explicit FEA solver: front and corner. Figure 5 highlights the images for each of the simulations.
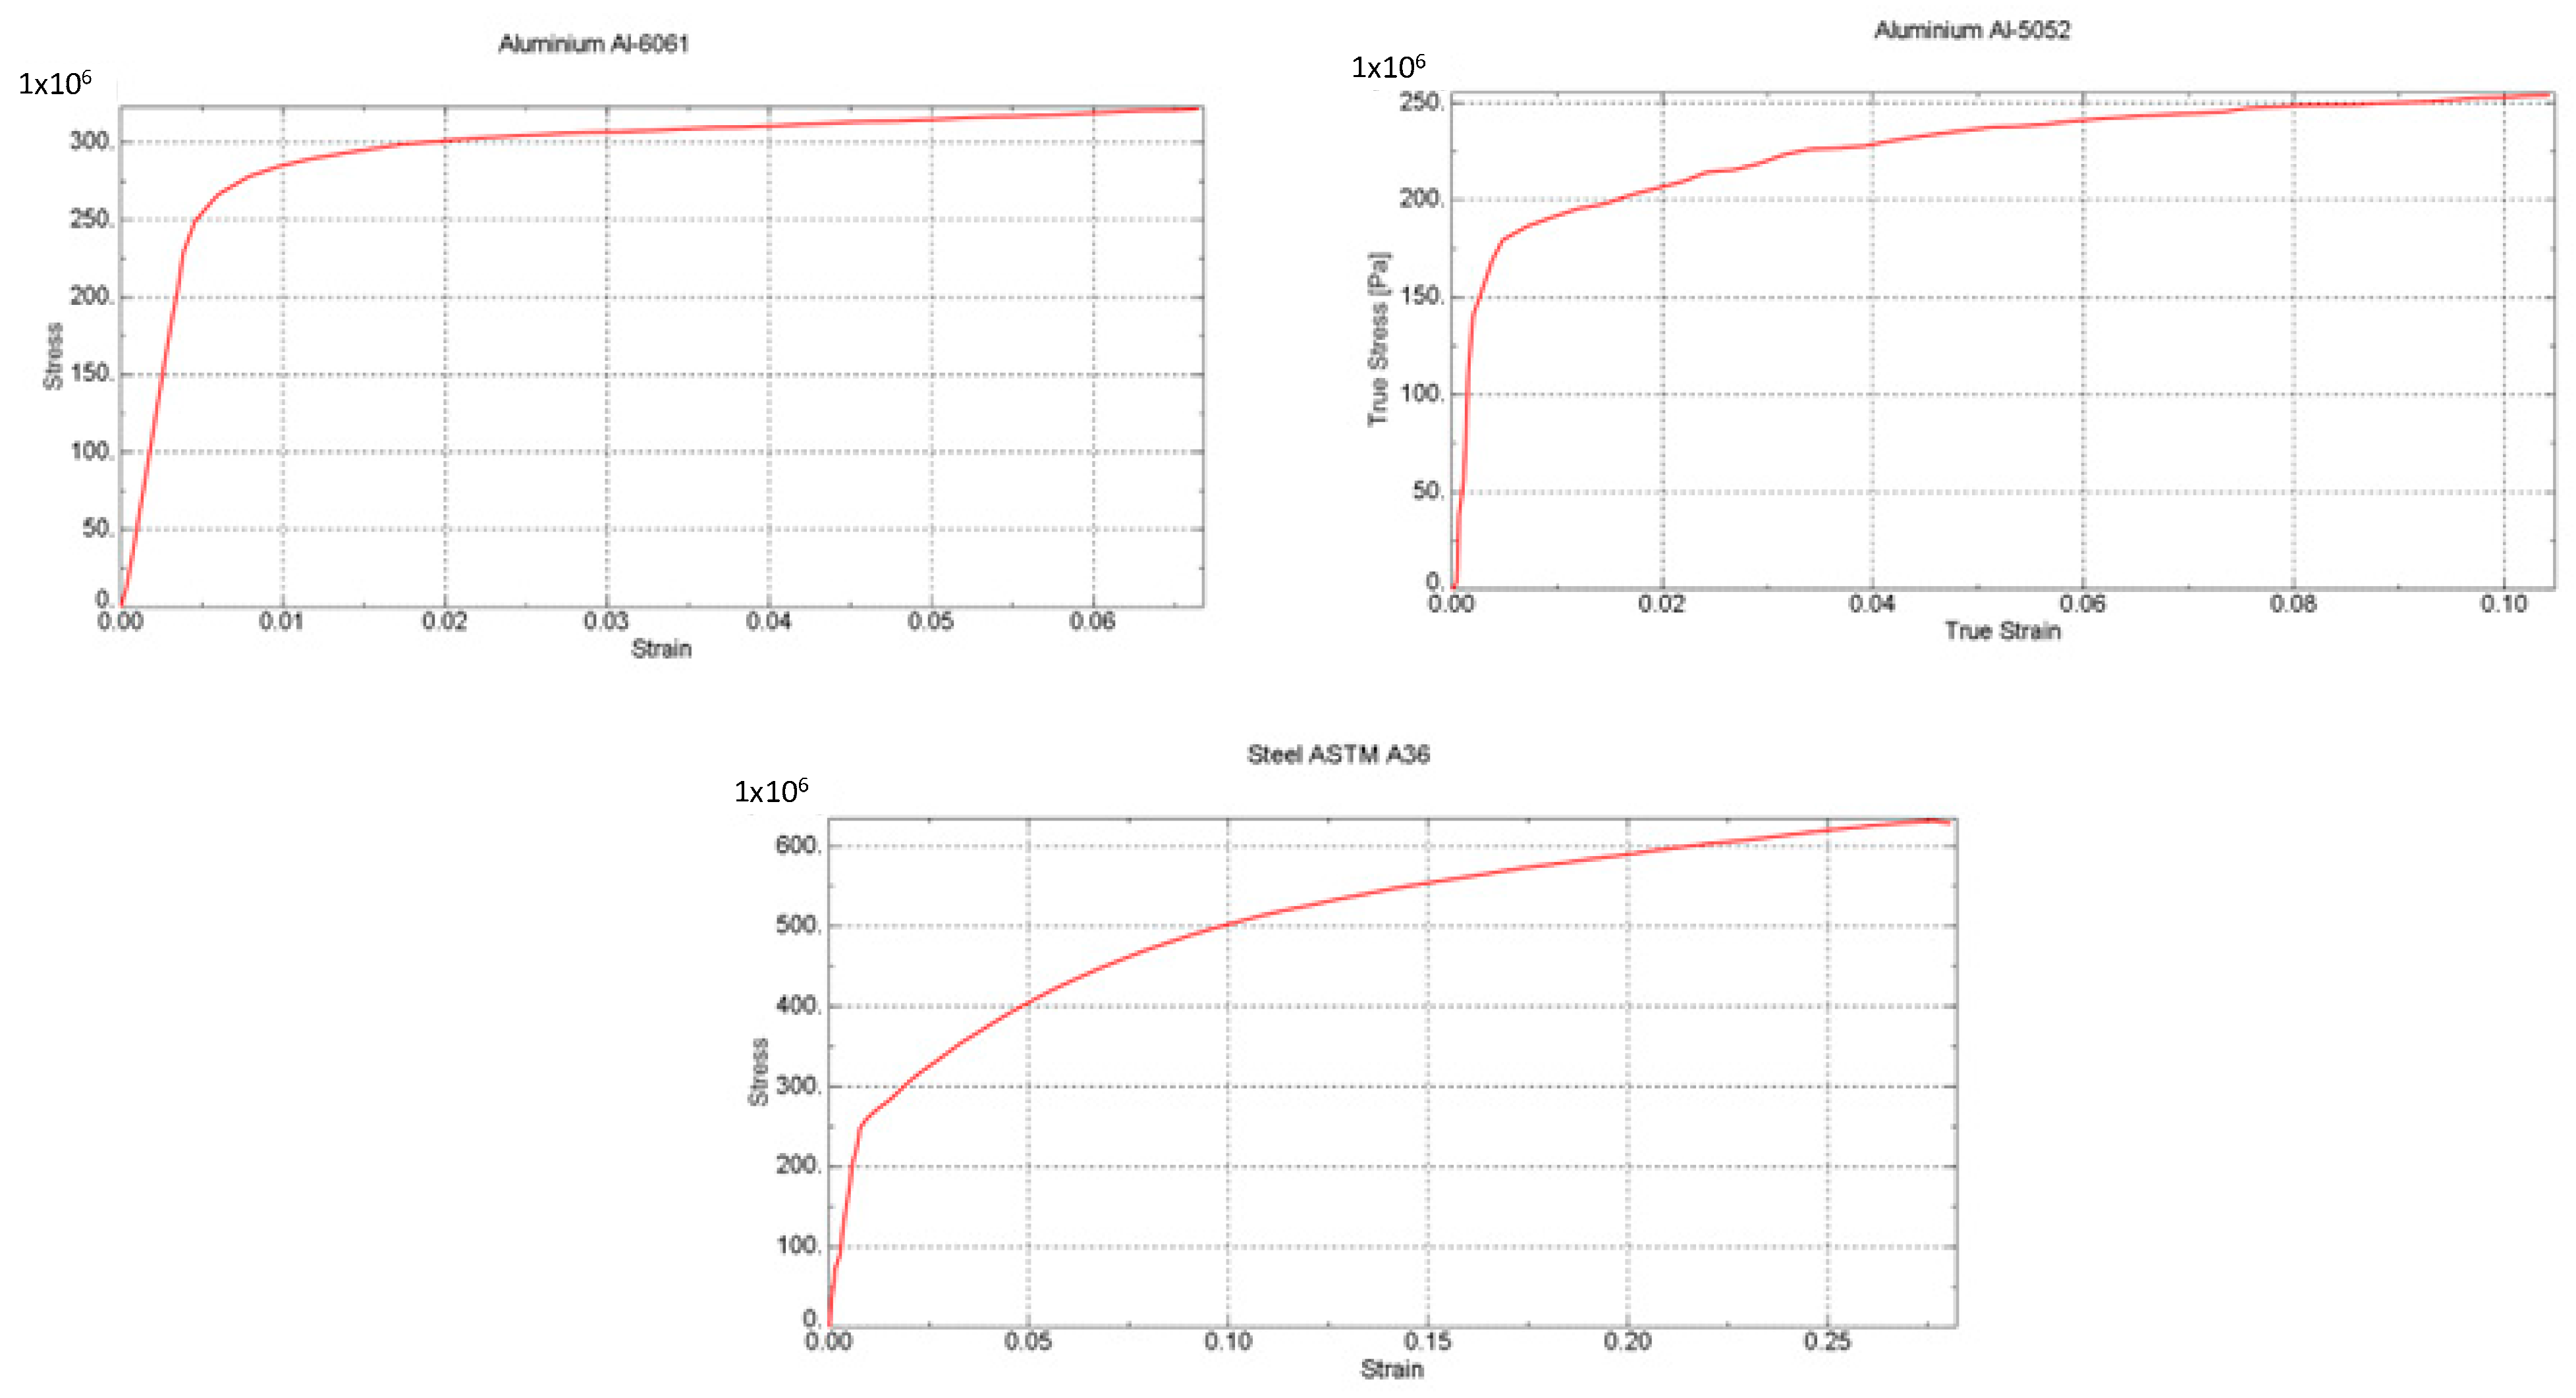
Initially, the CAD model of the car, discussed in Section 3.1, was imported as a deformable shell with an overall thickness of 2.5 mm to reflect the thickness of industry standard vehicles. The material of the shell was of an aluminum grade, Aluminum-5052, which is primarily used for sheet metal of car exteriors. However, the internal component of the vehicle was composed of a stronger Aluminum-6061 alloy. The reason why this specific grade was chosen is because unlike the vehicle’s shell, the internal component of the vehicle contains highly dynamic components such as pistons, gears, and shafts. There are other static parts such as the vehicle’s chassis, engine casings, and transmission casing that are usually made up of stronger aluminum alloys and should be accounted for in this model. Thus, the Al-6061 grade was chosen as it can withstand higher stresses than Al-5052 before yielding. The simulations involving steel-based street poles has been assigned with ASTM A36 grade properties while Aluminum-6061, as discussed previously, is also used for the aluminum-based street poles. To ensure that the impact simulation behaves as realistically as possible, the material definitions also include damage properties. Both the car and the street pole have been defined using ductile damage. The reason why ductile damage is used is because damage in metals such as aluminum and steel propagate from two mechanisms—either through nucleation or propagation of an initial damage, or through excessive shear damages (Dassault Systèmes [17]). To accurately extract initial damage, the critical fracture strain of each metal is required. To model the propagation of damage, the damage evolution for each specimen is also needed. According to Dassault Systèmes [17], to ensure accurate damage evolution, mesh element sizing must be optimal as the accuracy of the damage evolution depends on the material’s mechanical characteristics and the size of each mesh element. Finally, as the simulation requires the explicit dynamics solver, the densities of the three materials are required. All properties of the three materials are shown in Figure 6 as well as in Table 1 and Table 2.
Frictionless interaction has been declared throughout the simulation. This was chosen as the dynamics (magnitude of velocity), and the scale of the model was large enough to not consider friction as a source for major deviation of results. Moreover, to reduce computation time, the surface pair between the reinforcement bar and the engine component was a tie surface, as the interaction between these two pairs were not of particular interest.
Only two boundary conditions were added—the street pole was completely fixed on the bottom end of its geometry to represent ground reaction effects and the velocity of the car just before impacting the street pole. The frontal crash model involves the vehicle traveling head-on towards the street pole at three different speeds: 12, 17, and 22 m·s−1. The corner crash model also travels head-on at these same speeds.
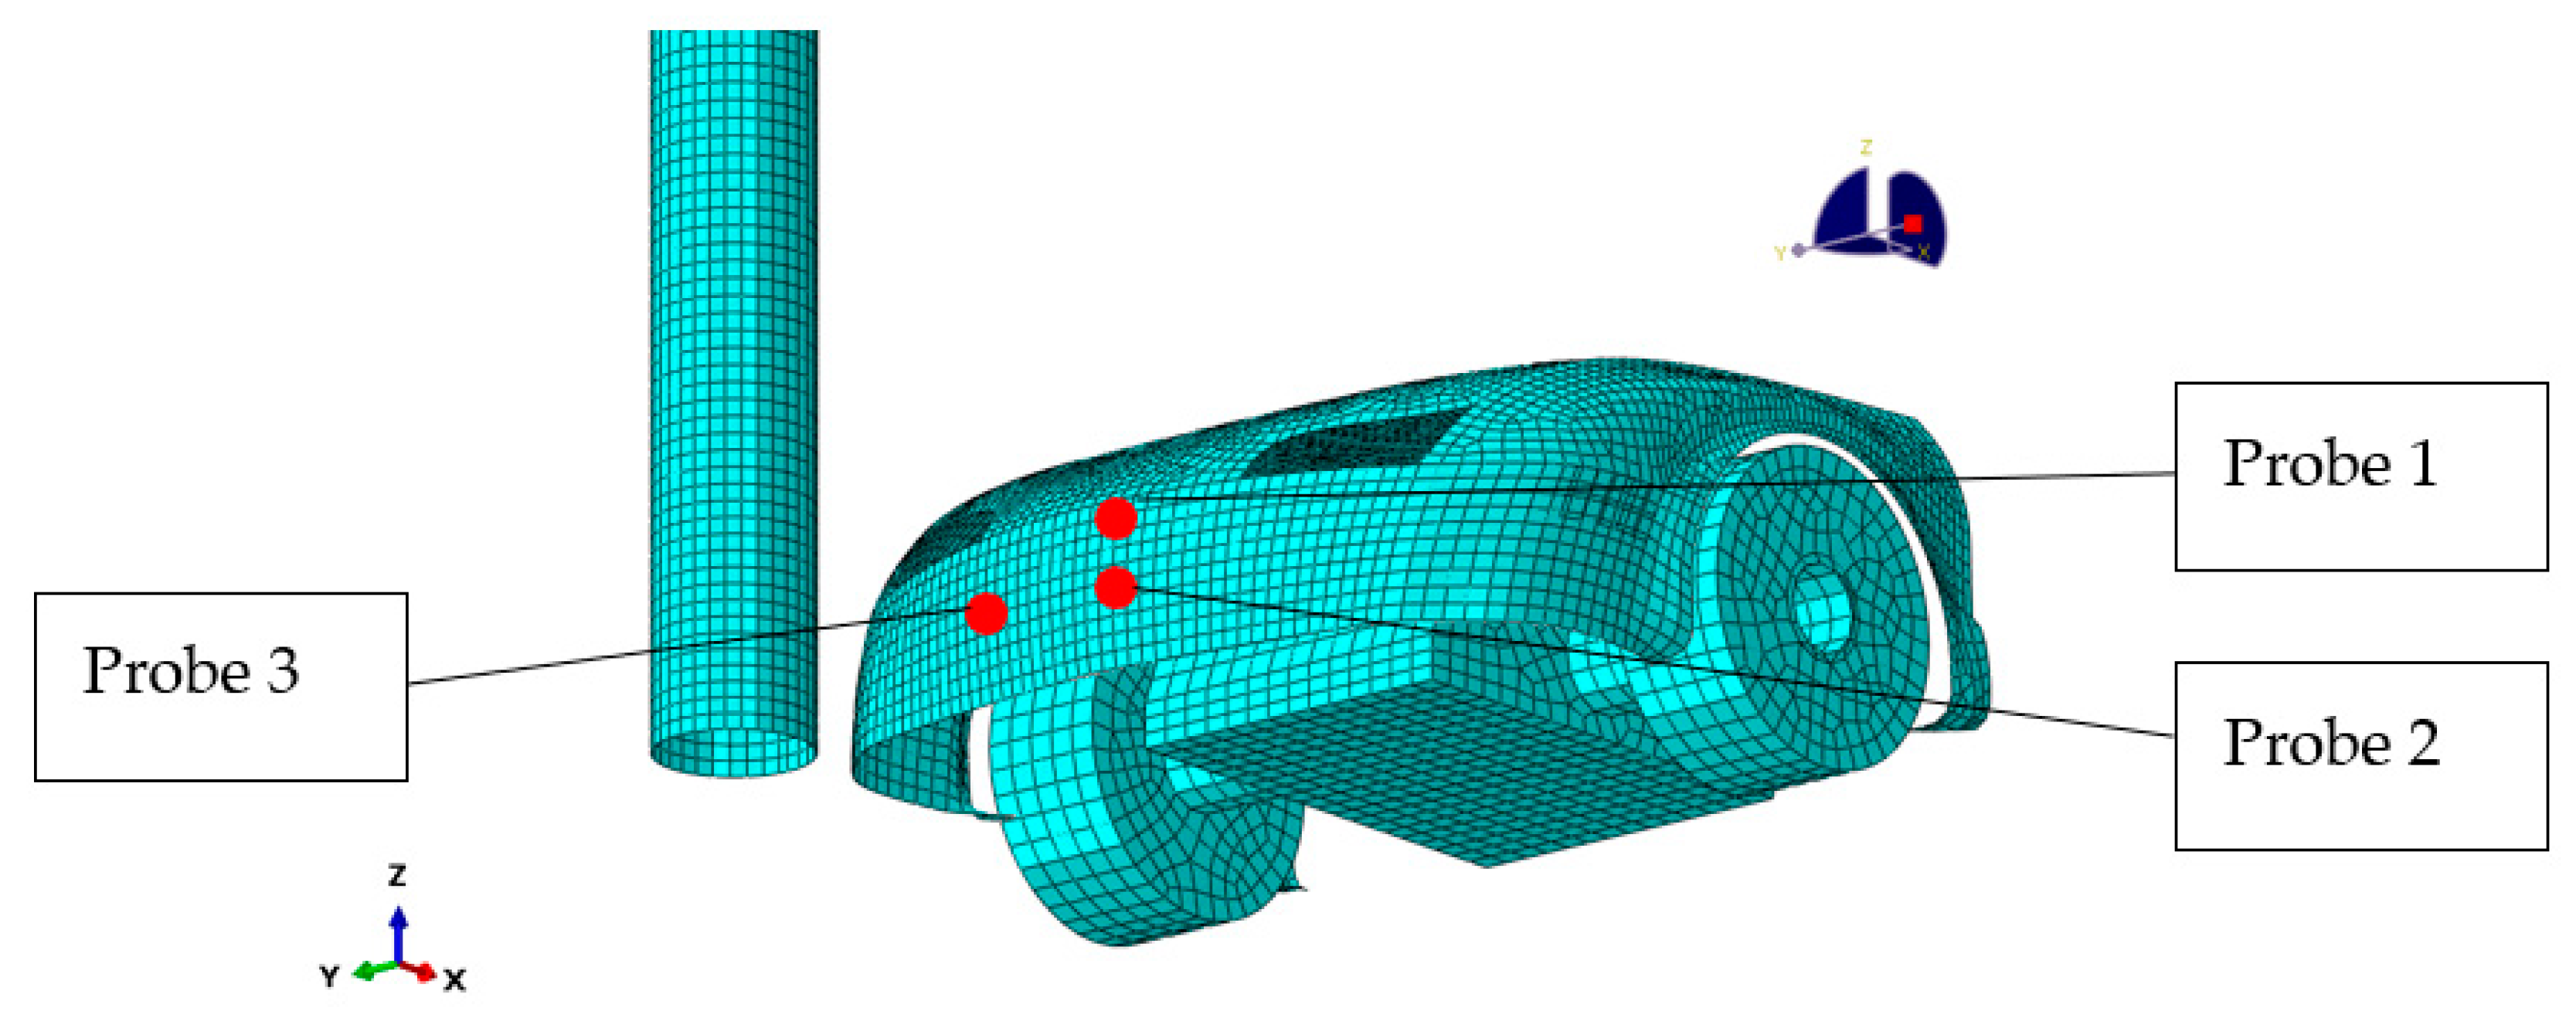
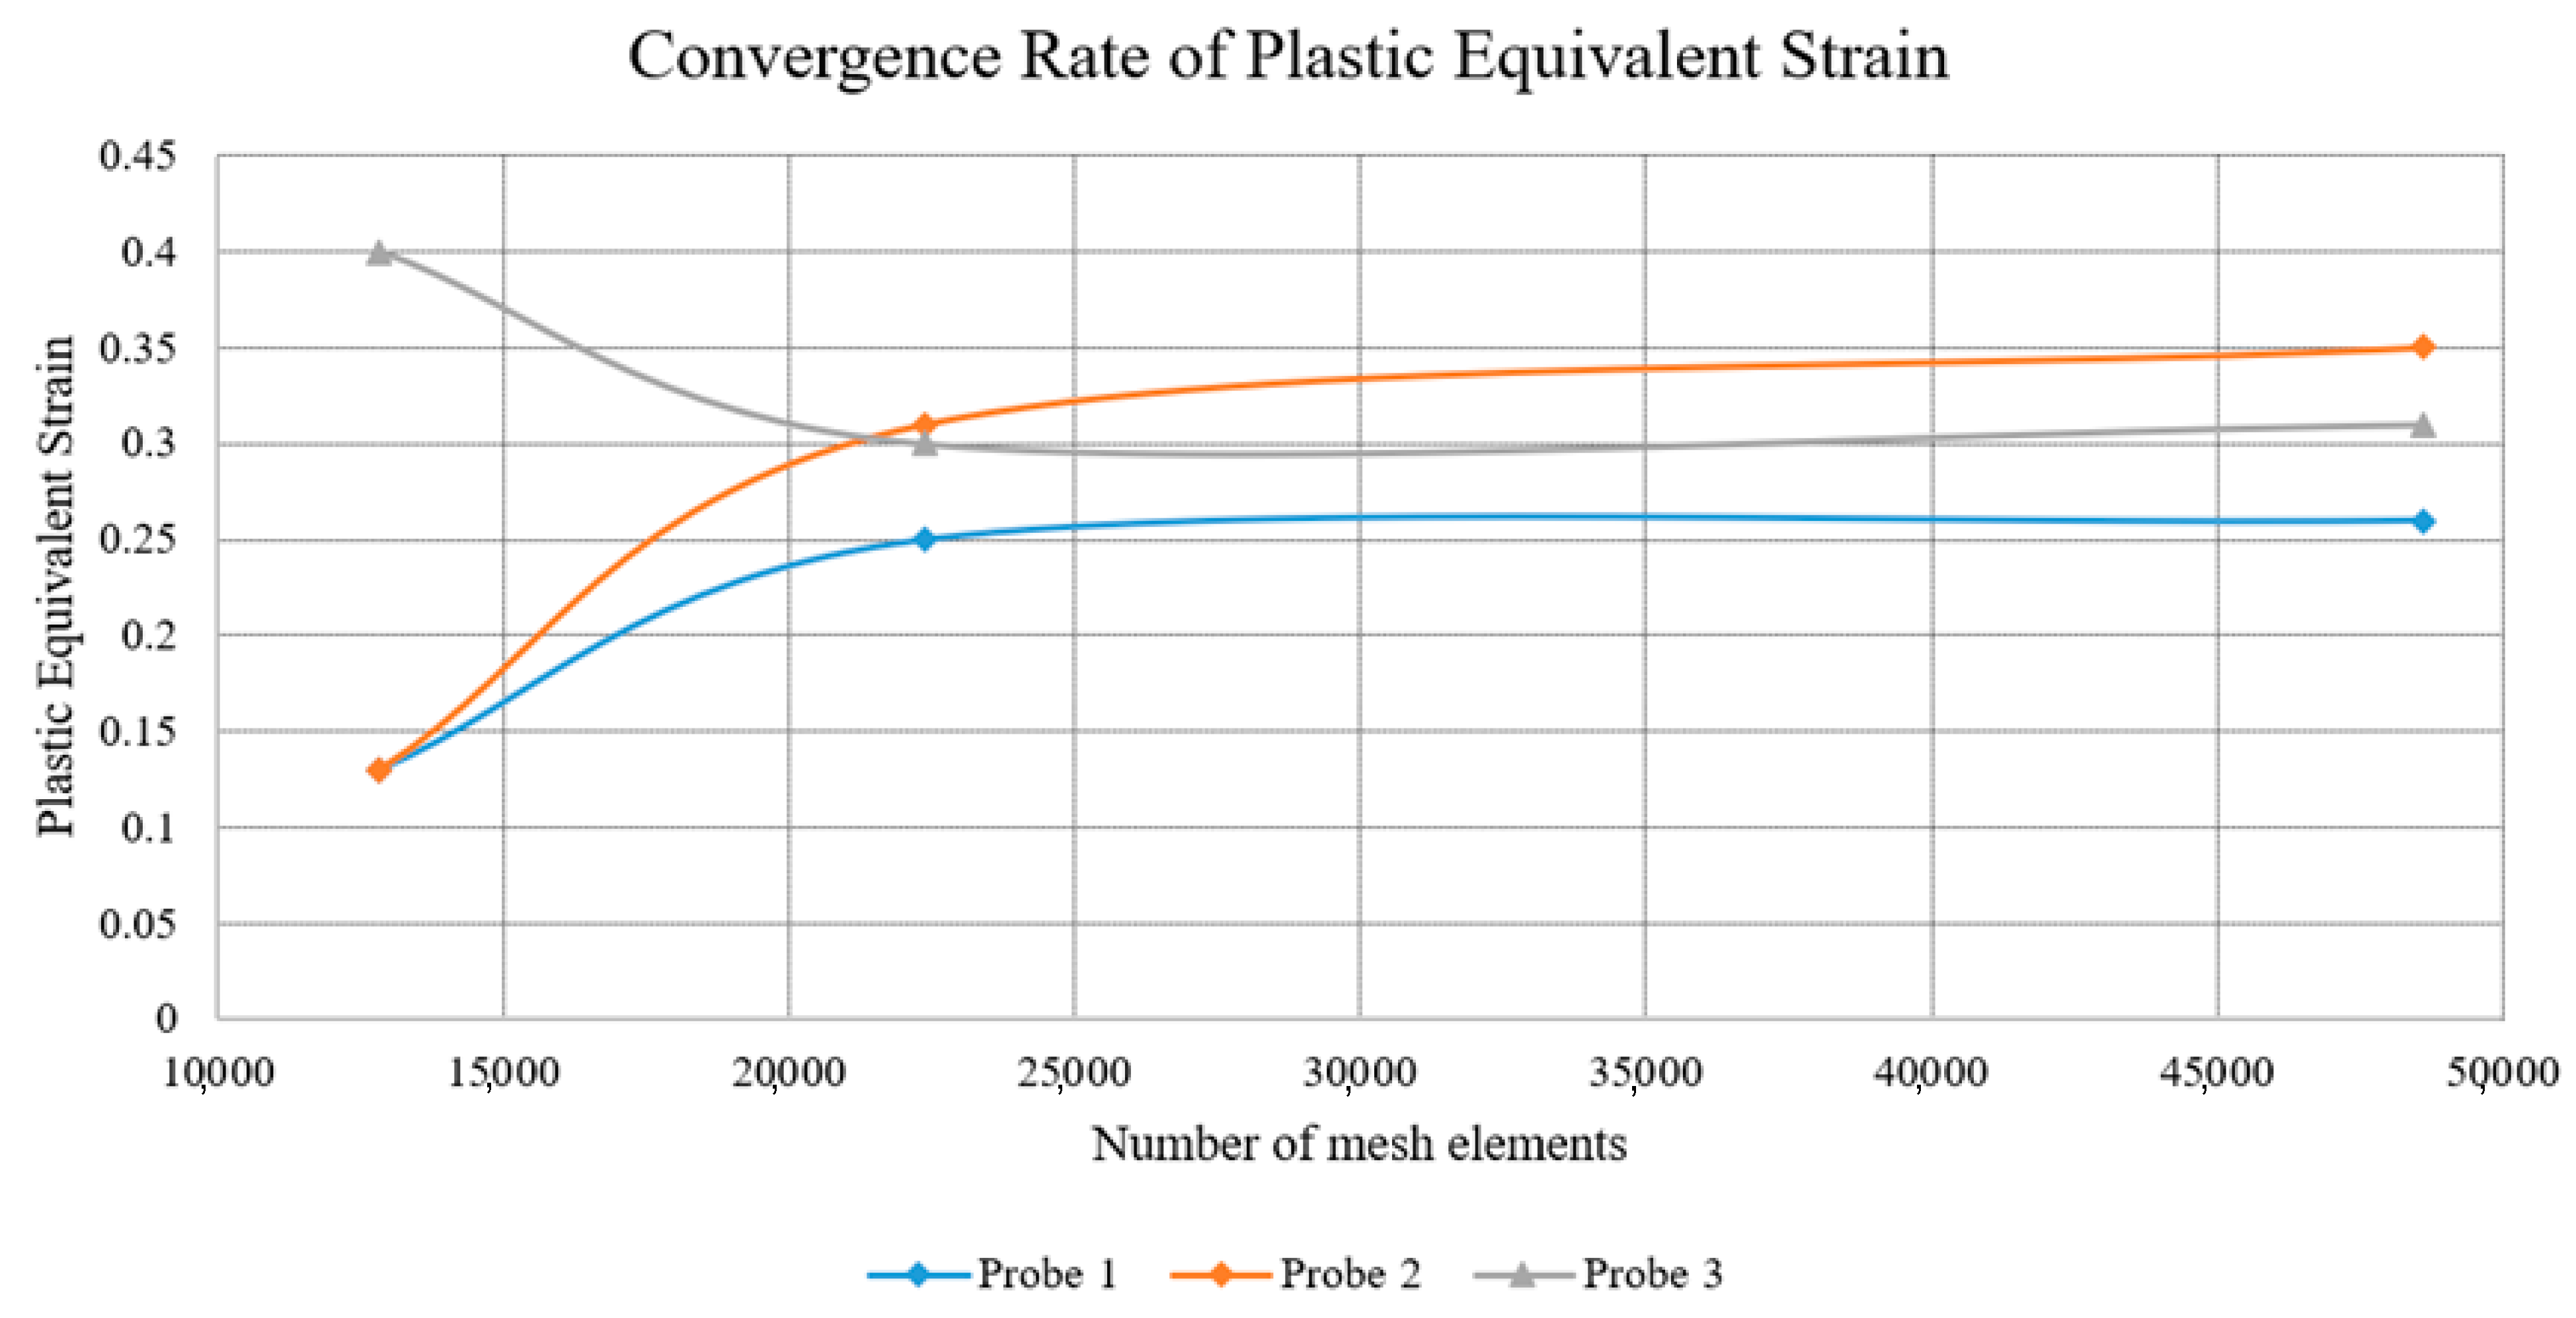
The simulation was performed using the Abaqus/Explicit solver with no mass scaling needed as the total time of the simulation to finish computing results was about 20 min per simulation. The total time of the explicit step was 0.7 s for corner impact, while the central impact had a total step time of 0.6 s. These times were decided after an initial simulation showed that the separation of the car and the street pole’s surface pairs occur during this time; therefore, any subsequent results were obsolete for the scope of this paper. The corner impact simulation is longer to compensate for the time it takes for the vehicle to initially contact the street pole. All parts were entirely meshed using linear hexahedral explicit elements for Abaqus to output suitable accuracy for the results. To reduce the distortion or exaggeration of the mesh elements, a degradation control of 0.75 was used with element deletion enabled. The total number of mesh cells required for the simulations amounted to about 22,400 elements. All shell elements were assigned with reduced integration 4-noded quadrilateral elements, S4R, while the interior solid component had 3D continuum reduced integration hexahedral elements, C3D8R. The reason why these many elements were required is dictated from a sensitivity analysis of the mesh. Three points were declared to be used as a probe. The 3 points, as seen in Figure 7, were used as these were the main regions of contact between the vehicle and the pole. Therefore, any large variations in the model suggested that values are highly sensitive and mesh refining is mandatory in these regions. The only mesh elements that were refined were the car bumper and the street pole. Other bodies in these mesh elements were not of interest and were not included in the mesh sensitivity analysis to save computation time. The plastic equivalent strain results were used to analyze the mesh sensitivity analysis, as it is expected that the accuracy of the damage or plasticity must be conserved as much as possible, regardless of mesh refinement, with minimal changes only happening due to any anomalous elements that may suffer from numerical singularities. After about 20,000 mesh cells, a convergence had taken place, as shown in Figure 8. Therefore, to maintain a good balance in providing both a qualitative and quantitative analysis, altogether, it was agreed that an optimum mesh seed of 0.025 m (equivalent to 22,400 elements) was sufficient for the model. Using the points, it was found that after using ten processors to solve the Abaqus FEA problem, each simulation took about 24 min to solve. The graphical representation of the mesh can also be seen in Figure 7.

3.3. Assumptions Considered for the FEA Model

During the time spent on the FEA study, various assumptions had to be made to either speed up the computation processes of each simulation or troubleshoot problems that could cause the paper’s scheduled deliveries to be delayed.
The first assumption for the FEA model is that no floor geometry or gravitational physics were added to this model. While Elmarakbi et al. [14] explain that the nature of soil during the impact does influence the severity of the damage, to avoid any discrepancies of this paper’s results with others’ data (who also did not consider soil effects on crashworthiness), this scope is not necessary. The vehicle’s geometry was also limited to the front of the vehicle’s body because the deformations of the shell might be exaggerated, as adding the windscreen and additional reinforcements to the shell would further increase the complexity of the simulation and subsequently increase the CPU time for computing the results. To ensure that the whole car’s momentum is applied to the partial model for the simulation, a mass point of 900 kg was added to the already 600 kg of existing mass present in the car’s assembly. The mass point was added at the rear end of the lumped interior model. Material definitions were also greatly reduced to only consider the material’s density, elasticity, plasticity, and damage parameters. Any damping factors or spring models were omitted for the scope of this paper. Shell elements were used instead of solid ones since the thicknesses of both the street pole and car shell were ideal enough to work around these element types. Since the model is a high-speed impact analysis, the model interaction properties were set to frictionless. Frictionless properties were also preferred to speed up the overall computing processes in solving one simulation.

4. Results

4.1. Impact Analysis at Speed of 12 m·s−1 (43 km/h)

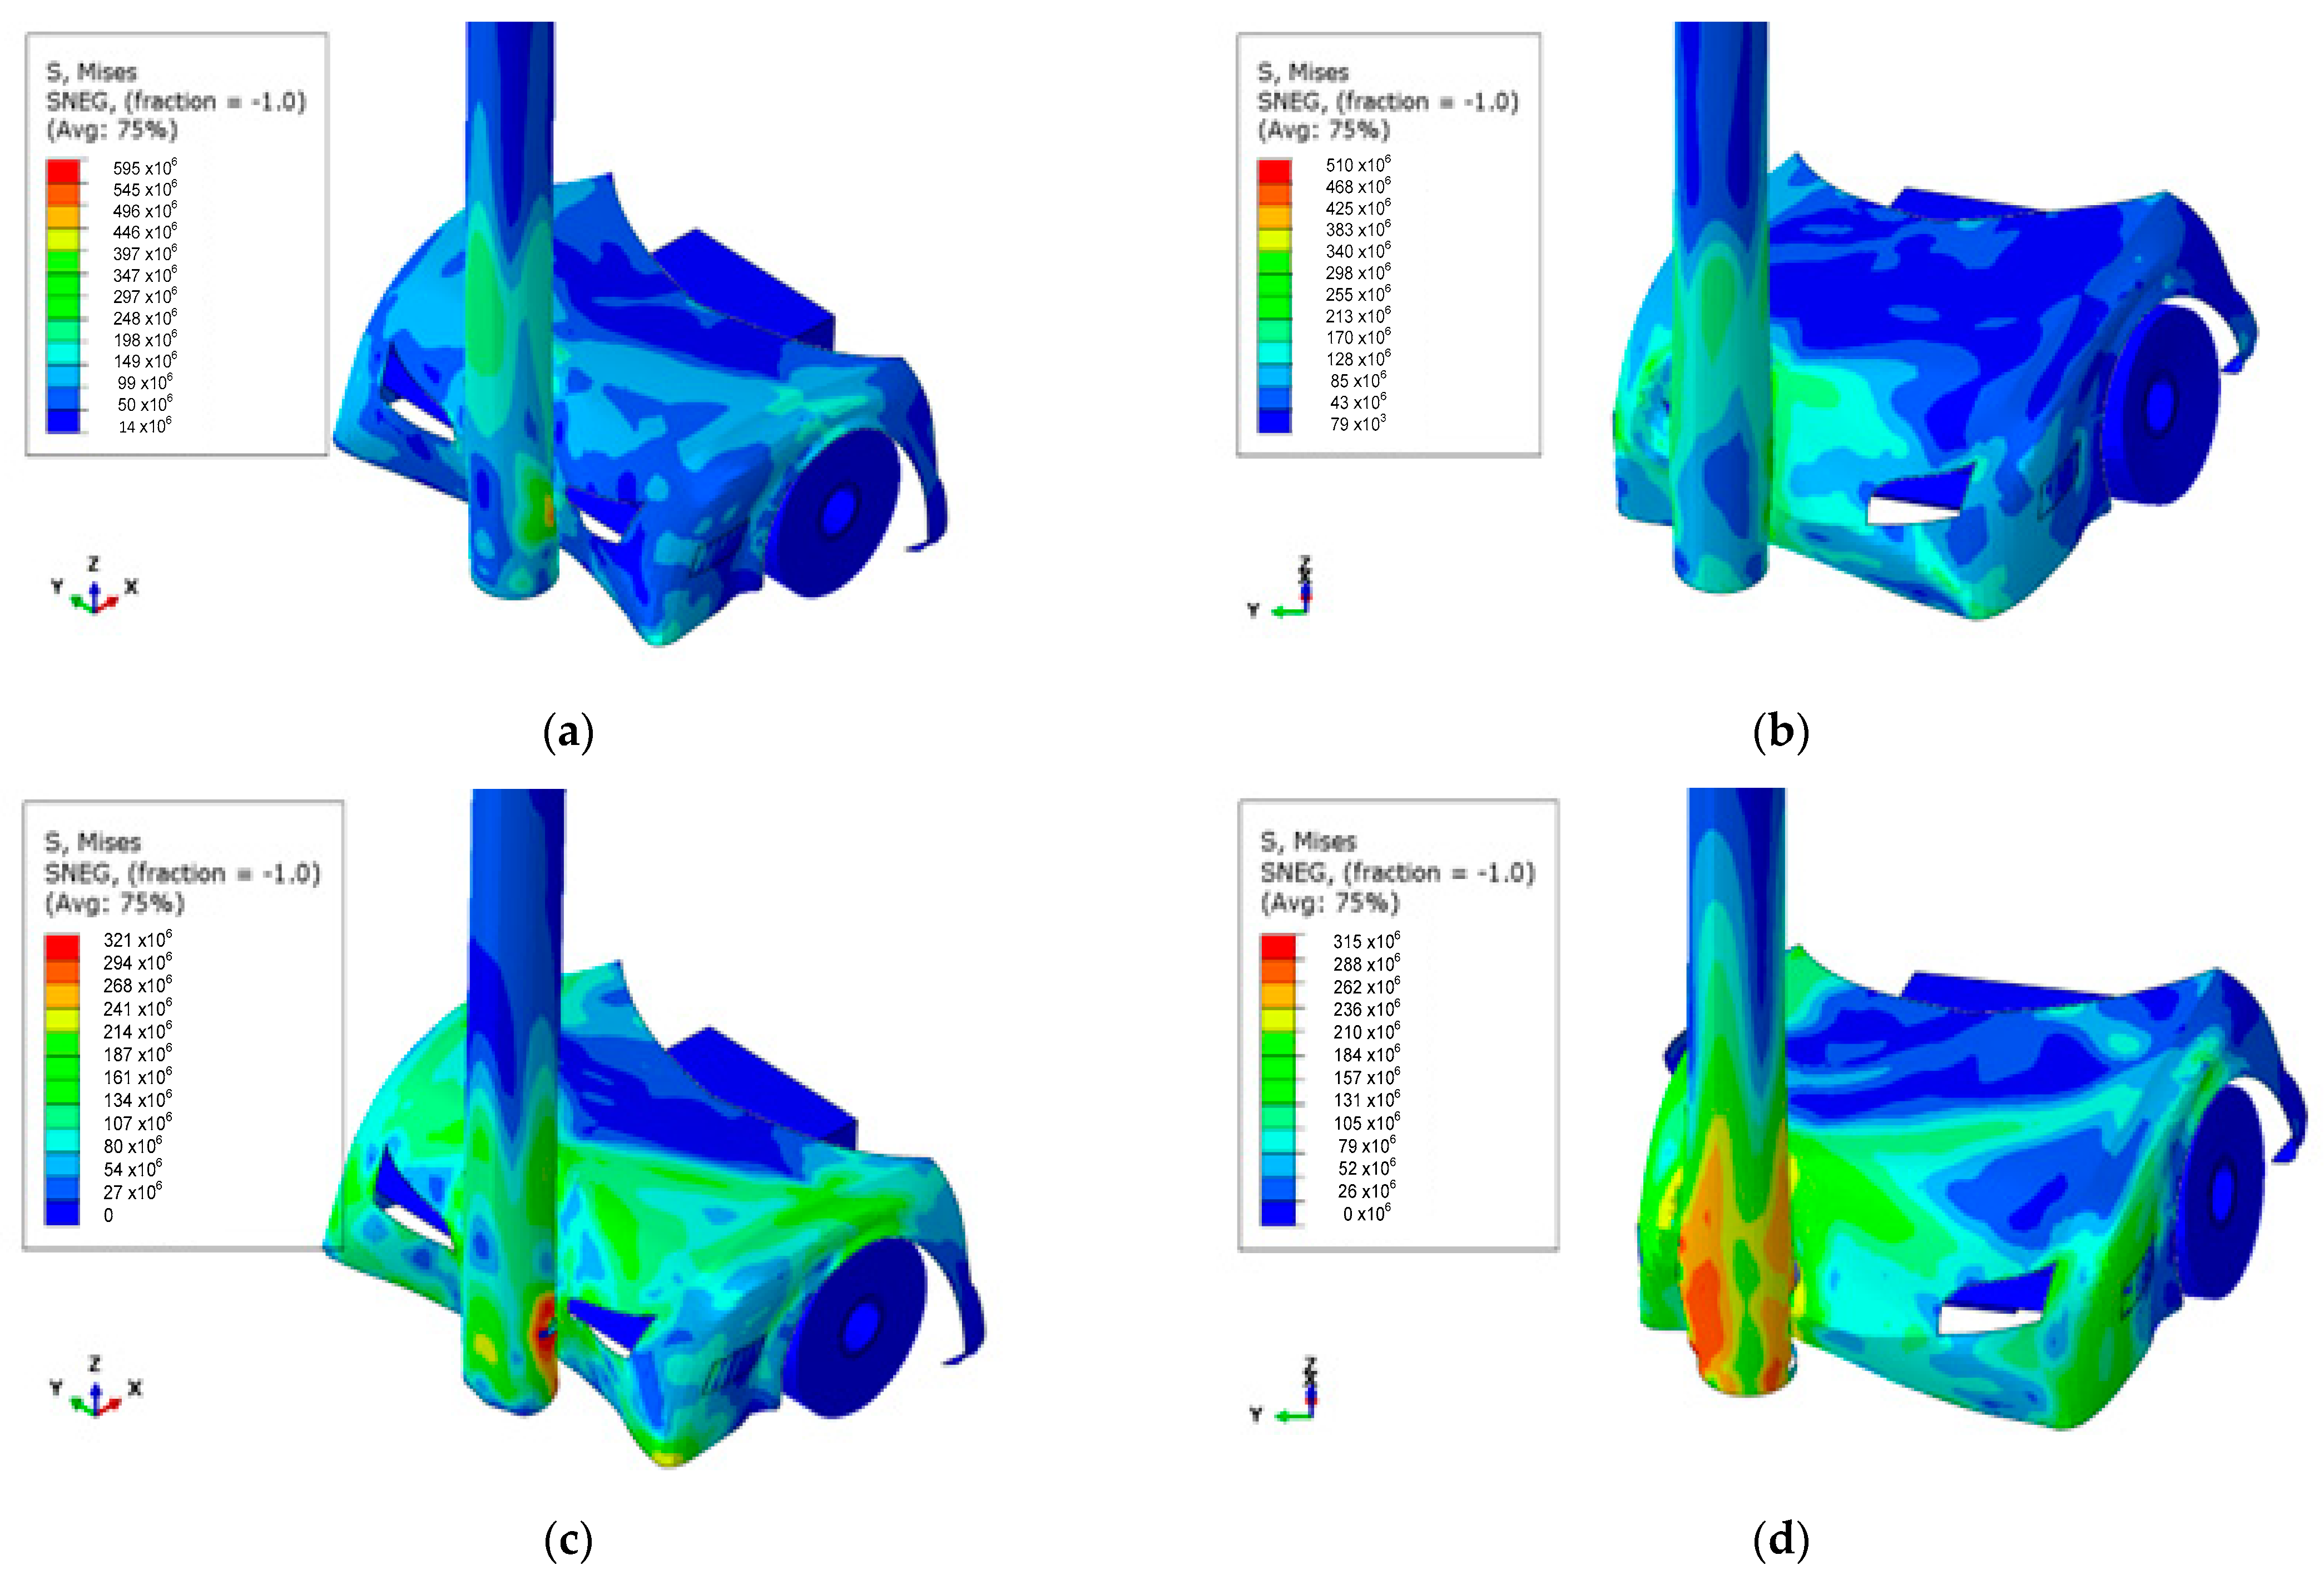
The results of the impact simulations using velocities of 12 m·s−1 show that the plasticity criteria on the vehicle’s shell were reached for both frontal and corner collisions. Moreover, the critical elastic–plasticity limit was exceeded for both materials of the street pole—steel and aluminum. It is noteworthy to also mention that for the scenario of the frontal crash on the aluminum street pole, the pole experiences excessive propagation of damage with respect to the damage parameters explained in Section 3.2. This excessive damage results in the structure being completely fractured from its base. Figure 9 represents the graphical representation of the stress distribution on both the street pole and the vehicle after impact.
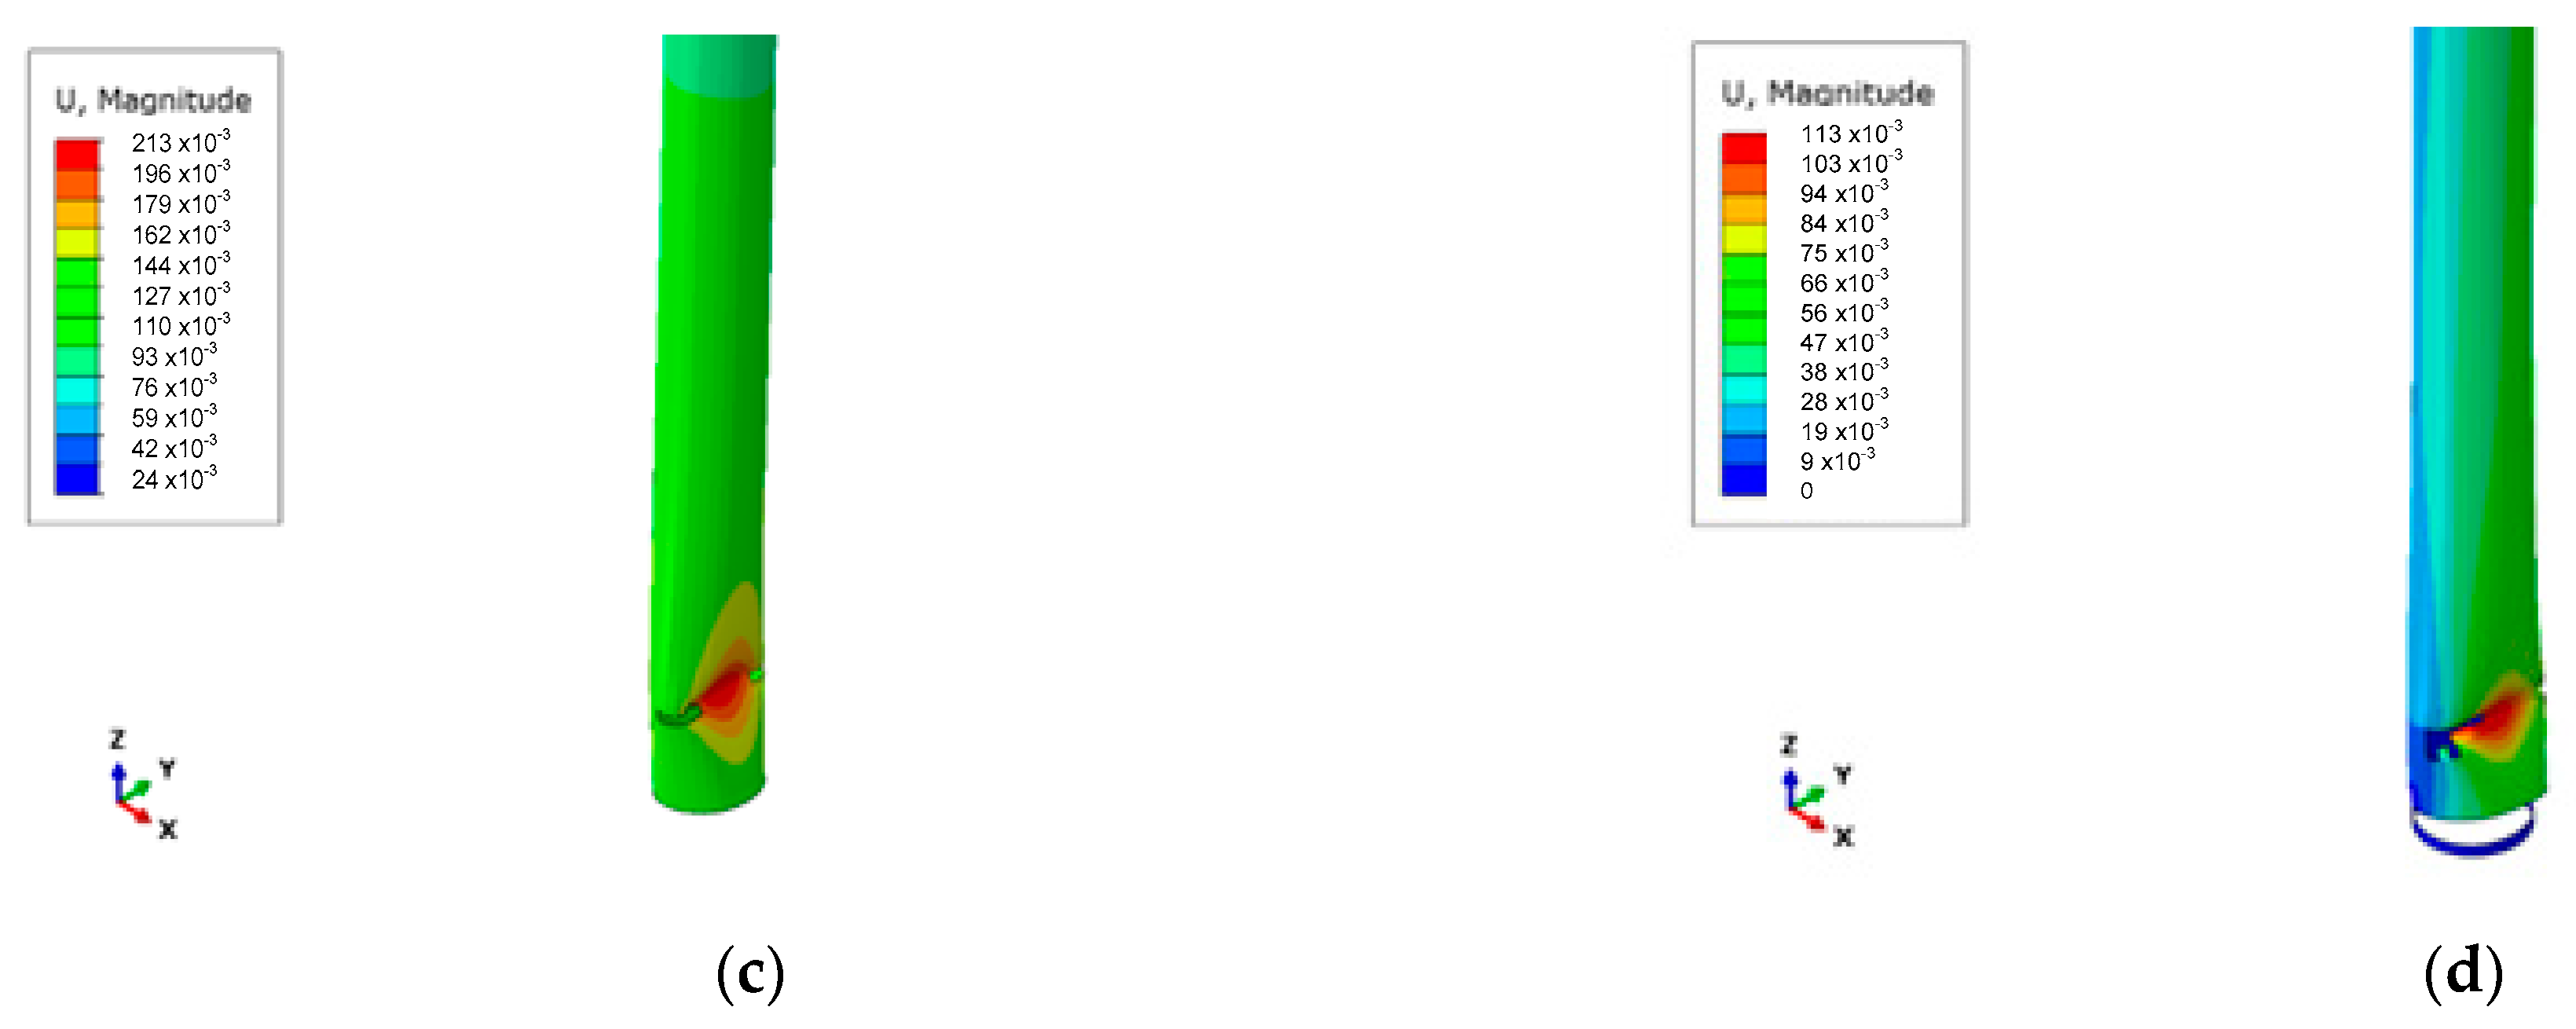
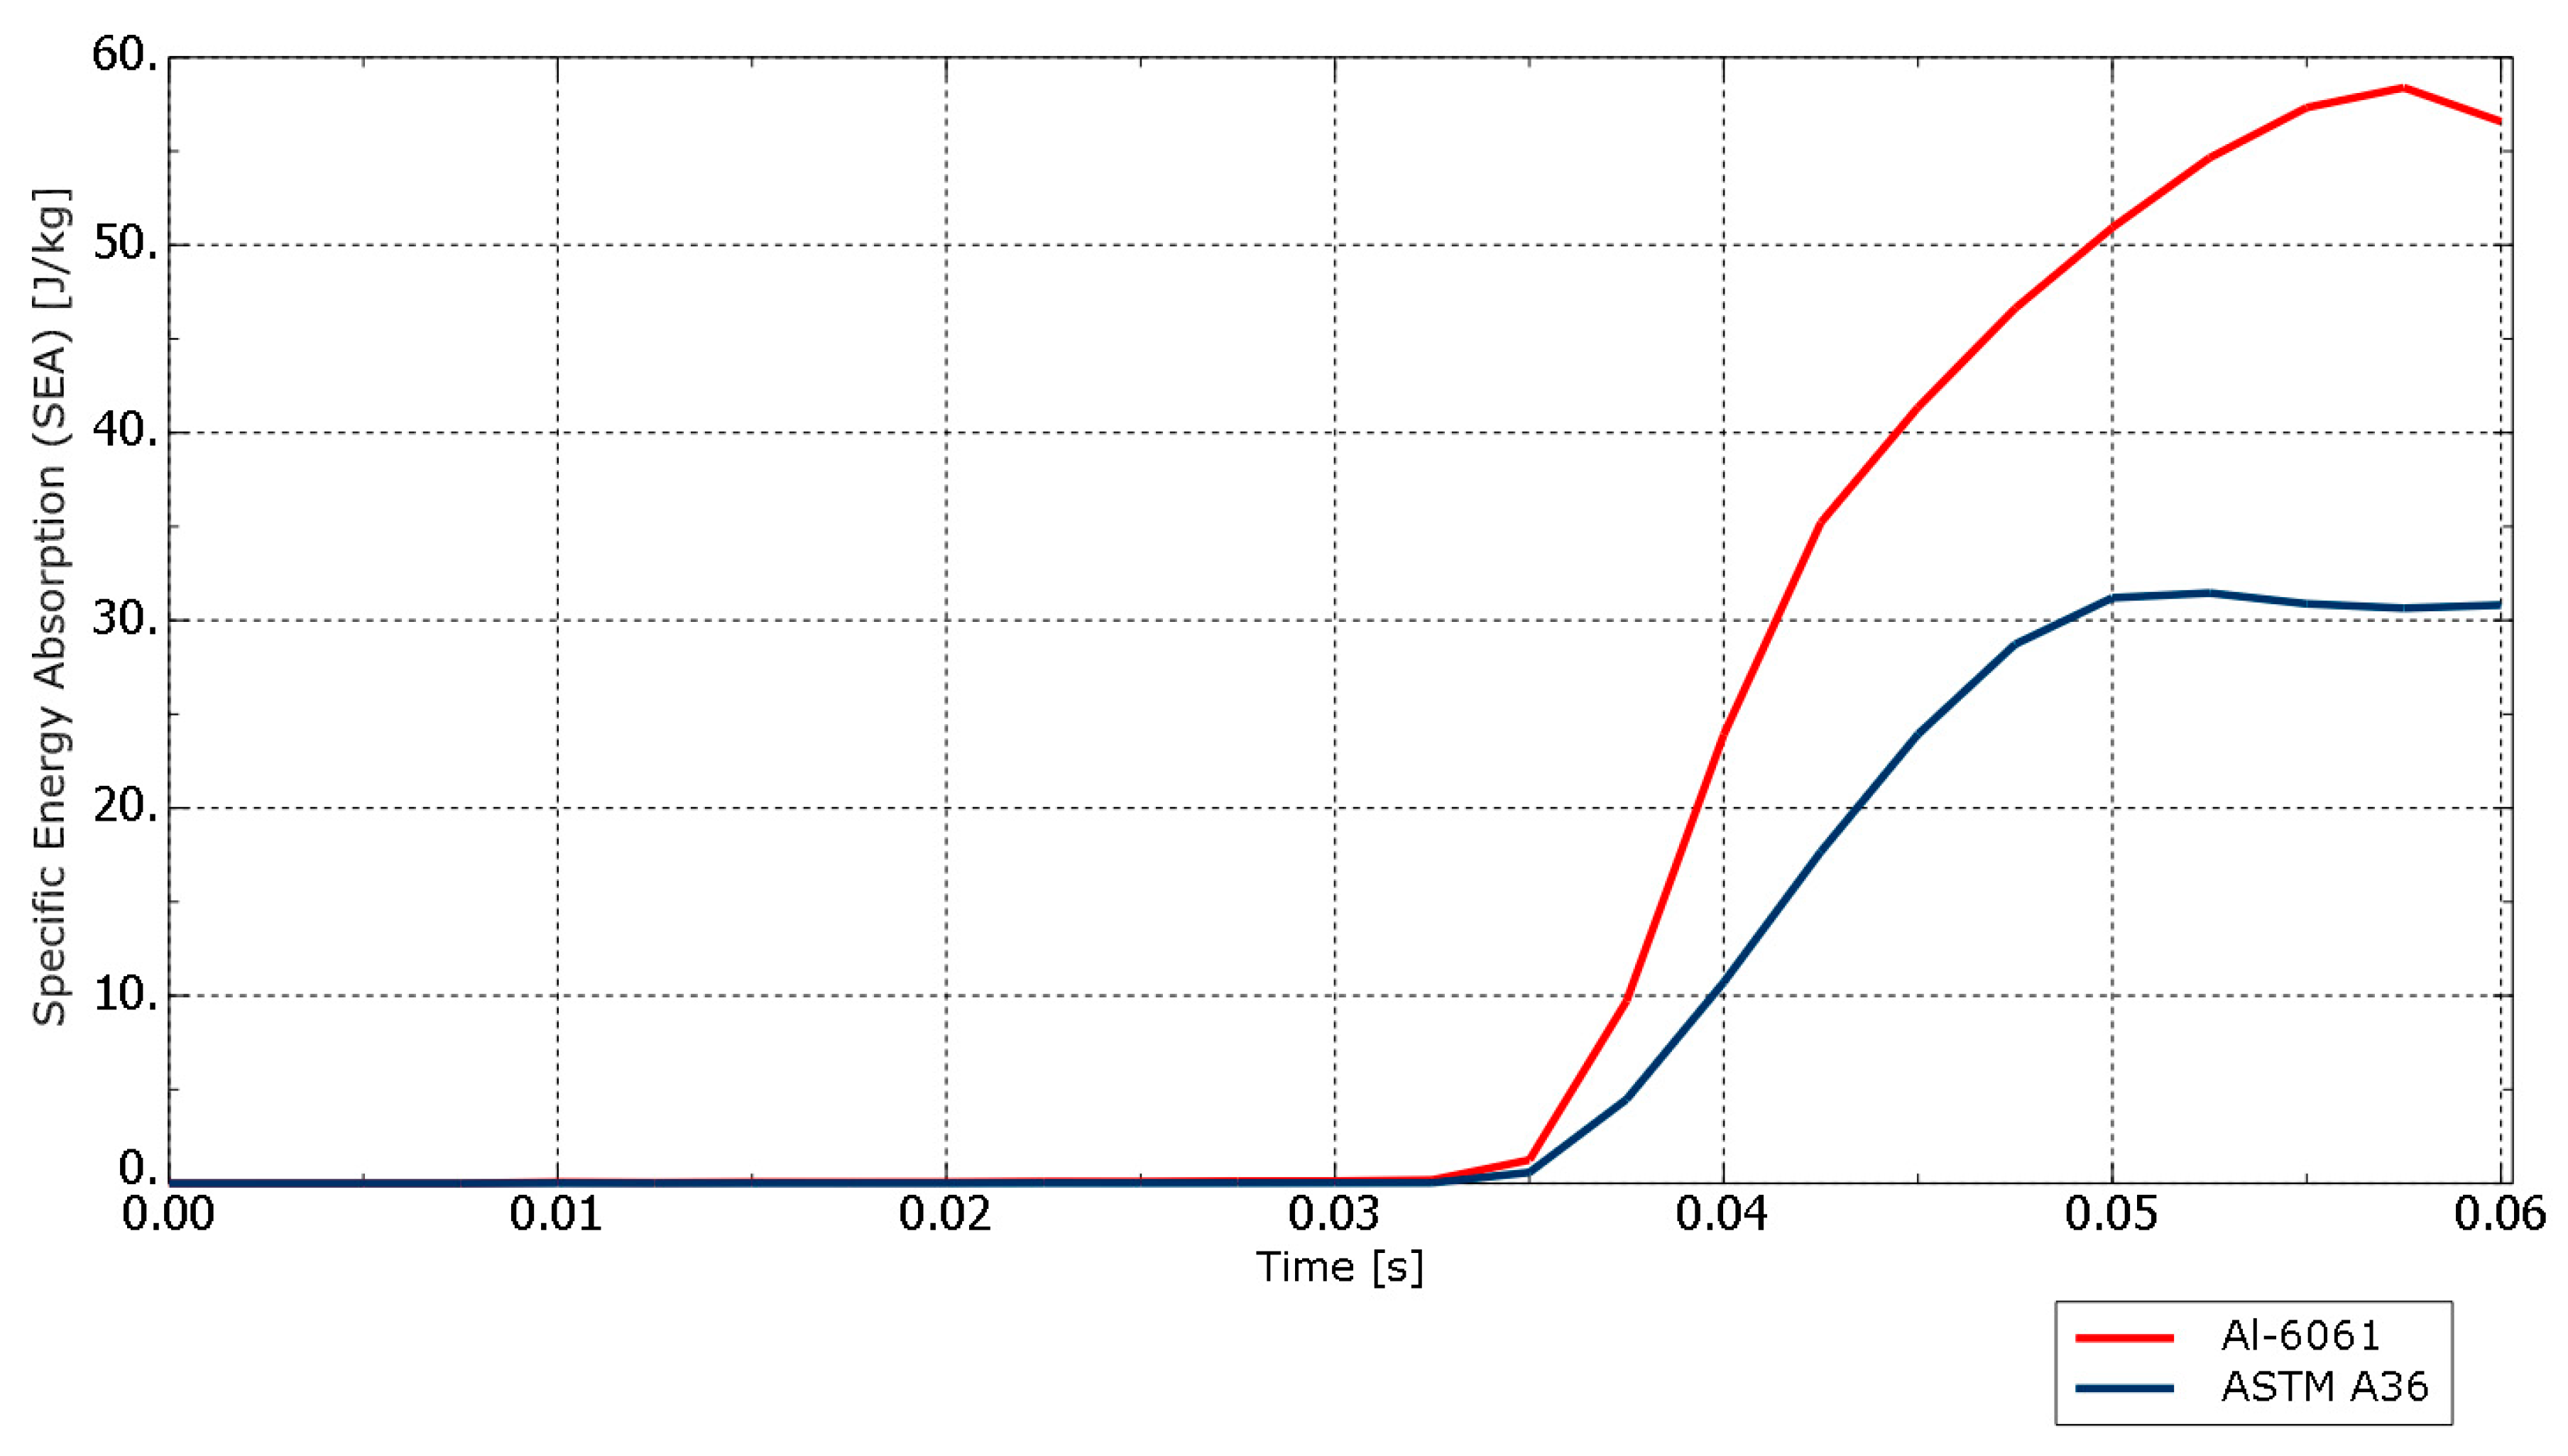
Furthermore, Figure 10 represents the contours of the deformations on the street pole when impacted by the vehicle. To further understand the nature of these deformations, it was necessary to extract and analyze the specific energy absorptions of the two materials. During this analysis, the results showed that the aluminum street pole absorbs more energy from the crash than the steel pole. This can be seen in Figure 11 where the aluminum street pole’s SEA is much greater than that made of steel. Therefore, given a larger thickness, the aluminum street pole may have the potential to further reduce the risk of injury. The SEA in the case of this street pole was calculated using the total internal energy of the street pole and dividing this value by the total mass of the street pole (750.76 kg for the steel street pole and 256.5 kg for the aluminum street pole).
However, due to the simulation in Figure 10, showing the aluminum street pole fracturing off its foundation, this means that transportation authorities may have to bear extra costs of fully replacing lighting street poles in the case of such accidents. If most car accidents might occur at such speeds, it is therefore recommended that authorities inform their suppliers of using street poles with thicknesses of more than 10 mm to ensure that aluminum-based street poles do not suffer such consequential damages.
Finally, the crashworthiness analysis at 12 m·s−1 is an ideal stage to conduct the first validation of this paper in comparison to other literature sources. This is because at higher speeds, the square of the velocity is directly proportional to the kinetic energy; therefore, the differences might be too large to cause uncertainties in the validation. The absorbed energy found in crashworthiness analyses on steel street poles by Elmarakbi et al. [14] is compared to those in this paper. Since the validation source was performed on steel samples, the comparison can only be valid for results covered for street poles composed of the ASTM A36 steel street pole. As shown in Figure 12, the results of both crashworthiness analyses have similar values. The main difference between the data is that the diameter of the street pole in the literature source published by Elmarakbi et al. [14] is about 1.5 m, while in the current simulations, we used street poles of about 2.5 m diameter. Therefore, the influence of the larger diameter will obviously lead to higher energy extracted in these simulations. Furthermore, other reasons why the internal energy is higher in these simulations could also be because there may be different plasticity and damage mechanics that are applied to the model constructed by Elmarakbi et al. [14], which may cause small discrepancies in accuracies between the two models.

4.2. Impact Analysis at Speed of 17 m·s−1 (63 km/h)

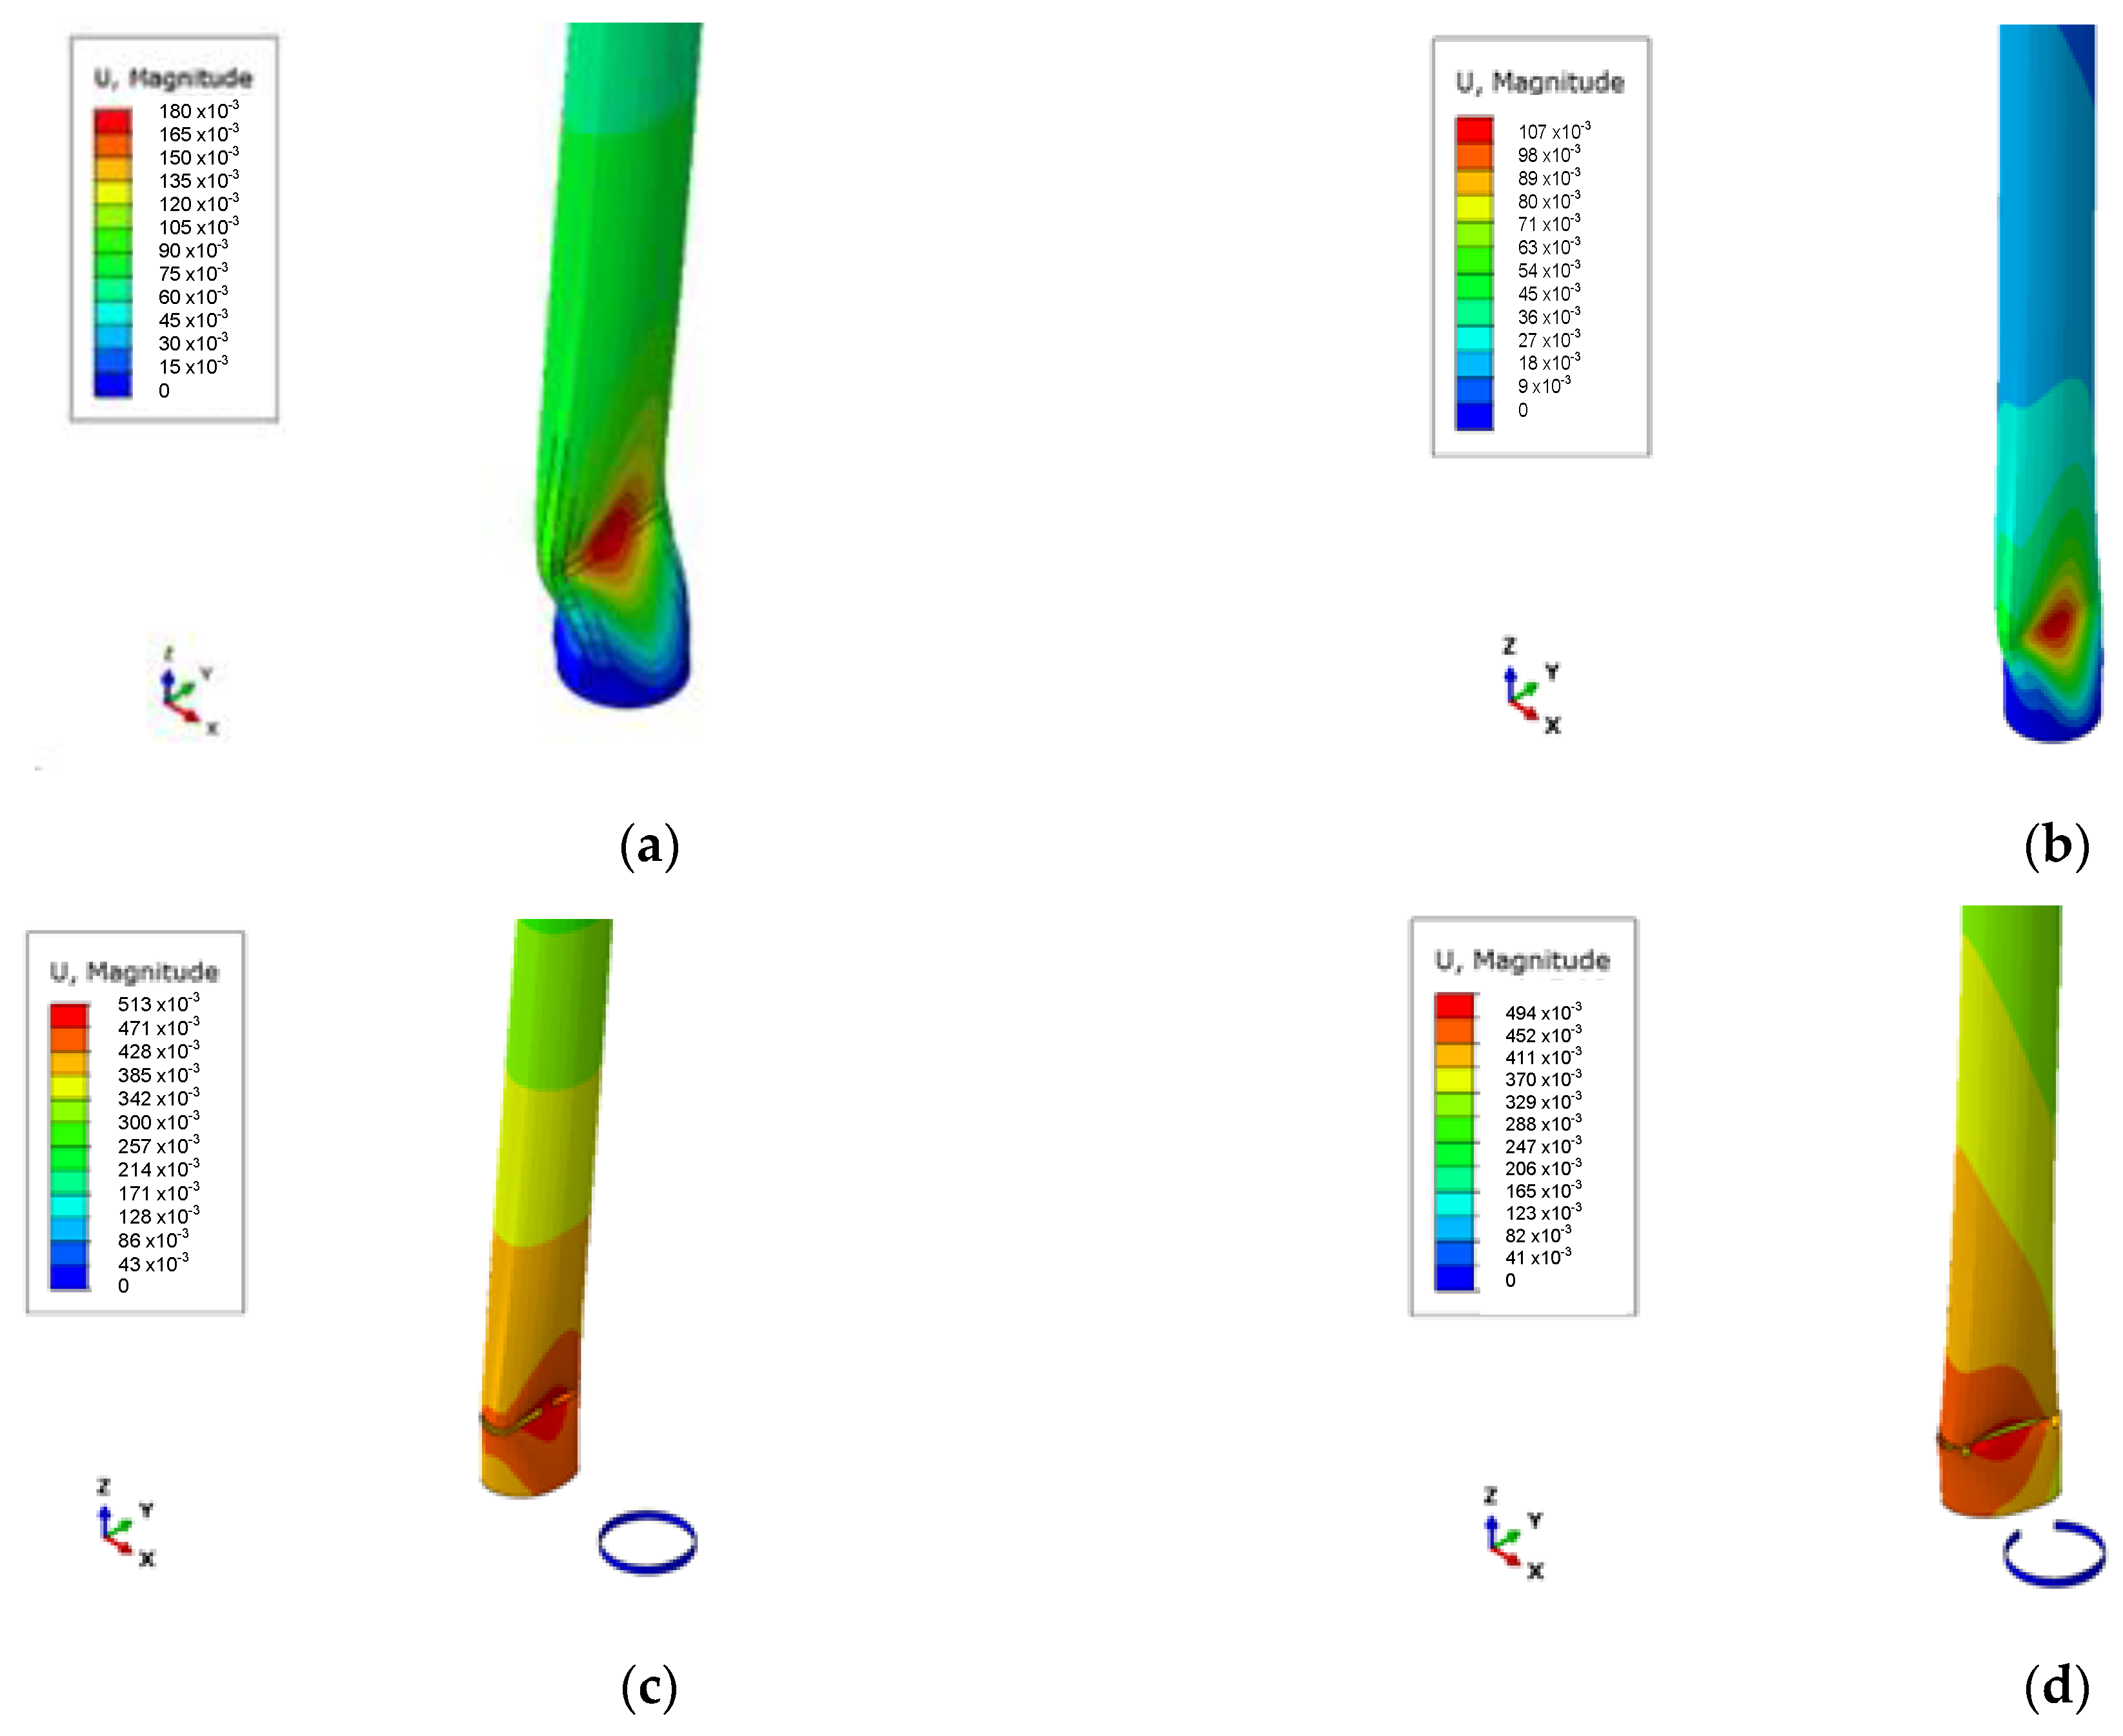
There are some differences that should be noted when comparing the models simulated at 12 m·s−1 and those simulated at 17 m·s−1. The 17 m·s−1 corner impact of the vehicle onto the aluminum street pole results in the pole’s total fracture from the base. The displacements of the damaged street poles can also be graphically represented in the deformation contours shown in Figure 13
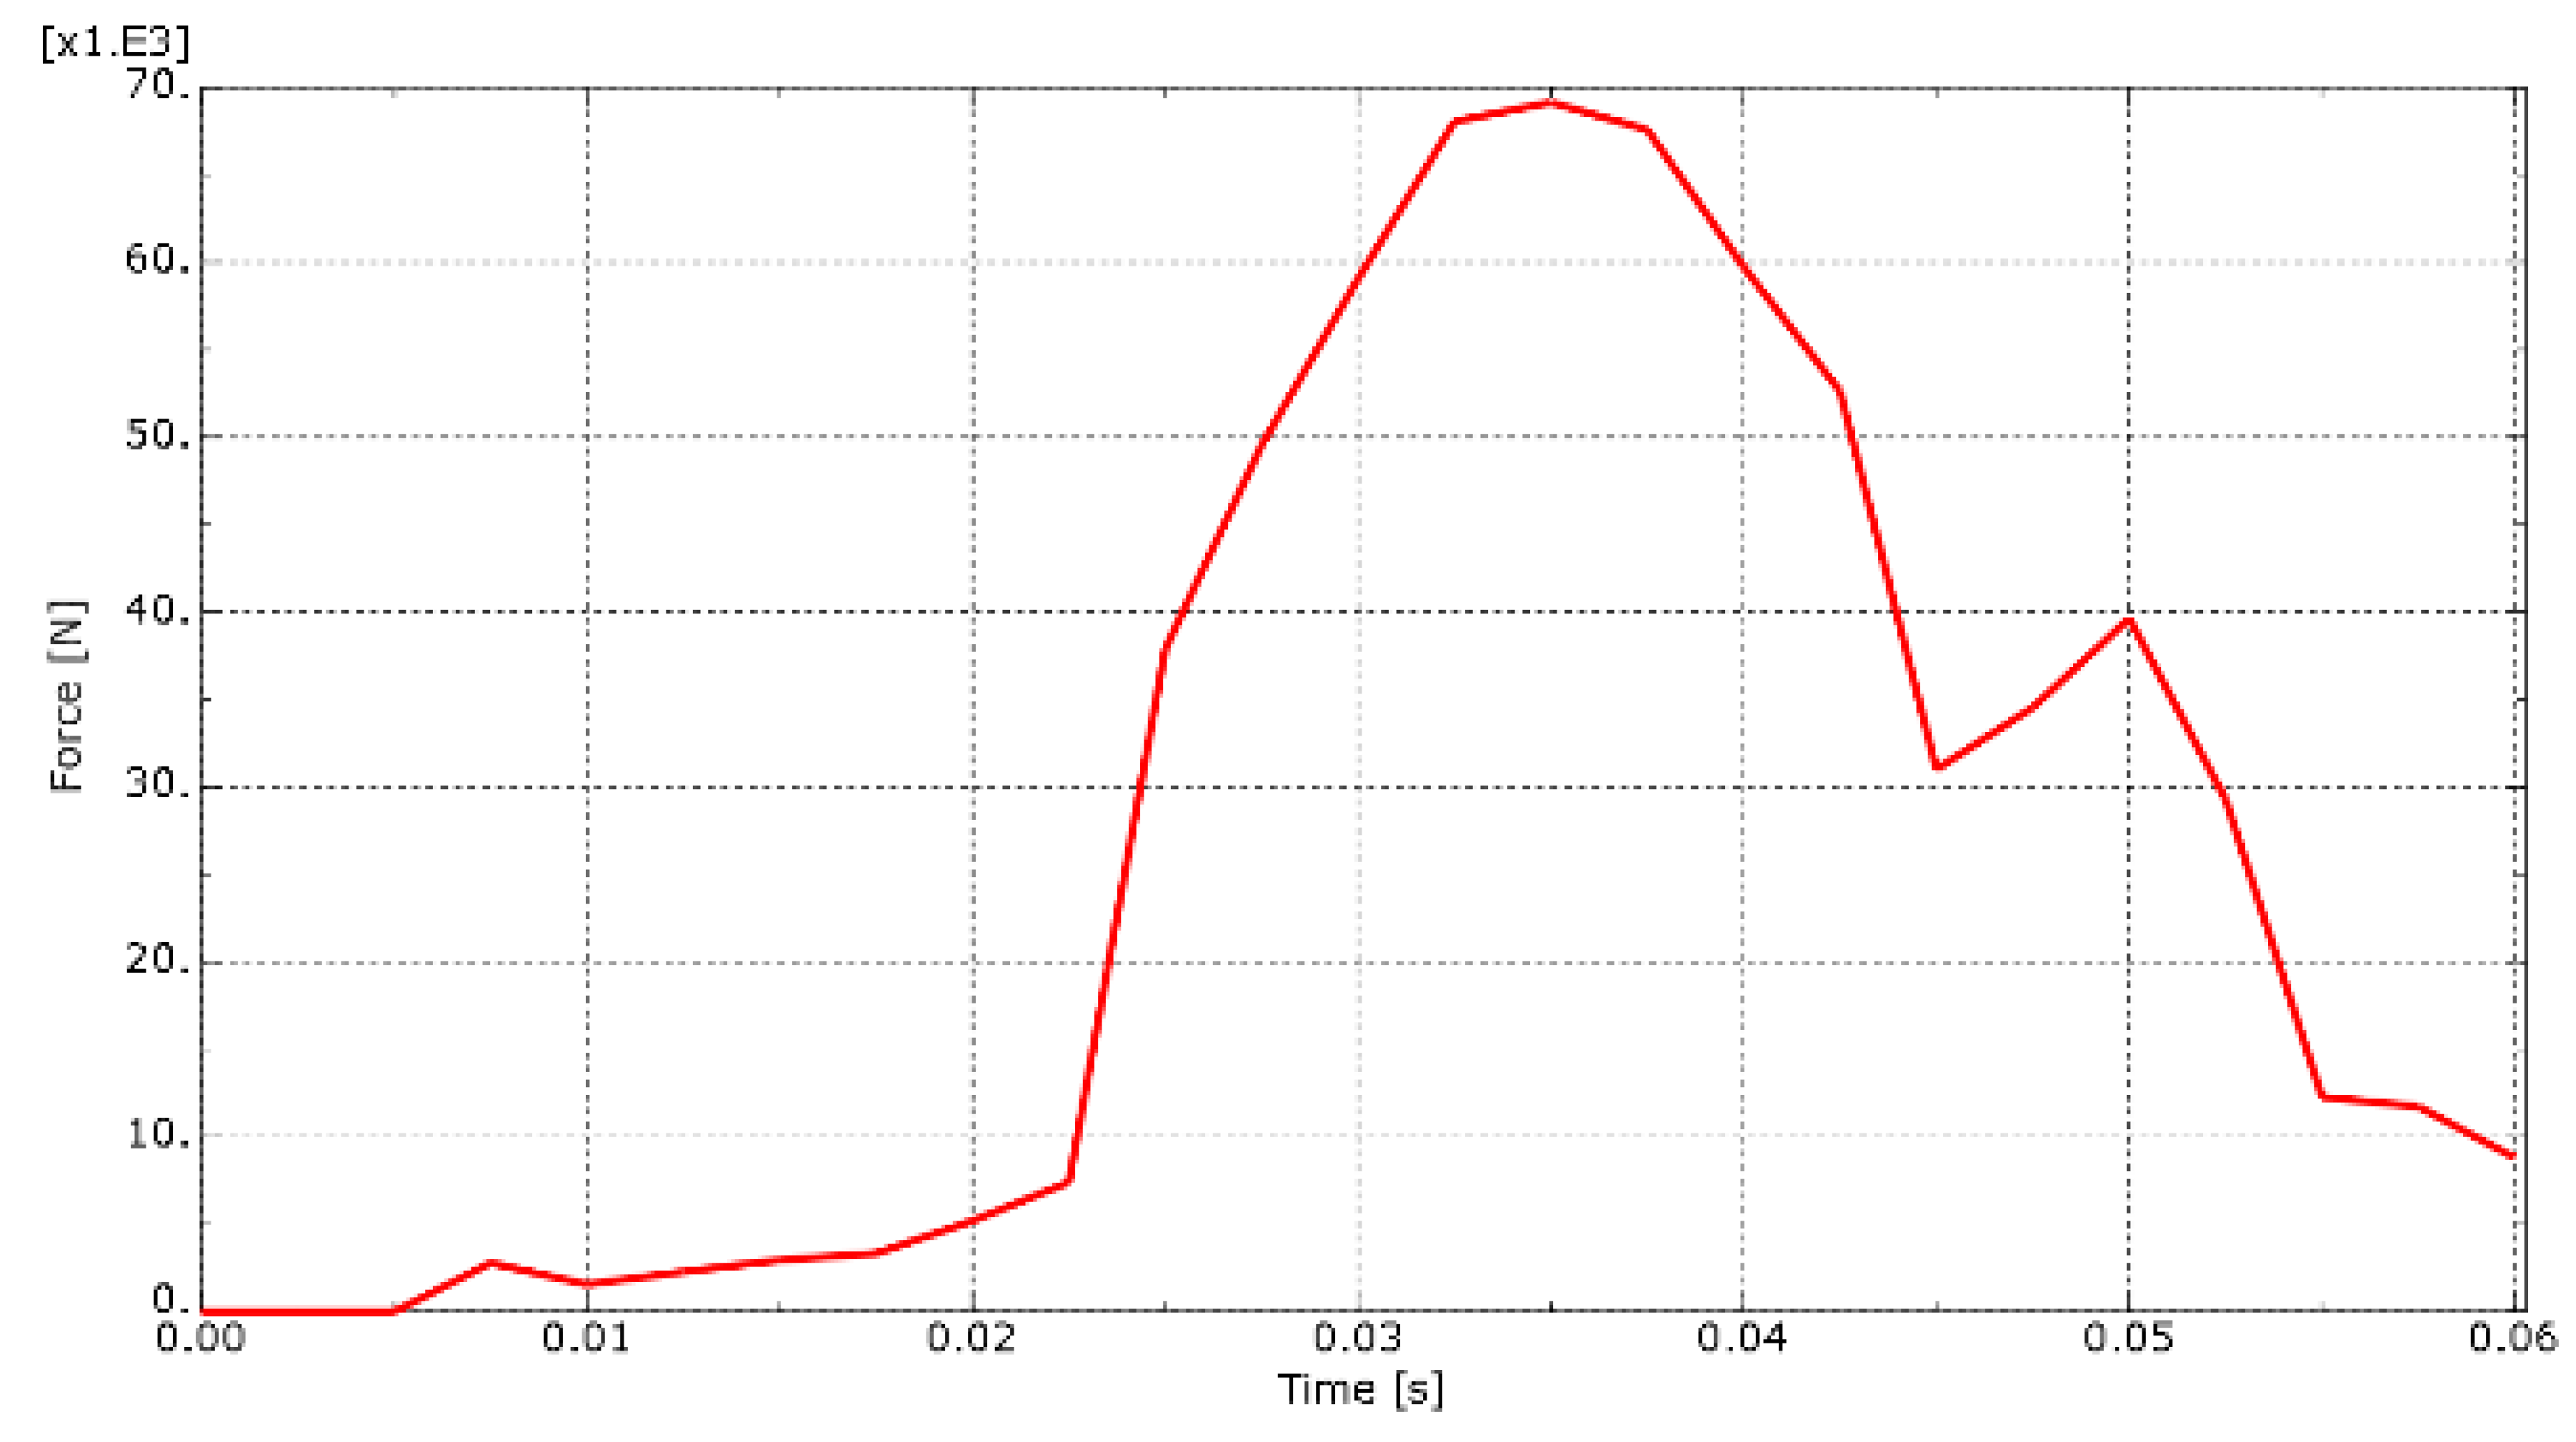
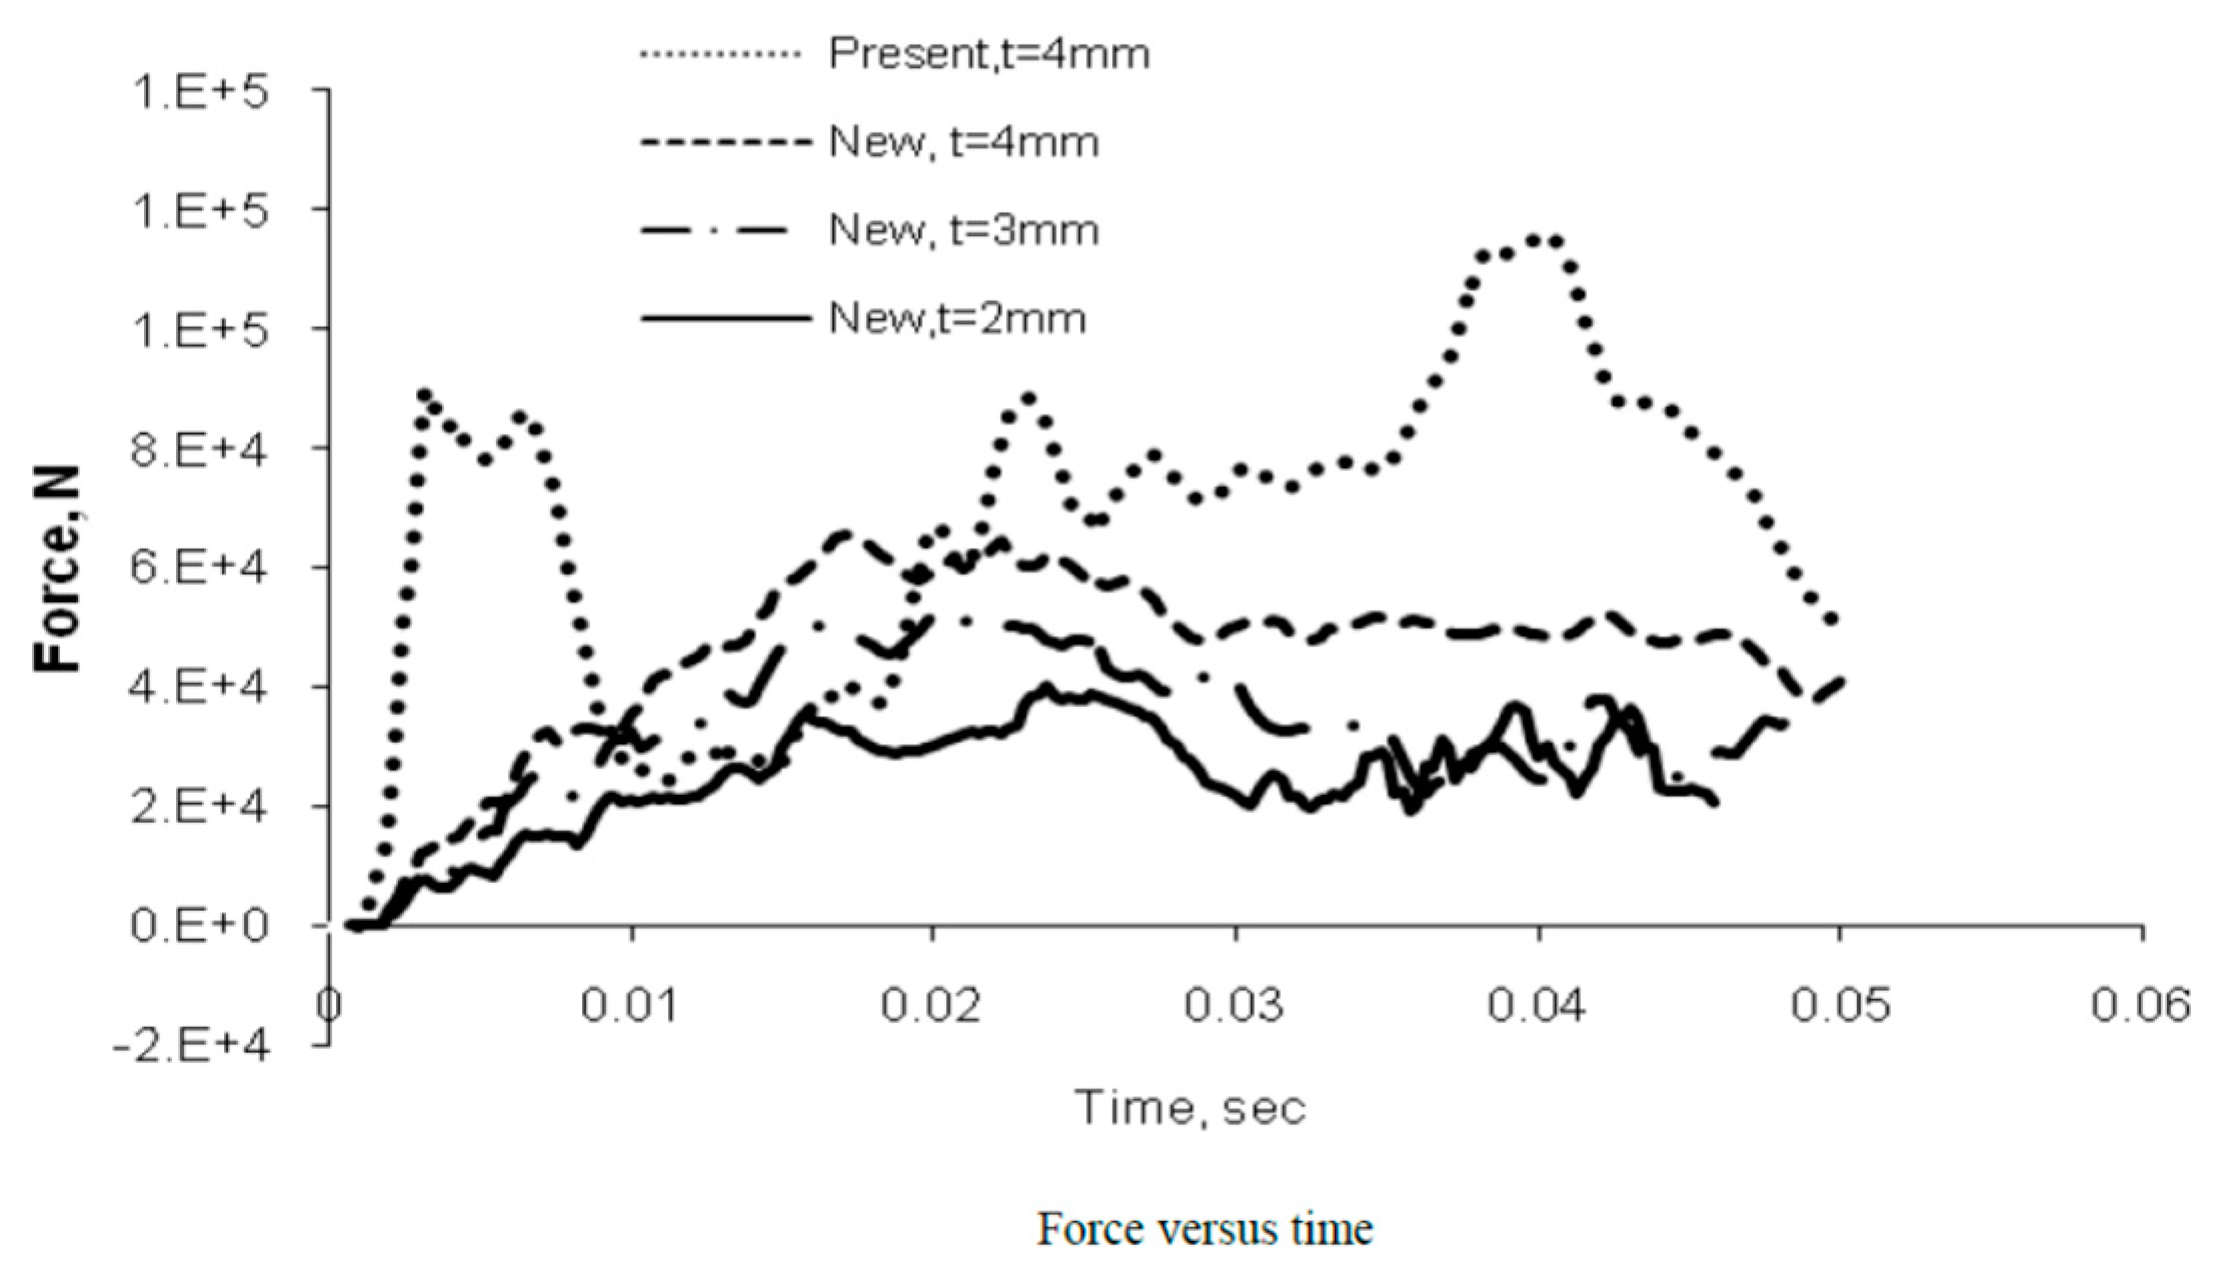
Since the energies of these simulations have now been validated and would not be a fair assessment to validate other results at higher speeds, the impact forces were validated by comparing literature values of 15 m·s−1 to those conducted at 17 m·s−1. One such validation was performed by comparing the results to those of Abdel-Nasser et al. [12], where the pattern of impact forces is similar once contact between the street pole and the vehicle was initiated.
The major differences between the two models are the diameters and the thicknesses, which were about 200 mm and 4 mm, respectively, in the study published by Abdel-Nasser et al. [12]. This is a contributing reason why the forces are much lesser in this study since the larger parameters used in these simulations meant that impact forces would be mitigated. Other factors could also include the geometric differences between the two models that would affect the computation of geometric non-linearities.
Moreover, when comparing the deformations, it can be stated the deformations presented in Figure 14 are an improvement of the results published by Abdel-Nasser et al. [12], as the results in that study do not include any damage parameters. Moreover, the street pole’s deformation does not include any element deletion; therefore, there is a high probability that the mesh elements are highly distorted and do not represent actual deformations as those shown in Figure 15.

4.3. Impact Analysis at Speed of 22 m·s−1 (80 km/h)

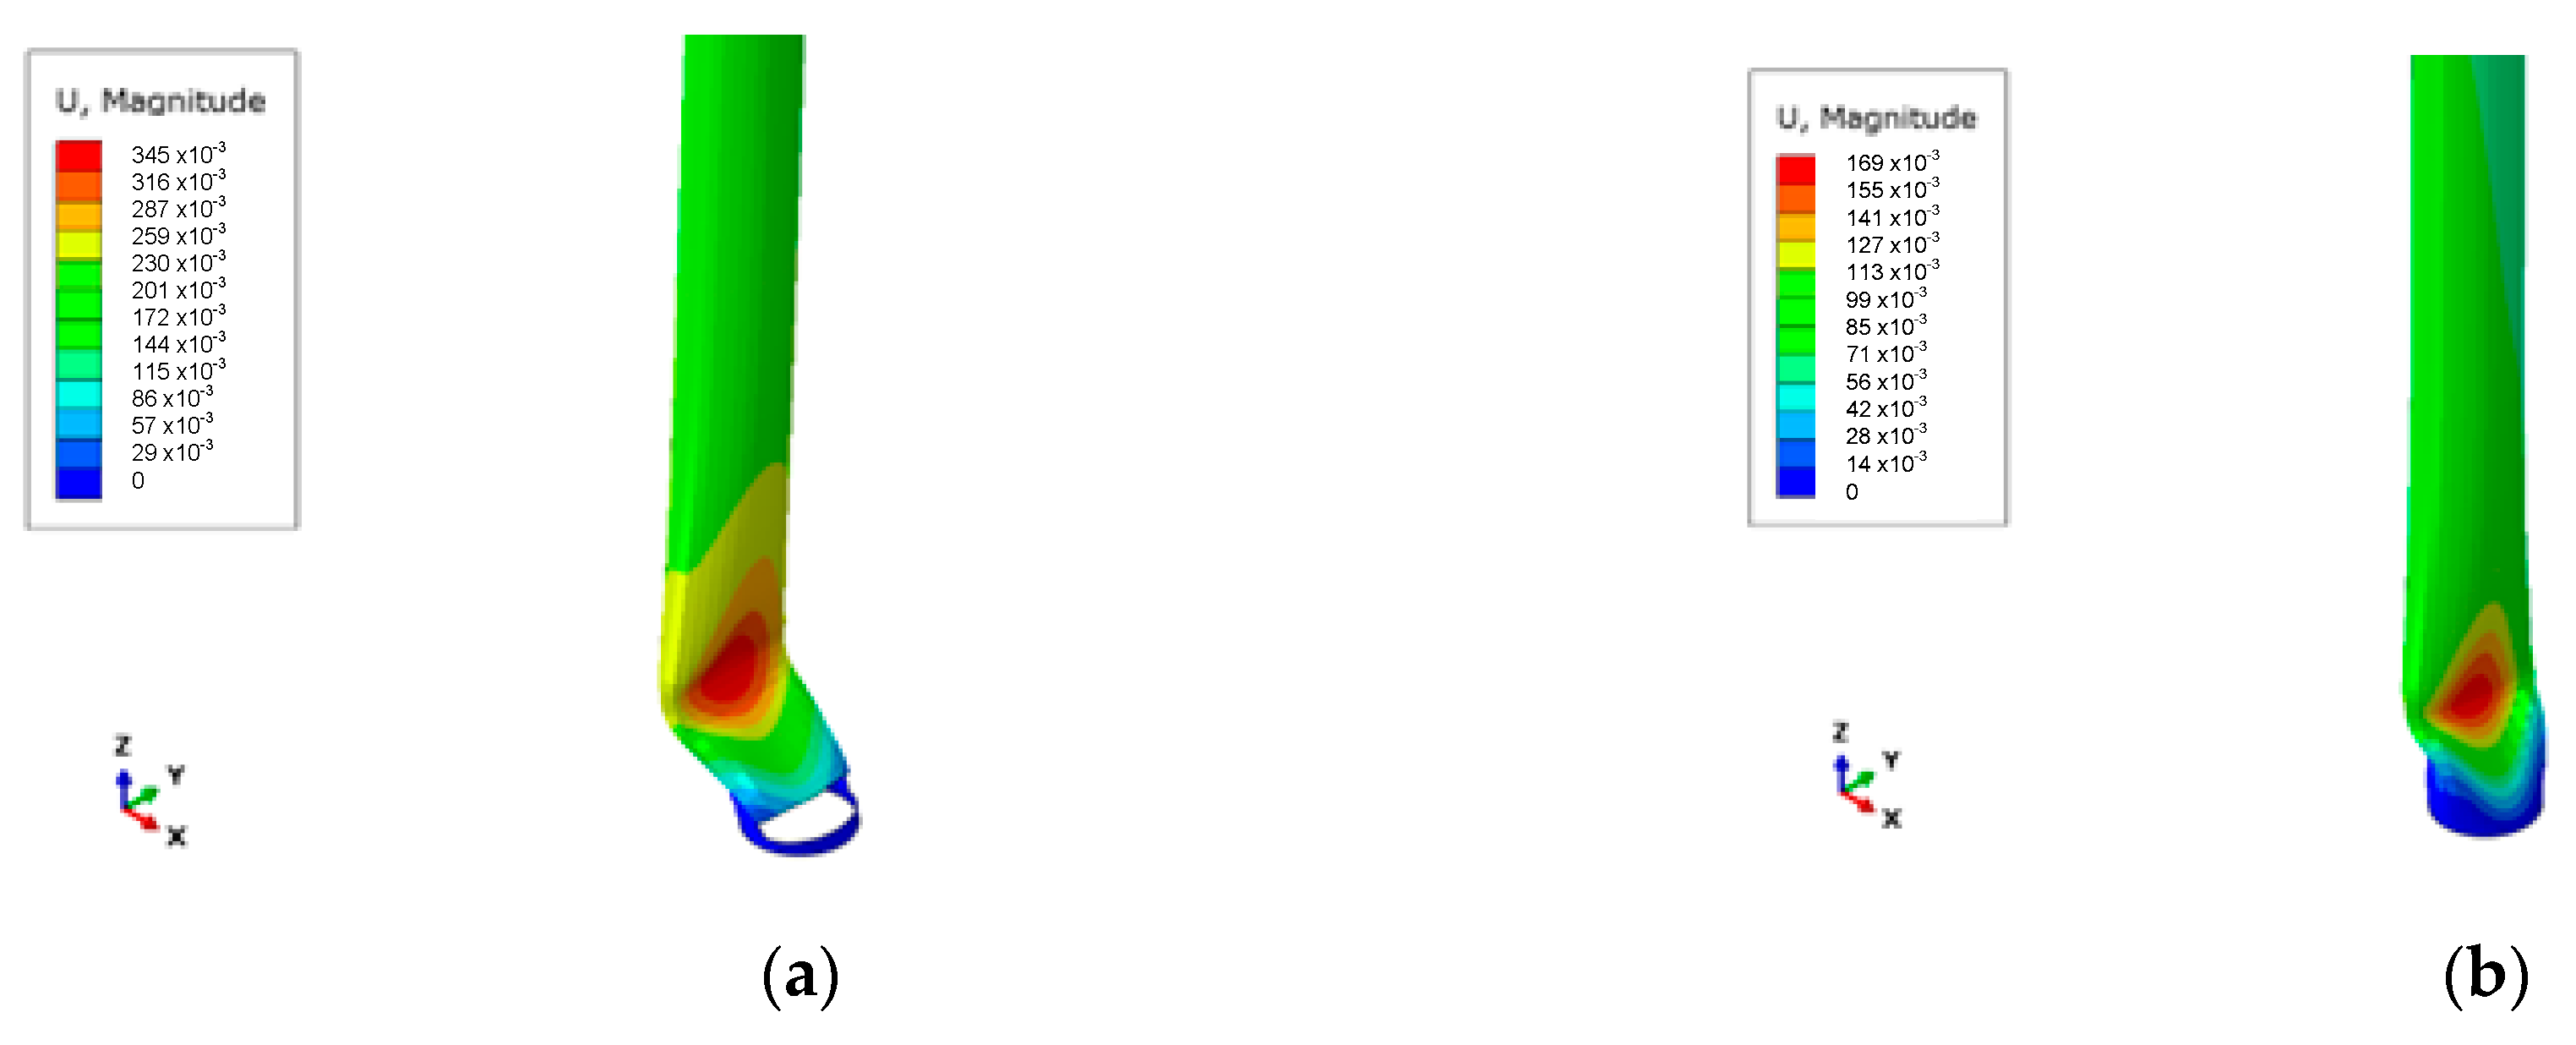
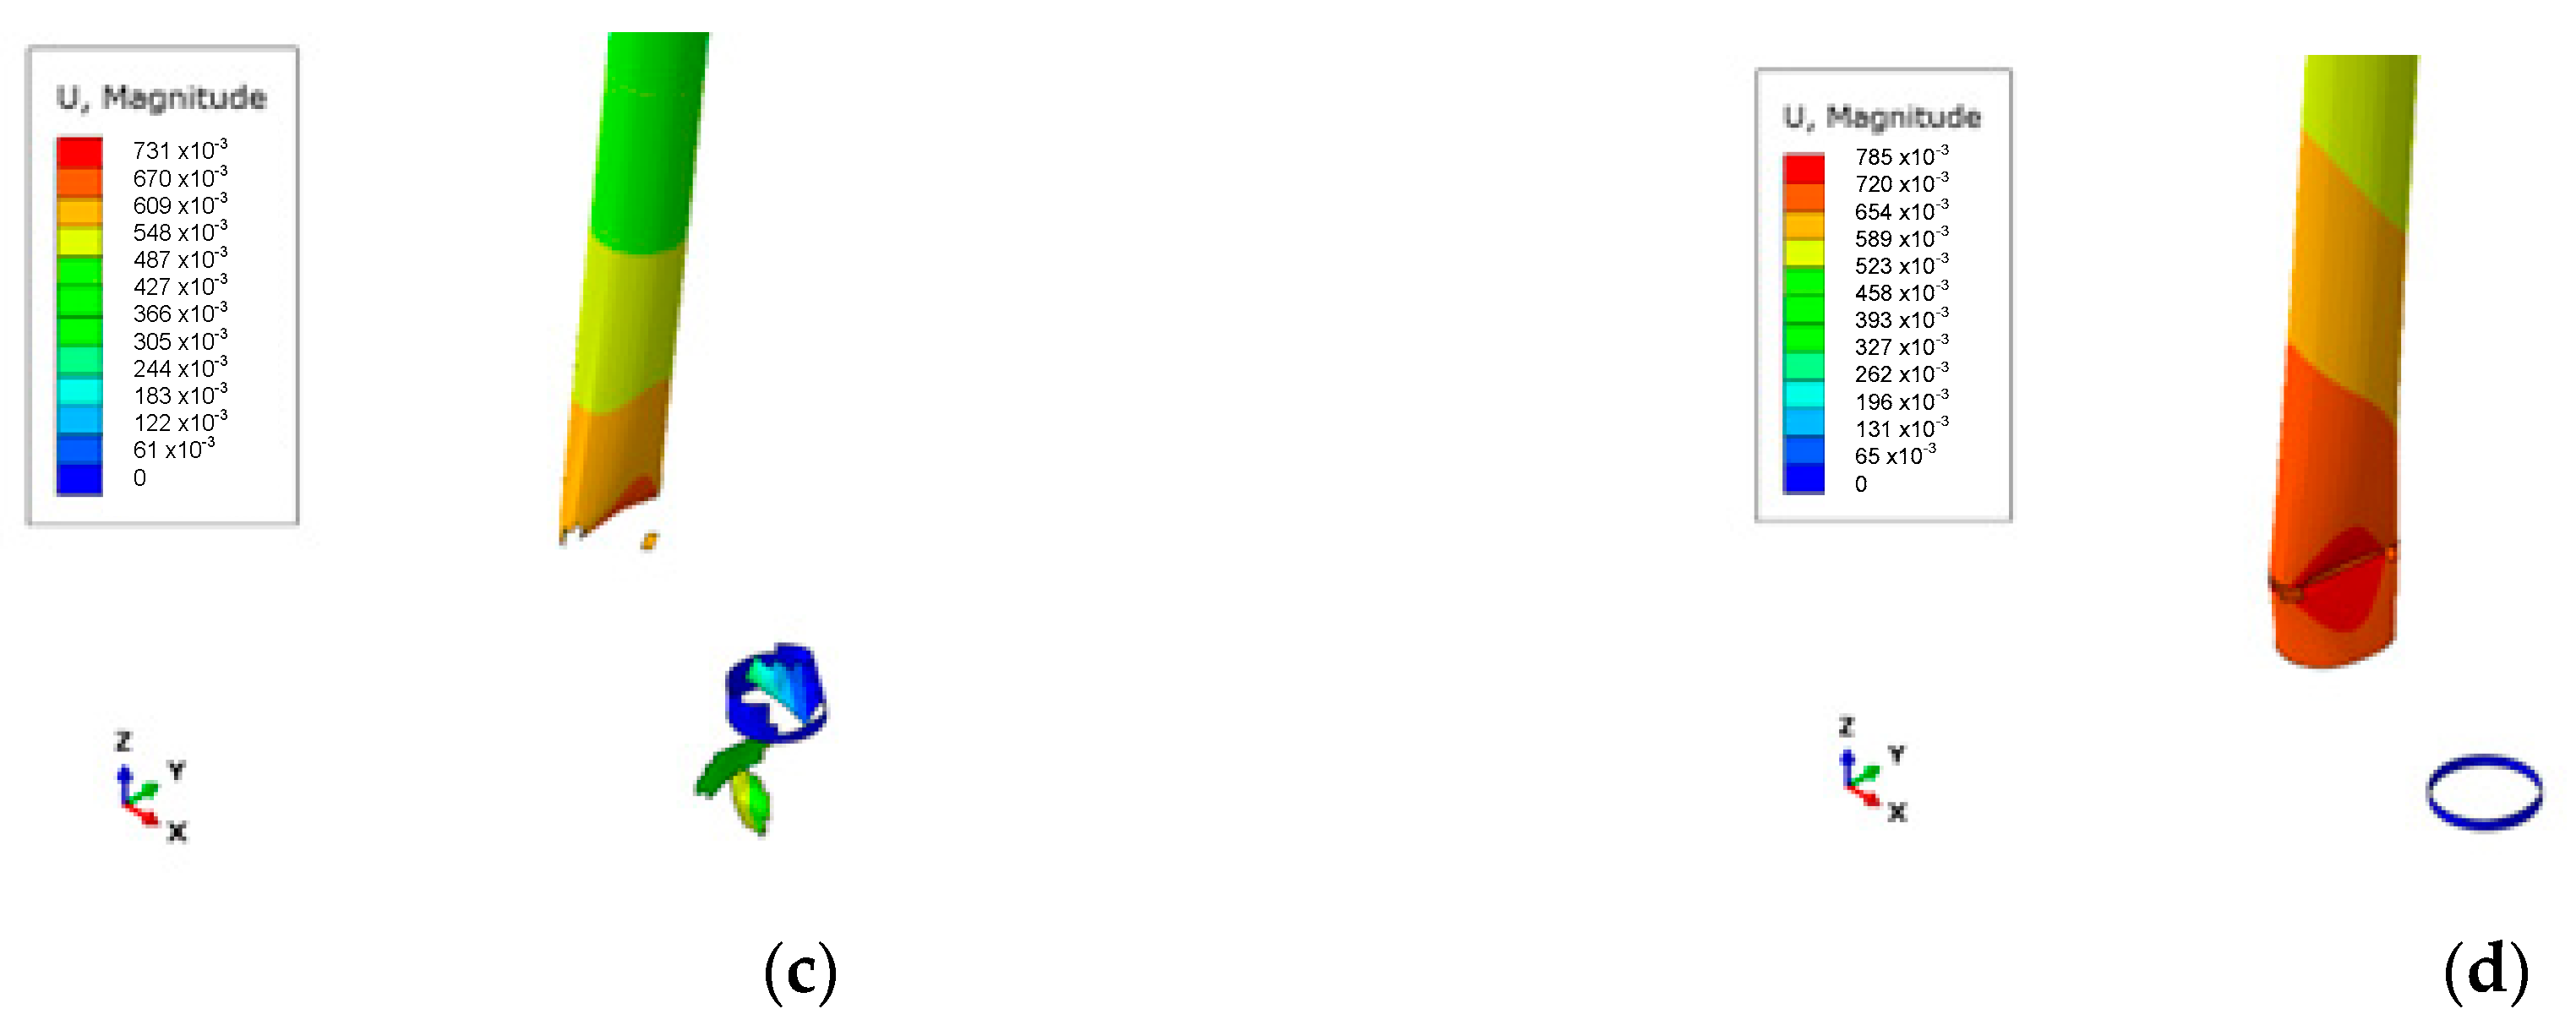
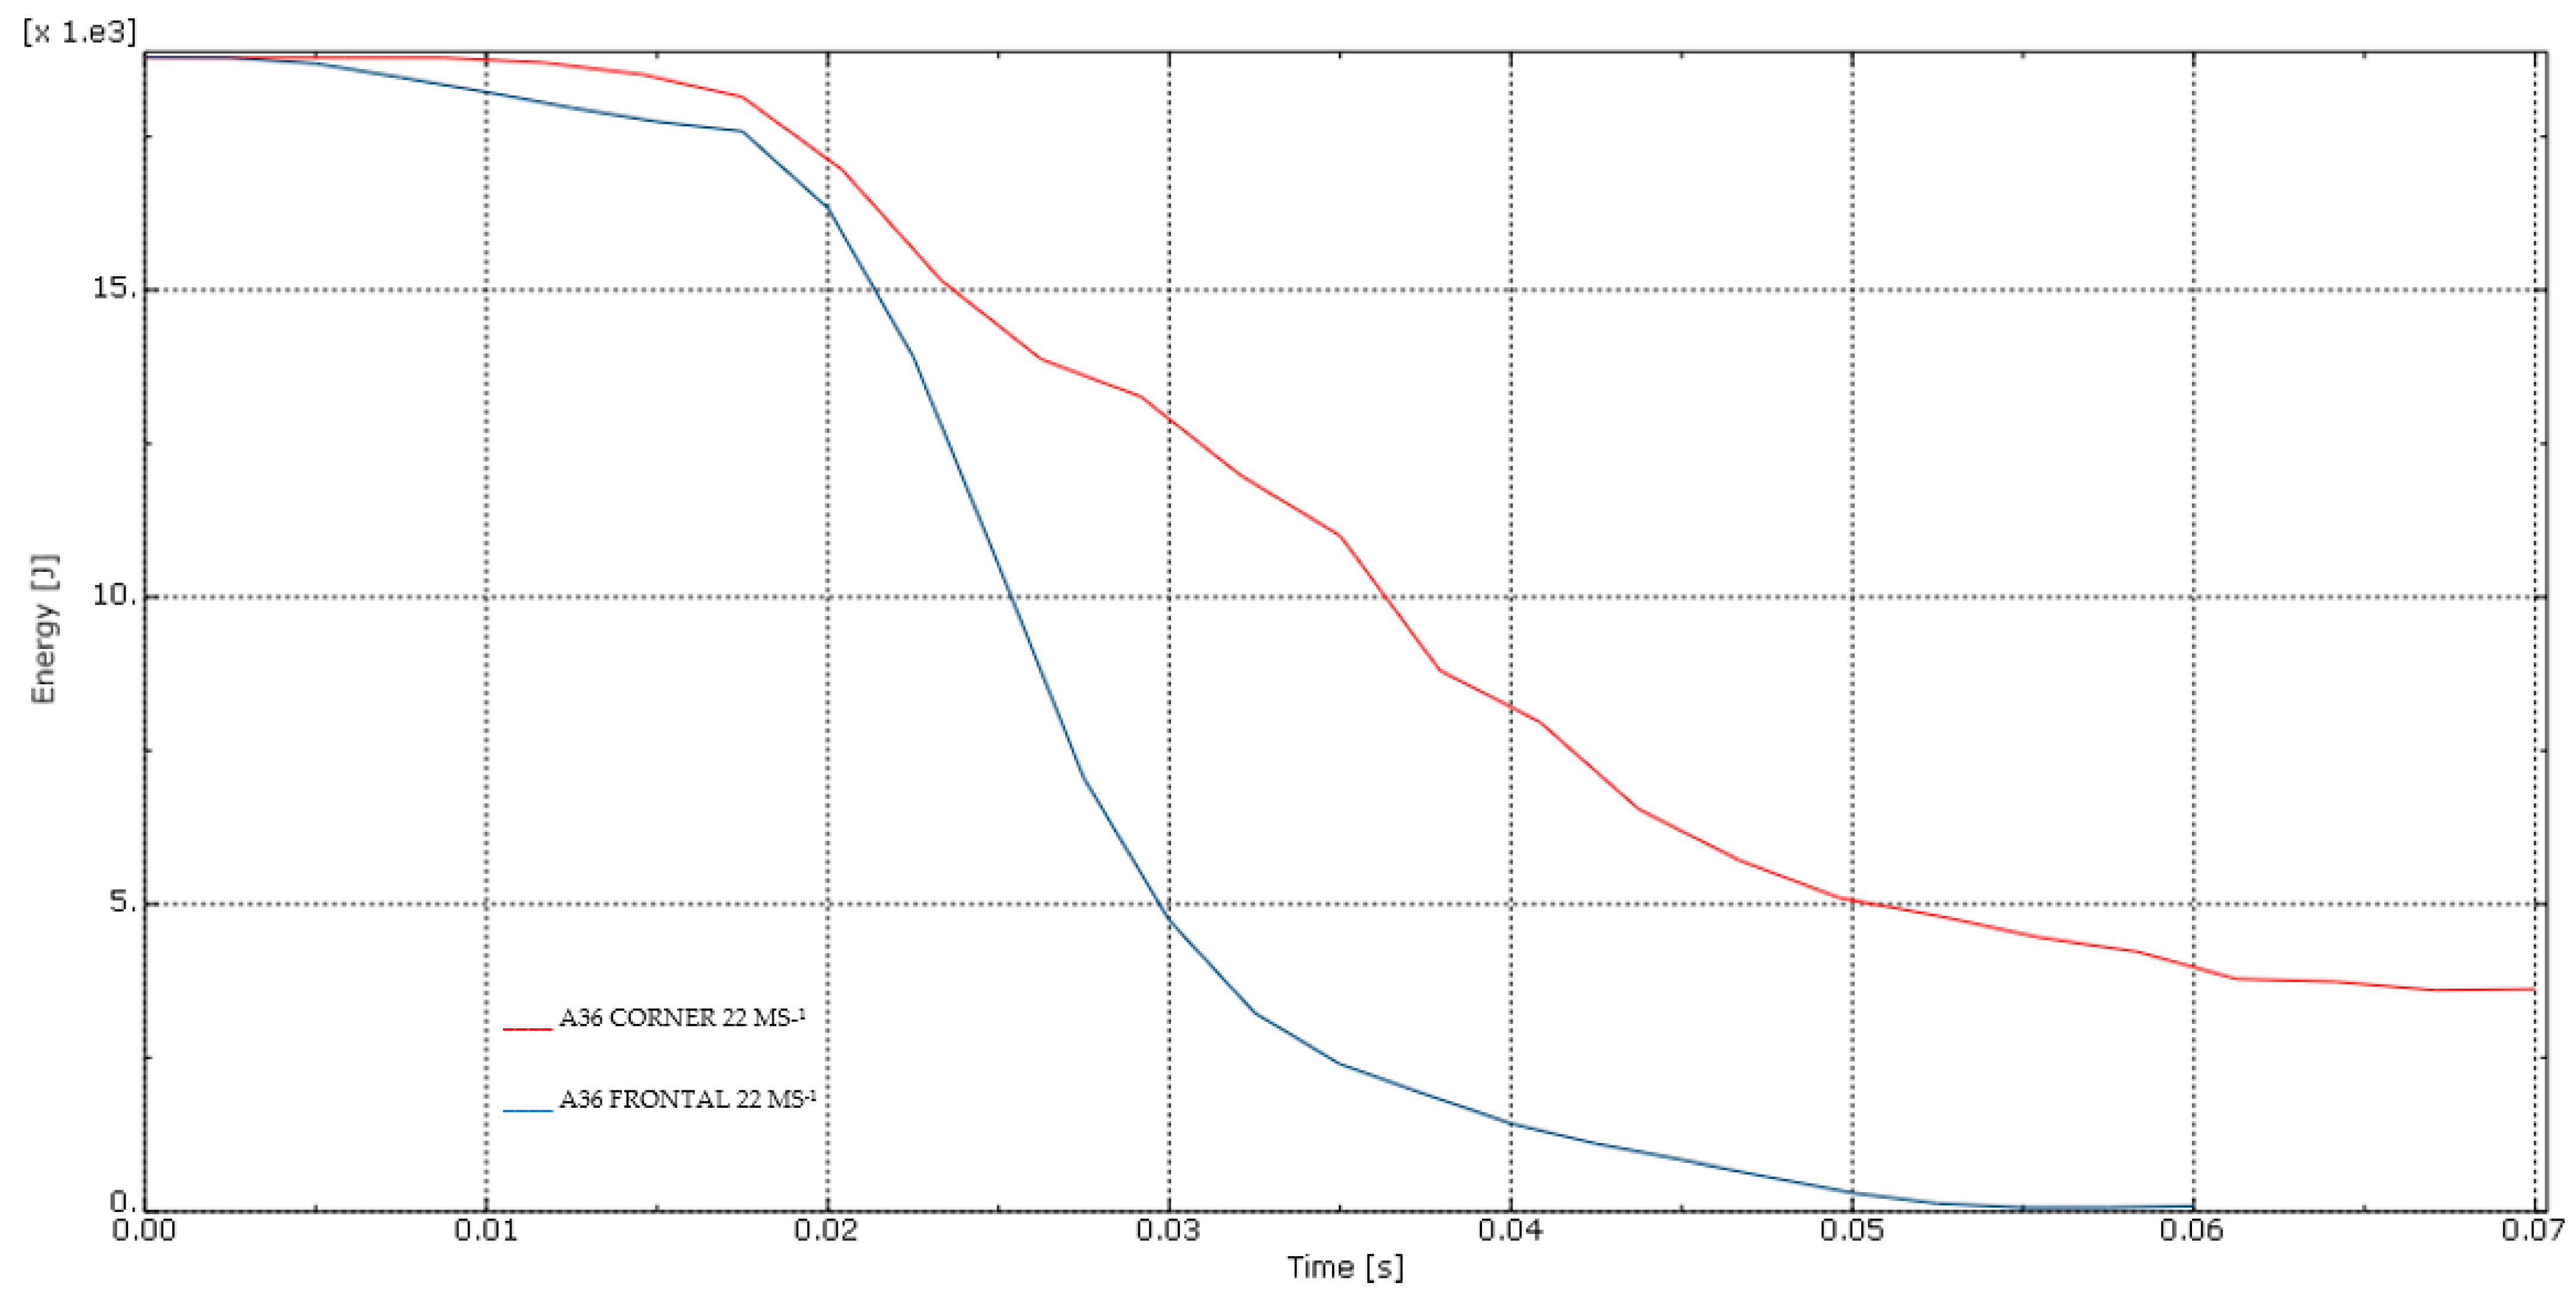
The results of speeds higher than 60 km/h have only been rarely published. Few such cases include experimental crashworthiness analysis covered by Ispas and Nastasoiu [10]. Because of the lack of validation sources, this section is dedicated to publishing novel results so that stress distribution, deformation of the street pole, and internal energies are further understood at impact velocities of 22 m·s−1 or greater. Figure 16 shows that at such speeds, the aluminum street poles exhibit major damage, regardless of the direction of impact, while the steel pole impacted by a frontal colliding vehicle suffers major fracture on its structure. The deformations of the street pole’s geometry are further shown in Figure 17. From viewing Figure 10, Figure 14 and Figure 17, it is evident that frontal vehicle collisions cause more deformations and higher fracturing on poles when compared to corner collisions. However, unlike corner collisions, frontal collisions transfer more internal energy to the street pole, as seen in Figure 18. This analysis is significant because the drivers and passengers may have a significant amount of energy mitigated onto them during a frontal collision. This is safer compared to corner collisions, where residual kinetic energy of the vehicle may be transferred onto them or may cause vehicles to hit other obstacles too, risking major injuries to them if these kinetic energies are not mitigated as much as possible.
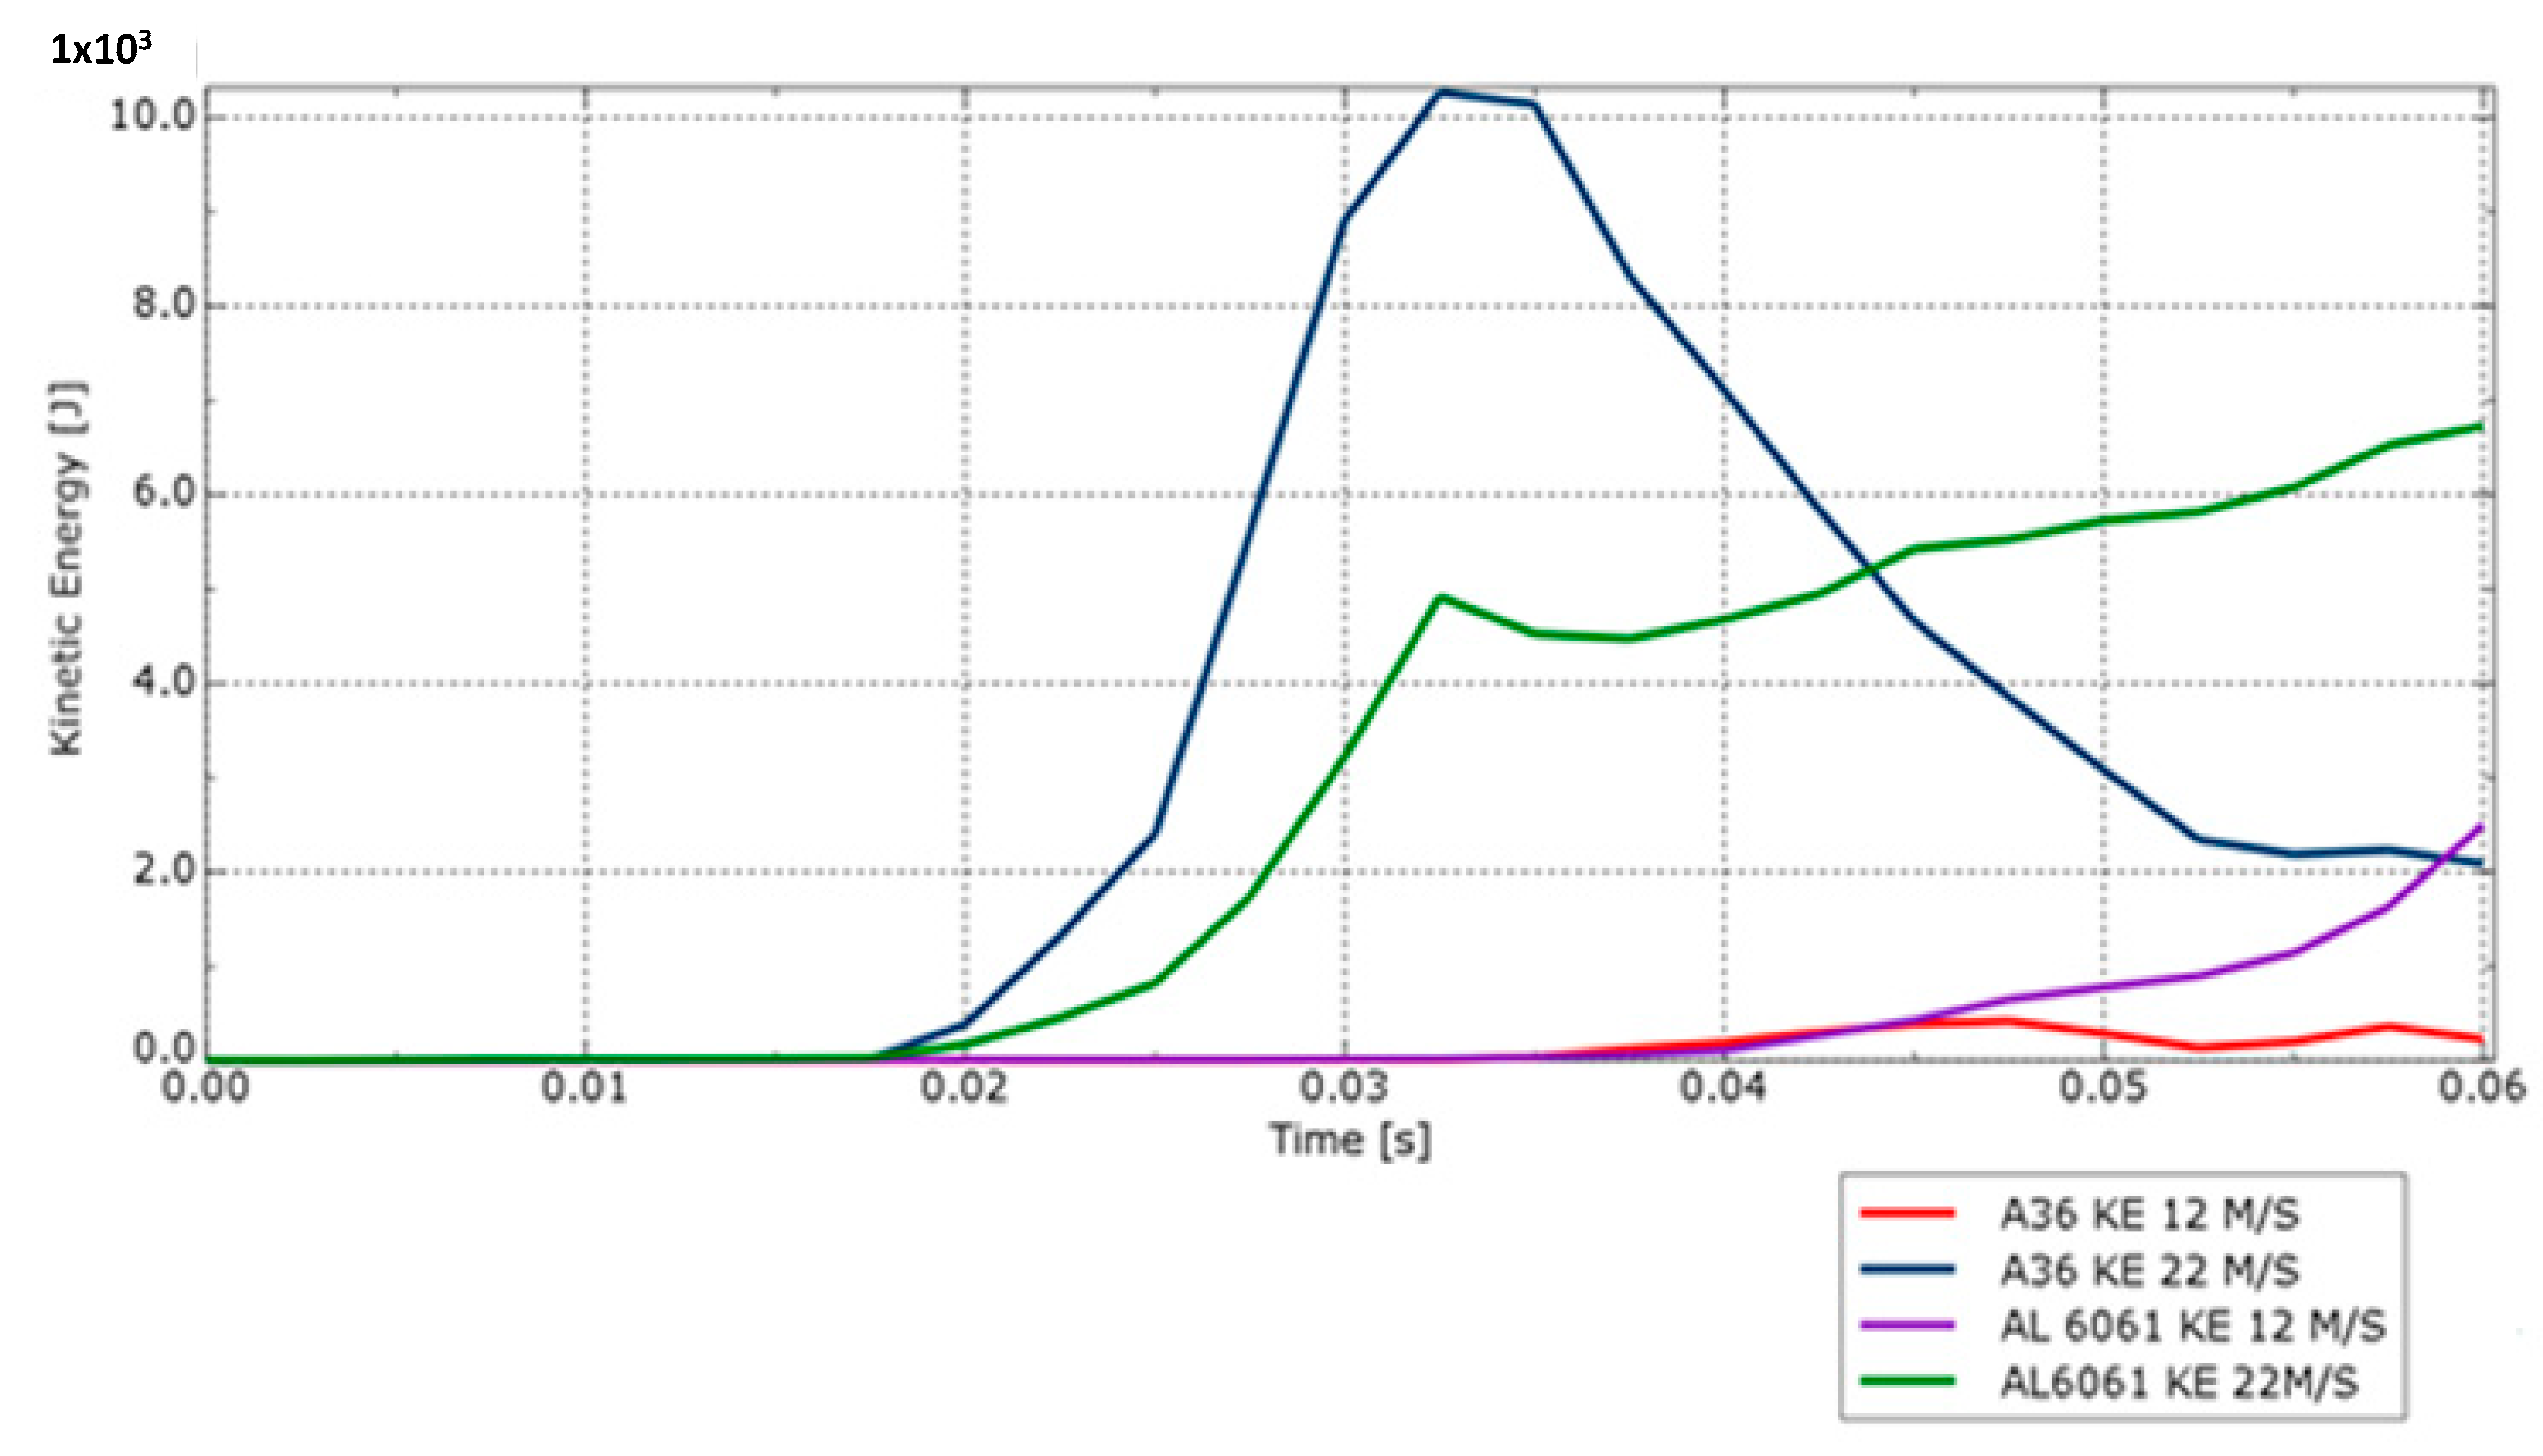
Furthermore, when the SEA was recorded, as shown in Figure 19, it was seen that although the increase in speed will obviously lead to an increase in the SEA, the SEA of aluminum and steel are almost similar. This suggests that as the speed of the vehicle greatly increases, the influence of the material’s properties on the model’s SEA may decrease. Therefore, there are other property factors that could affect the SEA in such scenarios. These could possibly include factors such as momentum and the presence of increased kinetic energies of the vehicle at such speeds. The validity of this claim can be strengthened when viewing Figure 20. At lower velocities, while the kinetic energies of both pole types were similar until 0.045 s, the aluminum pole’s kinetic energy increases as it is fractured from the base (and becomes dynamic rather than a structure), while the steel pole loses its kinetic energies gradually since most of its structure does not suffer complete fracture and the total mass of the pole is probably enough to slow the car down to a stationary point. Therefore, even though the aluminum shows a greater SEA than steel, the total mass in this simulation was not enough to completely slow the vehicle down to a stationary point.
At higher velocities, both pole types have residual kinetic energies; therefore, both poles have already absorbed the maximum critical energies from the vehicle before fracturing off the base. Since the geometry of both street poles are the same, the mass of the steel (due to its density) is greater than that of aluminum, which suggests that it was able to absorb more energies before fracturing, and this can be seen in Figure 20. Since the aluminum pole had lesser mass, the speed of the vehicle was too great to absorb more of the energies; therefore, the additional kinetic energy on the pole may have an effect on the limit of the aluminum’s SEA.

5. Conclusions

This work emphasizes the significance of introducing damage parameters to the materials of both the vehicle and street pole to model crashworthiness analyses. Due to the inclusion of damage, improvements based on initial research conducted by Abdel-Nasser et al. [12] were made as energies absorbed by the pole may be lower than initially expected. This work also shows the necessity of varying materials to understand how the SEA of the pole is affected. For instance, this work strongly suggested that aluminum alloys have greater SEA than steel at lower kinetic energies. However, further simulations are required to confirm if increasing the thickness of the aluminum pole to an optimum thickness and mass will have any effect on the overall SEA. Moreover, research will also be required to understand if the total fracture of aluminum street poles from the base will continue to occur with incremental thickening of street poles. Therefore, we also suggest additional studies of aluminum poles with increased thicknesses to see if aluminum continues to be a better alternative to the traditional steel poles.
Although street poles made of steel, under the selected geometry, do not completely fracture from the base until 22 m·s−1, this does not negate the fact that the SEA of steel is quite low, especially during low-speed vehicle impact. This could result in possible injuries to the driver and passengers if no efforts to mitigate these unwanted energies are made. Therefore, strategies such as shielding the pole with additional layers may be needed to further increase the overall SEA of street poles made of steel.
This paper furthermore signifies the importance of simulating vehicle collisions with poles using different collision types. From the results, it is seen that a frontal vehicle crash until certain velocities may completely stop the vehicle. In corner crashes, residual kinetic energies of the vehicles are still present, suggesting that the effective impacted area may play a key role in the absorption of the vehicle’s kinetic energy on a street pole. However, more simulations may be required to prove this. Tests using a side crash on a pole may be useful in supporting this statement.

Author Contributions

Conceptualization, formal analysis M.A. and J.A.; software, validation R.S. and M.F.; methodology, review and editing: K.A. All authors have read and agreed to the published version of the manuscript.

Funding

This research received no external funding.

Institutional Review Board Statement

Not applicable.

Informed Consent Statement

Not applicable.

Data Availability Statement

The study did not report any data.

Conflicts of Interest

The authors declare no conflict of interest.

References

  1. Federal Competitiveness and Statistics Centre. Traffic Accidents by Emirate and Cause of Accident, Bayanat. 2018. Available online: http://data.bayanat.ae/en_GB/dataset/traffic-accidents-by-emirate-and-cause-of-accident/resource/cdfb92d6-f9d2-479c-96d5-18ef09b222b5 (accessed on 12 October 2022).
  2. Gopalakrishna, H.D.; Panda, P.; Jois, P. Crashworthiness of Automobile in a Vehicle-To-Pole Crash Simulation. Int. J. Automob. Eng. Res. Dev. 2014, 4, 1–10. [Google Scholar]
  3. Long, K.; Gao, Z.; Yuan, Q.; Xiang, W.; Hao, W. Safety evaluation for roadside crashes by vehicle-object collision simulation. Adv. Mech. Eng. 2018, 10, 1–12. [Google Scholar] [CrossRef]
  4. Long, C.R.; Chung Kim Yuen, S.; Nurick, G.N. Analysis of a car door subjected to side pole impact. Lat. Am. J. Solids Struct. 2019, 16, 1–17. [Google Scholar] [CrossRef]
  5. Passino, B. Fix It: Who Pays Up for Damaged Poles? Kenosha News. Available online: https://www.kenoshanews.com/news/fix-it-who-pays-up-for-damaged-poles/article_827b0977-0573-51bd-94a7-fea77c3b636c.html (accessed on 9 July 2015).
  6. Frank, M. Anatomy of a High-Speed Car Crash, Road & Track. 2013. Available online: https://www.roadandtrack.com/car-culture/a4916/features-web-originals-anatomy-of-a-high-speed-car-crash (accessed on 12 October 2022).
  7. Deb, A. Crashworthiness Design Issues for Lightweight Vehicles. In Materials, Design and Manufacturing for Lightweight Vehicles; Elsevier: Amsterdam, The Netherlands, 2021. [Google Scholar] [CrossRef]
  8. Sun, G.; Deng, M.; Zheng, G.; Li, Q. Design for cost performance of crashworthy structures made of high strength steel. Thin Walled Struct. 2019, 138, 458–472. [Google Scholar] [CrossRef]
  9. Li, Q.; Li, E.; Chen, T.; Wu, L.; Wang, G.; He, Z. Improve the frontal crashworthiness of vehicle through the design of front rail. Thin Walled Struct. 2021, 162, 107588. [Google Scholar] [CrossRef]
  10. Ispas, N.; Nastasoiu, M. Analysis of car’s frontal collision against pole. IOP Conf. Ser. Mater. Sci. Eng. 2017, 252, 012012. [Google Scholar] [CrossRef]
  11. Miscia, G.; Rotondella, V.; Baldini, A.; Bertocchi, E.; D’Agostino, L. Aluminum Structures in Automotive: Experimental and Numerical; Imece2015-51724; ASME: New York, NY, USA, 2015; pp. 1–10. [Google Scholar]
  12. Abdel-Nasser, Y.A. Frontal crash simulation of vehicles against lighting columns using FEM. Int. J. Traffic Transp. Eng. 2013, 52, 101–105. [Google Scholar] [CrossRef] [Green Version]
  13. Baranowski, P.; Damaziak, K. Numerical simulation of vehicle-lighting pole crash tests: Parametric study of factors influencing predicted occupant safety levels. Materials 2021, 14, 2822. [Google Scholar] [CrossRef] [PubMed]
  14. Elmarakbi, A.; Sennah, K.; Samaan, M.; Siriya, P. Crashworthiness of motor vehicle and traffic light pole in frontal collisions. J. Transp. Eng. 2006, 132, 722–733. [Google Scholar] [CrossRef]
  15. Wang, D.; Dong, G.; Zhang, J.; Huang, S. Car side structure crashworthiness in pole and moving deformable barrier side impacts. Tsinghua Sci. Technol. 2006, 11, 725–730. [Google Scholar] [CrossRef]
  16. Samaan, M.; Sennah, K. Crashworthiness of motor vehicle and luminaire support infrontal impact. Adv. Steel Struct. 2002, 2, 963–970. [Google Scholar] [CrossRef]
  17. Systèmes, D. Damage and Failure for Ductile Metals. SIMULIA User Assistance. 2022. Available online: https://help.3ds.com/2022/english/dssimulia_established/SIMACAEMATRefMap/simamat-c-damageinitductile.htm?contextscope=all&id=f06a4095538549bd805b6119b682e42d#simamat-c-damageinitductile-t-DamageInitiationCriteriaForFractureOfMetals-sma-topic1 (accessed on 12 October 2022).
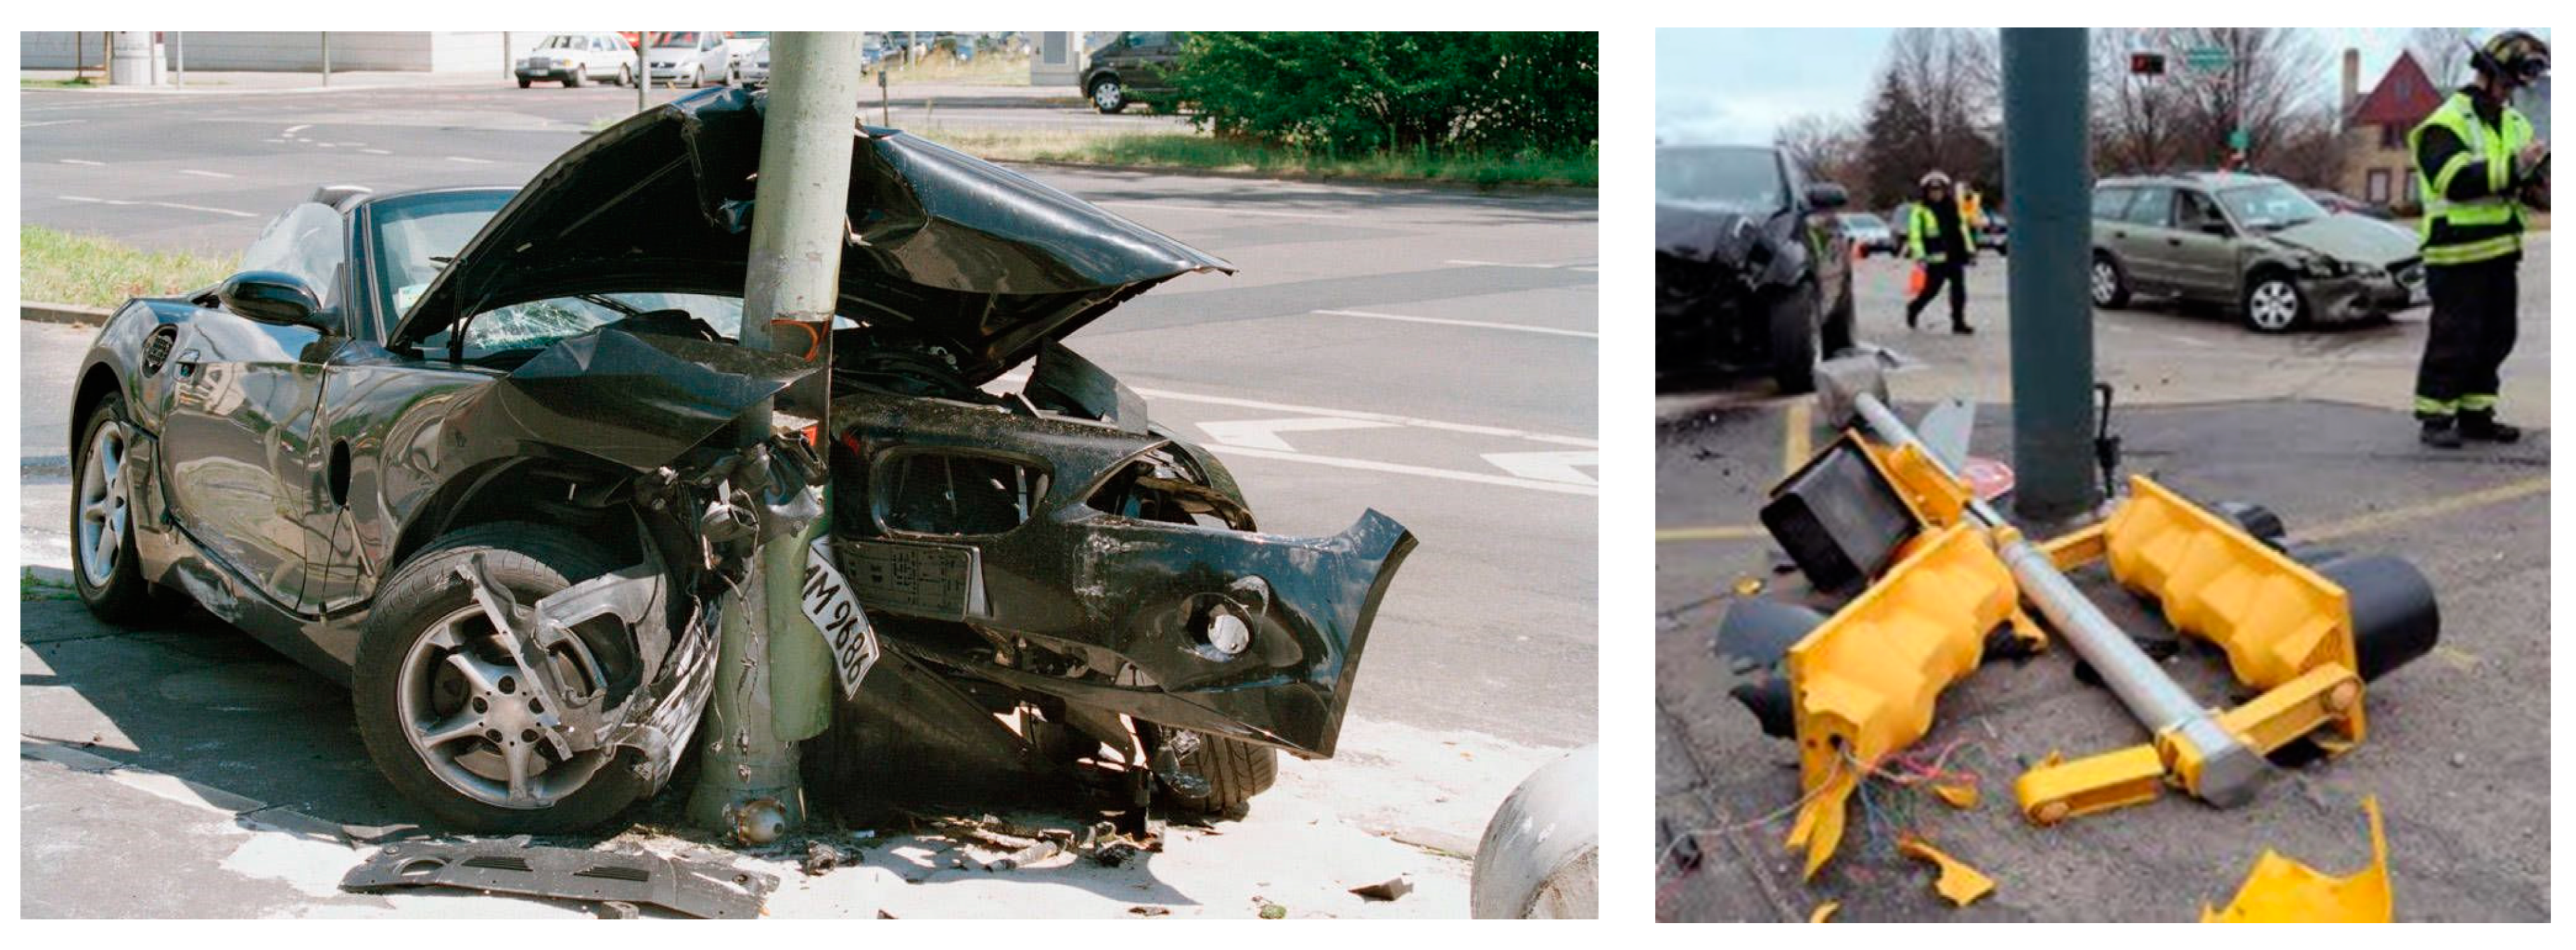
Figure 1. (Left) Traffic lights damaged beyond repair due to car accidents (source: Passino [5]). (Right) Corner impact of a sedan with a streetlamp (source: Frank [6]).
Applsci 12 12287 g001
Figure 2. Front and rear isometric views of the model after applying symmetry x-z plane symmetry.
Applsci 12 12287 g002
Figure 3. Side and underneath views of the vehicle assembly.
Applsci 12 12287 g003
Figure 4. Dimensions of the street pole’s geometry.
Applsci 12 12287 g004
Figure 5. Images representing the assembly placement of the vehicle and the street pole as the initial increment.
Applsci 12 12287 g005
Figure 6. Stress–strain curves of the three materials used in the simulation for the purpose of accurately calibrating their plastic properties.
Applsci 12 12287 g006
Figure 7. Mesh discretization of a corner impact simulation using solely hexahedral elements.
Applsci 12 12287 g007
Figure 8. Mesh sensitivity analysis by analyzing the plastic equivalent strain against refinement of the mesh.
Applsci 12 12287 g008
Figure 9. Mises stress distribution of front and corner impact at 12 m·s−1. (a) Front impact on steel pole, (b) corner impact on steel street pole, (c) front impact on aluminum street pole, and (d) corner impact on aluminum street pole.
Applsci 12 12287 g009
Figure 10. Contours on the deformation of the steel or aluminum street poles at 12 m·s−1. (a) Center impact on steel street pole, (b) corner impact on steel street pole, (c) center impact on aluminum street pole, and (d) corner impact on aluminum street pole.
Applsci 12 12287 g010aApplsci 12 12287 g010b
Figure 11. Specific energy absorption of the two materials in the crashworthiness analysis of 12 m·s−1.
Applsci 12 12287 g011
Figure 12. Comparison of absorbed energies at 48 km/h conducted by Elmarakbi et al. [14] (pictured within) and the absorbed energies at 12 m·s−1, which converted is about 43 km/h.
Applsci 12 12287 g012
Figure 13. Mises stress distribution of center and corner impact at 17 m·s−1. (a) Center impact on steel street pole, (b) corner impact on steel street pole, (c) center impact on aluminum street pole, and (d) corner impact on aluminum street pole.
Applsci 12 12287 g013aApplsci 12 12287 g013b
Figure 14. Comparison of absorbed energies at 48 km/h conducted by Elmarakbi et al. [14] (down image) and the absorbed energies of the street pole in this study (up image).
Applsci 12 12287 g014aApplsci 12 12287 g014b
Figure 15. Contours on the deformation of the steel or aluminum street poles at impact velocities of 17 m·s−1. (a) Center impact on steel street pole, (b) corner impact on steel street pole, (c) center impact on aluminum street pole, and (d) corner impact on aluminum street pole.
Applsci 12 12287 g015
Figure 16. Mises stress distribution of center and corner impact at 22 m·s−1. (a) Center impact on steel street pole, (b) corner impact on steel street pole, (c) center impact on aluminum street pole, and (d) corner impact on aluminum street pole.
Applsci 12 12287 g016
Figure 17. Contours on the deformation of the steel or aluminum street poles at impact velocities of 22 m·s−1. (a) Center impact on steel street pole, (b) corner impact on steel street pole, (c) center impact on aluminum street pole, and (d) corner impact on aluminum street pole.
Applsci 12 12287 g017aApplsci 12 12287 g017b
Figure 18. Total kinetic energies of frontal and corner collisions onto a steel streetlamp pole at 22 m·s−1. Notice that at corner impacts, the vehicle still attains kinetic energy, indicating that further motion of the vehicle is expected after a corner collision.
Applsci 12 12287 g018
Figure 19. Specific energy absorption of the two materials in the crashworthiness analysis of 22 m·s−1.
Applsci 12 12287 g019
Figure 20. Comparison of kinetic energies between the Al-6061 and A36 steel in the crashworthiness analysis of 22 m·s−1. Note that the kinetic energy of both materials at 12 m.s−1 is the same before the aluminum pole completely fractures off the base.
Applsci 12 12287 g020
Table 1. General properties of the three materials that were used in this paper including the elastic properties, plastic initialization, and the density as a requisite for dynamic explicit simulations.
MaterialYoung’s Modulus
(GPa)
Poisson’s RatioYield Stress
(MPa)
Density
(kgm−3)
Aluminum-505268.90.331402690
Aluminum-606169.50.332202780
Steel ASTM A362100.29247.57869
Table 2. Ductile damage properties of the three materials that were used in the simulations.
MaterialFracture StrainDisplacement after Fracture
(m)
Aluminum-50520.1050.002625
Aluminum-60610.0610.001525
Steel ASTM A360.240.006
Publisher’s Note: MDPI stays neutral with regard to jurisdictional claims in published maps and institutional affiliations.