Article

Numerical Simulation and Experimental Measurements of Dynamic Responses of Asphalt Pavement in Dry and Saturated Conditions under Full-Scale Accelerated Loading

1
National Center for Materials Service Safety, University of Science and Technology Beijing, Beijing 100083, China
2
The Sensing and Perception Lab, School of Environmental, Civil, Agricultural and Mechanical Engineering, University of Georgia, Athens, GA 30602, USA
*
Author to whom correspondence should be addressed.
Appl. Sci. 2022, 12(23), 12291; https://doi.org/10.3390/app122312291
Submission received: 17 October 2022 / Revised: 27 November 2022 / Accepted: 27 November 2022 / Published: 1 December 2022
(This article belongs to the Special Issue Advances in Asphalt Pavement Technologies and Practices)

Abstract

:
Asphalt pavement presents diverse dynamic responses to vehicle loading in dry and saturated conditions, which can be systematically explored by numerical simulation. Building a numerical model based on the actual conditions of asphalt pavement is necessary, and relevant field tests should be subsequently conducted to monitor dynamic responses to calibrate and validate the numerical model. On the basis of strictly controlling the paths of vehicle wheels during field tests, this study numerically analyzed the dynamic responses of asphalt pavement in dry and saturated conditions under full-scale accelerated loading. The trends of the modeling results were consistent with those of field measurements. The increase in vehicle load significantly increased the magnitudes of stress, strain, and pore water pressure, while vehicle speed showed an obvious impact on pore water pressure. The dynamic responses decreased with pavement depths. Water made the dynamic responses more complex, and pore water pressure significantly decreased with depth within the upper layer of saturated asphalt pavement. Transverse distributions of indicators presented obvious compressive states in the regions in direct contact with vehicle wheels, while tensile states were found in the range of the middle vehicle axle. The numerical results provided a basis for field measurements in future studies, especially for the exploration of factors of temperature and layer depth.

1. Introduction

Asphalt pavement presents diverse dynamic responses to vehicle loading in dry and saturated conditions. When surface runoff exists on the surface layer of roads, pore water pressure with positive and negative alternations will be generated by continuous interaction between vehicle wheels and water, which deteriorates service environments for asphalt pavement and gradually causes moisture damage [1]. Characterizing the dynamic responses of asphalt pavement is of great importance and can help to better understand the damage mechanism induced by dynamic pore water pressure and to improve relevant design methods for asphalt pavement with better service performance and long service life. Numerical simulation is a useful and convenient method to deeply explore the dynamic responses inside asphalt pavement in dry and saturated conditions, especially for those which may cost a lot and are not easily obtained from field measurements.
Great efforts have been made to evaluate the dynamic responses in dry and saturated asphalt pavement based on numerical simulation. Lu et al. [2] evaluated the influence of saturation on the base course of permeable pavement with a novel polyurethane binder using the methods of numerical simulation and a full-scale field test, while a great influence of water content was found on the hydromechanical properties of asphalt pavement. Caro et al. [3] numerically investigated the comprehensive influence of moisture diffusion and mechanical loading on the dynamic responses of flexible pavements. They found that moisture diffusion had a significant impact on the micromechanical response of asphalt layers, especially during the initial service months. Saad [4] analyzed the impact of excess water on the structural performance of flexible pavements using a 2D finite element model (FEM), in which both transient unsaturated flow and porous nonlinear behavior of foundations were taken into account. Sun et al. [5] constructed a 3D FEM model to discuss the dynamic response characteristics of saturated asphalt pavement under multifield coupling, and it was found that damage to the asphalt membrane is mainly caused by the cyclic effect of positive and negative pore water pressure. Peng et al. [6] applied a discrete element model to simulate the mechanical response of asphalt surfaces under moving traffic loads, and the factors of temperature gradient and fatigue damage could be taken into account simultaneously.
In order to evaluate the influence of water on the dynamic responses of asphalt pavement, accurately determining the detailed values of dynamic pore water pressure is necessary. Dong et al. [7] evaluated pore water pressure at the bottom of the upper layer with a vehicle speed of 60 km/h, and the positive magnitude was calculated at 332.2 kPa. Sheng et al. [8] obtained pore water pressure of less than 14 kPa on the top of the base layer with a vehicle speed of 60 km/h. Sun et al. [9] assessed pore water pressure of 60 kPa in the midpoint of the upper layer with a vehicle of 40 km/h. Xue and Liu [10] calculated the value of pore water pressure, which could reach more than 2.5 MPa. It could be found that numerical values of pore water pressure obtained from different research studies were diverse, which might be induced by the differences in the adopted FEM models. Furthermore, inevitable differences also existed between numerical models and actual asphalt pavement with complicated structures and service environments. In this case, building an FEM model based on the actual conditions of asphalt pavement is necessary, and relevant field measurements should also be subsequently conducted to monitor dynamic responses to calibrate and validate the FEM model.
Cooperating with field tests, the characteristics of the structural dynamic responses obtained from numerical simulation can thus be meaningful and reliable. A validated FEM model can further lay solid foundations for following systematic field tests. Real trucks are often used to apply loads on testing asphalt pavement [11,12,13,14,15], while relative positions between the embedded sensors and vehicle wheels are thus unavoidably affected by drivers’ subjective operation, which might cause deviations in the measured signals for each vehicle loading. Controlling the paths of vehicle wheels strictly is essential to ensure the accuracy of field measurements of structural dynamic responses.
The objective of this study is to numerically characterize the dynamic responses of asphalt pavement in dry and saturated conditions under full-scale accelerated loading. The FEM models in dry and saturated conditions are constructed using ABAQUS software (version 6.14-1). After characterizing time–history curves for structural dynamic responses, such as stress, strain, and pore water pressure, these indicators’ variation trends with vehicle load and speed are systematically discussed. The full-scale accelerated loading tests are conducted on the basis of strict controlling of the vehicle wheels’ paths to verify the feasibility and effectiveness of the FEM models. Finally, the validated FEM models are further applied to explore both the vertical and transverse distributions of stress, strain, and pore water pressure for asphalt pavement.

2. Numerical Simulation

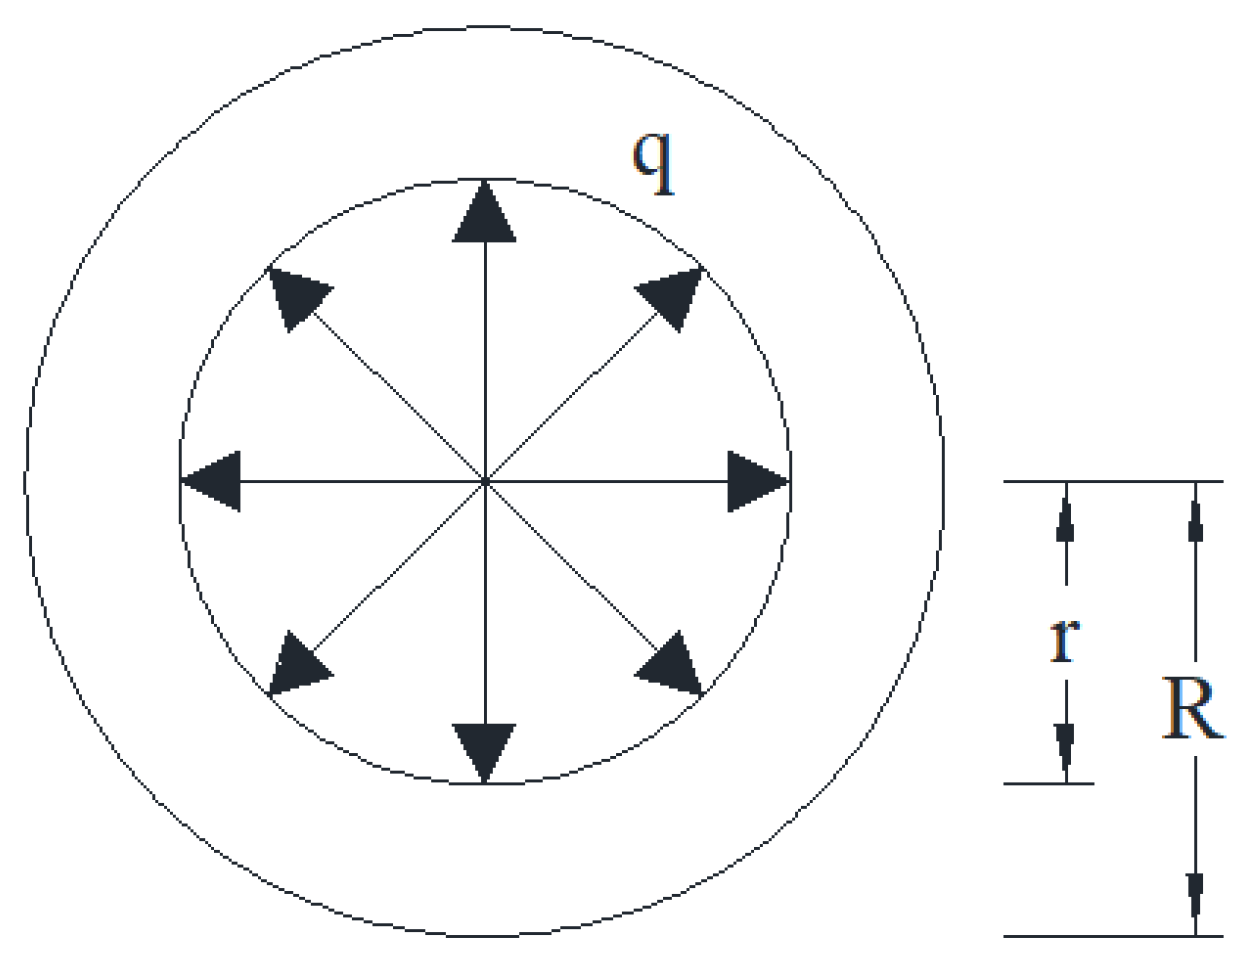
2.1. Theoretical Foundation

Asphalt mixture is a type of porous medium material. Based on the porous medium theory, a porous structure with liquid filled inside its pores can be regarded as a plate containing a circular pore according to elastic mechanics [8,16]. As shown in Figure 1, the radii of the pore and the plate are r and R, respectively; the pressure distribution inside the pore is q; and the distribution of tangential stress σθ at the edge of the pore can be expressed in the polar coordinate system as Equation (1), where ρ is the density of liquid inside the pore. Therefore, tensile stress will always be produced at the edge of the pore due to its internal pressure distribution, which will induce the raveling and stripping of asphalt mixture particles and eventually develop into moisture damage. Tensile stress at the edge of the pore is closely related to the porosity of the porous medium material and the increased rate of external stress.
σ θ = R 2 ρ 2 1 R 2 r 2 1 × q
Biot consolidation theory in soil mechanics is referred to in order to interpret the coupling effect between pore water pressure and the solid skeleton of porous medium inside the internal structure of asphalt pavement [17,18,19,20]. The theory assumes that the studied object is composed of an ideal elastic material, which is homogeneous and thoroughly saturated; the structural deformation is extremely small; both the material particle and its internal pore water are incompressible; and the pore water obeys Darcy’s law with a constant permeability coefficient. Based on Biot consolidation theory, the dynamic equilibrium equation of elastic porous medium is expressed as Equation (2) [21]. u , v s , and v f are displacement vector, velocity vector for porous medium, and velocity vector for fluid, respectively. G is porous medium shear modulus, and ν is its Poisson’s ratio. p and n are pore pressure and porosity, respectively, while ρs is porous medium density and ρf is fluid density. Further, the seepage continuous differential equation is shown as Equation (3), in which k is the permeability coefficient, and both βf and γf are the fluid compressibility coefficient and bulk density, respectively.
G 2 u + G 1 2 ν d i v u = p + ( 1 n ) ρ s v s t + n ρ f v f t
k γ f 2 p = n β f p t + ( d i v u ) t
The fluid–solid coupling effect inside the asphalt mixture is the interaction between water flow and solid medium. During the process of water seepage, internal pore water pressure will be changed under a vehicle load, which results in the change of effective stress and strain fields on the porous medium skeleton of the asphalt mixture and makes the pavement structure exist in a more severe environment. Moreover, these changes will further inversely affect water seepage and pore water pressure distribution inside asphalt pavement; for example, the compressed pore channel structure will accelerate the water flow. In fact, aggregate particles with different sizes randomly distribute inside the asphalt mixture, which makes the asphalt mixture exhibit physical and mechanical properties with anisotropy. Meanwhile, pore distribution inside the asphalt mixture is also not uniform. This study mainly investigates the influence of pore water pressure on structural dynamic responses of asphalt pavement at full-scale, which focuses on their variation trends presented by the entire asphalt pavement structure. In this case, the FEM models constructed in this study will not strictly limit at the microscale whether materials are homogeneous or not and whether pores are evenly distributed or not. The assumptions in Biot consolidation theory will not affect the research contents and objectives of this study. Furthermore, the full-scale accelerated loading tests will be conducted to validate the FEM models from two aspects: (1) directly comparing the measured and numerically calculated magnitudes of dynamic responses at the same parameter combination (vehicle speed of 20 km/h and single-wheel grounding pressure of 0.7MPa); (2) comparing whether the measured and numerically calculated magnitudes of dynamic responses show similar universal tendencies with vehicle speed and load.

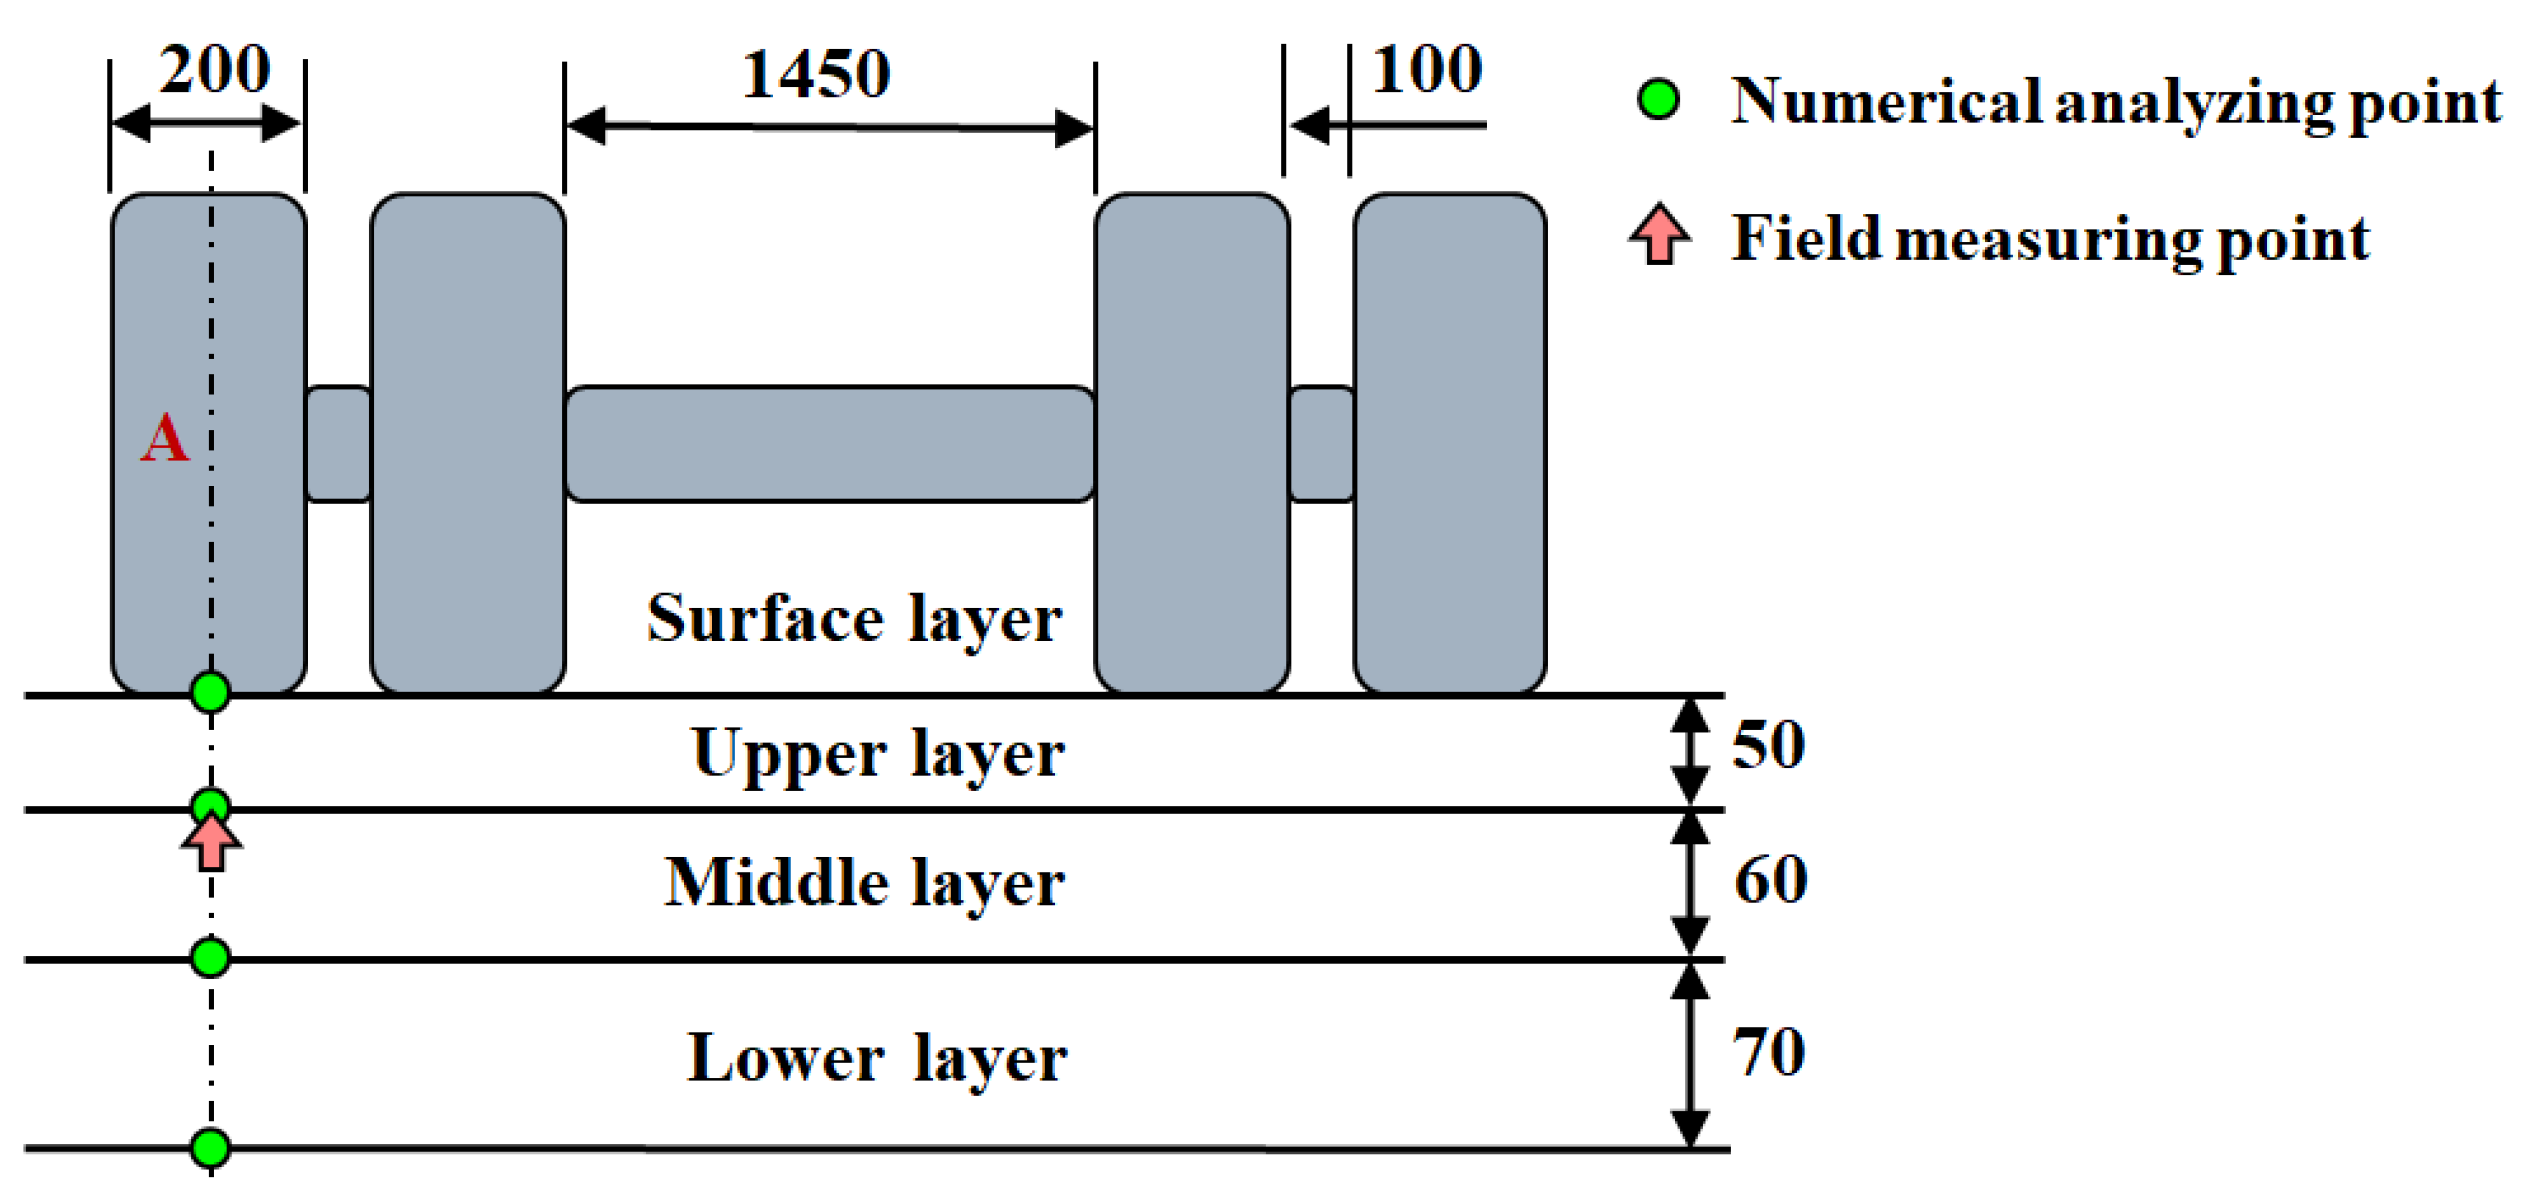
2.2. Finite Element Model

A two-dimensional FEM model of the asphalt pavement structure was established according to the dimension of the full-scale Natural Environment–Automatically Loaded Track (NE-ALT), which was 6 m in width and 3.53 m in depth. The detailed structural and material parameters are shown in Table 1, in which the values of the asphalt mixture moduli were obtained at 30 °C [12]. Materials of the base, sub-base, and subgrade are cement-stabilized gravel, lime fly-ash stabilized gravel, and soil, respectively, while this type of asphalt pavement structure can be classified as a semi-rigid road. For the asphalt pavement structure in dry and saturated conditions, two types of elements of CPE4R (a 4-node bilinear plane strain quadrilateral, reduced integration, hourglass control) and CPE4RP (a 4-node plane strain quadrilateral, bilinear displacement, bilinear pore pressure, reduced integration, hourglass control) were applied to mesh the FEM models, respectively. For the FEM model of the saturated asphalt pavement structure, three asphalt layers were permeable and saturated, while drainage only occurred inside the asphalt pavement structure but not on the model boundaries, which included the left, right, and bottom edges of the model. The FEM model of the asphalt pavement structure is shown in Figure 2.

2.3. Vehicle Loading Model

A single-axle four-wheel load model was constructed to simulate the rear axle wheels load of the vehicle simulator in the full-scale NE-ALT system, which applied vehicle loads on the asphalt pavement in the field site using a standard tandem-axle eight-wheel frame. The dimension of the vehicle load model is shown in Figure 3. The vehicle load was applied in the form of a half-sine function, as shown in Equation (4). Two levels of wheel–ground contact pressure were taken into account, which were 0.7 MPa and 1.4 MPa. Three levels of vehicle speed were selected for further discussion, which included 20 km/h, 60 km/h, and 100 km/h, respectively. The loading durations corresponding to different vehicle speeds are summarized in Table 2. The duration of 0.05 s without any vehicle load was added before and after the formal loading for the purpose of convenient data analysis. In this study, the moments when vehicle loads reached their maximum values at different vehicle speeds are calculated and presented in Table 2. For example, when the vehicle speed is 20 km/h, its formal loading duration is determined at 0.036 s, and it will take 0.05 s and the half of 0.036 s to reach the maximum loading value, that is, 0.068 s.
{ p = p max sin | π t T | , 0 t T P = 0 , T t T a

2.4. Evaluation Indicators

The testing profile A located in the middle of the outer wheel in the vehicle loading model was systematically discussed, as shown in Figure 3. Four depths were taken into account, which included surface layer (h = 0 m), upper layer bottom (h = 0.05 m), middle layer bottom (h = 0.11 m), and lower layer bottom (h = 0.18 m). In particular, the distance between testing profile A and the left boundary of the FEM model was 1.875 m. Several indicators such as vertical stress, strains in vertical and transverse directions, and pore water pressure were considered, and their time–history curves and magnitude variation trends with different vehicle speeds and loads were discussed. Moreover, spatial distributions of these indicators were characterized, which mainly included vertical and transverse distributions. In particular, a minus sign in values of stress and strain calculated from the numerical simulation meant that the indicators were in compression.

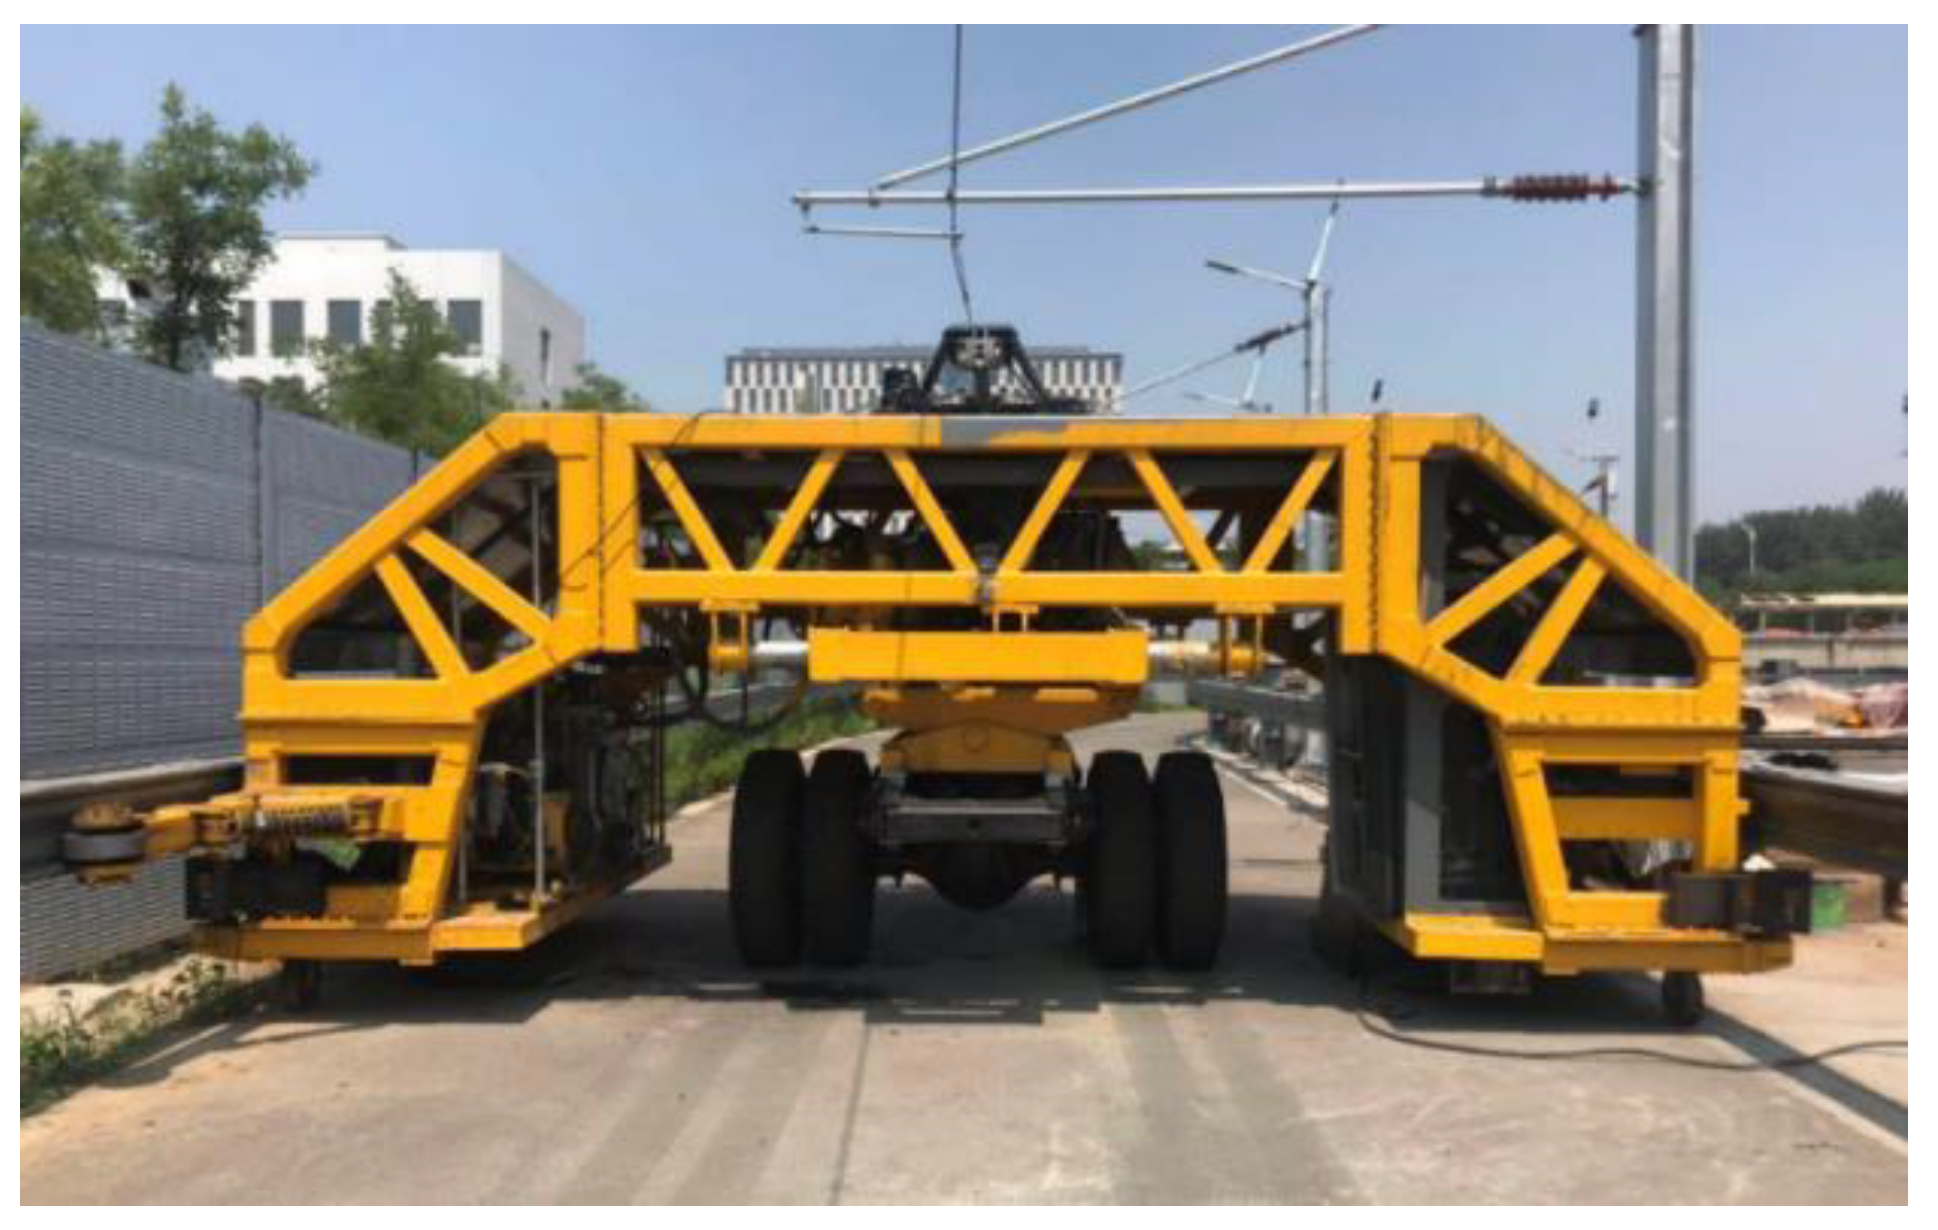
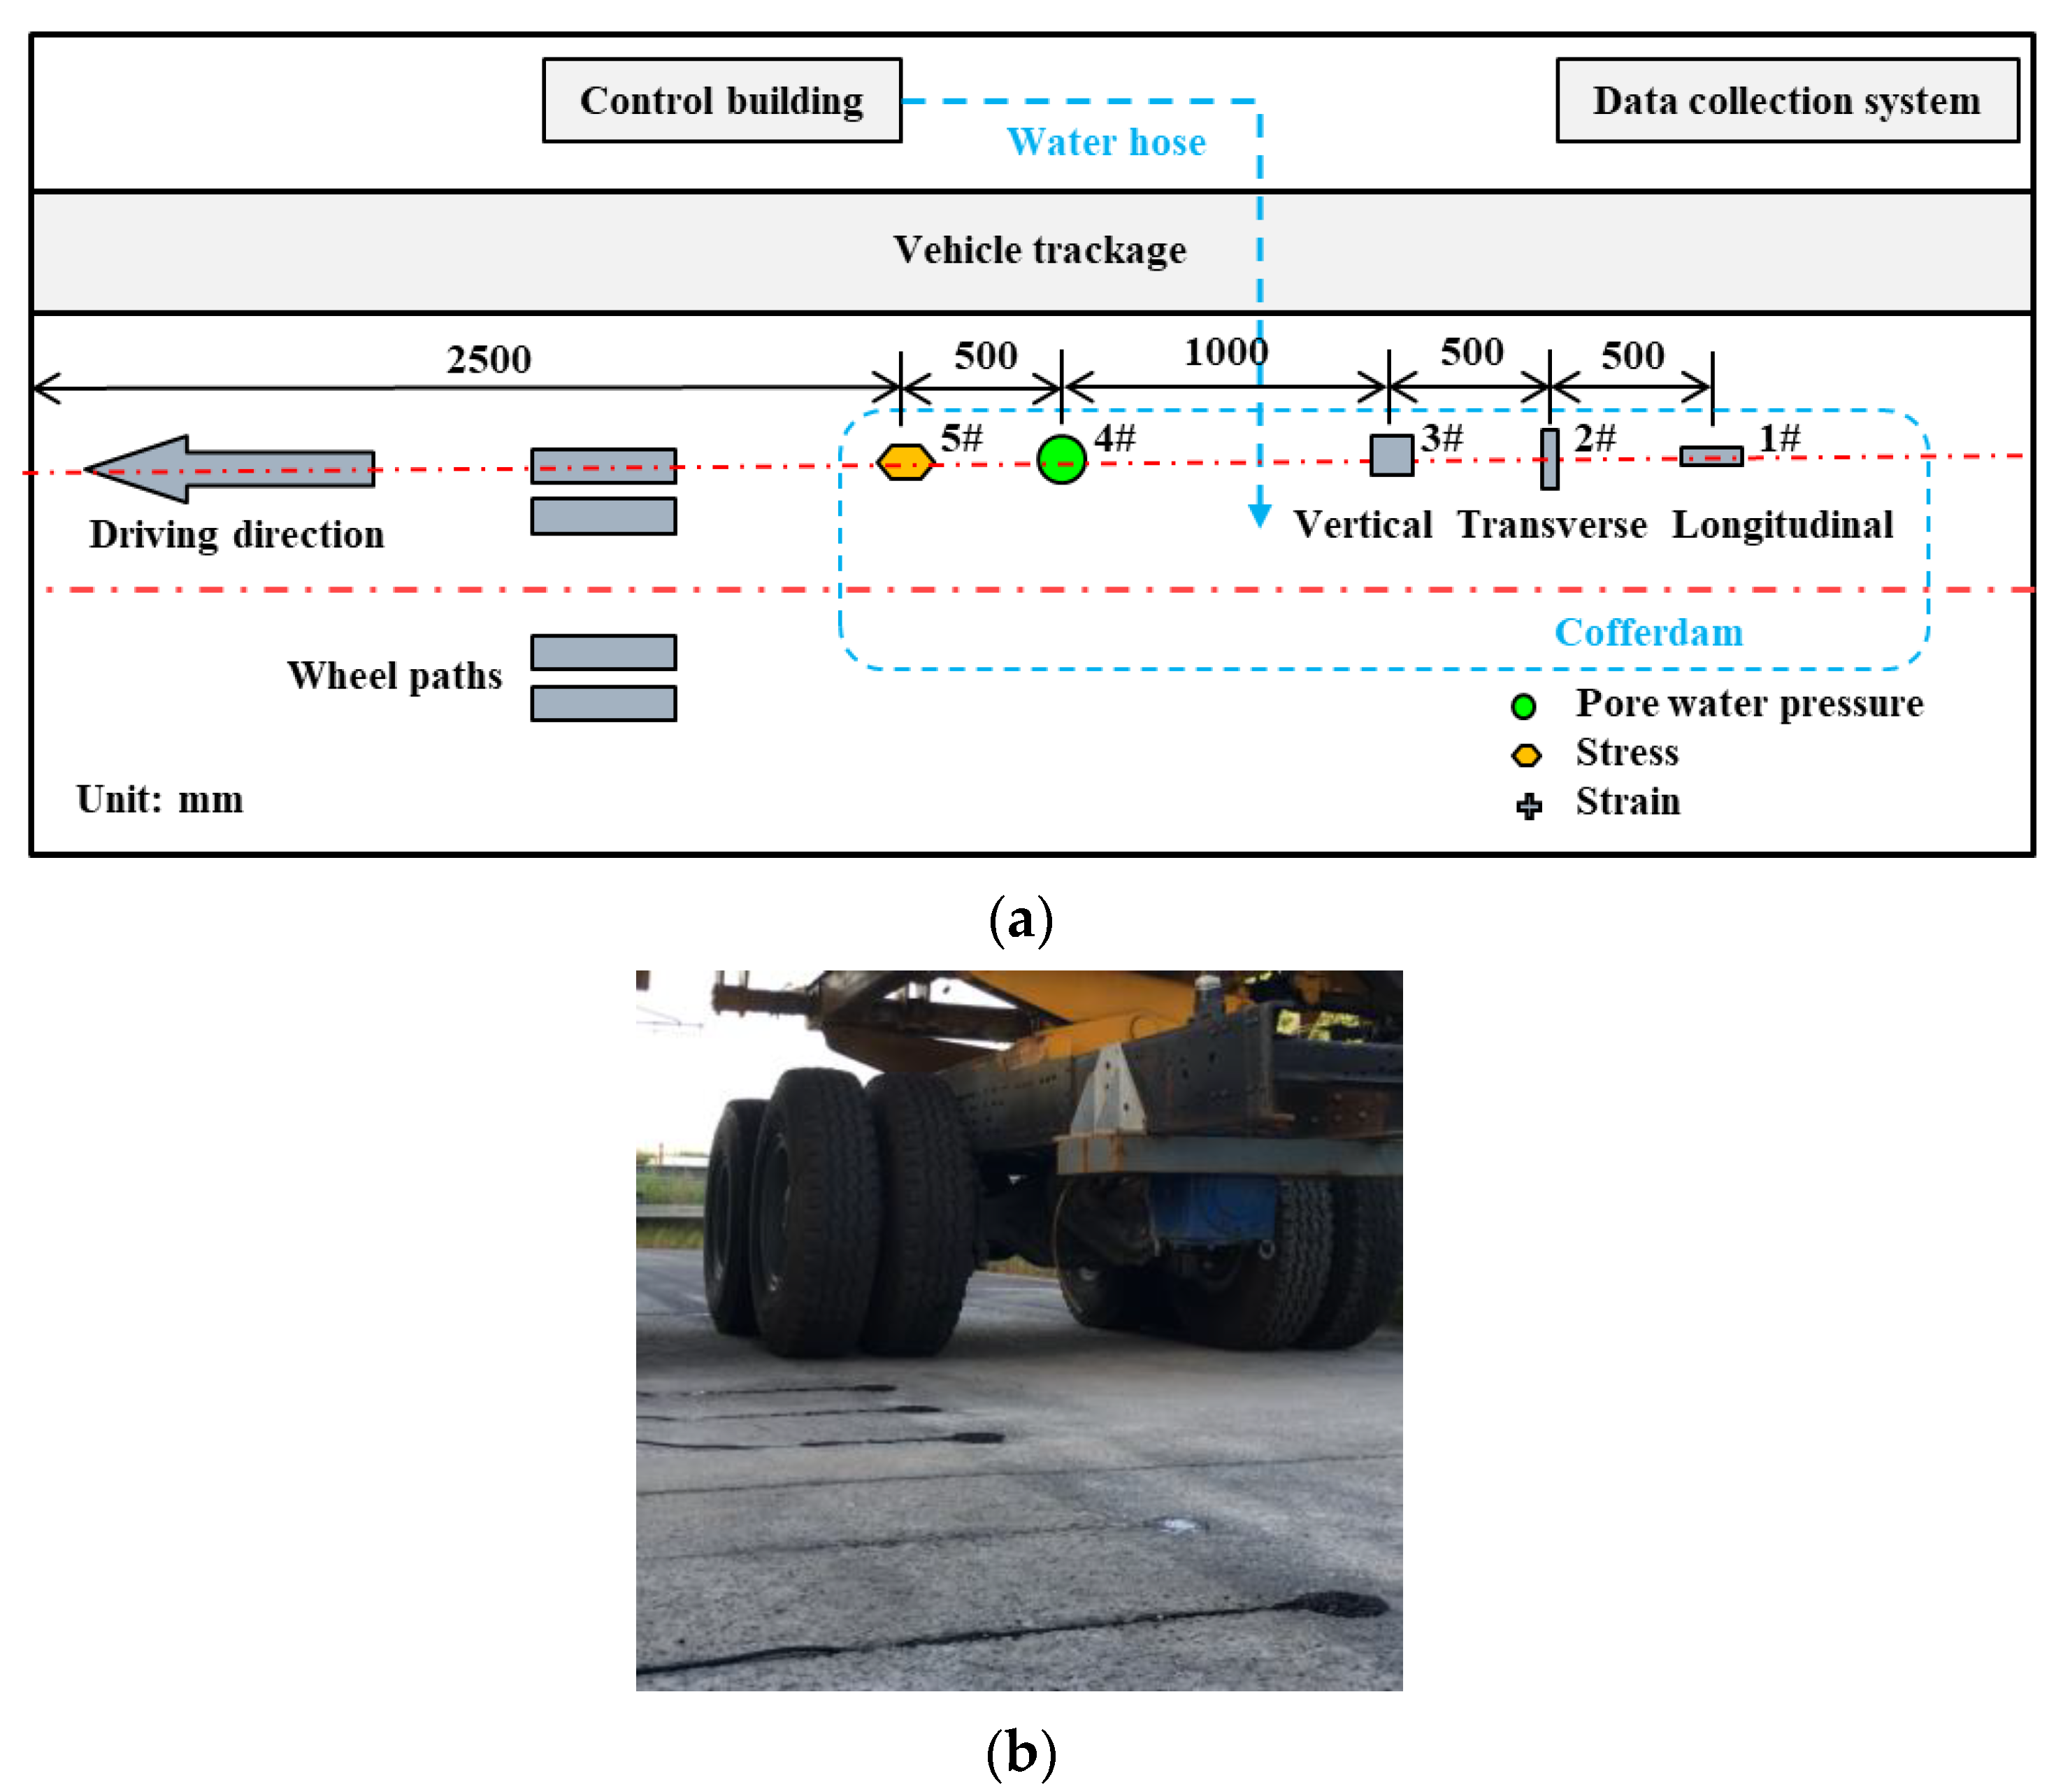
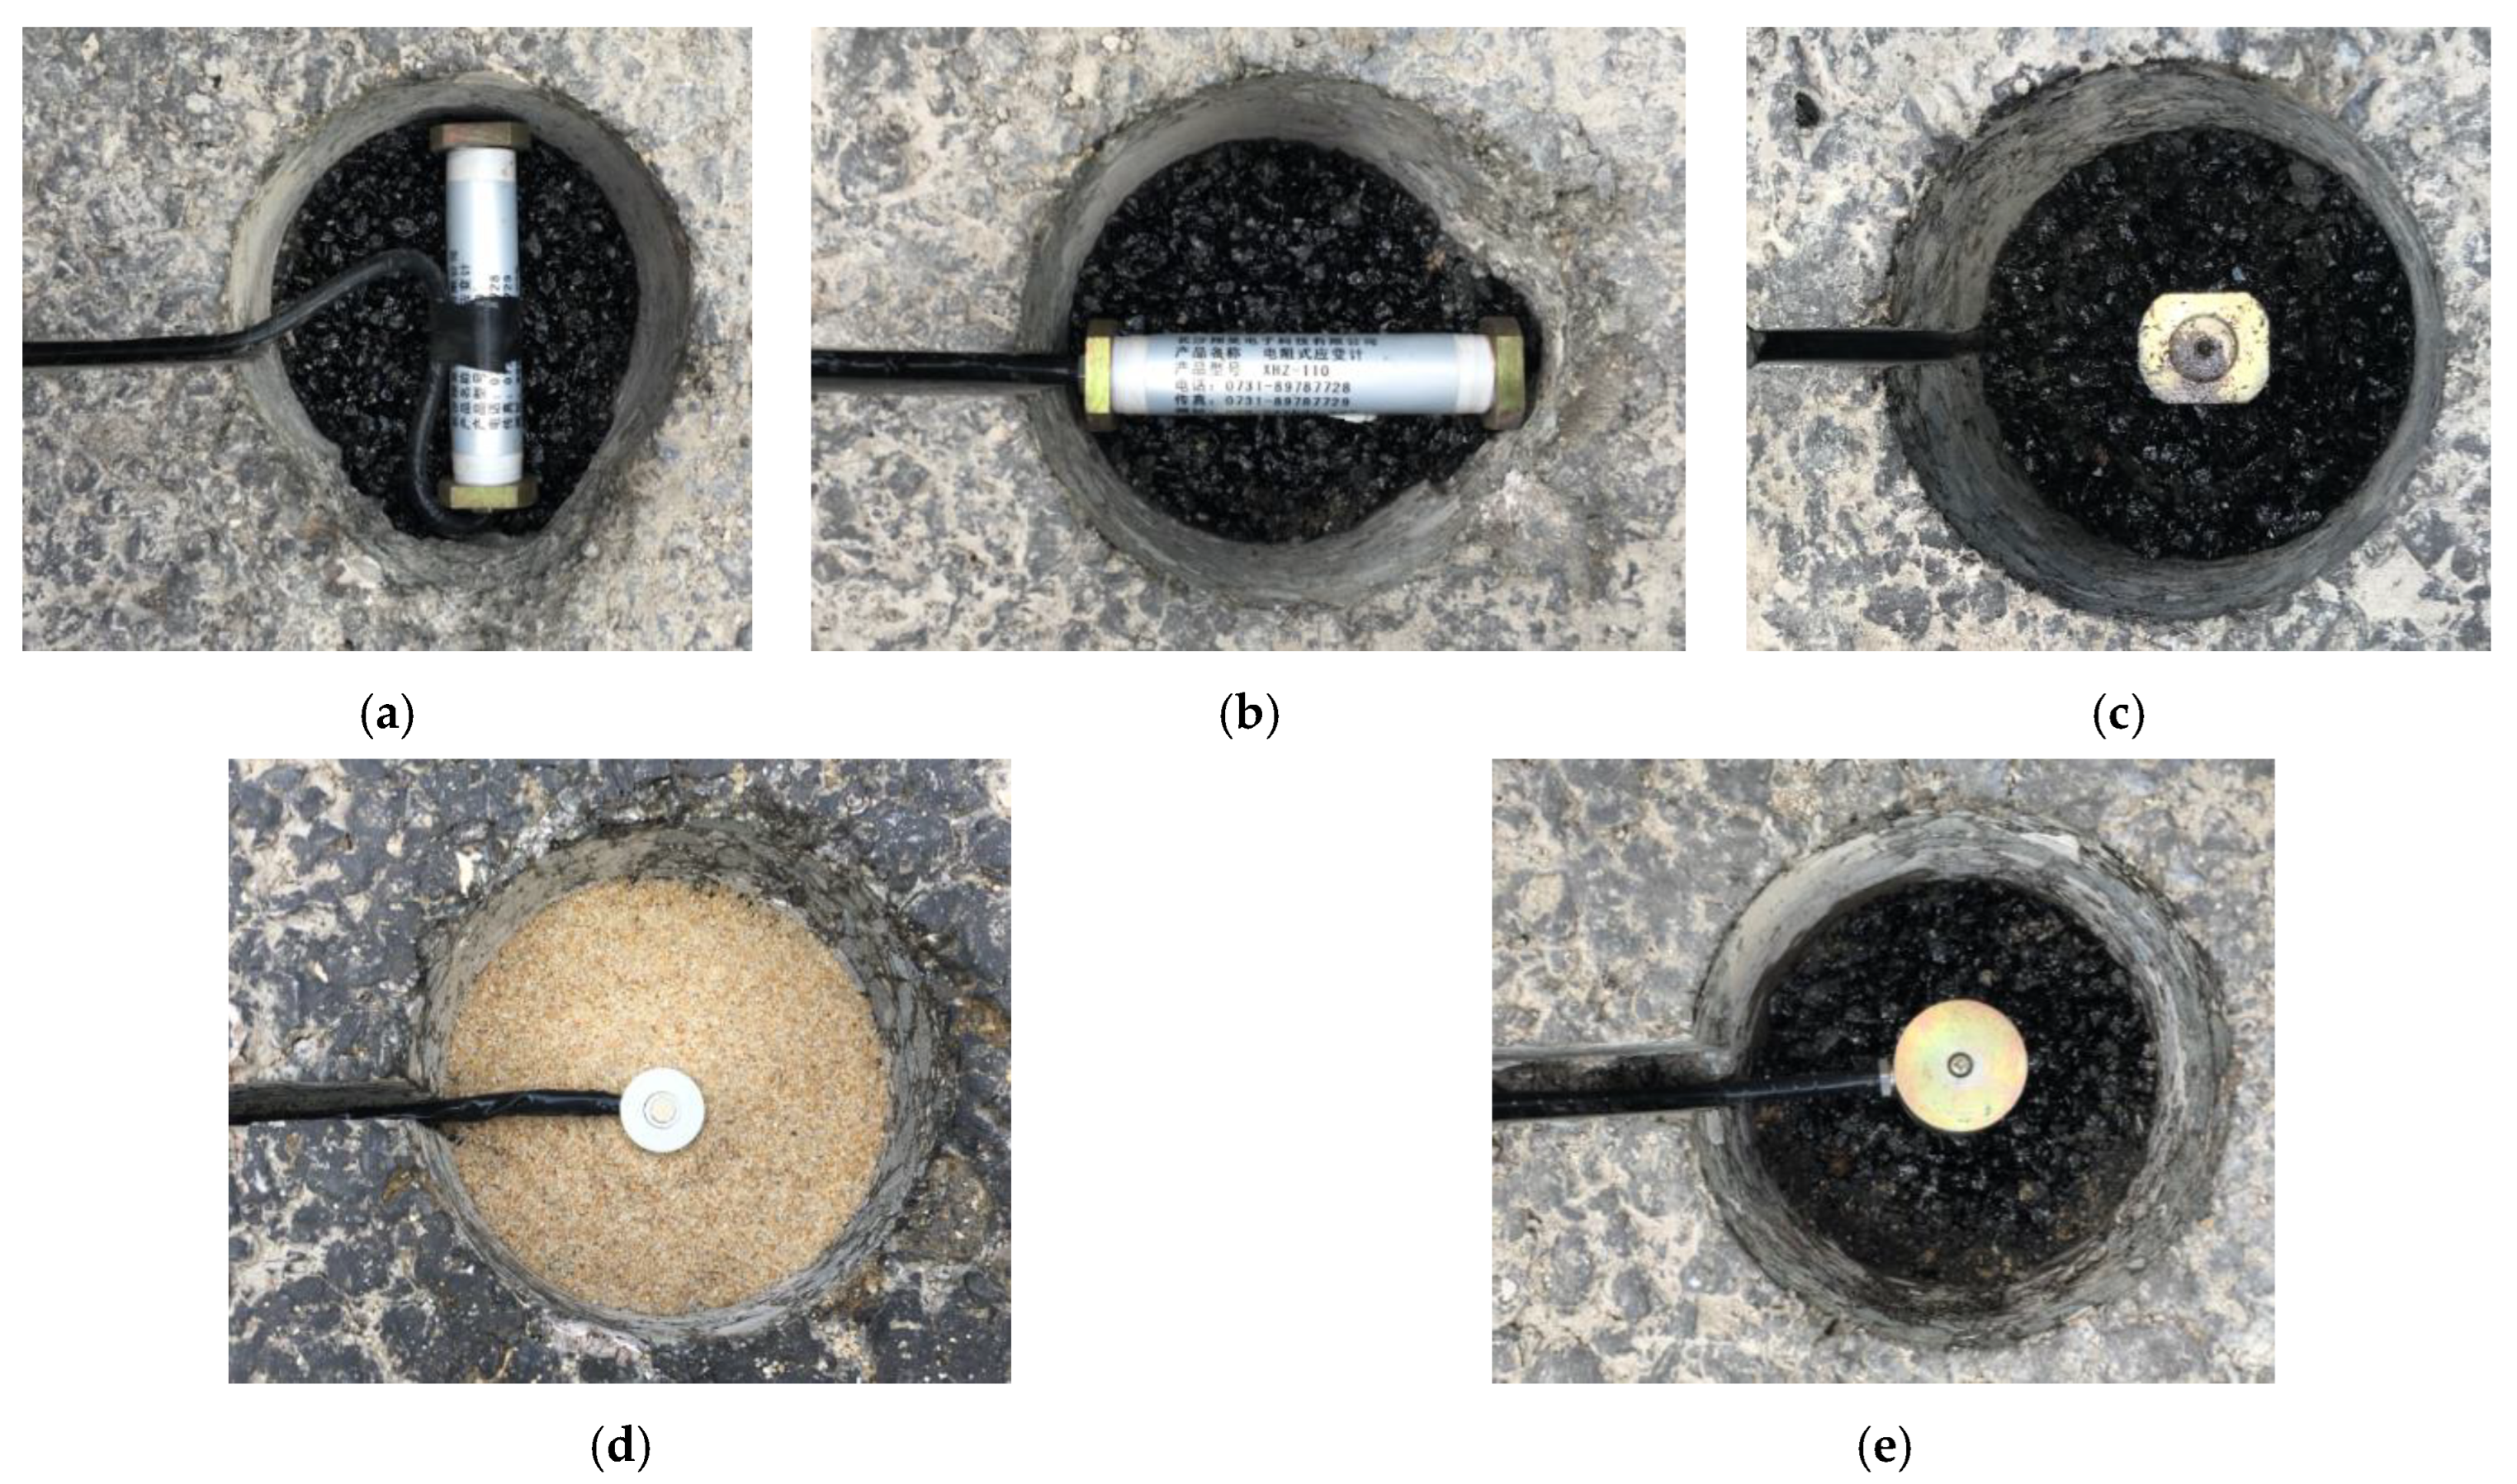
3. Full-Scale Accelerated Loading Test

The full-scale accelerated loading test was conducted using the full-scale NE-ALT system (National Center for Materials Service Safety, University of Science and Technology Beijing, Beijing, China, 2022) to measure the dynamic responses of asphalt pavement in dry and saturated conditions. The full-scale NE-ALT system is mainly composed of a loop testing track and a vehicle simulator, as shown in Figure 4. The former includes two 40 m linear segments and two 60 m curve segments, while the field test site was set at the middle position of a linear segment. The latter simulates vehicle loading using a standard tandem-axle eight-wheel frame, and relevant sensors, which included stress, strain (in vertical, transverse, and longitudinal directions), and pore water pressure were buried in the middle of the outer wheel path nearest to the control building, as shown in Figure 5. The strain sensor’s dimension is 30 mm in diameter and 110 mm in length, the stress sensor’s dimension is 35 mm in diameter and 25 mm in height, and the dimension of the pore water pressure sensor is 20 mm in diameter and 10 mm in height, as shown in Figure 6. The measuring ranges of stress, strain, and pore water pressure are 0–1.5 MPa, −1500–1500 με, and −0.1–1.0 MPa, respectively. The measuring frequency was controlled at 1 kHz. The buried depths of these sensors were all controlled at 0.05 m, which made the sensors’ effective testing surfaces located at the bottom of the upper layer of asphalt pavement. The vehicle simulator drives along the guide track located on two sides of asphalt pavement, which makes it possible to strictly control the relative positions between sensors and wheel paths.
The vehicle speed and load are controlled by adjusting the motor’s revolutions per minute (RPM) and the servohydraulic system’s applied vertical load, respectively, while relevant adjustable ranges are 0–30 km/h and 8–28 tons, respectively. Signals generated by rear axle wheels were measured and analyzed in this study, which mainly reflected the characteristics of internal structural dynamic responses, especially for asphalt pavement in saturated conditions [1]. A series of vehicle loading parameter combinations are proposed to evaluate variation trends of dynamic responses of asphalt pavement in dry and saturated conditions, as shown in Table 3. In particular, the vehicle load in field tests was represented as single-wheel grounding pressure. Field tests were conducted in the weather with the air temperature around 28 °C, while tests in dry conditions were first conducted and followed by those in saturated conditions. To saturate the asphalt pavement, a hose with its tap kept open was placed on the road surface to continually water the asphalt pavement through the entire night, then the asphalt layers were thoroughly saturated from the road surface to its bottom layer. As surface runoff was unavoidably taken away by the moving vehicle tires during the field tests in saturated conditions, the method of continuously watering was taken to supply enough surface runoff with a certain depth on the asphalt pavement. More details concerning field tests can be found in Reference [22]. In particular, the parameter combination of single-wheel grounding pressure of 0.7 MPa and vehicle speed of 20 km/h in the field measurements was set the same as that in the numerical simulation. Signal magnitudes were obtained by MATLAB programming and further analyzed to validate the numerical simulation.

4. Results and Discussions

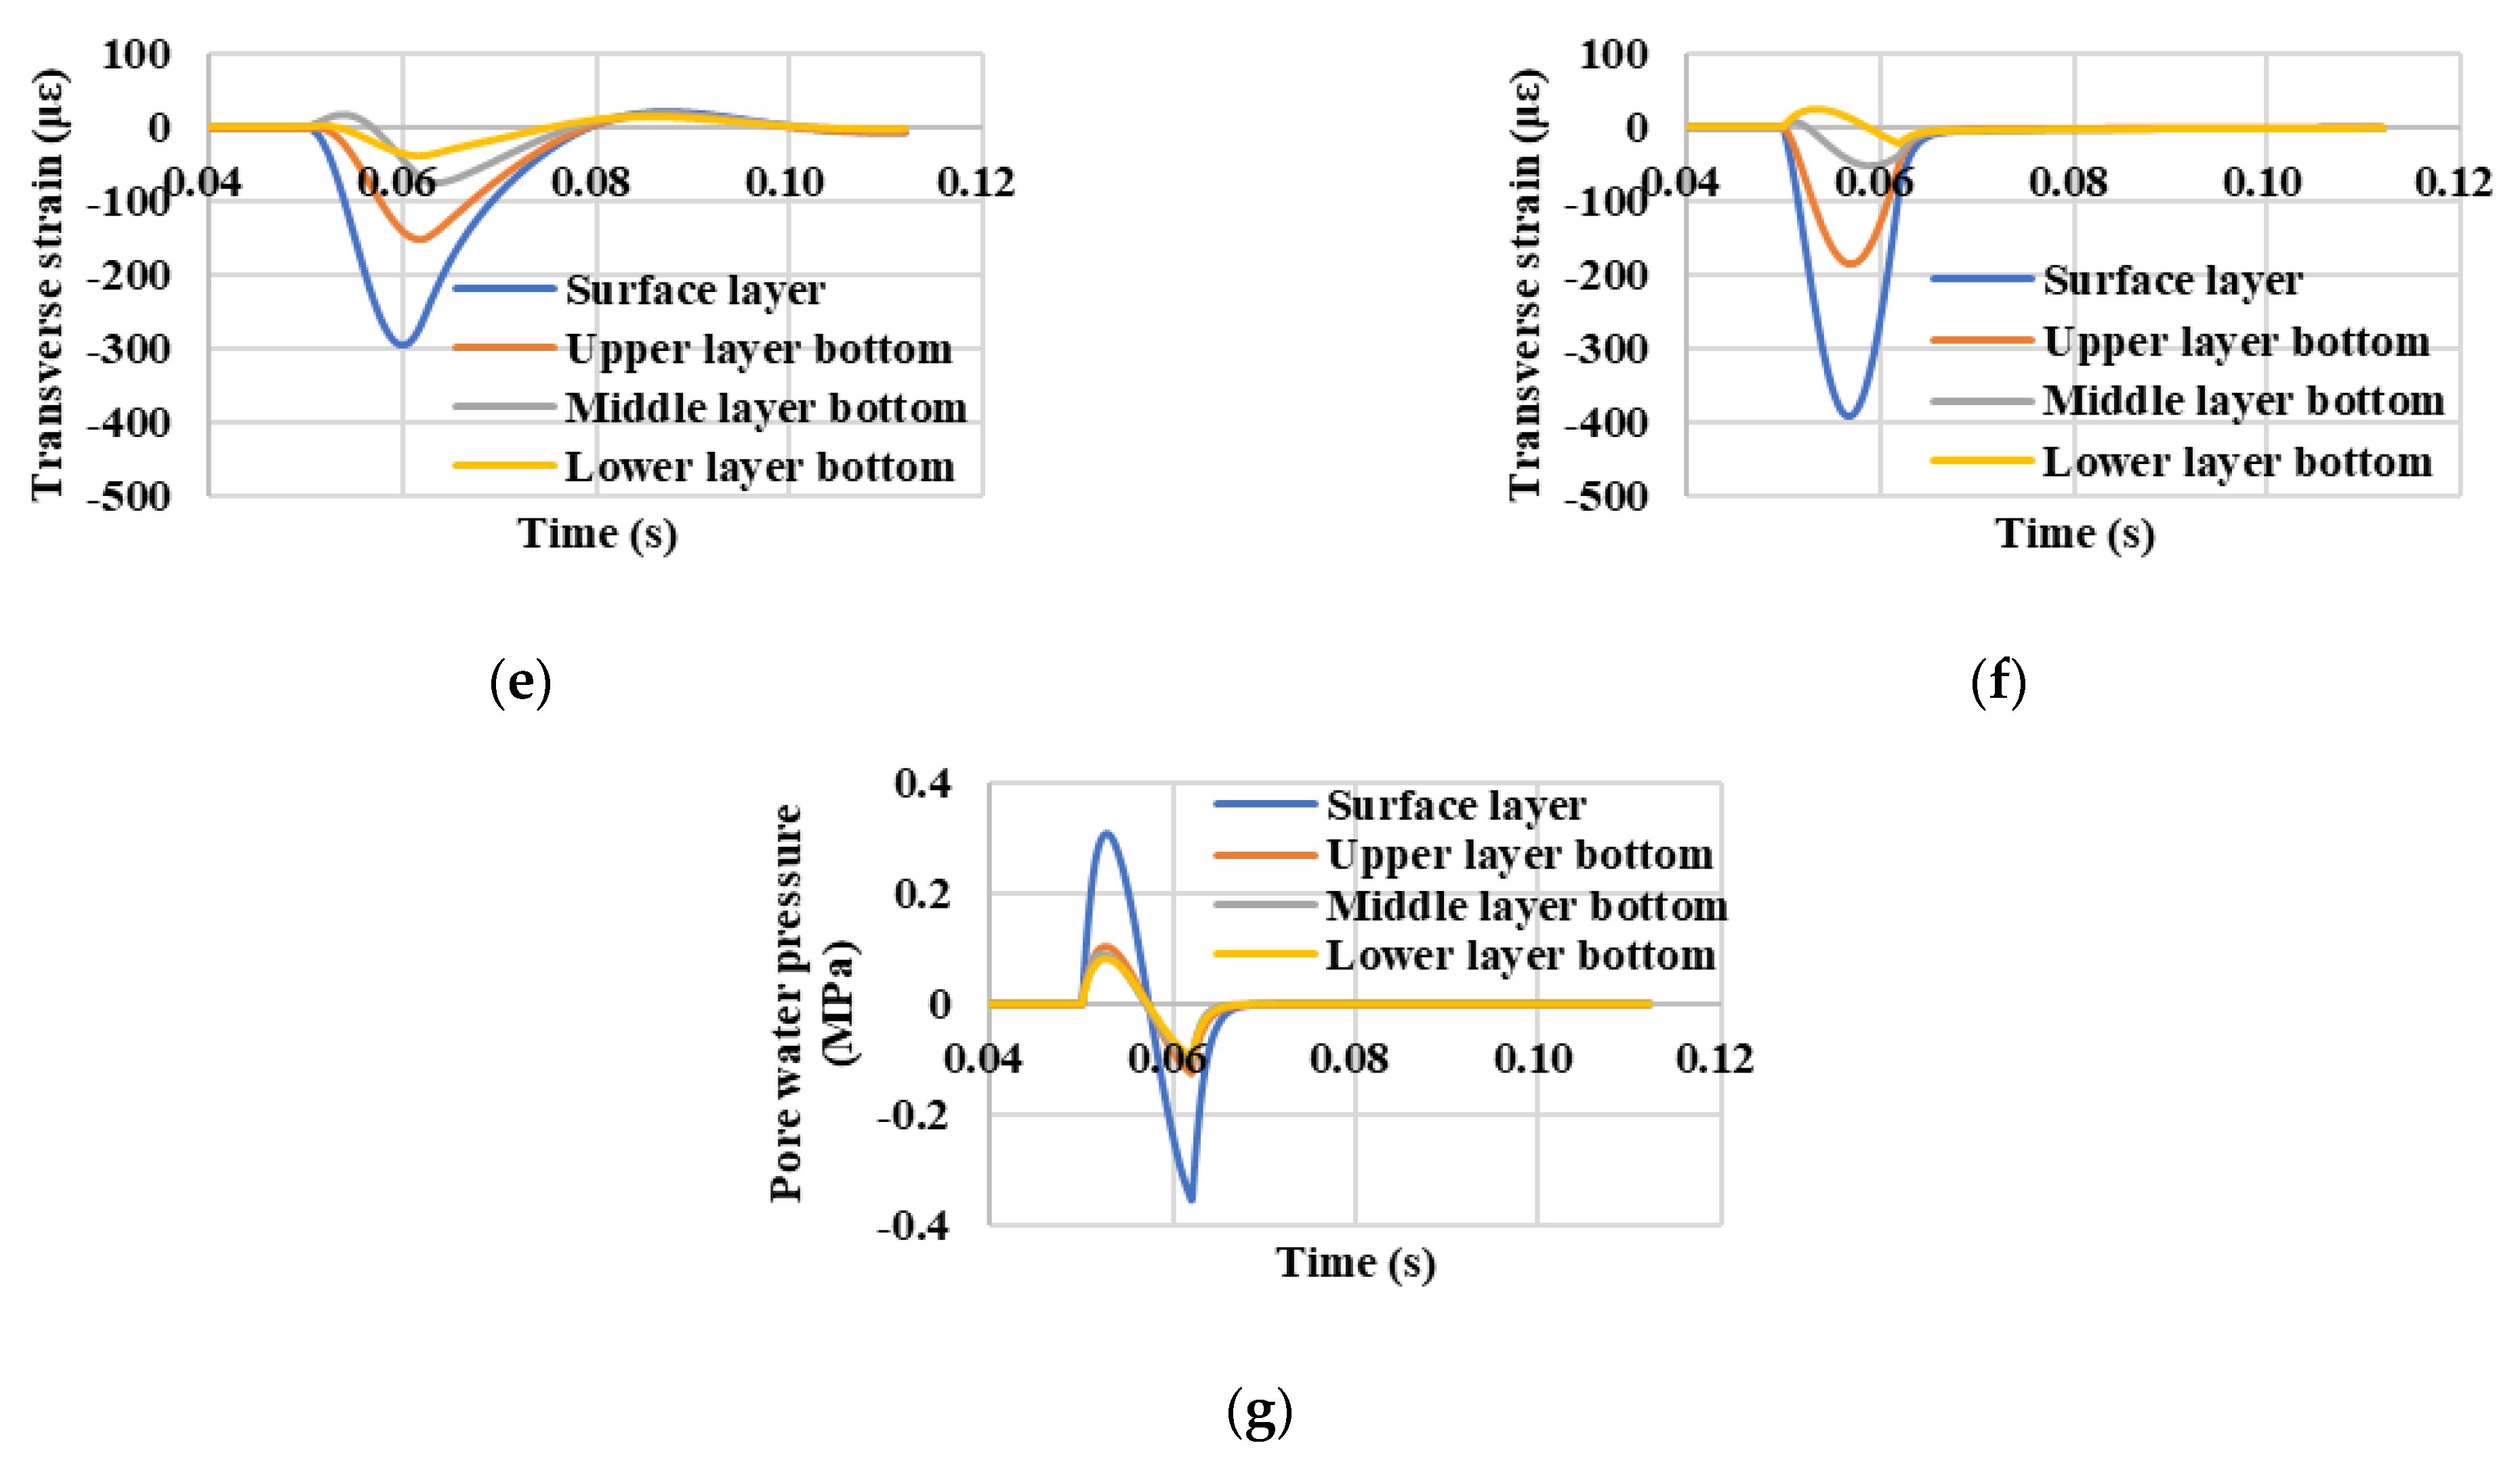
4.1. Characteristics of Time–History Curves by FEM Analysis

Structural dynamic responses exhibited by asphalt pavement under vehicle load were highly related to its located service environment. In this study, dynamic responses of asphalt pavement in dry and saturated conditions were numerically analyzed under the controlled parameter combination of a vehicle speed at 60 km/h and a vehicle load at 0.7 MPa. Time–history curves for indicators in different depths, such as vertical stress, strains in vertical and transverse directions, and pore water pressure, are obtained and summarized in Figure 7.
Comparing Figure 7a,b, the magnitudes of vertical stress in dry and saturated conditions showed obvious downward trends with the increase in structural depth of asphalt pavement. However, vertical stress in saturated conditions in the surface layer exhibited minor tensile stress inversely at the initial stage of vehicle loading. In particular, vertical stress obtained in saturated conditions showed relatively larger magnitudes than that obtained from dry conditions. This phenomenon was also found in field tests, as shown in Section 4.3.1 and Section 4.3.2. Considering the effective stress principle, the entire stress should be theoretically decreased as the generation of pore water pressure [20,23], and it can thus be inferred that stress in transverse and longitudinal directions may decrease to a certain extent in saturated conditions. This assumption will be explored and verified by conducting systematic field tests in future studies.
Comparing Figure 7c,d, vertical strain curves in dry conditions all showed apparent phenomena of compressive and tensile alternations. For saturated asphalt pavement, the alternating phenomenon of vertical strain only occurred in the surface layer but not in the internal structure, while the alternation exhibited an inverse appearing order of compression and tension compared with that in dry conditions. Vertical strain showed maximum compressive values at the bottom of the middle layer in both dry and saturated conditions, while water also resulted in a relatively larger value of vertical compressive strain at the bottom of the lower layer in saturated conditions. Comparing Figure 7e,f, tensile transverse strain appeared at the bottom of the middle layer in dry and saturated conditions, while the tensile zone continually extended to the bottom of the lower layer. After vehicle loading, transverse strain exhibited an obvious phenomenon in dry conditions that strain changed from compression to tension due to the hysteresis property of the asphalt mixture, while this phenomenon was not apparent in saturated conditions, which might be restrained by water.
Time–history curves of pore water pressure in different saturated structural layers of the asphalt pavement are shown in Figure 7g. Vehicle wheel grounding pressure was applied in the form of a half-sine function on asphalt pavement. When the vehicle load was applied from small to large values, the water in front of the vehicle wheels was squeezed into the asphalt pavement structure and positive pore water pressure was thus produced. When the vehicle load gradually decreased from a large value to simulate the process that a vehicle drove away, the water behind the vehicle wheels was pumped out of the asphalt pavement structure, and negative pore water pressure was then generated. It could be clearly found that the surface layer, which directly contacted the vehicle wheels, produced a relatively larger value of pore water pressure, but the magnitudes of pore water pressure generated inside asphalt pavement decreased significantly. In this case, the statement that an obvious difference existed between external and internal dynamic pore water pressure could thus be verified [1]. The magnitude of pore water pressure inside asphalt pavement gradually decreased with the increase in structural depth. However, the magnitudes of the external and internal dynamic pore water pressure may vary with the layer depths [10], so we think systematical field tests need to be conducted to discuss this issue in the future.

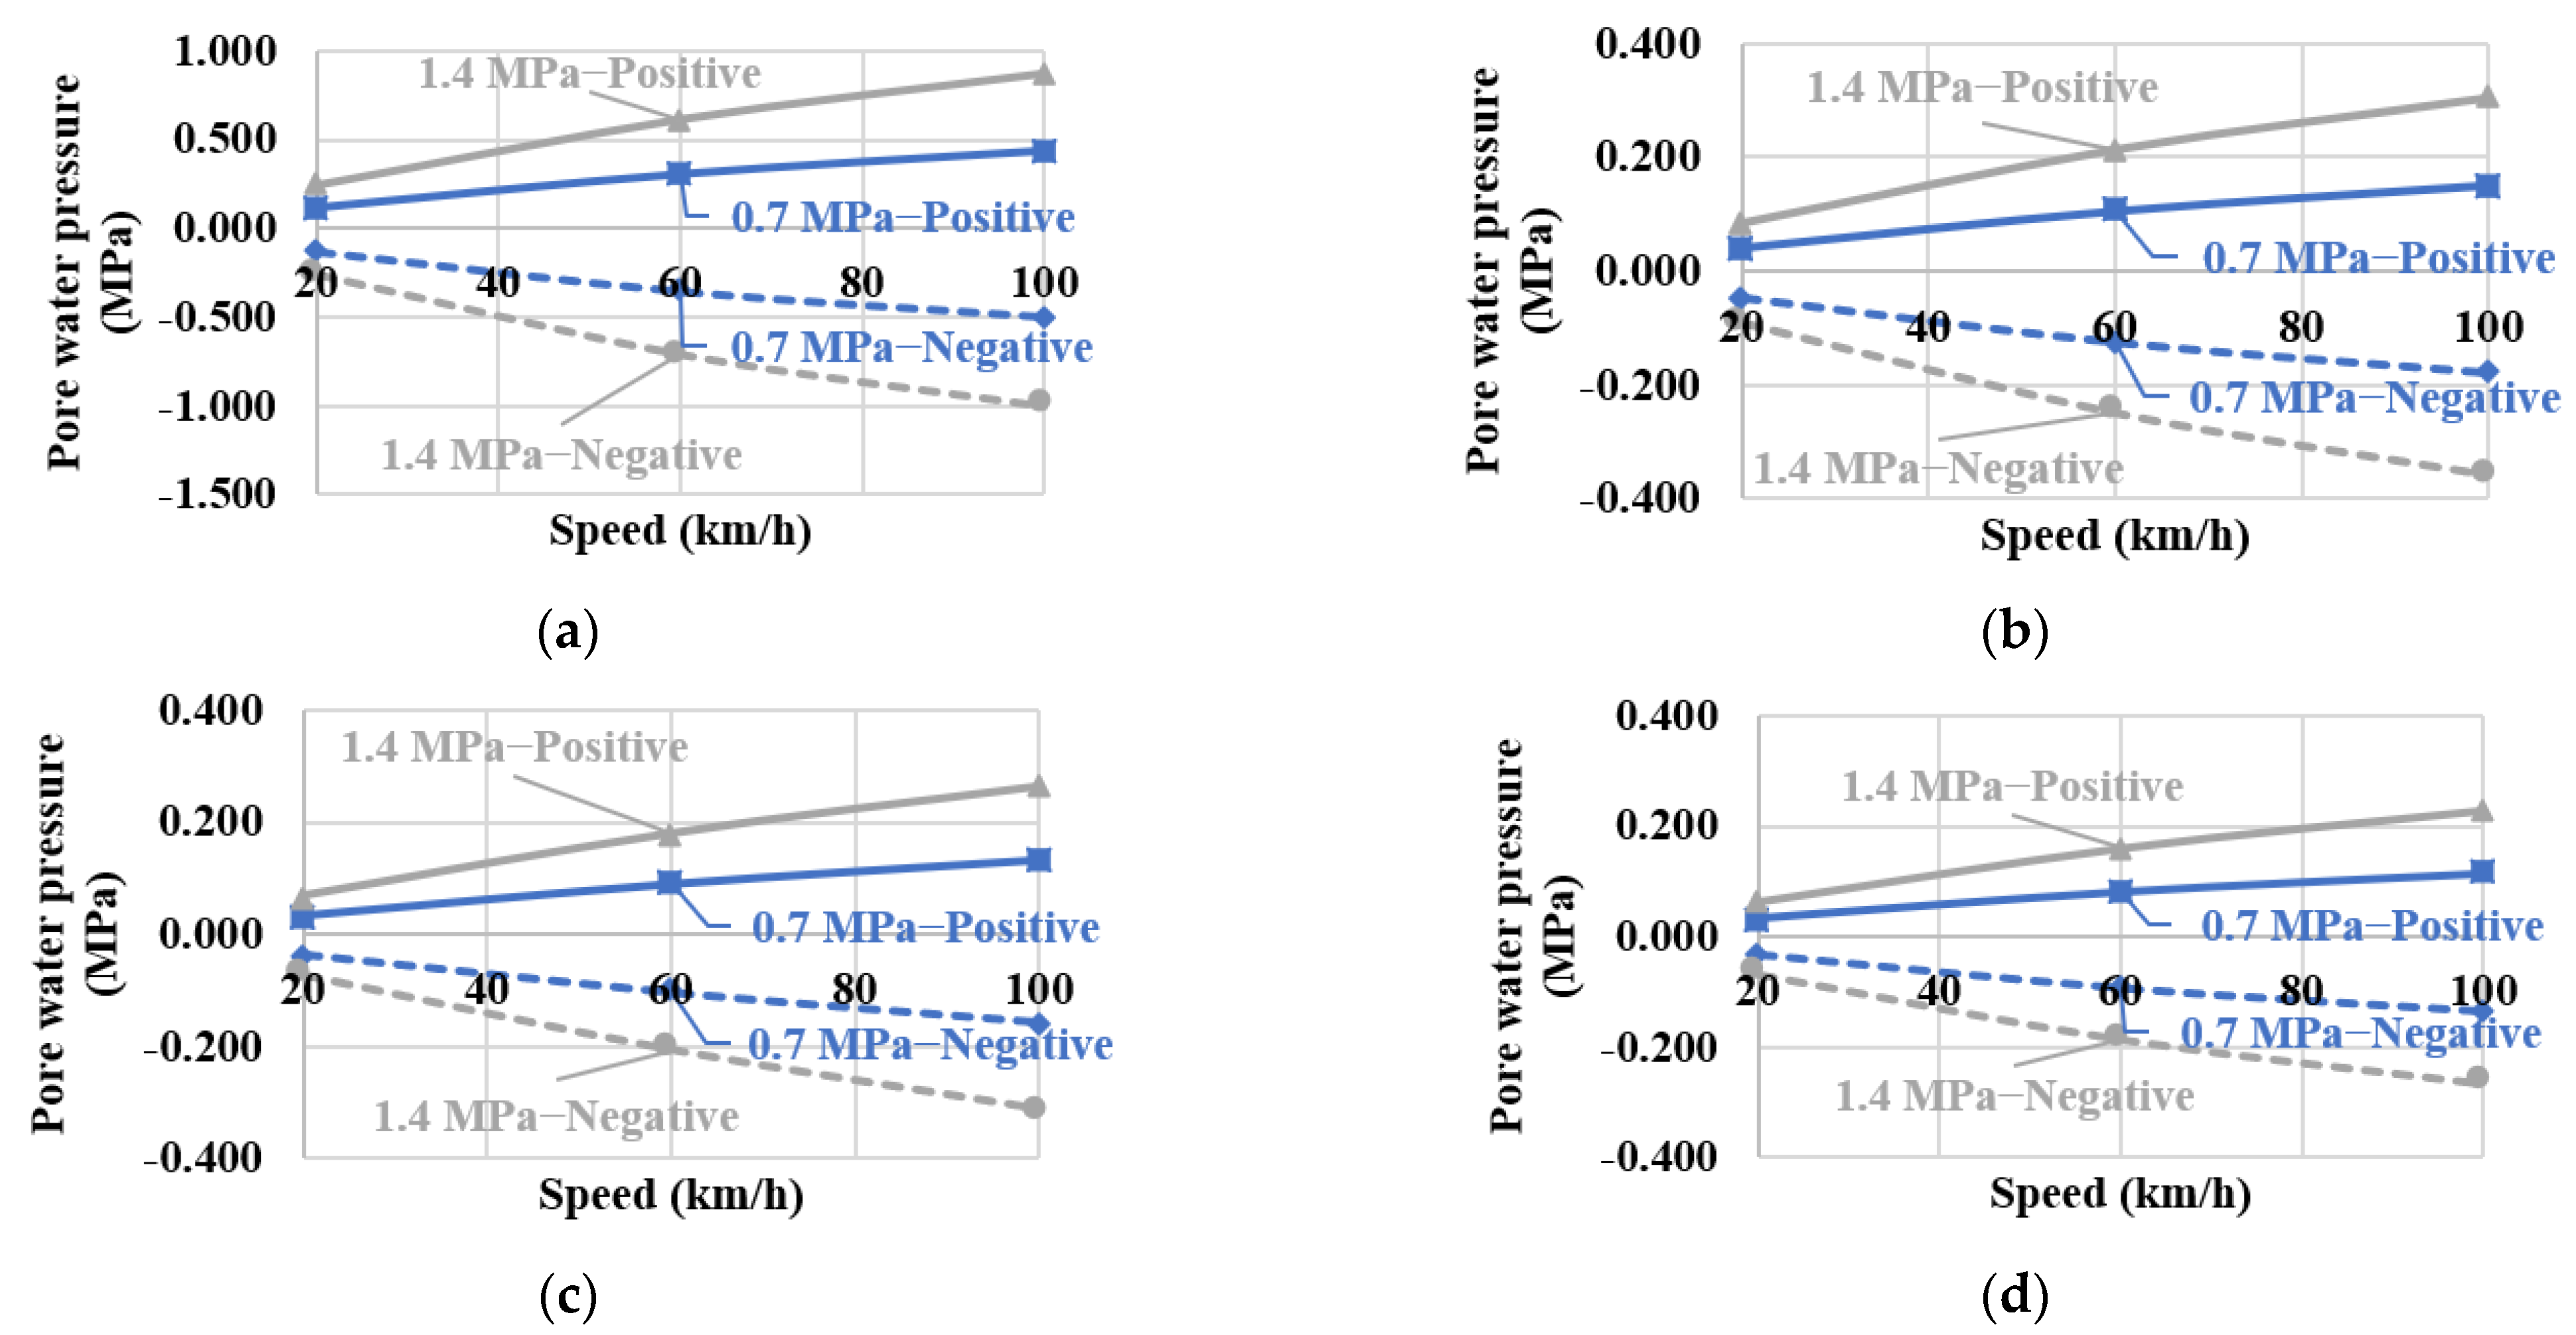
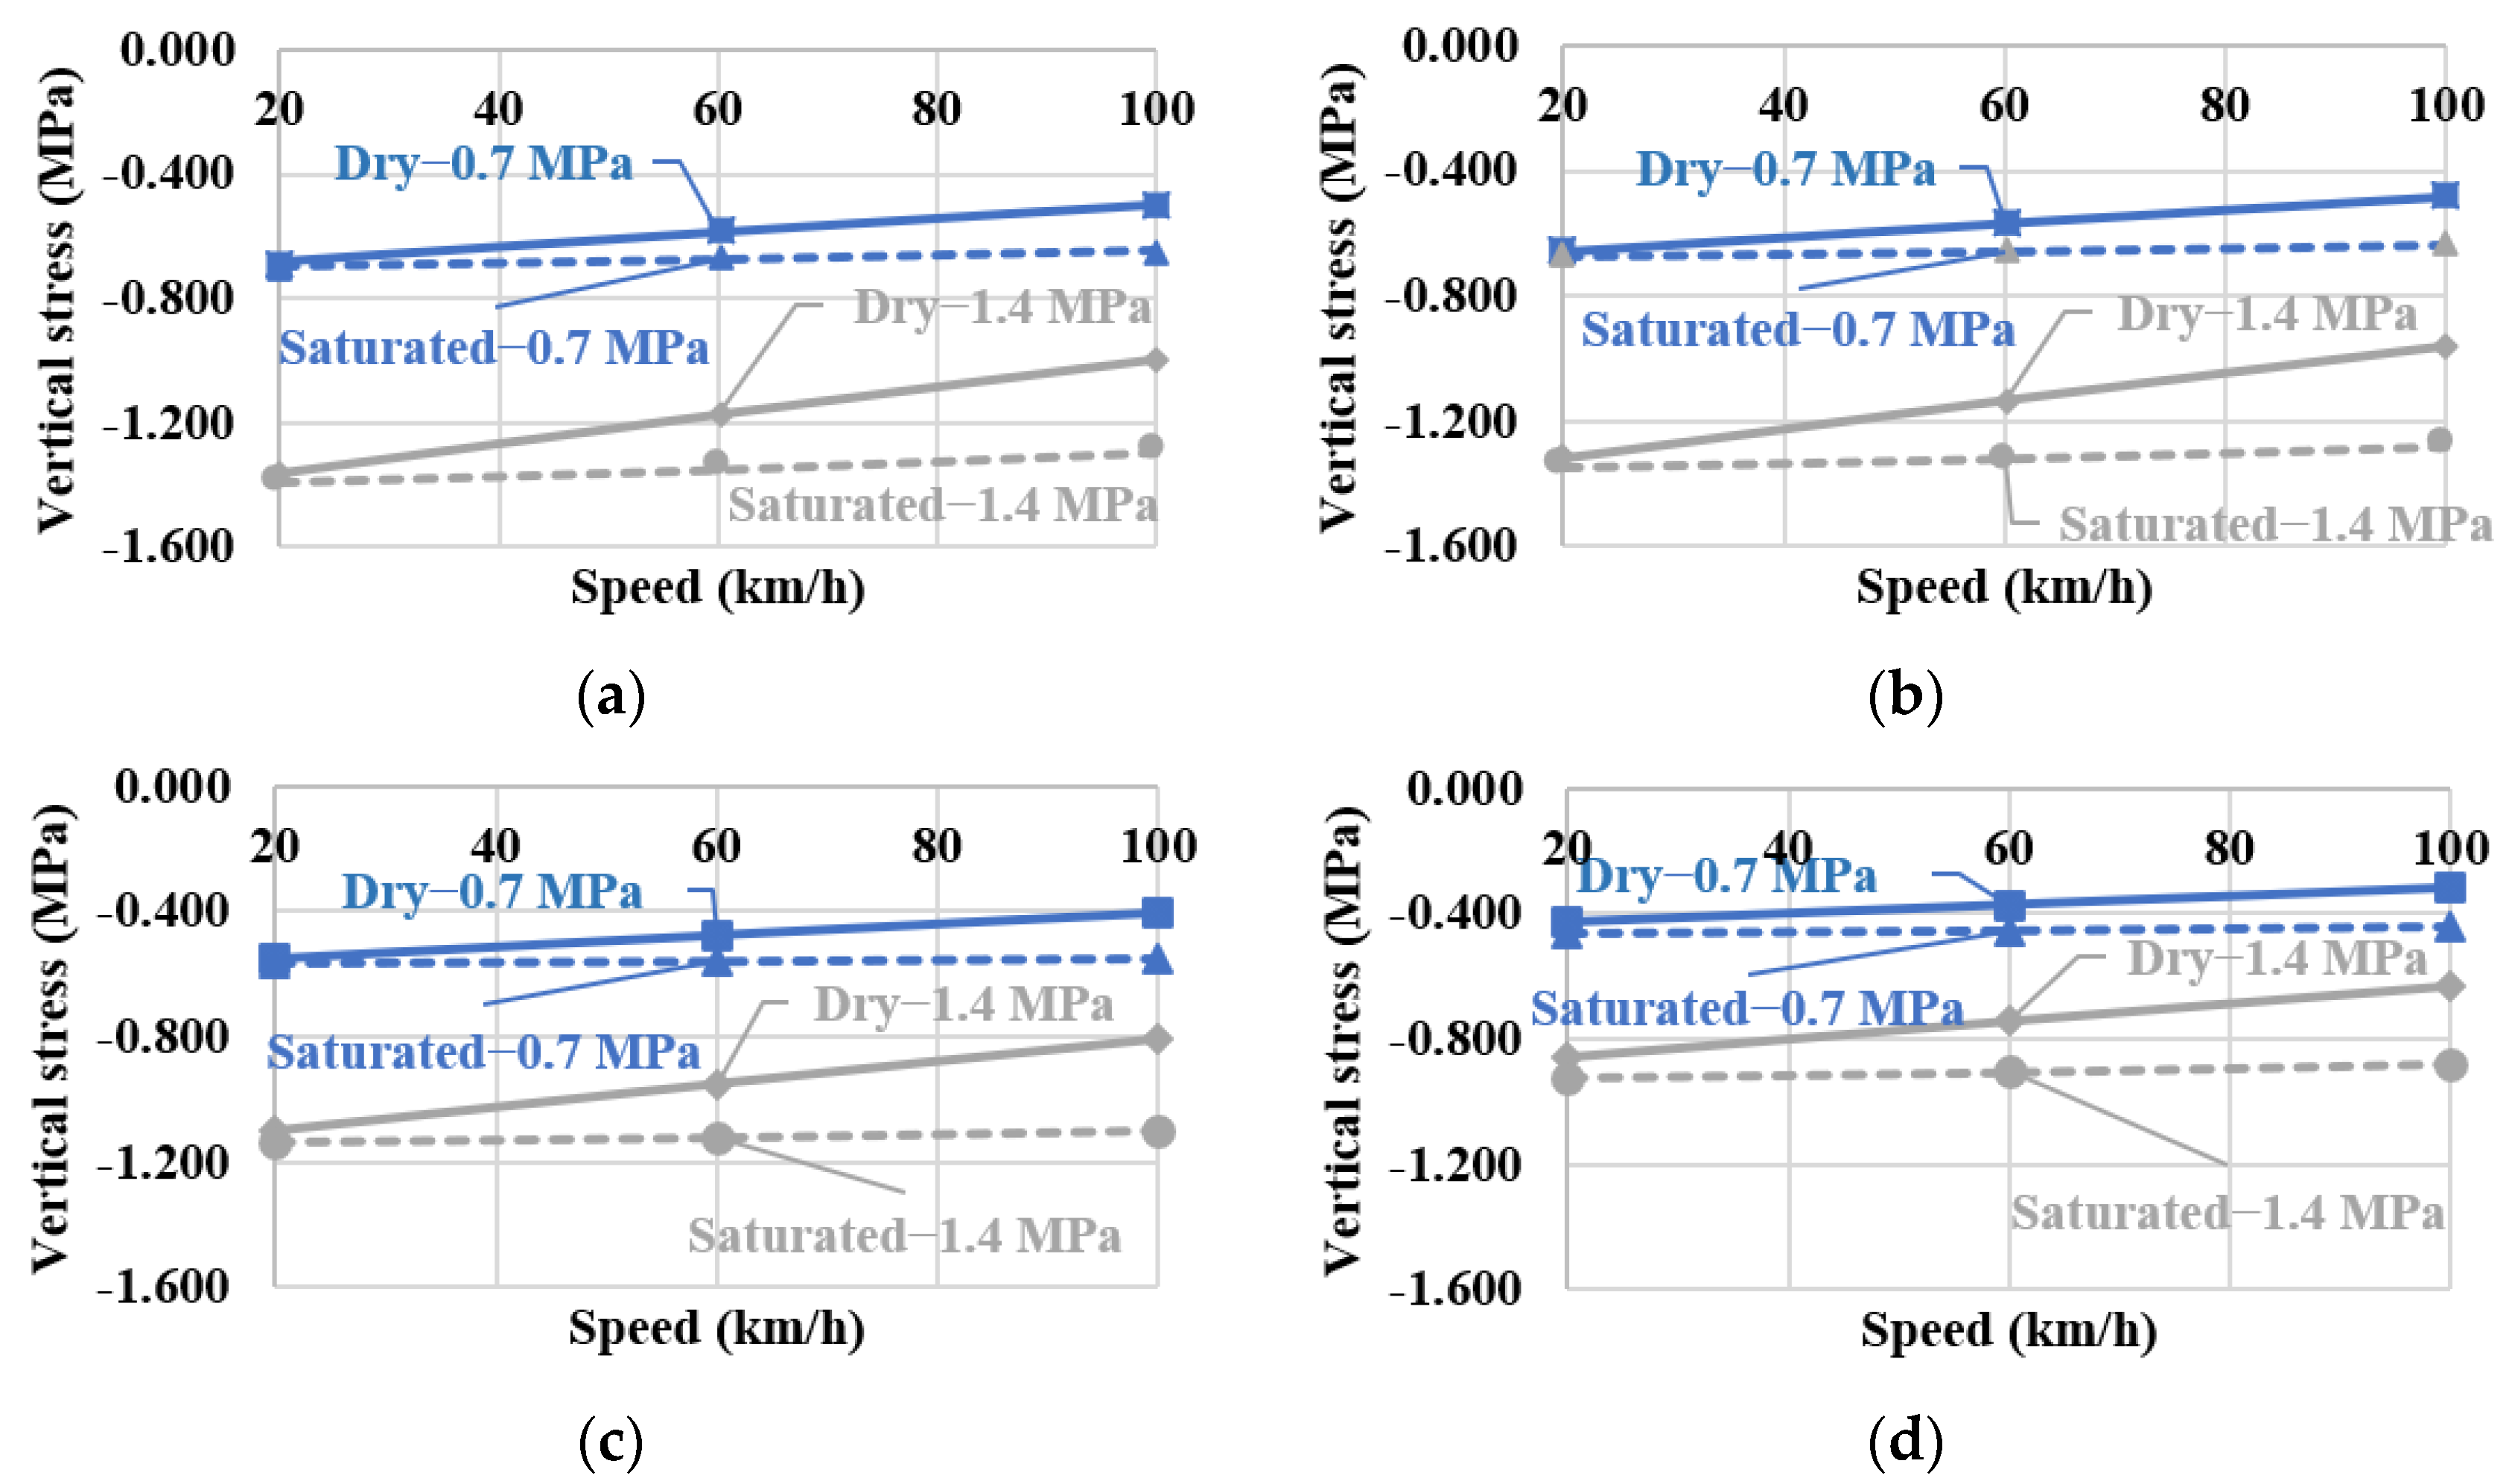
4.2. Variation Trends of Dynamic Responses with Vehicle Speed and Load by FEM Analysis

Numerical analysis of dynamic responses of asphalt pavement was systematically conducted under different parameter combinations of vehicle speed and load. The vehicle speeds were controlled at 20 km/h, 60 km/h, and 100 km/h, respectively, while the vehicle loads were adjusted at 0.7 MPa and 1.4 MPa. The magnitudes of indicators such as vertical stress, strains in vertical and transverse directions, and pore water pressure were extracted from their corresponding time–history curves, which were further applied to establish a relationship with different vehicle speeds and loads in dry and saturated conditions, as shown from Figure 8, Figure 9, Figure 10 and Figure 11. It could be observed that the increase in vehicle wheel grounding pressure significantly improved the magnitudes of dynamic responses in both dry and saturated conditions.
Variation trends of the magnitudes of pore water pressure and vertical stress with vehicle speed and load in different structural layers are shown in Figure 8 and Figure 9. It was observed that both the magnitudes of positive and negative pore water pressure were increased with the increase in vehicle speed. Vertical stress magnitudes in dry and saturated conditions were decreased with the increase in vehicle speed with different sensitivities. Compared between variation trends of vertical stress magnitudes in different structural layers in Figure 9, the decrease trends with vehicle speed for vertical stress in saturated conditions were flatter than those in dry conditions, which indicated that vertical stress was more sensitive to vehicle speed in dry conditions. Meanwhile, vertical stress magnitudes in saturated conditions were larger than those in dry conditions, which indicated that water changed the stress state for the entire asphalt pavement.
Variation trends of vertical strain magnitudes with vehicle speed and load in different structural layers are shown in Figure 10. Vertical strain magnitudes increased first and then decreased with vehicle speed in both surface layer and the bottom of the upper layer in dry conditions, while its magnitudes directly exhibited slow downtrends at the bottom of both the middle and lower layers. For saturated asphalt pavement, vertical strain magnitudes with the growth of vehicle speed in the surface layer, while it slowly grew and then decreased inside asphalt pavement.
Variation trends of transverse strain magnitudes with vehicle speed and load in different structural layers are shown in Figure 11. Apparent downtrends were found with the increase in vehicle speed for transverse strain magnitudes in different structural layers in dry conditions, but these downtrends slowed down greatly in saturated conditions. Transverse strain magnitudes decreased with the increase in vehicle speed at the bottom of the surface and upper layers, which slightly increased in the bottom of the middle layer at the vehicle speed of 100 km/h and totally exhibited uptrends with all vehicle speeds at the bottom of the lower layer. It indicated that the compressive state of transverse strain at the bottom of the lower layer was intensified with the increase in vehicle speed.
As asphalt mixture is a typical viscoelastic material, asphalt pavement will exhibit diverse viscoelastic behaviors under different vehicle speeds [24]. In this case, the asphalt material will become stiffer at a relatively higher vehicle speed, which may result in differences in the dynamic responses obtained from the numerical simulation and field test.

4.3. Validation of FEM Model Using Field Measurements

4.3.1. Comparison of Magnitude of Dynamic Responses Based on Same Settings

Field measurements were conducted using the full-scale NE-ALT system to validate the FEM models established in this study. The field measuring point was set at the bottom of the upper layer (h = 0.05 m) of asphalt pavement, which was also located in the middle of the outer wheel path nearest to the control building, as shown in Figure 3. The vehicle simulator in the field test was controlled at the parameter combination of 0.7 MPa vehicle wheel grounding pressure and 20 km/h vehicle speed, which was the same as the low-speed group in the numerical simulation. Dynamic responses for asphalt pavement in dry and saturated conditions were monitored during field tests, which were generated by the vehicle’s rear axle wheels. The magnitudes of indicators such as stress, strain, and pore water pressure were obtained and then compared with those calculated from the numerical simulation, both of which are summarized in Table 4.
Values of dynamic response indicators obtained from field measurements and numerical simulation were compared, both of which were found in the same order of magnitude. Values of vertical stress, transverse strain, and pore water pressure calculated by numerical simulation were larger than those measured from the field test, while numerical vertical strain showed a relatively smaller value, which might be induced by the differential compaction degree in the regions where sensors were buried. These differences in indicators’ magnitude values were mainly caused by the simplification of both pavement structure, materials, and the applied vehicle load in the FEM models, which were undoubtedly different from the actual complicated conditions faced by asphalt pavement in the field test site. In particular, material parameters’ values in Table 1 were determined based on empirical assumptions [12,25,26], which might be a non-negligible factor to cause differences between indicators’ magnitude values of numerical analysis and field measurement. Indicators obtained in saturated conditions showed larger magnitude values than those obtained in dry conditions for both numerical simulation and the field test. This phenomenon indicated the fact that water intensified the degree of dynamic responses inside asphalt pavement, while continuous action by water led to the decline of the overall service life of asphalt pavement. The values of positive pore water pressure obtained from numerical simulation and field test were close and in the same order of magnitude, which verified the effectiveness of the saturated FEM model for the prediction of pore water pressure. However, negative pore water pressure showed a larger magnitude value compared with positive pore water pressure in numerical simulation, which exhibited the reverse order in the field test. This might be induced by the tread pattern on the vehicle wheel, which was not taken into account in the numerical simulation. Therefore, the feasibility and effectiveness of the FEM models were verified, which could well simulate dynamic responses for asphalt pavement in dry and saturated conditions.

4.3.2. Comparison of Dynamic Response Magnitude at Different Vehicle Speeds and Loads

The full-scale NE-ALT system was applied to conduct field tests to measure the dynamic responses of asphalt pavement in dry and saturated conditions. According to the adjustable ranges of the full-scale vehicle simulator’s speed and applied load, it could be found that parameter combinations controlled in field tests mainly corresponded to the low-speed group of that in numerical simulation. Variation trends of indicator magnitudes with different vehicle loads and speeds were established and evaluated, respectively, which included vertical stress, strains in vertical and transverse directions, and pore water pressure, as shown in Figure 12 and Figure 13. These variation trends of dynamic response indicators measured from field tests were compared with those obtained from numerical simulation for the purpose of further validating the FEM models.
It was found that the magnitudes of strains in two directions and vertical stress increased slowly with the increase in single-wheel grounding pressure, which inversely decreased with the increase in vehicle speed. Moreover, signals obtained in saturated conditions exhibited slightly larger magnitudes than those measured in dry conditions. For pore water pressure, it also showed slight uptrends with single-wheel grounding pressure but increased with the growth of vehicle speed. Pore water pressure was sensitive to vehicle speed compared with vehicle load according to Figure 12 and Figure 13. In particular, some unavoidable “imperfections” existed during the field measurements, such as the measured pore water pressure at a vehicle load of 0.780 MPa in Figure 12a. It might be induced by comprehensive factors such as the controlled accuracy tolerance of the full-scale vehicle simulator, the unrecoverable structural integrity of asphalt pavement embedded with sensors, and the relatively small interval of loading parameter settings. Variation trends of dynamic responses in the bottom of the upper layer of asphalt pavement obtained from numerical simulation were compared with those measured from field tests, both of which showed similar trends. As vehicle speeds in field tests were controlled at relatively low levels compared with those in numerical simulation, several characteristics of variation trends were not coincident for strains in vertical and transverse directions. More systematic field tests need to be conducted in the future for the purpose of verifying the variation trends of dynamic responses at a relatively high vehicle speed.

4.4. Spatial Distribution of Dynamic Response Indicators by FEM Analysis

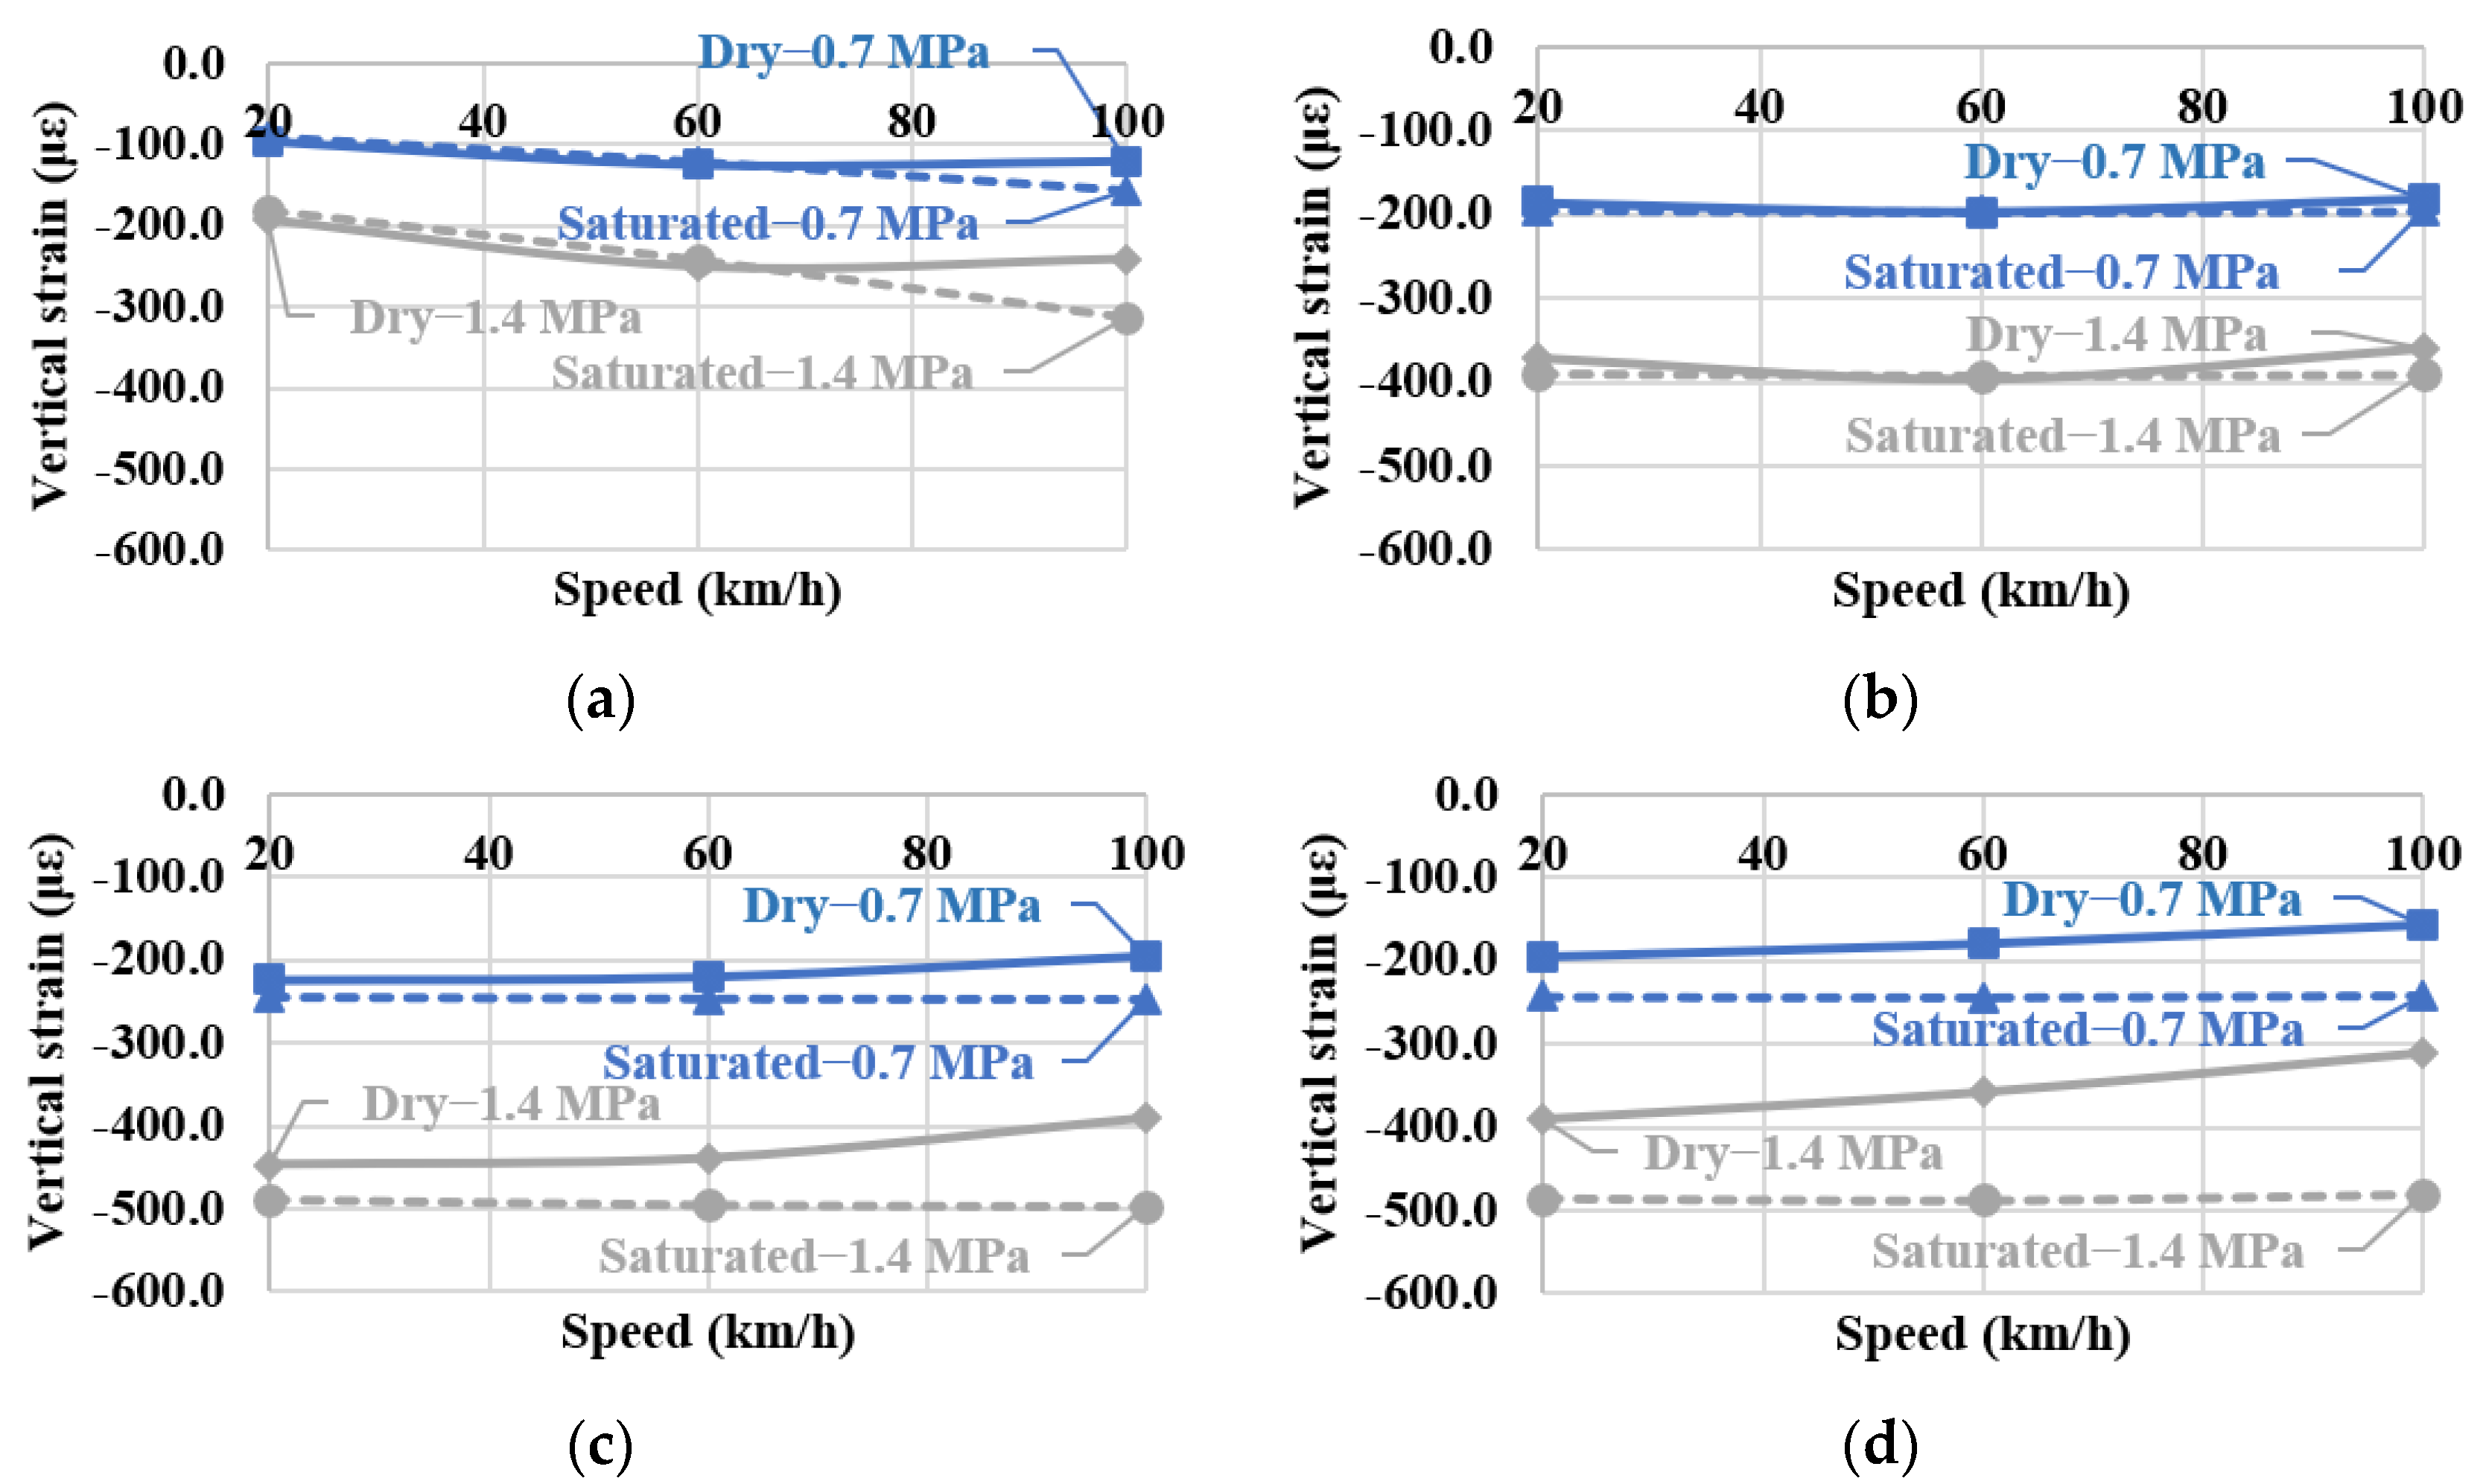
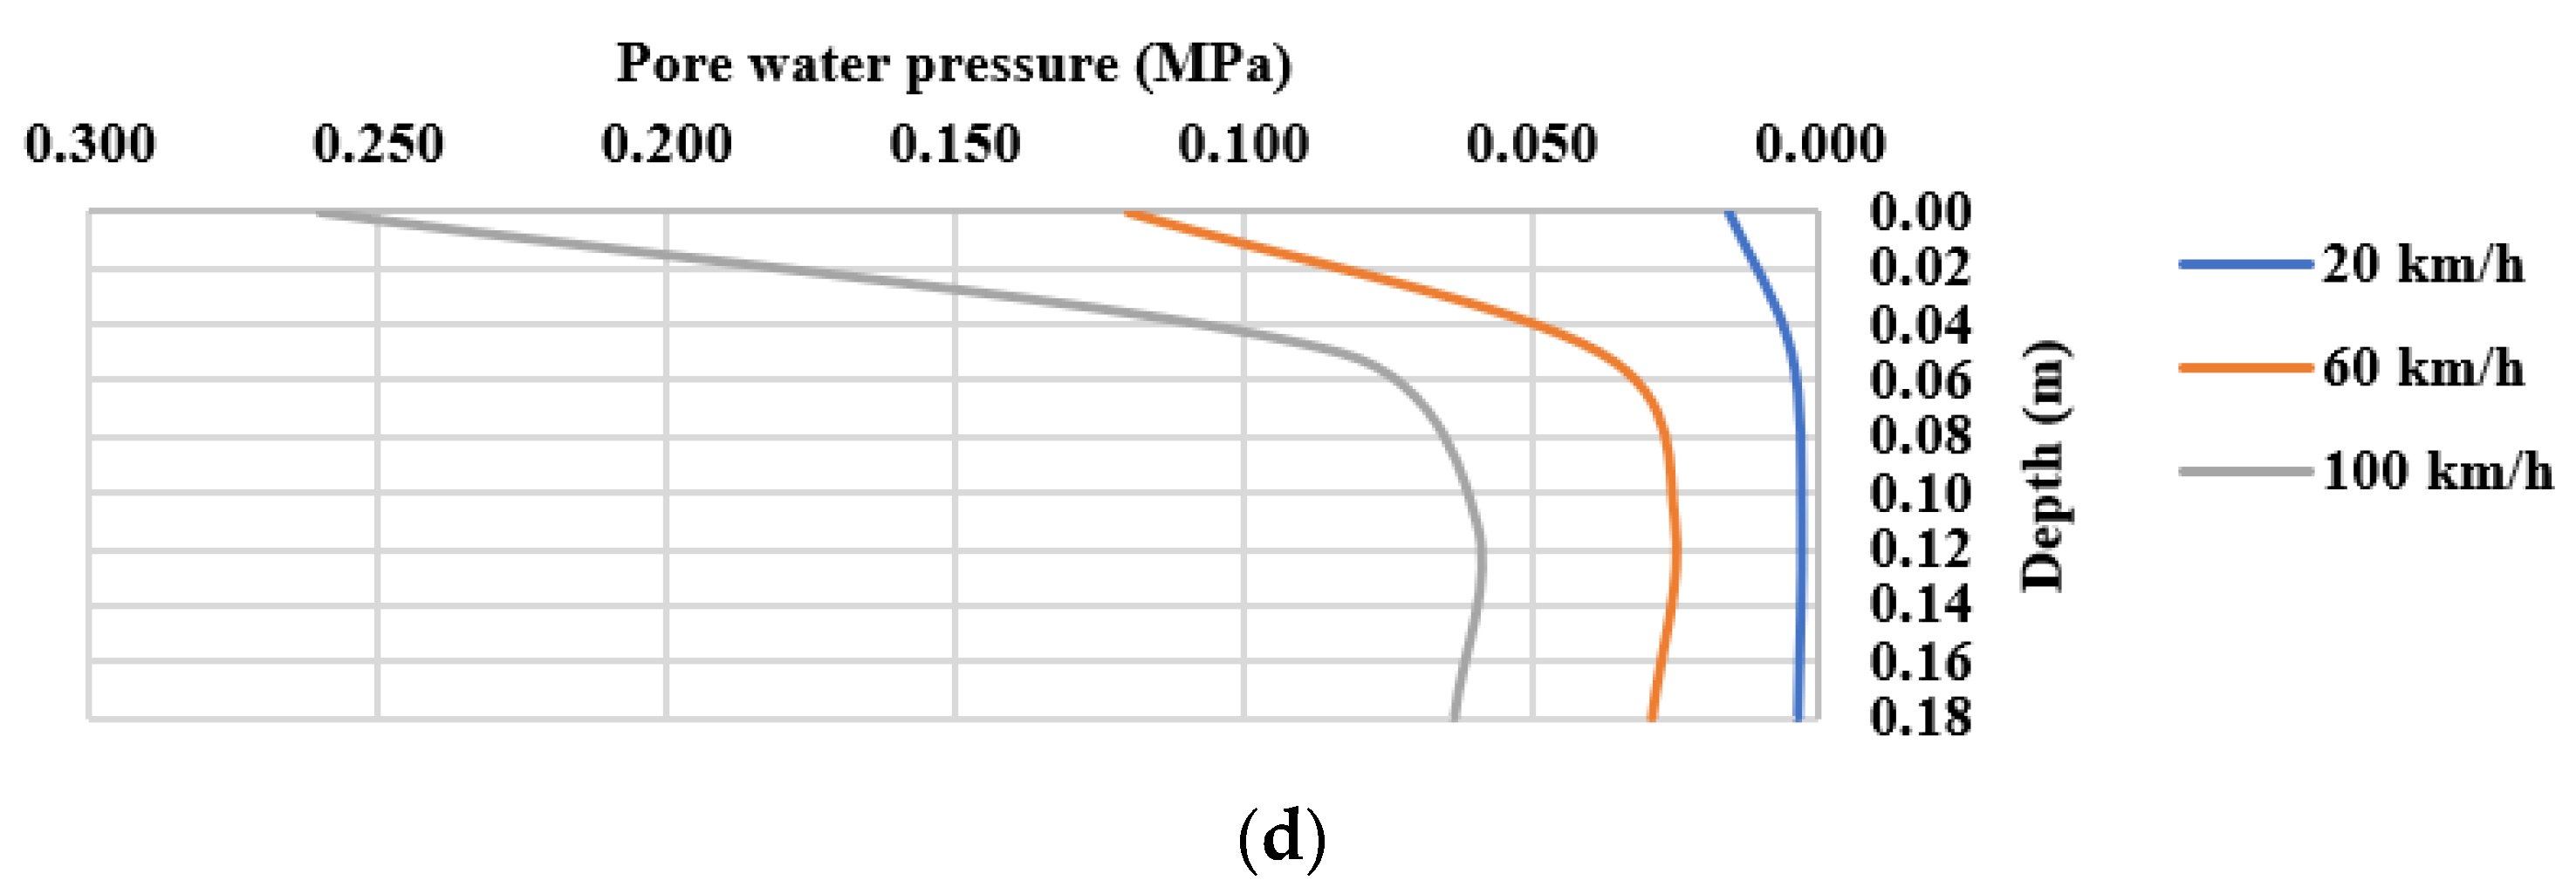
4.4.1. Vertical Distribution

When vehicle load was applied to its maximum value of 0.7 MPa, vertical distributions of dynamic response indicators along structural depths of asphalt pavement at three different vehicle speeds were analyzed for the testing profile A. Variation trends of dynamic responses along structural depths with vehicle speeds in dry and saturated conditions are shown in Figure 14. It could be clearly found that vertical distributions of stress and strains in compressive regions inside dry asphalt pavement decreased with the increase in vehicle speed. However, vertical distributions of transverse strain increased with vehicle speed in tensile regions in dry conditions. Similarly, stress and strains exhibited similar variation trends in both compressive and tensile regions inside dry and saturated asphalt pavement, while vertical distributions of pore water pressure increased with the growth of vehicle speed.
In Figure 14a, vertical distributions of stress in saturated conditions do not show obvious declining trends compared with those in dry conditions. Moreover, stress in the upper layer of saturated asphalt pavement inversely increased first, which might be induced by the rapid decrease in pore water pressure that was quite sensitive to vehicle speed. In Figure 14b, vertical distributions of vertical strain in the middle and lower layers of saturated asphalt pavement became complicated, which repeatedly increased and decreased in compressive regions that were opposite to those in the corresponding positions in dry conditions. In Figure 14c, vertical distributions of transverse strain showed clear variation trends along structural depths in dry and saturated conditions. Tensile regions mainly concentrated in the middle and lower layers inside dry asphalt pavement, which moved to the lower layer inside the saturated structure. The distributions of transverse strain in tensile regions increased first and then decreased in dry conditions, but tensile regions did not show decreasing trends in saturated conditions. As shown in Figure 14d, pore water pressure inside saturated asphalt pavement gradually decreased with pavement depths. The attenuation degree between the range from the surface layer to the bottom of the upper layer was relatively larger than those inside the middle and lower layers. Pore water pressure slightly increased within the lower layer of asphalt pavement, which might be induced by water accumulation at the bottom of the lower layer and caused dynamic hydraulically scouring with positive and negative alternations on the top of the base layer.

4.4.2. Transverse Distribution

The horizontal plane with a depth of 0.05 m at the bottom of the upper layer was selected to further analyze transverse distributions of stress, strain, and pore water pressure. When the applied vehicle loads of 0.7 MPa and 1.4 MPa reached their maximum values at the speed of 60 km/h, variation trends of dynamic responses with the entire width range of asphalt pavement are discussed and summarized in Figure 15.
As shown in Figure 15a, the regions outside direct contact with vehicle load in the saturated asphalt pavement presented relatively complex distributions of vertical stress compared with those in dry conditions. Compressive stress was observed in the regions in direct contact with the single-axle four-wheel load, while stress in the range of the middle vehicle axle was tensile. Stress in the outer sides of the wheels totally turned into compression from tension after slightly tensile and compressive alternations, while the compressive stress gradually decreased with the increasing distance from the middle vehicle axle. Vehicle load showed a significant effect on the enhancement of compressive stress within the regions in direct contact with the vehicle wheels. In Figure 15b, vertical strain in the regions in direct contact with the vehicle wheels was compressive, but in the outer sides of the vehicle wheels was tensile to a certain extent. The magnitudes of vertical strain in both compressive and tensile regions increased with the increase in vehicle load. In particular, compared with those in dry asphalt pavement, transverse distributions of vertical strain showed obvious tensile properties inside saturated asphalt pavement in the middle region of the vehicle axle. In Figure 15c, transverse strain showed compressive performance in the regions in direct contact with the vehicle wheels but exhibited obvious tensile properties in the outer sides of the vehicle wheels. Water aggravated the tensile degree of transverse strain, while the increase in vehicle load also enhanced the magnitudes of transverse strain in dry and saturated conditions. In particular, transverse strain was observed to be tension in the middle range of the vehicle axle inside dry asphalt pavement, but it turned into compression in saturated conditions.
Transverse distributions of pore water pressure along the entire width range of saturated asphalt pavement are summarized in Figure 15d, which took two vehicle loads and three vehicle speeds into account. When the applied vehicle loads reached their corresponding maximum values under different vehicle speeds, both the regions in direct contact with the vehicle wheels, the region of the middle vehicle axle, and the middle region between two adjacent wheels exhibited positive pore water pressure, while negative pore water pressure mainly emerged in the regions of the road’s edges far away from the outer wheels. In particular, within the direct regions with the vehicle wheels, a parameter combination of “1.4 MPa–100 km/h” presented the maximum magnitude of positive pore water pressure. A parameter combination of “0.7 MPa–100 km/h” produced relatively larger positive pore water pressure compared with that generated by the parameter combination of “1.4 MPa–60 km/h”. It indicated that pore water pressure was more sensitive to vehicle speed than vehicle load. Similarly, pore water pressure produced by “0.7 MPa–60 km/h” was larger than that generated by “1.4 MPa–20 km/h”. In this case, a vehicle with light load and fast speed generated a relatively larger magnitude of pore water pressure than that produced by a vehicle with heavy load and slow speed to some extent. It is important to control overspeed and overload for vehicles to alleviate the adverse impact of pore water pressure on asphalt pavement.

5. Conclusions

This study numerically and experimentally investigated the dynamic responses of asphalt pavement in dry and saturated conditions under full-scale accelerated loading. Based on the analysis discussed above, the following conclusions could be obtained.
(a)
Trends of modeling results were consistent with those of field measurements.
(b)
The increase in vehicle load enhanced dynamic responses. With the increase in vehicle speed, pore water pressure increased, but vertical stress gradually decreased, while transverse strain decreased in dry conditions but slowly increased in saturated conditions in the middle and lower layers. Vertical strain showed different increasing and decreasing trends in the asphalt pavement at different depths.
(c)
Dynamic responses decreased with pavement depths. Water made dynamic responses more complex, and pore water pressure significantly decreased with depths within the upper layer of saturated asphalt pavement.
(d)
Transverse distributions of indicators presented obvious compressive states in the regions in direct contact with the vehicle wheels, while tensile states were found in the range of the middle vehicle axle.
(e)
The numerical results provided a basis for field measurements in future studies, especially for the exploration of factors of temperature and layer depth.

Author Contributions

Conceptualization, W.W.; methodology, W.W., G.Y. and K.Z.; software, W.W., G.Y. and K.Z.; resources, G.Y.; data curation, W.W. and K.Z.; writing—original draft preparation, W.W.; writing—review and editing, L.W.; supervision, L.W. All authors have read and agreed to the published version of the manuscript.

Funding

The authors acknowledge the financial support of the China Postdoctoral Science Foundation (Project No. 2021M690356).

Institutional Review Board Statement

Not applicable.

Informed Consent Statement

Not applicable.

Data Availability Statement

Not applicable.

Conflicts of Interest

The authors declare no conflict of interest.

References

  1. Wang, W.; Wang, L.; Xiong, H.; Luo, R. A review and perspective for research on moisture damage in asphalt pavement induced by dynamic pore water pressure. Constr. Build. Mater. 2019, 204, 631–642. [Google Scholar] [CrossRef]
  2. Lu, G.; Liu, P.; Torzs, T.; Wang, D.; Grabe, J. Numerical analysis for the influence of saturation on the base course of permeable pavement with a novel polyurethane binder. Constr. Build. Mater. 2020, 240, 117930. [Google Scholar] [CrossRef]
  3. Caro, S.; Castillo, D.; Masad, E. Incorporating the heterogeneity of asphalt mixtures in flexible pavements subjected to moisture diffusion. Int. J. Pavement Eng. 2015, 16, 432–444. [Google Scholar] [CrossRef]
  4. Saad, B. Analysis of excess water impact on the structural performance of flexible pavements. Int. J. Pavement Eng. 2014, 15, 409–426. [Google Scholar] [CrossRef]
  5. Sun, Y.; Guo, R.; Gao, L.; Wang, J.; Wang, X.; Yuan, X. Study on dynamic response characteristics of saturated asphalt pavement under multi-field coupling. Materials 2019, 12, 959. [Google Scholar] [CrossRef] [Green Version]
  6. Peng, Y.; Xia, S.; Xu, Y.; Lu, X.; Li, Y. Mechanical response of asphalt surfaces under moving traffic loads using 3D discrete element method. J. Transp. Eng. Part B Pavements 2022, 148, 04022006. [Google Scholar] [CrossRef]
  7. Dong, Z.; Tan, Y.; Cao, L.; Zhong, Y. Research on pore pressure within asphalt pavement under the coupled moisture-loading action. J. Harbin Inst. Technol. 2007, 39, 1614–1617. [Google Scholar]
  8. Sheng, Y.; Chen, S.; Wang, D.; Wang, L. Pore water pressure characteristics of semi-rigid base for cement concrete pavement. J. Traffic Transp. Eng. 2012, 12, 6–12. [Google Scholar]
  9. Sun, Y.; Guo, R.; Wang, X.; Ning, X. Dynamic response characteristics of permeable asphalt pavement based on unsaturated seepage. Int. J. Transp. Sci. Technol. 2019, 8, 403–417. [Google Scholar] [CrossRef]
  10. Xue, Q.; Liu, L. Hydraulic-stress coupling effects on dynamic behavior of asphalt pavement structure material. Constr. Build. Mater. 2013, 43, 31–36. [Google Scholar] [CrossRef]
  11. Assogba, O.; Tan, Y.; Zhous, X.; Zhang, C.; Anato, J. Numerical investigation of the mechanical response of semi-rigid base asphalt pavement under traffic load and nonlinear temperature gradient effect. Constr. Build. Mater. 2020, 235, 117406. [Google Scholar] [CrossRef]
  12. Si, C.; Chen, E.; You, Z.; Zhang, R.; Qiao, P.; Feng, Y. Dynamic response of temperature-seepage-stress coupling in asphalt pavement. Constr. Build. Mater. 2019, 211, 824–836. [Google Scholar] [CrossRef]
  13. Tang, W.; Ou, J.; Cui, X.; Lou, J.; Xiao, M.; Zhang, J.; Huang, D.; Hou, F. Field test and research on vehicle load induced dynamic pore pressure in asphalt pavement. J. Shandong Univ. 2015, 45, 84–90. [Google Scholar]
  14. Ling, J.; Wei, F.; Zhao, H.; Tian, Y.; Han, B.; Chen, Z. Analysis of airfield composite pavement responses using full-scale accelerated pavement testing and finite element method. Constr. Build. Mater. 2019, 212, 596–606. [Google Scholar] [CrossRef]
  15. Yang, Z.; Wang, L.; Xu, B.; Li, S.; Cao, D.; Yuan, B.; Dong, R. Study of the durability of a fully permeable asphalt pavement structure based on the accelerated pavement test method under saturated conditions. J. Transp. Eng. Part B Pavements 2022, 148, 04021081. [Google Scholar] [CrossRef]
  16. Wang, L. Mechanics of Asphalt: Microstructure and Micromechanics; McGraw-Hill: New York, NY, USA, 2011; pp. 448–450. ISBN 978-0-07-164097-8. [Google Scholar]
  17. Dong, Z.; Tan, Y.; Cao, L. The effect of water on pavement response based on 3D FEM simulation and experiment evaluation. Symposium on Pavement Mechanics and Materials. In Proceedings of the 18th ASCE Engineering Mechanics Division Conference 2007, Blacksburg, VA, USA, 3–6 June 2007; pp. 34–44. [Google Scholar]
  18. Li, H.; Sheng, Y. Study on vehicle speed in pore water pressure of rigid pavement base using pore-elasticity. Appl. Mech. Mater. 2012, 178–181, 2615–2618. [Google Scholar] [CrossRef]
  19. Dong, Z.; Tan, Y. Dynamic Response of Asphalt Pavement; Science Press: Beijing, China, 2015; pp. 188–194. ISBN 978-7-03-041294-2. [Google Scholar]
  20. Dan, H.; He, L.; Zhao, L.; Chen, J. Coupled hydro-mechanical response of saturated asphalt pavement under moving traffic load. Int. J. Pavement Eng. 2015, 16, 125–143. [Google Scholar] [CrossRef]
  21. Cui, X. Mechanics of Pavement (Disease); Science Press: Beijing, China, 2016; pp. 57–60. ISBN 978-7-03-047449-0. [Google Scholar]
  22. Wang, W.; Zhao, K.; Li, J.; Luo, R.; Wang, L. Characterization of dynamic response of asphalt pavement in dry and saturated conditions using the full-scale accelerated loading test. Constr. Build. Mater. 2021, 312, 125355. [Google Scholar] [CrossRef]
  23. Li, L.; Zhang, Z.; Wang, Z.; Wu, Y.; Dong, M.; Zhang, Y. Coupled thermo-hydro-mechanical response of saturated asphalt pavement. Constr. Build. Mater. 2020, 283, 122771. [Google Scholar] [CrossRef]
  24. Kim, J. General viscoelastic solutions for multilayered systems subjected to static and moving loads. J. Mater. Civ. Eng. 2011, 23, 1007–1016. [Google Scholar] [CrossRef]
  25. Bozkurt, T.S.; Karakaş, A.S. Investigation of asphalt pavement to improve environmental noise and water sustainability. Sustainability 2022, 14, 14901. [Google Scholar] [CrossRef]
  26. Perez-Acebo, H.; Linares-Unamunzaga, A.; Roji, E.; Gonzala-Orden, H. IRI performance models for flexible pavements in two-lane roads until first maintenance and/or rehabilitation work. Coatings 2020, 10, 97. [Google Scholar] [CrossRef]
Figure 1. Internal pressure distribution of the circular pore in a plate [16].
Applsci 12 12291 g001
Figure 2. The FEM model of asphalt pavement structure: (a) Boundary conditions and load positions; (b) Meshing.
Applsci 12 12291 g002
Figure 3. The vehicle loading model and the location of testing profile A (Unit: mm).
Applsci 12 12291 g003
Figure 4. Full-scale accelerated loading test system.
Applsci 12 12291 g004
Figure 5. Layout of the buried sensors: (a) Horizontal layout; (b) Relative position between vehicle tires and buried sensors.
Applsci 12 12291 g005
Figure 6. Buried sensors: (a) Longitudinal sensor; (b) Transverse sensor; (c) Vertical sensor; (d) Pore water pressure sensor; (e) Stress sensor.
Applsci 12 12291 g006
Figure 7. Time–history curves of dynamic response indicators for asphalt pavement in dry and saturated conditions: (a) Vertical stress, dry; (b) Vertical stress, saturated; (c) Vertical strain, dry; (d) Vertical strain, saturated; (e) Transverse strain, dry; (f) Transverse strain, saturated; (g) Pore water pressure, saturated.
Applsci 12 12291 g007aApplsci 12 12291 g007b
Figure 8. Variation trends of pore water pressure in saturated asphalt pavement: (a) Surface layer (h = 0 m); (b) Upper layer bottom (h = 0.05 m); (c) Middle layer bottom (h = 0.11 m); (d) Lower layer bottom (h = 0.18 m).
Applsci 12 12291 g008
Figure 9. Variation trends of vertical stress in dry and saturated asphalt pavement: (a) Surface layer (h = 0 m); (b) Upper layer bottom (h = 0.05 m); (c) Middle layer bottom (h = 0.11 m); (d) Lower layer bottom (h = 0.18 m).
Applsci 12 12291 g009
Figure 10. Variation trends of vertical strain in dry and saturated asphalt pavement: (a) Surface layer (h = 0m); (b) Upper layer bottom (h = 0.05m); (c) Middle layer bottom (h = 0.11m); (d) Lower layer bottom (h = 0.18m).
Applsci 12 12291 g010
Figure 11. Variation trends of transverse strain in dry and saturated asphalt pavement: (a) Surface layer (h = 0 m); (b) Upper layer bottom (h = 0.05 m); (c) Middle layer bottom (h = 0.11 m); (d) Lower layer bottom (h = 0.18 m).
Applsci 12 12291 g011
Figure 12. Variations of dynamic response magnitudes with vehicle load obtained from field tests (controlling vehicle speed at 20 km/h): (a) Pore water pressure; (b) Vertical stress; (c) Vertical strain; (d) Transverse strain.
Applsci 12 12291 g012aApplsci 12 12291 g012b
Figure 13. Variations of dynamic response magnitudes with vehicle speed obtained from field tests (controlling vehicle load at 0.7 MPa): (a) Pore water pressure; (b) Vertical stress; (c) Vertical strain; (d) Transverse strain.
Applsci 12 12291 g013
Figure 14. Vertical distributions of dynamic responses along depth in asphalt pavement: (a) Vertical stress; (b) Vertical strain; (c) Transverse strain; (d) Pore water pressure.
Applsci 12 12291 g014aApplsci 12 12291 g014b
Figure 15. Transverse distributions of dynamic responses at the bottom of the upper layer inside dry and saturated asphalt pavement (h = 0.05 m): (a) Vertical stress; (b) Vertical strain; (c) Transverse strain; (d) Pore water pressure.
Applsci 12 12291 g015
Table 1. Structure and material parameters of FEM model for asphalt pavement.
No.Structural LayerThickness (cm)Modulus (MPa)Poisson’s RatioDensity (kg/m3)Damping RatioPorosity (%)Permeability (×10–8 m/s)Water Density (kg/m3)
1Upper
SMA-16
514000.3524000.054.02.131000
2Middle
AC-20
613000.3524000.054.51.071000
3Lower
AC-25
712000.3524000.055.01.091000
4Base3513000.2521000.052.00.11000
5Subbase206000.319000.053.00.11000
6Subgrade280500.418000.054.00.151000
Table 2. Vehicle speed and load duration.
Speed (km/h)Load Duration (s)Moment Corresponding to Maximum Load (s)
200.0360.068
600.0120.056
1000.00720.0536
Table 3. Field test protocol.
No.Controlled ParametersAdjustable Parameters
1Motor RPM: 580 r/min
(Vehicle speed: 20 km/h)
Hydraulic load: 8.5/9.0/9.5/10.0/10.5/11.0/11.5 MPa
(Single-wheel grounding pressure: 0.675/0.701/0.728/0.754/0.780/0.807/0.833 MPa)
2Hydraulic load: 9.0 MPa
(Single-wheel grounding pressure: 0.7 MPa)
Motor RPM: 200/240/280/360/440/540 r/min
(Vehicle speed: 6.98/8.42/9.77/12.47/15.07/18.50 km/h)
Table 4. Comparison of responses obtained from numerical simulation and field measurements.
No.IndicatorMagnitude
Numerical SimulationField Test
DrySaturatedDrySaturated
1Vertical stress0.650 MPa0.675 MPa0.491 MPa0.530 MPa
2Vertical strain185.6 με194.6 με353.3 με364.7 με
3Transverse strain236.9 με197.3 με135.1 με145.6 με
4PositivePore water pressure-42.5 kPa-25.29 kPa
5Negative-45.4 kPa-7.1 kPa
Publisher’s Note: MDPI stays neutral with regard to jurisdictional claims in published maps and institutional affiliations.

