Abstract
Urban public space is essential in improving population carrying capacity and economic efficiency. However, the characteristics of urban public space, such as complex structure, relatively close and large population mobility, make it prone to fire, stampedes and other safety accidents. This study aims to develop a systematic approach to identify the key factors that affect the safety risk of urban public spaces and assess the risk. Based on the literature review, 250 structured questionnaires were randomly distributed. Finally, 219 available questionnaires were collected. Based on the above data, a model of urban public space is built using SEM. The results show that construction equipment, road traffic, social governance, urban environment and behaviour significantly affect public space (from high to low). Specifically, regardless of the model or actual situation, we should pay attention to fire awareness and empirical prevention awareness. Based on previous studies, this study considers the influencing factors of urban public safety risks hierarchically and more practically and makes contributions to the field of urban safety. In addition, governments and developers can conduct valuable actual scenario analysis from this study.
1. Introduction
The city is representative of social living standards and human development civilization. It is already the central carrier of a region’s politics, economy and culture [1]. To improve the city’s population carrying capacity and economic efficiency, developers and the government are vigorously building urban public spaces such as rail transit and commercial streets. However, with the increasing area of urban public space, the complexity of space structure and the high mobility of personnel flow have increased the frequency of fire, stampedes and other safety accidents in subway stations, integrated commercial complexes, etc. In the past 20 years, the risks of urban public spaces have shown multiple, sudden and serious characteristics worldwide. For example, in 1993, a fire broke out in the underground building of an underwater palace entertainment complex in Hongqiao, Shanghai, China, resulting in 11 deaths and 13 injuries [2]. In 2003, an arson accident occurred at the Daegu subway station in South Korea, resulting in 198 deaths, 146 injuries and 298 disappearances [3]. In 2004, Moscow terrorists killed 40 people and injured nearly 100 people in a crowded subway station [4]. How to improve the safety of urban public space has become an essential bottleneck of urban development. Currently, most countries have taken improving urban safety as a new goal of urban development based on maintaining the existing functionality of cities [5]. Therefore, assessing the safety risks of urban public space on such a social consensus is of theoretical and practical significance.
The risk of urban public space is mainly concentrated in public transport and commercial facilities, leading to waterlogging, fire, stampedes, earthquakes, epidemics and other emergencies. This is primarily because the urban public space is an open complex giant system. It includes the complexity of system structure, dynamics, uncertainty, group rationality and irrationality. All kinds of emergencies are interrelated and transformed, and compound, secondary, and derivative disasters occur simultaneously, which leads to an increase in the impact of urban public space safety emergencies [6].
Domestic and foreign scholars have conducted a detailed study on the mechanism of urban public space accidents, accident simulation, emergency evacuation management, risk assessment methods, etc. Blöbaum et al. conducted field experiments on students on German campuses to analyze their ability to perceive danger under the systematic changes in lighting, prospects, and escape opportunities [7]. Chalfin et al. used a natural experiment to identify the crime risk by analyzing the maintenance time difference of nearly 300,000 street lamp blackouts in Chicago. They found that power failure would lead to crimes spreading to nearby roads, with robbery and motor vehicle theft having the greatest impact [8]. Serre et al. developed a qualitative analysis tool, the DS3 model, and found that design measures for traffic infrastructure, open public space and buildings are the main channels for urban flood resistance [9]. Zalewski et al. believe that improving traffic, for example by optimizing road and street infrastructure, can force people to slow down and improve the quality of the urban environment, ultimately reducing accident risk [10]. Safety risk assessment is the research focus in this field. Urban public safety risk assessment refers to predicting the future safety status of urban public space based on risk assessment and identification and assessing the severity of losses caused by risk accidents. The Ministry of Emergency Management of the People’s Republic of China has promulgated Measures for Evaluation and Management of National Safety Development Demonstration Cities in 2020. Canada put forward risk analysis requirements for disasters and accidents [11]. Risk assessment is carried out every two years in the UK and every year in major cities to list the main risks and corresponding risk levels in the next five years [12]. This approach has provided a scientific basis for formulating measures or management decisions in many countries. Ultimately, the safety of urban public space can be reasonably guaranteed and improved. Shach-Pinsly et al. used the SRI model to identify and evaluate the safety level of cities and the key factors that can enhance people’s sense of safety [13]. Shariat et al. used GIS, FAHP, and FTOPSIS to determine the weights that affect urban safety. It is used for government departments’ hydrological and hydraulic simulation [14]. Based on Shantou, China, Chen et al. discussed how to carry out land policy risk analysis in urban master planning through quantitative (remote sensing technology) and qualitative (literature review) studies [15].
The above studies will help to improve the safety of urban public spaces. However, the above studies only focus on a certain type of occasion or accident, rarely involve the overall risk assessment of urban public space, and ignore the correlation between multiple factors. The urban public space is a complex giant system, and each level has a relationship between the upper and lower levels, which makes the whole system have not only the attribute of simple addition but also have qualitative change characteristics beyond “1 + 1 = 2”. Therefore, this paper summarizes the safety risks of urban public space through a literature review and tries to determine the safety assessment system of urban public space by screening non-key factors through SEM. On this basis, it is also expected to provide a scientific basis for making measures or management decisions. Finally, the safety of urban public space can be reasonably guaranteed and improved.
2. Overview of Urban Public Space Safety Risks
2.1. Safety Risk of Urban Public Space
In a narrow sense, public space refers to all the internal and external spaces used in people’s daily life, with obvious geographical characteristics. In a broad sense, public space is not only a geographical area but also includes the people in the space and the activities people engage in [16]. Public space is a relatively free and equal place that everyone can enter. Shared space is the first public space [17], while private shopping centres can easily be mistaken for “public space”, yet which are private spaces. For example, a clothing store in a commercial square does not belong to a public space. With the progress of the times, the scope of public space will be further expanded. Therefore, in a real sense, today’s public space should also include a space platform on the virtual network that people can share [18]. To sum up, the safety risk of urban public space refers to the risk factors that cause physical, mental or property damage in the area where people are engaged in activities.
2.2. Main Factors Affecting the Safety of Urban Public Space
There are many types of public safety accidents according to different classification standards. Still, the four most recognized classifications are natural disasters, accident disasters, public health emergencies, and social safety emergencies [19,20]. However, many factors affect the safety of urban public spaces. For example, education level and population density will also lead to differences in safety levels among different regions [21,22]. Therefore, after consulting many literature and practical cases, the general influencing factors are divided into five dimensions: conscious human behaviour, social governance, construction equipment, urban environment, and road traffic. The division basis and specific contents of each dimension are summarized as follows:
2.2.1. Conscious Behavior
The occurrence of public safety emergencies is often related to people’s conscious behavior [1]. First of all, the lack of self-protection awareness is a risk in urban public spaces [1]. As the saying goes, life is born of anxiety and death of comfort. If a man/woman stays in a safe environment for a long time, it will paralyze his/her preventive psychology [23]. This situation can easily weaken an individual’s sense of self-protection, and in the emergency of an epidemic, rape, robbery, or terrorist attack, it will cause physical, mental and property losses. Second, most safety issues are related to human behavior [24]. Macroscopically, the continuous development and utilization of energy by human beings to develop social industrialization, coupled with the continuous growth of world population and immigration, have triggered many public health emergencies, such as epidemics and environmental pollution. At the micro level, individual risk behaviors can also cause huge personal and property losses in the public space. For example, in 2003, an arson attack occurred at the Daegu subway station in South Korea, resulting in 198 deaths, 146 injuries, and 298 missing persons [3].
2.2.2. Social Governance
The impact of social governance on the safety of urban public space is mainly reflected in the inspection of dangerous goods, personnel evacuation, and the fight against crime. Eighty percent of emergencies are caused by people intentionally or unintentionally carrying dangerous goods [25]. Effective inspection of these dangerous goods can nip public safety emergencies in the bud [26]. Therefore, the safety inspection system in public places is very necessary. Overcrowding is also one of the reasons for social safety emergencies. Crowds are too dense to cause stampedes [21,27]. This requires the government to adopt the necessary norms and constraints to avoid social chaos. Urban crime is also an important factor affecting urban safety [22,26]. Although the strength of urban public safety continues to increase with urbanization, there are still blind areas in public places. At the same time, various criminal means emerge one after another, seriously affecting social order and public safety. How to control the above risk factors mainly depends on the mandatory governance measures of the social sector.
2.2.3. Construction Equipment
The impact of construction equipment on the safety of urban public space is mainly reflected in the seismic design, the layout of fire-fighting equipment and anti-riot equipment, and the promotion of early warning systems. The damage to structural components during an earthquake is caused by the gradual amplification of the seismic effect on the building from low to high [28]. The traditional anti-seismic design concept is based on the strength of vertical and horizontal components in buildings and their ability to resist plastic deformation. When the structure experiences an earthquake, it can absorb the energy generated to resist the earthquake [29]. Therefore, its focus is anti-seismic. However, under rare earthquakes, structural members will undergo large deformations, resulting in various damage and even the collapse of buildings. Therefore, the earthquake resistance of buildings is also one of the important factors affecting urban public space. Regarding ways to reduce the occurrence of public safety events, the fire-fighting equipment and anti-riot equipment of public buildings play a positive role [28]. For example, the allocation of fire-fighting equipment can effectively reduce the incidence of fire and fire losses, and the complete relevant safety equipment will also reduce the occurrence probability of the event. Furthermore, if a public place has perfect anti-riot equipment and high monitoring coverage, the probability of social safety emergencies is low. Moreover, the pre-alarm system in public spaces can also avoid some emergencies [30], such as the emergency braking button of the elevator, door closing prompt of the subway, etc.
2.2.4. Urban Environment
The impact of the urban environment on the safety of urban public space is mainly reflected in the climatic conditions, geographical location, drainage system, and whether there are instructions in dangerous areas. Urban climate disasters are mainly manifested in floods caused by heavy rainfall and storms, fires caused by high temperatures and drought, and climate disasters also easily lead to other urban safety accidents, such as flood and waterlogging meteorological disasters, which induce geological disasters such as water and soil loss [27,30]. The impact of an urban geographical location on the safety of urban public space is mainly reflected in earthquakes [31]. Therefore, for cities located in the earthquake belt, an earthquake is an important factor affecting their safety, which not only endangers the safety of urban public space but also endangers the safety of the whole social environment. Therefore, for these cities with special geographical locations, the seismic resistance of public buildings is particularly important. The occurrence of many public health emergencies is not only affected by human and material factors but also by environmental factors. For example, the urban drainage system in which the whole city is located has defects, which can easily lead to urban flood disasters in heavy rainfall weather, such as heavy rainstorms [32].
2.2.5. Road Traffic
The impact of road traffic on the safety of urban public space is mainly reflected in four aspects: the setting of road traffic lanes, the flatness of urban roads, the signal lights of road traffic and the emergency passageways in public places [21,33,34]. Compared with surface structure characteristics, damage conditions, structural bearing capacity and other factors, pavement smoothness has a greater impact on pavement performance, accounting for about 95% of it [33]. Traffic light recognition technology is an important part of the driver assistance system [21]. It can help drivers correctly identify traffic signals, effectively reduce traffic accidents, and provide technical safety for unmanned driving.
3. Materials and Methods
3.1. Study Process
This study method first constructs an urban public space safety evaluation index system based on a literature review. Then, based on the data collected by a questionnaire survey, the structural equation model is used to analyze the influencing factors of urban public space safety. The above results are discussed, and conclusions are drawn. The specific process can be seen in Figure 1.
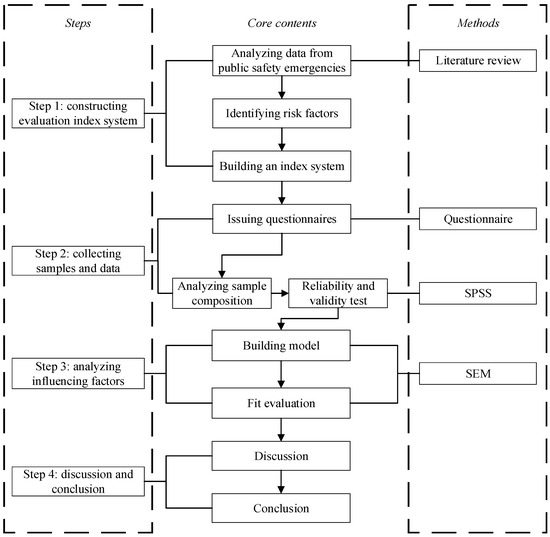
Figure 1.
Study process.
3.2. Introduction of Evaluation Index System
3.2.1. Principles of Constructing an Index System
The rationality of the safety evaluation system is the basis for assessing disasters. Therefore, a scientific and reasonable public space safety evaluation index system needs to follow the principles shown in Table 1.

Table 1.
Principles of constructing index system.
3.2.2. Steps in Constructing an Index System
The construction of the urban public space safety risk evaluation index system can be divided into five steps, as shown in Figure 2. First, the data on public safety emergencies in recent years are analyzed. Then the risk factors affecting urban public safety are summarized. Finally, a preliminary risk evaluation index system is established.
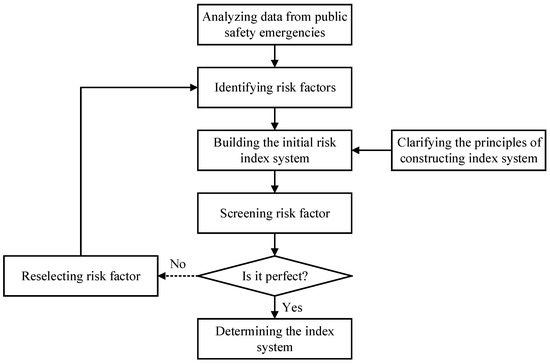
Figure 2.
Steps of constructing index system.
After completing the five steps, the index system is divided into three layers: the target layer, criterion layer and index layer [28]. The target layer is urban public space safety, which is the main study object. The criterion layer includes five factors: conscious behavior, social governance, construction equipment, urban environment, and road traffic. At the index level, 21 specific factors are selected by analyzing the factors at the criterion layer. See Table 2 for details.
Table 2.
Urban public space safety evaluation index system.
3.3. Samples and Data Collection
The data of this paper come from the questionnaire survey. Considering the complexity of the study objects, on the premise of ensuring the professionalism of the questionnaire, the questions are designed to be concise and easy-to-understand sentences. The questionnaire has 21 questions and is measured using a five-point Likert scale. The scores of “5, 4, 3, 2, 1” correspond to the five attitudes of “very important, important, qualified, unimportant, and very unimportant”. The questionnaires were distributed in typical urban public spaces in Fuzhou, Xiamen, etc. To improve the efficiency of the survey, the questionnaires were filled in using a combination of online and on-site methods over 90 days from June 2021 to September 2021. The study object involves scholars, managers and urban residents who are engaged in the research of urban public space. A total of 250 questionnaires were distributed, and 232 were recovered, for a recovery rate of 93%. Among them, there were 219 valid questionnaires, giving an effective recovery rate of 89%. The data can be seen in Table 3.
Table 3.
Questionnaire sample data statistics.
3.4. Introduction of the Reliability and the Validity Test
Reliability is an academic term for the reliability of results. Cronbach’s α coefficient and CITC value are commonly used indexes for reliability analysis. The reliability of the questionnaire was tested by SPSS 22.0 software. Cronbach’s α coefficient is greater than 0.8, indicating that the data are stable. The CITC value needs to be greater than 0.2; otherwise, the factor is not strongly correlated with the system. Validity refers to the degree to which a measurement tool accurately measures the object being measured. Validity refers to how well a measurement reflects what is being examined. The more consistent the measurement results are with the measurement content, the higher the validity; otherwise, the lower the validity. The Bartlett sphere test is used to determine whether the data are suitable for factor analysis. SPSS 22.0 software was used for KMO and Cronbach’s test.
3.5. Introduction of SEM
SEM (structural equation modelling) is a multivariate statistical method that includes path analysis and factor analysis. It can analyze the relationship between measurement variables, latent variables, and errors. It can also obtain the impact on dependent variables from the analysis of independent variables. SEM uses AMOS (analysis of moment structures) software to draw and browse the model through the visualization module; it can also fit the data collected through the questionnaire with various indexes of the model, and finally output the best model. When the fit indexes reach the standards, the model is scientific. The indexes include relative-fit indexes and absolute-fit indexes. The main indexes and standards are shown in Table 4.
Table 4.
The main indexes and standards [38].
SEM can be divided into EFA (exploratory factor analysis) and CFA (confirmatory factor analysis). This paper used CFA to verify the fitting degree of the index system and the questionnaire data and finally to judge whether the index system is established. CFA is a method of measuring whether the relationship between the measured factors and the measured items is consistent with the researcher’s predictions. SEM consists of a measurement model (see Equations (1) and (2)) and a structural model (see Equation (3)).
Equation (1) defines the relationship between the explicit observation variable and the implicit observation variable ; Equation (2) defines the relationship between the explicit latent variable and the implicit latent variable . δ is the residual of the dominant observed variable ; is the residual of the dominant latent variable ; is the regression coefficient of ; is the regression coefficient of .
Equation (3) represents the relationship between the implicit observation variable and the implicit latent variable . is the coefficient matrix between hidden, latent variables; is the coefficient matrix composed of hidden observed variables and hidden latent variables; is the residual of the equation.
The standardized path coefficient obtained according to the CFA model can calculate the weight of each index and then obtain the importance of each index. Equation (4) is as follows:
where is the weight coefficient of the index, and is the path coefficient of the index.
4. Result
4.1. Reliability and the Validity Test
The data from 219 questionnaires involving 21 factors were preliminarily analyzed, and the KMO value was 0.903 > 0.8, which indicated that the data reliability of the questionnaire was reliable. However, since the CITC values of Q2 and Q14 are both less than 0.2, the relationship between these two items and other items is very weak. After deleting Q2 and Q14, the new reliability coefficient is 0.925, which is a further improvement from the previous 0.903, as shown in Table 5.
Table 5.
Reliability analysis of 19 indexes.
It can be seen from Table 6 that the common factor variance of all indexes is higher than 0.4, indicating that the indexes can be effectively extracted. In addition, the p value (Sig.) is 0, and the KMO value is 0.910, which is greater than 0.6, indicating that there is a high correlation between the indexes established in the questionnaire. Therefore, the validity is guaranteed.
Table 6.
Validity analysis of 19 indexes.
4.2. Model Building and Identification
4.2.1. Model Correction
The pre-model was conducted for five latent variables and 19 observed variables. The pre-model is shown in Figure 3a, and the index fitting results are shown in Table 7. It can be seen from Table 7 that RMSEA and χ2/df of the pre-model do not match the standards, and all the indexes match the standards after deleting Q1 and Q7 with path coefficients less than 0.6. The revised after-model is shown in Figure 3b.
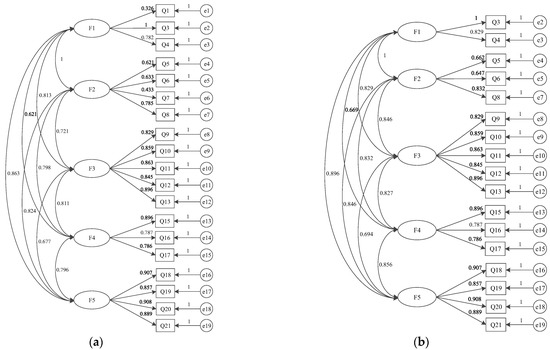
Figure 3.
(a) Pre-model (b) After-model.
Table 7.
Model fitting results.
4.2.2. Confirmatory Factor Analysis (CFA)
In this paper, five latent variables and 17 observed variables are analyzed by CFA. It can be seen from Table 8 that the standardized path coefficients of 17 observed variables are all greater than 0.6, which indicates that there is a significant correlation between latent variables and observed variables. At the same time, CFA can also calculate the convergent validity and discriminant validity of potential variables by calculating the AVE value and CR value. From Table 9a, it can be seen that the AVE values of the five latent variables are greater than 0.5, and the CR values are greater than 0.7. It shows that the data of this questionnaire has good convergent validity. It can be seen from Table 9b that the AVE square root value of Factor 1 is 0.924, which is greater than the correlation coefficient value of Factor 1 and the other four factors (the maximum is 0.279). Similarly, Factor 2, Factor 3 and Factor 4 are greater than their correlation coefficients with other factors. Therefore, the discriminant validity of the questionnaire data is good.
Table 8.
Factor load coefficient.
Table 9.
The convergent validity and discriminant validity.
4.3. Ranking of Indexes
By using Equation (4) for the standardized path coefficient obtained from the above analysis, we can get the weight of latent variables in the criterion layer and observed variables in the index layer and then obtain the ranking of 17 observed variables in the target layer. The weight and ranking of each index can be seen in Table 10. The importance of each criterion layer and index layer can be obtained by ranking latent variables and observed variables. First, in the criteria layer, the weight of construction equipment is 0.214, which is the index with the largest weight in the criterion layer. Next are road traffic, social governance, urban environment and conscious behavior. Their weights in the target layer are 0.208, 0.196, 0.192 and 0.190, respectively. Then, in the index layer, according to their importance to the target layer, they are ranked as fire awareness (10.59%), epidemic prevention awareness (9.35%), urban drainage system (7.54%), urban climate conditions (6.55%), hazardous environment content sign (6.06%), the flatness of urban roads (5.98%), traffic light (5.59%), setting of road traffic lanes (5.48%), criminal act (5.35%), population density (5.33%), public safety (4.96%), emergency passage in public places (4.78%), fire-fighting equipment in public places (4.72%), anti-riot equipment in public places (4.51%), the early warning system in public places (4.47%), the safety of public buildings (4.42%), and seismic resistance of public buildings (4.33%).
Table 10.
The weight and ranking of indexes.
5. Discussion
The most influential factors in urban public space safety are fire awareness and epidemic prevention awareness in conscious behavior, with a degree of influence of 10.59% and 9.35%. The most common and harmful public place emergency disaster is fire [3]. The reason for this situation is that people generally lack awareness of fire prevention and are often careless or take chances when facing fire hazards. For example, fires caused by throwing cigarette butts randomly and overloading the use of public places are hidden, which can often not be found in time, leading to the burning of nearby combustibles, thus causing greater personal and property losses. In 2020, the outbreak of COVID-19 brought the world to a standstill, which has seriously affected people’s pace of life and led to many deaths. Even in 2022, the impact of COVID-19 will continue. COVID-19 has forced employees to work at home, and their work efficiency is low; the reduction of the employee arrival rate leads to the reduction of the output of raw materials, which in turn leads to the rise of the price of raw materials. Company profits in the manufacturing and service industries are reduced and lead to layoffs. Additionally, medical resources are stretched; for example, the imbalance between the number of medical staff and patients is growing [39].
The second most influential factors are the urban drainage system, urban climate conditions and hazardous environment sign, accounting for 7.54%, 6.55% and 6.06%, respectively. Although most urban designs have taken climate conditions into consideration, it is undeniable that the abnormal climate in recent years has broken through the threshold of the original urban planning, causing a huge impact on the economy and safety of many countries. For example, some cities in China experience high temperatures of more than 40 degrees, while northwest China experienced snowfall with a depth of more than 10 cm in August 2022.
The third is road traffic, in which the proportion of emergency message zones in public places is far lower than other indexes. The reason is that the emergency message zones in China are arbitrarily occupied by the masses, and some communities even set up concrete piers in the emergency message zone for safety purposes. All the above reasons create a low status for emergency messaging in the public psychology. The fourth is social governance and construction equipment. The six indexes of these two layers have a moderate impact on urban safety.
In contrast, the safety of public buildings and seismic resistance of public buildings in construction equipment have the least impact on urban public space safety, which are 4.42% and 4.33%, respectively. This is because the high safety and seismic requirements of buildings are only applicable to areas within the seismic zone, such as Sichuan and Taiwan. Although the construction equipment in the criteria layer has the greatest impact on urban public space safety, these two factors have strong regional characteristics and are not universally applicable in the current harmonious human society. In other words, the high safety and seismic requirements of buildings play a small role in most cities.
6. Conclusions
6.1. Benefits
As the symbol of human civilization and the carrier of economic and social development, cities are the gathering centres of population, economic and social development. Previously, there were more than 2000 cities in the Northern Hemisphere alone, and nearly 50% of the world’s population lived in cities [3]. Therefore, no matter in terms of quantity, scale, or role in social development, cities are in a stage of rapid development. To improve the population carrying capacity and economic efficiency of the city, developers and the government are vigorously building urban public spaces such as rail transit and commercial streets. However, urban public space is a complex giant system. It is not only complex in structure and densely covered with buildings but also relatively closed and highly mobile, which will inevitably lead to fire, stampedes and other safety accidents. How to optimize urban public space management and avoid risks on the basis of existing conditions has become the mainstream in the academic field of urban safety.
This study uses literature analysis, a questionnaire survey, and SEM to build an index system of urban public space safety-influencing factors, and finally determines the key factors and proposes efficient risk management measures. We believe that this study can serve as an academic supplement to the academic field of urban safety. It can also provide feasible ideas for the government to formulate an urban public space safety management scheme. First of all, we use literature as a reference, a questionnaire survey as a data source, and SEM to build an initial model. Then, CFA is used to finally determine an index system consisting of three levels and 17 indexes. Finally, the standardized path coefficient is used to calculate the weight proportion of these 17 indexes in the whole system and rank them according to the weight. From the criterion layer, the factors that affect the safety of urban public space are construction equipment, road traffic, social governance, urban environment and urban behavior. Regarding the comprehensive standard layer, index layer and urban status quo, we should pay attention to fire awareness and epidemic prevention awareness.
6.2. Limitations
On the basis of previous studies, this study pays more attention to the volatile international situation and brings its current situation into the system. In addition, the government and developers can conduct actual scenario analysis from three levels of this study. Although the goal of this study has been achieved, there are still some limitations worth mentioning. First of all, the data of this study are from Chinese respondents, so it is impossible to judge whether this conclusion is applicable to cities in other countries. It is necessary to supplement the research data of foreign backgrounds in order to improve the universal applicability of the conclusions. Secondly, the data collected by the questionnaire are one-time. To maintain the relevance of conclusions, simulation scenarios must be supplemented. In the simulation scenario, the change of system risk can be simulated according to the change of different indicators.
Author Contributions
Conceptualization, X.L., C.W., M.L., Y.X., M.A.K. and Z.Z.; Methodology, X.L., C.W., M.L., Y.X., M.A.K. and Z.Z.; validation, X.L., C.W., M.L., M.A.K. and Z.Z.; formal analysis, X.L., C.W., M.A.K. and Z.Z.; writing—original draft preparation, X.L., C.W., M.A.K. and Z.Z.; writing—review and editing, X.L., C.W., M.L., Y.X., M.A.K. and Z.Z.; visualization, X.L., C.W., M.L., Y.X., M.A.K. and Z.Z.; supervision, C.W. and M.A.K.; project administration, C.W., M.A.K. and Z.Z. All authors have read and agreed to the published version of the manuscript.
Funding
General projects of China National Social Science Foundation (grant number: 22BGL237).
Institutional Review Board Statement
Not applicable.
Informed Consent Statement
Not applicable.
Data Availability Statement
The data sets during and/or analyzed during the current study are available from the corresponding author upon reasonable request.
Acknowledgments
The authors are grateful for the research grants awarded by General projects of China National Social Science Foundation for supporting this research and providing research facilities.
Conflicts of Interest
The authors declare no conflict of interest.
References
- Alfadil, M.O.; Kassem, M.A.; Ali, K.N.; Alaghbari, W. Construction industry from perspective of force majeure and environmental risk compared to the CoViD-19 outbreak: A systematic literature review. Sustainability 2022, 14, 1135. [Google Scholar] [CrossRef]
- Liu, H. Dynamic Analysis of Subway Structures under Blast Loading. Geotech. Geol. Eng. 2009, 27, 699–711. [Google Scholar] [CrossRef]
- Lee, M.; Hur, N. A detailed cfd simulation of the 2003 daegu metro station fire. Int. J. Air-Cond. Refrig. 2012, 20, 1250014. [Google Scholar] [CrossRef]
- Zhao, H.; Li, Z.; Zhou, R. Risk assessment method combining complex networks with MCDA for multi-facility risk chain and coupling in UUS. Tunn. Undergr. Space Technol. 2021, 119, 104242. [Google Scholar] [CrossRef]
- Bibri, S.E.; Krogstie, J.; Kärrholm, M. Compact city planning and development: Emerging practices and strategies for achieving the goals of sustainability. Dev. Built Environ. 2020, 4, 100021. [Google Scholar] [CrossRef]
- Cavallaro, M.; Asprone, D.; Latora, V.; Manfredi, G.; Nicosia, V. Assessment of Urban Ecosystem Resilience through Hybrid Social-Physical Complex Networks. Comput. Civ. Infrastruct. Eng. 2014, 29, 608–625. [Google Scholar] [CrossRef]
- Blöbaum, A.; Hunecke, M. Perceived danger in urban public space: The impacts of physical features and personal factors. Environ. Behav. 2005, 37, 465–486. [Google Scholar] [CrossRef]
- Chalfin, A.; Kaplan, J.; LaForest, M. Street light outages, public safety and crime attraction. J. Quant. Criminol. 2022, 38, 891–919. [Google Scholar] [CrossRef]
- Serre, D.; Barroca, B.; Balsells, M.; Becue, V. Contributing to urban resilience to floods with neighbourhood design: The case of Am Sandtorkai/Dalmannkai in Hamburg. J. Flood Risk Manag. 2016, 11, S69–S83. [Google Scholar] [CrossRef]
- Zalewski, A.; Kempa, J. Traffic Calming as a Comprehensive Solution Improving Traffic Road Safety. IOP Conf. Ser. Mater. Sci. Eng. 2019, 471, 062035. [Google Scholar] [CrossRef]
- Public Safety Canada. All Hazards Risk Assessment Methodology Guidelines 2012–2013; Public Safety Canada: Ottawa, ON, Canada, 2012. [Google Scholar]
- Stock, M.J.; Wentworth, J. Evaluating UK Natural Hazards: The National Risk Assessment. 2020. Available online: https://osf.io/wp83g/ (accessed on 28 October 2022).
- Shach-Pinsly, D.; Ganor, T. A New Approach for Assessing Secure and Vulnerable Areas in Central Urban Neighborhoods Based on Social-Groups’ Analysis. Sustainability 2021, 13, 1174. [Google Scholar] [CrossRef]
- Shariat, R.; Roozbahani, A.; Ebrahimian, A. Risk analysis of urban stormwater infrastructure systems using fuzzy spatial multi-criteria decision making. Sci. Total. Environ. 2018, 647, 1468–1477. [Google Scholar] [CrossRef] [PubMed]
- Chen, J.; Zhai, G.F.; Yao, F.J. The risk assessment of earthquake disaster in the process of urban master planning-taking the Shantou city as the case. Adv. Intell. Syst. Res. 2014, 102, 367–372. [Google Scholar]
- Völker, S.; Kistemann, T. Developing the urban blue: Comparative health responses to blue and green urban open spaces in Germany. Health Place 2015, 35, 196–205. [Google Scholar] [CrossRef]
- Crang, M. Public Space, Urban Space and Electronic Space: Would the Real City Please Stand Up? Urban Stud. 2000, 37, 301–317. [Google Scholar] [CrossRef]
- McQuire, S. Geomedia: Networked Cities and the Future of Public Space; John Wiley & Sons: Hoboken, NJ, USA, 2017. [Google Scholar]
- Li, X.; Chen, W.; Wang, C.; Kassem, M.A. Study on Evacuation Behavior of Urban Under-ground Complex in Fire Emergency Based on System Dynamics. Sustainability 2022, 14, 1343. [Google Scholar] [CrossRef]
- Ye, M.S.; Jin, Q.X.; Wang, Y.T. Disaster Management and Response Strategy in Urban Public Safety of the U.S.A. Key Eng. Mater. 2011, 467–469, 7–12. [Google Scholar] [CrossRef]
- Welsh, B.C.; Farrington, D.P. Making Public Places Safer: Surveillance and Crime Prevention; Oxford University Press: Oxford, UK, 2009. [Google Scholar] [CrossRef]
- Huang, L.; Wu, C.; Wang, B.; Ouyang, Q.; Lin, H. An unsafe behaviour formation mechanism based on risk perception. Hum. Factors Ergon. Manuf. Serv. Ind. 2019, 29, 109–117. [Google Scholar] [CrossRef]
- Wan, M.; Chen, Z.; Guo, J. Optimization of security check efficiency in subway station based on Anylogic: A case study of Nanchang Metro. J. Intell. Fuzzy Syst. 2021, 41, 5035–5043. [Google Scholar] [CrossRef]
- Zhenhua, W.; Shuangzhu, Y. Study on the Countermeasures of Preventing and Controlling Terrorist Attacks in the Urban Rail Transit. Soc. Sci. 2018, 7, 193–198. [Google Scholar] [CrossRef]
- Araos, M.; Austin, S.E.; Berrang-Ford, L.; Ford, J.D. Public health adaptation to climate change in large cities: A global baseline. Int. J. Health Serv. 2016, 46, 53–78. [Google Scholar] [CrossRef] [PubMed]
- Peng, C.; Ouyang, Z.; Wang, M.; Chen, W.; Li, X.; Crittenden, J.C. Assessing the combined risks of PAHs and metals in urban soils by urbanization indicators. Environ. Pollut. 2013, 178, 426–432. [Google Scholar] [CrossRef] [PubMed]
- Tobler, A.L.; Komro, K.A.; Dabroski, A.; Aveyard, P.; Markham, W.A. Preventing the link between SES and high-risk behaviors: “Value-added” education, drug use and delinquency in high-risk, urban schools. Prev. Sci. 2011, 12, 211–221. [Google Scholar] [CrossRef] [PubMed]
- Ferreira, T.M.; Maio, R.; Vicente, R. Analysis of the impact of large scale seismic retrofitting strategies through the application of a vulnerability-based approach on traditional masonry buildings. Earthq. Eng. Eng. Vib. 2017, 16, 329–348. [Google Scholar] [CrossRef]
- Wang, C.; Tang, Y.; Kassem, M.A.; Li, H.; Hua, B. Application of VR technology in civil engineering education. Comput. Appl. Eng. Educ. 2022, 30, 335–348. [Google Scholar] [CrossRef]
- Pyayt, A.; Shevchenko, D.; Kozionov, A.; Mokhov, I.; Lang, B.; Krzhizhanovskaya, V.; Sloot, P. Combining Data-Driven Methods with Finite Element Analysis for Flood Early Warning Systems. Procedia Comput. Sci. 2015, 51, 2347–2356. [Google Scholar] [CrossRef]
- Lin, H.-H.; Chen, I.-Y.; Tseng, C.-H.; Lee, Y.-S.; Lin, J.-C. A Study of the Impact of River Improvement and Greening on Public Reassurance and the Urban Well-Being Index during the COVID-19 Pandemic. Int. J. Environ. Res. Public Health 2022, 19, 3958. [Google Scholar] [CrossRef]
- White, I. The absorbent city: Urban form and flood risk management. Proc. Inst. Civ. Eng. Urban Des. Plan. 2008, 161, 151–161. [Google Scholar] [CrossRef]
- Barkham, R.; Bokhari, S.; Saiz, A. Urban Big Data: City Management and Real Estate Markets. In Artificial Intelligence, Machine Learning, and Optimization Tools for Smart Cities; Springer: Cham, Switzerland, 2022; pp. 177–209. [Google Scholar] [CrossRef]
- Sufianto, H.; Green, A.R. Urban Fire Situation in Indonesia. Fire Technol. 2011, 48, 367–387. [Google Scholar] [CrossRef]
- Brem-Wilson, J. La Vía Campesina and the UN Committee on World Food Security: Affected publics and institutional dynamics in the nascent transnational public sphere. Rev. Int. Stud. 2016, 43, 302–329. [Google Scholar] [CrossRef]
- Bode, N.W.; Codling, E.A. Human exit route choice in virtual crowd evacuations. Anim. Behav. 2013, 86, 347–358. [Google Scholar] [CrossRef]
- Wu, M. Structural Equation Modeling: Operation and Application of AMOS; Chongqing University Press: Chongqing, China, 2010. [Google Scholar]
- Bryan, J.L. Behavioral response to fire and smoke. SFPE Handb. Fire Prot. Eng. 2002, 2, 42. [Google Scholar]
- Gao, X.; Huang, G.; Zhao, Q.; Cao, C.; Jiang, H. Robust optimization model for medical staff rebalancing problem with data contamination during COVID-19 pandemic. Int. J. Prod. Res. 2021, 60, 1737–1766. [Google Scholar] [CrossRef]


Publisher’s Note: MDPI stays neutral with regard to jurisdictional claims in published maps and institutional affiliations. |
© 2022 by the authors. Licensee MDPI, Basel, Switzerland. This article is an open access article distributed under the terms and conditions of the Creative Commons Attribution (CC BY) license (https://creativecommons.org/licenses/by/4.0/).