Abstract
The advancement of marine engineering has brought close attention to the durability of concrete structures. In order to investigate the time-varying performance of reinforced concrete beams in a marine environment and to better apply sea sand directly in marine engineering, this paper describes tests and analysis on the flexural performance of reinforced sea sand concrete beams after being exposed to a tidal environment. Eight beams were tested using four-point static loading equipment. The variation parameters included the type of mixing water, longitudinal reinforcement rate, sea sand replacement rate and duration of service. The force damage process and damage pattern were observed. The load–maximum width crack curve and load–deflection curve were obtained. The effects of each variation parameter on the mechanical properties such as ultimate bearing capacity, initial rigidity, energy dissipation coefficient and ductility coefficient were analyzed. The test results show that compared with the specimens exposed to the tidal environment for 90 days, the peak load of the specimens decreased by 5.6%, the initial rigidity decreased by 60.9% and the ductility coefficient decreased by 41% after 270 days of exposure, while the peak deflection and energy dissipation indexes first increased and then decreased. The seawater mixing can enhance the peak load and cracking load of the specimens, but the initial rigidity, peak deflection, energy dissipation coefficient and ductility coefficient of the specimens are reduced to some extent. The initial rigidity of the specimens tended to increase with the increase in the sea sand replacement, but the peak load decreased. Under the same reinforcement rate, reducing the diameter of the reinforcement is beneficial to improve the initial rigidity of the specimen, while using the reinforcement with higher elongation can effectively enhance the peak deflection of the specimen. Based on the Chinese code, the calculation method of flexural bearing capacity with modified concrete strength is proposed, and the calculation results are in good agreement with the test results.
1. Introduction
With the continuous advancement of marine engineering, the durability of concrete structures has received more and more attention [,,]. It is well recognized that steel corrosion is the main reason for the shortened service life of marine structures [,]. Offshore engineering structures are in a complex corrosive environment where the corrosion of steel reinforcement by chloride ions in seawater will not only reduce its effective cross-sectional area, but the generation of rust will also cause cracking and spalling of the concrete protective layer [,,], resulting in the deterioration of the force performance of the structure [,]. This degradation effect may be further exacerbated by seawater scouring and wet and dry cycles [,,]. Therefore, clarifying the time-varying performance of the structure under a corrosive environment is a guarantee to promote the safe construction of offshore projects. In addition, adopting local materials and using marine sand as aggregate to prepare concrete can greatly reduce the cost of offshore engineering and time [,,] and realize the efficiency of offshore engineering construction.
The durability of reinforced concrete beams has been studied by many authors [,,,,,,,,,]. Li et al. [] investigated the mechanical performance of reinforced concrete beams under simultaneous loading and corrosion and experimental results showed that the ultimate load capacity and deformation capacity of the beams significantly decreased with corrosion cycles at higher sustained load levels. Ma et al. [] investigated the degradation of the seismic performance of corroded RC columns and proposed an empirical model to predict the residual load capacity of corroded columns. Dang et al. [] analyzed the effect of reinforcement corrosion on the buckling behavior of corroded RC beams and further predicted the residual buckling strength of concrete beams. Tapan et al. [] proposed a method considering many effects to predict the residual bearing capacity of corroded RC columns under different degradation conditions, such as reinforcement buckling and deformation incompatibility between the reinforcement and the surrounding concrete. Yalciner et al. [] developed an empirical model to predict the structural behavior of corroded RC columns based on the experimental results of full-size RC columns. Işık et al. [] studied the effect of different concrete cover thicknesses on the performance of building structures and proposed solutions for the corrosion of reinforcement. Ansari et al. [] proposed a new method to improve the carbonation resistance of calcium sulfate aluminate cements, which led to further improvement in the durability performance of concrete. Dong et al. [] studied the effect of marine environmental exposure on sea sand seawater concrete beams and revealed the mechanisms causing structural performance changes through analysis and calculations. Ahmad et al. [] found the law of the effect of random arrangement of steel fibers on the fracture and ductility properties of concrete beams through an experimental study. Hariche et al. [] studied the effect of reinforcement configuration and continuous loading on the performance of reinforced concrete beams affected by reinforcement corrosion, giving the evolution of reinforcement corrosion and central deflection under simultaneous loading and corrosion.
Most of the studies on the mechanical performance of members in a marine environment have been conducted by artificially simulating dry and wet cycles and seawater scouring, which still have some differences from the real marine environment. In the existing studies on the mechanical properties of reinforced concrete beams in real marine environments [,], there is a lack of relevant research information on the time-varying mechanical properties of reinforced marine sand concrete beams in tidal environments, which need to be investigated through experiments. Therefore, in this study, eight reinforced marine sand concrete beams were designed and fabricated. Four-point bending loading tests were conducted in a sea area of the South China Sea after tidal environment exposure and reaching different durations of service of the design. The force damage process and damage pattern, crack development and load–deflection curves of the specimens were analyzed, and the influence law of each variation parameter on the force performance index of the class members after exposure to the tidal environment was found. Finally, based on the Chinese code, the calculation method of flexural bearing capacity with modified concrete strength is proposed considering the effect of concrete strength variation, which provides a reference for the design of reinforced sea sand concrete beams in offshore projects.
2. Experimental Program
2.1. Preparation of Specimens
Eight reinforced sea sand concrete beams were designed and fabricated for three levels of the tidal environment duration of service (90 d, 180 d, 270 d), sea sand replacement rate (0%, 50%, 100%), longitudinal reinforcement rate (0.64%, 0.93%, 1.27%) and type of mixing water (fresh water, sea water) as variation parameters. The cross-section dimensions of all specimens are the same, where the width is 150 mm, the height is 200 mm and the length is 1250 mm. The spacing between the hoops is 100 mm, and the thickness of the concrete protective layer is taken as 25 mm. The cross-sectional dimensions and the form of reinforcement of the specimens are shown in Figure 1. The specific parameters of the specimens are shown in Table 1.
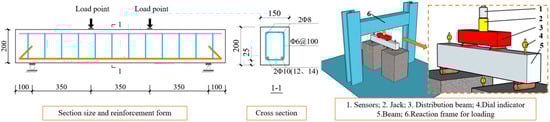
Figure 1.
Schematic diagram of specimen and loading device.

Table 1.
Parameters of the specimen and test results.
The fabrication process of the test pieces is given below. (1) Fabrication of the mold. The wooden template was used to make the specimen according to its size. (2) Fabrication of reinforcing steel cage skeleton. The position of the hoop was first positioned, followed by fixing it with galvanized ties to ensure that the relative positions of the components of the steel skeleton were changed to a lesser extent. (3) Paste the steel strain gauges. The location where the strain gauges were pasted was cleaned with alcohol after rust removal, and the strain gauges were glued to the surface of the reinforcement. Next, a layer of silicone rubber was wrapped around the strain gauges to prevent them from being damaged during the pouring. (4) Pouring and maintenance. After pouring and adequate vibrating, excess concrete at the top was removed with a scraper in order to obtain a relatively flat surface. All specimens were cured under natural conditions for 28 days to allow the concrete to grow sufficiently in strength (as shown in Figure 2).
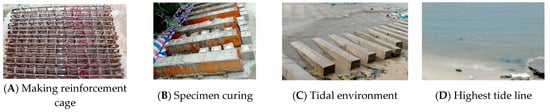
Figure 2.
Specimen fabrication and tidal environment.
The marine tidal environment in this paper refers to the tidal environment at the coastal beach, which is categorized as the fourth type of concrete structure environment. It is characterized by being submerged by seawater at high tide and exposed to air at low tide, with obvious wet and dry cycle characteristics. The geographic location of the tidal zone of the beam specimen in this study is 21°4′13″ N, 109°7′46″ E. The specimen was placed about 5 m inside the highest tide line, and the average tide line height is 4.6 m (as shown in Figure 2).
2.2. Properties of Materials
2.2.1. Steel
The grade of steel bars were HRB400, 6 mm hoop diameter, 8 mm erection bar diameter and three longitudinal bar diameters (10 mm, 12 mm and 14 mm). The uniaxial tensile properties of the bars were tested on the WAW-600 Wanlong microcomputer-controlled electro-hydraulic servo universal testing machine. The test results are as follows. The yield strength of 8 mm steel bar is 511.1 Mpa, and the tensile strength is 734 Mpa. The yield strength of 10 mm steel bar is 502.6 Mpa, the tensile strength is 725.6 Mpa and the elongation is 20.1%. The yield strength of 12 mm steel bar is 452.4 Mpa, the tensile strength is 629.4 Mpa and the elongation is 23.8%. The yield strength of 14 mm steel bar is 440.7 Mpa, the tensile strength is 585.6 Mpa and the elongation is 10.6%.
2.2.2. Sea Sand Concrete
The materials used to make concrete include fresh water, sea water, river sand, sea sand, ordinary silicate cement (cement grade P.O.42.5) and natural coarse aggregates. Both sea water and sea sand were taken directly from a sea area in the South China Sea. The physical properties of river sand and sea sand were measured according to the specification [] and the results are as follows. The fineness modulus of river sand was 3.1, apparent density was 2500 kg·m−3 and bulk density was 1540 kg·m−3. The fineness modulus of the sea sand was 2.6, apparent density was 2620 kg·m−3, bulk density was 1450 kg·m−3 and shell content was 0.35%. The classification curves of sea sand and river sand are given in Figure 3A, and both belong to class II sand. Compared to river sand, sea sand has higher shell content and it has a smoother surface. The concrete mixes are shown in Table 2. Ten groups of 30 standard cubic specimens with design strength C35 were designed according to different variables (because the specimens were in a marine environment, their concrete design strength should be greater than C30). The compressive strength test was performed according to the Chinese specification (GB50081-2002) [], and the average value of each group was taken as its representative value to eliminate dispersion (the results are listed in Table 1). The relationship between concrete slump and the variation of sea sand replacement rate and type of mixing water is shown in Figure 3B. As seen in Figure 3B, the slump satisfies the plastic concrete requirements.
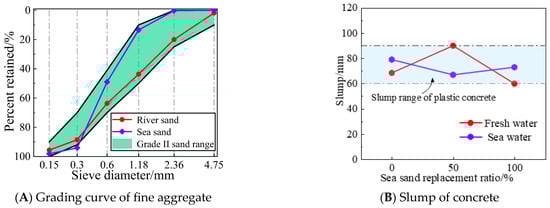
Figure 3.
Fine Aggregate Grading Curve and Concrete Slump.
Table 2.
Mix proportions of concrete.
2.3. Test System and Instruments
The loading and testing apparatus consisted of a support, reaction frame for loading, a hydraulic jack, three dial indicators, a load sensor and a crack lateral width meter. The beam specimens were loaded with four-point bending (the loading schematic is shown in Figure 1), and all the specimens had a net span lo = 1050 mm and a shear span of 350 mm. The loading regime used a graded loading method with load control first and then displacement control. From the beginning of formal loading to the first cracking, the load was controlled using 5 kN increments, and after cracking until the yielding of the reinforcement (reading the yield strain through the longitudinal reinforcement strain gauges), the load was controlled using 10 kN increments, with each level of load lasting 2 min. After the end of load holding, the crack width was measured with a crack lateral width meter, and the development of cracks was also described on the surface of the specimens. After yielding of the longitudinal bars, continuous loading was carried out and the load was applied in increments of 0.5 mm for the mid-span deflection until the specimens were damaged (concrete crushed in the compressed zone or the specimen load dropped to 85%).
3. Experimental Results and Analysis
3.1. Damage Process and Morphology
It can be found that through the damage process the failure modes of specimens under different parameters are nearly the same. The typical failure modes of the specimens are as follows: (a) the specimen is subjected to a small bending moment during the period from the beginning of the test of formal loading to 10% of the peak load. The cross-section is not yet cracked, so there is no significant change on the outer surface. At this time, the deflection growth in the span is approximately linear, and the specimen exhibits linear elastic deformation characteristics. (b) Near the time of cracking, the specimen exhibits certain plastic properties, and the deflection growth rate is greater than that of the first stage. (c) When the load cell monitor readings reach 13% to 27% of the peak load, the appearance of significant cracks can be observed in the purely bending section of the span of the beam, with the extension height. (d) As the loading proceeds, the mid-span cracks gradually increase and the height degree of crack development further deepens. Continuing to load, oblique cracks appear in the bending shear section along the line between the loading point and the corresponding side of the support. By the time the concrete is crushed in the compression zone, the loading ends, and it can be observed that fewer new cracks are produced and are basically the deepening extension of the original cracks. The specimen shows a typical bending damage of suitable reinforcement.
The failure pattern and crack distribution (excluding crush zone) of each specimen are shown in Figure 4A–H. From the comparison of each figure, it can be seen that for the reinforced sea sand concrete beam specimens with different variation parameters, the damage pattern and final damage morphology are similar, and they all exhibit the proper reinforcement damage in the positive section damage. The above indicates that the variation parameters (sea sand replacement rate, longitudinal reinforcement rate, type of mixing water and duration of service) do not have significant effects on the damage mode and final damage morphology of the specimens under the tidal environment of time duration of 270 d.
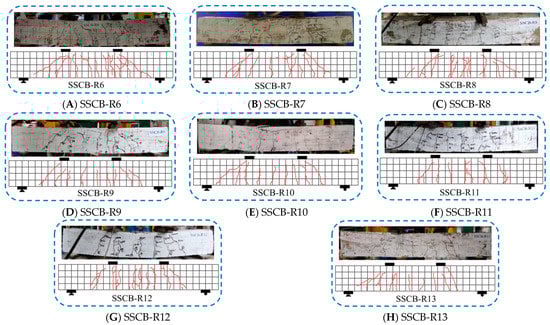
Figure 4.
Final failure pattern and fracture distribution.
3.2. Width of Crack
To determine the maximum crack width, the crack width development in the specimens was measured during the loading process (according to the load classification). The final measurement is shown in Figure 5, where the crack width is the maximum crack width of the specimen at a certain load level. Referring to the code “Code for Design of Concrete Structures” [] (GB 50010-2010) 0.2 mm was taken as the crack width threshold (dashed line in the figure). From Figure 5A–D, it can be seen that the maximum crack width of each specimen increases linearly with the increase in load, and the crack width is less than 0.1 mm when cracking, and the load is 50~100 kN when reaching the threshold value of crack width (0.2 mm) in a normal use limit state. The above indicates that the variation parameters (sea sand replacement rate, longitudinal reinforcement rate, type of mixing water and duration of service) did not have significant effects on the crack width development of the specimens under the tidal environment of 270 d duration. The reason for this may be that the reinforcement of the specimen beams was still protected by the concrete protective layer under the 270 d tidal environment (wet and dry cycles) and was less affected by chloride ion corrosion. The bond between the reinforcement and concrete interface was not damaged, so the crack width development of the specimens tended to be consistent.
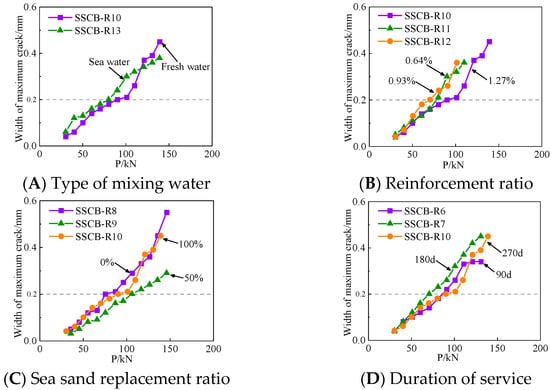
Figure 5.
Curve of maximum crack width of specimen.
3.3. Load–Deflection Curves
Figure 6A–D show the measured load–deflection curves for different parameters. The point where the secant rigidity of the specimen decreases to a large extent is taken as the yield point of the specimen. The load–deflection curves of the specimens can be divided into two categories according to the different trends as follows.
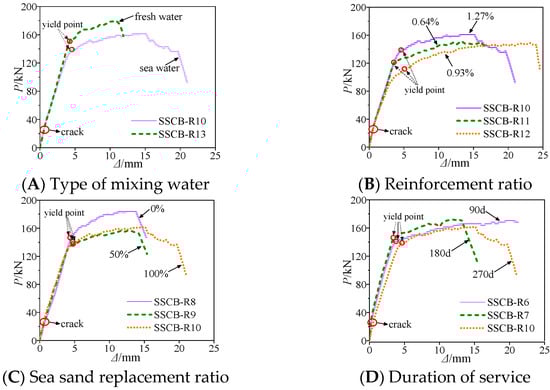
Figure 6.
Load–deflection curve.
Category I: The curves are divided into three stages: elastic stage (specimen not cracked), elastic–plastic stage after cracking to yielding of the reinforcement and yielding to damage of the reinforcement. In the elastic phase of the specimen, the increment of deflection of the specimen changes less with the rising load (as shown in the Figure 6). This is because the tensile force in the lower part of the beam is shared by the reinforcement and the bond between the reinforcement and the concrete interface, and the reinforcement is in the elastic stage at this stage, while the bond between the reinforcement and the concrete interface is intact and also in the elastic rising section, so the specimen as a whole is in the elastic stage.
In the elastic–plastic stage, that is, after the specimen cracking to the yielding stage of the reinforcement, the incremental deflection of the specimen with the rise of the load becomes larger than the first stage. This is because the reinforcement enters the elastic–plastic phase, and the bond between the reinforcement and the concrete interface appears to be damaged to some extent with the growth of the reinforcement strain. Therefore, the growth of deflection of the specimen is greater than the elastic phase under the same load increment.
After entering the yielding section of the reinforcement until the damage, the cut-line rigidity of the specimen decreases to a greater extent and the deflection grows while the load increment is relatively small (e.g., specimen SSCB-R6 in Figure 6D). This is because there is no significant increase in the stress of the reinforcement after it enters the yield section, while the strain increases more rapidly. Therefore, the cut-line rigidity of the specimen shows a large degree of decrease. After the yielding section, the reinforcement section is entered and the stress increases slowly, while the strain increased substantially. The crack develops faster and the bond between the reinforcement and concrete interface is further damaged during this process as the crack continues to develop. The deflection of the specimen grows, while the load rises slowly until the reinforcement necking is broken and the load drops abruptly, and the loading ends.
Category II: The overall trend is basically the same as the first category of curves, the difference lies in the elastic phase without cracking and the elastic–plastic phase after cracking to the yielding of the reinforcement. The increment of deflection in this part of the second category of curves under the same load increment is significantly larger than the first category of curves, the degree of difference mainly depends on the duration of service in tidal environment (as shown in Figure 6D), which can be clearly observed by the comparison of SSCB-R10 to SSCB-R6 specimens.
4. Analysis of Test Variation Parameters
4.1. Mechanical Performance Index
In order to evaluate the difference of force performance of reinforced sea sand concrete beams under different parameters, the main mechanical property indexes are initial rigidity (K), ultimate bearing capacity (Pu), peak deflection (Δu), energy dissipation coefficient (E*) and ductility coefficient (μ).
The initial rigidity (K) reflects the ability of the specimen to resist deformation, uniformly taken as the cut-line rigidity of the cracking point on the specimen deflection–load curve. The method is schematically shown in Figure 7.
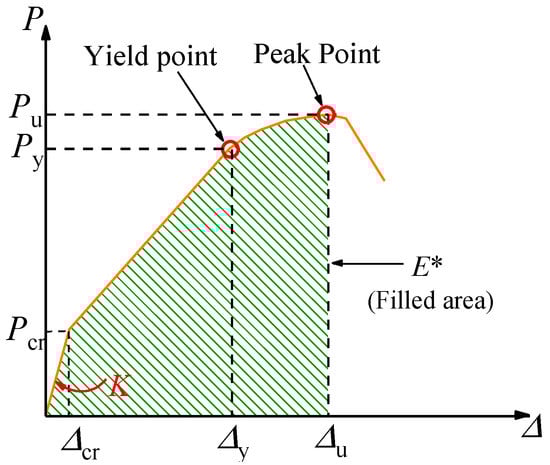
Figure 7.
Calculation diagram of energy consumption index and ductility index.
Energy consumption index (E*) reflects the size of the specimen’s energy consumption capacity from bearing load to damage, generally taking reduction in the specimen bearing capacity down to 85% of the peak as a sign of damage. In this study, most of the specimens were damaged when the load did not fall to 85% of the peak load, and there is a sudden drop after the peak. Therefore, the peak load point is taken as the damage point uniformly. The magnitude of the energy dissipation index is the area enclosed under the load–deflection curve from point 0 to the damage point, which is calculated schematically in Figure 7.
The ductility coefficient (μ) is used to characterize the deformation capacity of a section of a member yielding to the maximum load carrying capacity. In this paper, the displacement ductility coefficient is used to reflect the ductility performance of the beam, which is obtained by referring to the literature [] as follows.
Note: Δy indicates the yield displacement, the deflection when the load displacement curve of the specimen makes an obvious turn is selected in this paper. Δu indicates the ultimate displacement, which is the deflection corresponding to the peak load of the specimen (the values of Δy and Δu are shown in Figure 7).
A comparative analysis was conducted based on different parameters of the specimen.
4.2. Type of Mixing Water
Figure 8 shows the effect of type of mixing water (fresh water and sea water) on the initial rigidity, cracking and peak load, peak deflection, energy dissipation index and ductility index of reinforced sea sand concrete beam specimens.
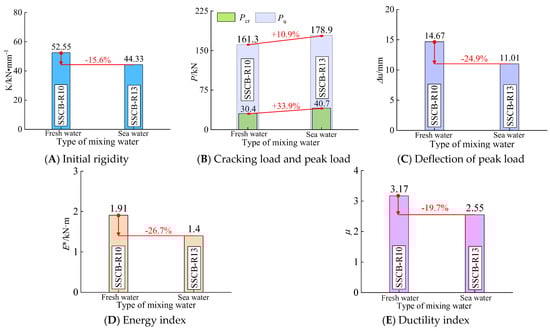
Figure 8.
The performance index varies with the type of mixing water.
As can be seen in Figure 8A, the initial rigidity of the specimen changed from 52.35 kN·mm−1 to 43.33 kN·mm−1 when the type of mixing water was changed from fresh water to sea water, which decreased by 15.6%.
As seen in Figure 8B, the cracking load and peak load of the specimens (the cracking load and peak load are 30.4 kN and 161.3 kN, respectively) with mixing sea water increased by 33.9% and 10.9%, respectively, compared to those with freshwater mixing and raising, which indicates that the increase in concrete strength by seawater mixing and raising increased the bearing capacity of the specimens. This is because the cl- ions in sea water have a certain promotion effect on the hydration of cement, and its hydration products fill the concrete pores, so the microstructure of concrete becomes denser and the ultimate bearing capacity of the specimens is increased. As seen in Figure 8C–E, the peak deflection of the specimens with mixing sea water decreased by 24.9%, the energy consumption index decreased by 26.7% and the ductility coefficient decreased by 24.9% compared with the specimens with freshwater mixing and raising. This indicates that although the mixing sea water has improved the bearing capacity of the specimens, it has reduced the ductility of the specimens, so that the peak load is reached in advance, and therefore the peak deflection and energy consumption indexes are reduced.
In conclusion, mixing sea water can improve the peak load and cracking load of sea sand concrete beams under a tidal environment, but it has a certain degree of reduction on its initial rigidity, peak deflection, energy dissipation index and ductility index.
4.3. Longitudinal Reinforcement Ratio
Figure 9 shows the effects of different longitudinal reinforcement rates (0.64%, 0.93% and 1.27%) on the initial rigidity, cracking and peak load, peak deflection, energy dissipation index and ductility index of reinforced sea sand concrete beam specimens.
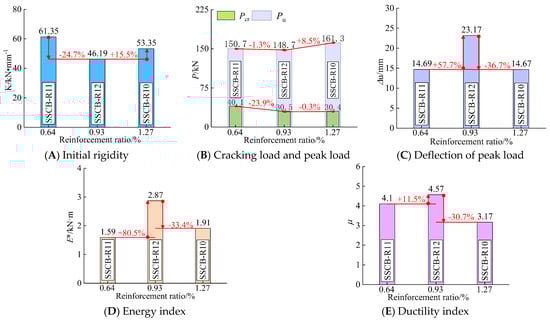
Figure 9.
The performance index changes with the ratio of reinforcement.
As seen in Figure 9A, the initial rigidity of the specimen was 61.35 kN·mm−1, 46.19 kN·mm−1 and 53.35 kN·mm−1, which decreased by 24.7% and then increased by 15.5% with the increase in the longitudinal reinforcement rate.
As seen in Figure 9B, the cracking loads of the specimens were 40.1 kN, 30.5 kN and 30.4 kN in order with the increase in the longitudinal reinforcement rate, which showed a decreasing trend with a decrease of 23.9% and 0.4%, respectively. The peak loads of the specimens were 150.7 kN, 148.7 kN and 161.3 kN in order, with an overall small increase. The peak loads of specimens with reinforcement rates of 0.64% and 0.93% were close to each other, and the difference was only 1.3%. The peak loads of specimens with a reinforcement rate of 1.27% were raised by 8.5%.
As seen in Figure 9C–E, with the increase in the longitudinal reinforcement rate, the peak deflection of the specimens (peak deflection of 14.69 mm at 0.64% reinforcement rate) first increased by 57.7% and then decreased by 36.7%, the energy consumption index first increased by 80.5% and then decreased by 33.4% and the ductility coefficient first increased by 11.5% and then decreased by 30.7%, all of which showed a trend of increasing and then decreasing, with large fluctuations.
The above shows that the reinforcement rate of longitudinal bars has different effects on the initial rigidity, cracking and peak load, peak deflection, energy consumption index and ductility index of the specimens. The peak deflection, energy consumption index and ductility index were significantly affected, and the peak deflection of the specimen reached 23.17 for the reinforcement rate of 0.93% (12 mm diameter), while the peak deflection of the specimens with reinforcement rates of 0.64% and 1.27% was close to that of the former, which was about 63%. The peak loads of the three specimens are not very different, so the energy dissipation index and ductility index also show similar trends. The reason for this is that the difference in the diameter and tensile properties of the longitudinal reinforcement makes the difference in the bonding performance between the reinforcement and the concrete interface. Therefore, the performance indexes of the specimens do not show a linear increase with the rise of the reinforcement rate, but with the difference in the diameter and performance of the reinforcement to show different work performance (as shown in Table 1 and Section 2.2.1). Therefore, in the engineering design, it is recommended that the contact area between the reinforcement and concrete interface can be increased by reducing the diameter of the reinforcement at the same reinforcement rate, which is conducive to improving the initial rigidity of the specimen. At the same time, considering the elongation of the reinforcement, the use of reinforcement with higher elongation can effectively improve the peak deflection of the specimen, thus improving the energy dissipation index and ductility of the specimen.
In summary, the reinforcement rate of longitudinal bars has a significant effect on the peak deflection, energy dissipation index and ductility index of sea sand concrete beams. The effects on initial rigidity, cracking and peak load are small, and the degree of influence depends on the size and tensile properties of the reinforcement.
4.4. Sea Sand Replacement Ratio
Figure 10 shows the effects of different sea sand replacement rates (0%, 50%, 100%) on the initial rigidity, cracking and peak load, peak deflection, energy dissipation index and ductility index of reinforced sea sand concrete beam specimens.
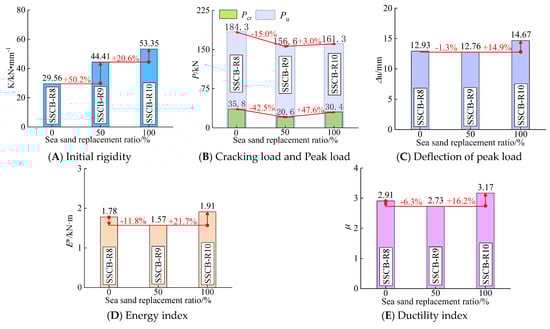
Figure 10.
The performance index changes with the replacement rate of sea sand.
As seen in Figure 10A, the initial rigidity of the specimens was 29.56 kN·mm−1, 44.41 kN·mm−1 and 53.35 kN·mm−1 in order with the increase in the sea sand substitution rate, with an overall increasing trend of 50.2% and 20.6%.
As seen in Figure 10B, the cracking loads of the specimens were 35.6 kN, 20.6 kN and 30.4 kN in order with the increase in the sea sand substitution rate, which decreased by 42.5% and then increased by 47.6%. The peak loads of the specimens were 184.3 kN, 156.6 kN and 161.3 kN in order, which decreased by 15% and then increased by 3% with the increase in sea sand replacement rate, with an overall decreasing trend. The reason for this is that the surface of sea sand is smoother and may contain a certain amount of shell-like fragments compared with river sand. This will have a certain weakening effect on the bond between cement gel and aggregate, which will reduce the ultimate bearing capacity of the specimen.
As seen from Figure 10C, the peak deflections of the specimens are 12.93 mm, 12.76 mm and 14.67 mm, respectively. The peak deflection of the specimens with 0% and 50% sea sand replacement is similar, with only a 1.3% difference, and the specimens with 100% sea sand replacement have a 14.9% improvement on this basis, with little overall change. As shown in Figure 10D,E, the energy consumption index and ductility index of the specimens decreased and then increased with the increase in the sea sand replacement rate, and the variation ranges were 11.8~21.7% and 6.3~16.2%, respectively.
In summary, the increase in sea sand replacement rate can improve the initial rigidity of the specimen, but it will reduce the peak load of the specimen. The peak deflection, energy dissipation index and ductility index of the specimens showed a trend of decreasing and then increasing with the increase in the sea sand replacement rate.
4.5. Duration of Service
The effects of different durations of service (90 d, 180 d, 270 d) in the tidal environment on the initial rigidity, cracking and peak load, peak deflection, energy dissipation index and ductility index of reinforced sea sand concrete beam specimens are given in Figure 11.
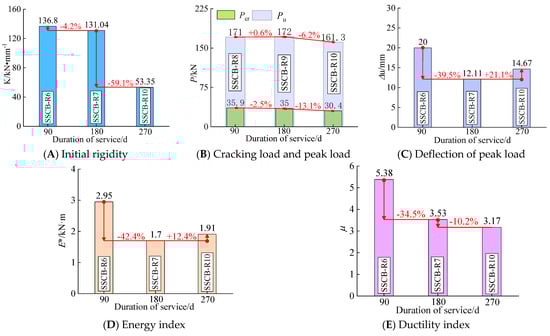
Figure 11.
The performance indexes vary with duration of service.
As seen in Figure 11A, the initial rigidities of the specimens were 136.8 kN·mm−1, 131.04 kN·mm−1 and 53.35 kN·mm−1 with increasing duration of service in the tidal environment. The initial rigidities of the specimens with duration of service of 90 d and 180 d were similar. When the duration of service increased to 270 d, the initial rigidity of the specimens showed a relatively large decrease (59.4%). As can be seen from Table 1, the initial rigidity of the specimens decreased to different degrees (54.2~77.9%) after the duration of service of 270 d in the whole range of specimens. The reason for this may be that after a certain length of service, the presence of Mg2+ (magnesium ions) in seawater acts on the concrete, decomposing the cement stone in the cement and causing the loosening of the concrete. In turn, the initial rigidity of the specimen decreases, and this effect becomes significant with the increase in the service time, so the initial rigidity of the specimen is negatively correlated with the service time.
As seen in Figure 11B, the cracking loads of the specimens were 35.9 kN, 35 kN and 30.4 kN in order with the increase in duration of service, showing a small decrease of 2.5% and 13.1%. The peak loads were 171 kN, 172 kN and 161.3 kN in order, which first remained constant and then decreased by 6.2%, indicating that the duration of service (within 270 d) had a small effect on the cracking and peak loads of the specimens.
As seen in Figure 11C, with the increase in service time, the peak deflection of the specimen is 20 mm, 12.11 mm and 14.67 mm in order, decreasing 39.5% and then increasing 21.1%, with an overall decreasing trend. It can also be observed from Figure 6D that the peak deflection of the specimens with the same reinforcement rate decreased to different degrees for the specimens with duration of service of 180 d and 270 d, indicating that the peak deflection of the specimens was negatively correlated with the service length. When the peak load of the specimen does not change much, its energy dissipation index is similar to the trend of peak deflection, which can be observed in Figure 11D. As seen in Figure 11E, the ductility index of the specimen is significantly negatively correlated with the length of service, with a decrease rate of 34.5% and 10.2%.
In summary, the increase in duration of service (within 270 d) in a tidal environment causes a significant decrease in the initial rigidity, peak deflection, energy dissipation index and ductility index of the specimens. However, the correlation with the cracking load and peak load of the specimens is small.
5. Calculation of Flexural Load Capacity
According to the Chinese specification (GB50010-2010) [], when the damage of reinforced concrete beam occurs, the bending moment of the section is provided by the upper compressed concrete together with the lower tensile reinforcement. The formula for calculating the cross-sectional bending moment (M) is as follows.
Note: α1 represents the discount factor of high-strength concrete (α1 is taken as 1 when the concrete strength grade does not exceed C50, α1 is taken as 0.94 when the concrete strength grade is C80 and the interval is determined by linear interpolation, α1 = 1 in this paper). fcu* represents the cube compressive strength of concrete under a conventional atmospheric environment. b represents the section width (b = 150 mm in this paper). ho represents the effective height (ho = 175 mm in this paper). x represents the height of compressed concrete. fy′ represents the compressive yield strength of compressed steel. As′ represents the total cross-sectional area of compressed steel. as′ represents the distance between the compressive reinforcement and the upper edge of the section (as′ = 25 mm in this paper). fy represents the tensile yield strength of the tensile reinforcement. As represents the total cross-sectional area of the tensile reinforcement.
The specimen in this paper is a four-point bending beam, so its bending load capacity (P) is calculated as
Note: a represents the shear span length (a = 350 mm in this paper).
In this paper, it was found that the changes in the load-bearing capacity of reinforced concrete beams after tidal environment exposure were mainly due to changes in material strength. The reinforcement in this study was not eroded in the tidal environment of 270 d due to the protection of the protective layer. Therefore, this paper only considers the effect of the degradation of concrete strength on the flexural bearing capacity of the specimen beams in the tidal environment. The concrete strength correction factor (Q) is introduced, which is obtained by fitting the data of this paper with those of the literature [,] (as shown in Figure 12). Its calculation equation is as follows.
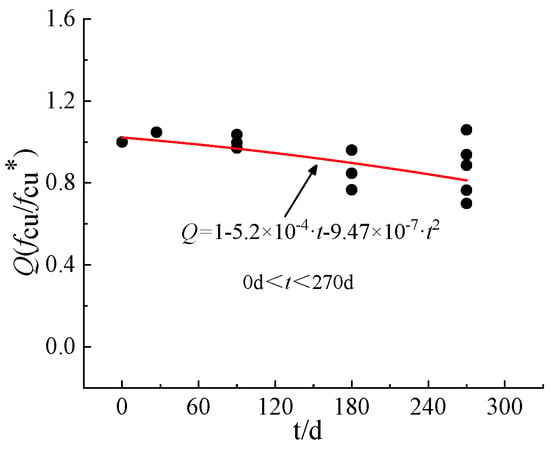
Figure 12.
Fitting formula for concrete strength correction factor (Q).
Note: t represents the duration of service, its unit is days (d).
Therefore, the bending capacity of reinforced concrete beams in a tidal environment is calculated by the following formula.
The theoretically calculated values of the flexural bearing capacity of reinforced concrete beams in a tidal environment are summarized in Table 3. It can be seen from the test that the specimen beam does not reach its ultimate load or breaking load when the reinforcement reaches near its yield strength, but makes a significant turn in the rigidity of the specimen (the point is defined as the yield point of the specimen in this paper). Therefore, the yield point strength of the specimen should be selected for comparison with the theoretical calculated value. As can be seen from Table 3, except for the SSCB-R11 specimen, the ratio of the calculated value to the test value of the remaining specimens is between 0.81 and 0.95, which indicates a conservative prediction. The average ratio between calculated and tested values for all specimens was 0.833, and the coefficient of variation was 0.128. After excluding the SSCB-R11 specimen, the average ratio between calculated and tested values for the remaining specimens was 0.868, and the coefficient of variation was 0.05. This indicates that the results calculated using the above method are in good agreement with the test results.
Table 3.
Calculated results of the specimen compared with the test results.
6. Conclusions
This paper presents an experimental study on the flexural performance of reinforced sea sand concrete beams exposed to tidal conditions (270 d). Eight specimens were tested under a four-point load. The following main conclusions can be drawn.
- (1)
- For specimens with different lengths of service in a tidal environment, the effect of each variation parameter on their crack width development was not significant. The damage process and final damage morphology are similar, and they all exhibit positive section damage in the reinforced suitable beams, which is not much different from that of ordinary reinforced concrete beams.
- (2)
- Seawater mixing can improve the peak load and cracking load of the specimen by increasing the concrete strength, but the initial rigidity, peak deflection, energy dissipation index and ductility index of the specimen are reduced to some extent.
- (3)
- The reinforcement ratio of longitudinal bars has a significant effect on the peak deflection, energy dissipation index and ductility index of the specimen. The effect on initial rigidity, cracking and peak load is less, and the degree of effect depends on the size and tensile properties of the reinforcement. In engineering, the initial rigidity of the specimen (at the same reinforcement ratio) can be improved by reducing the diameter of the reinforcement and using a higher elongation reinforcement to enhance the peak deflection of the specimen.
- (4)
- The sea sand replacement rate was positively correlated with the initial rigidity of the specimen and negatively correlated with the peak load. The peak deflection, energy dissipation index and ductility index of the specimens showed a trend of decreasing and then increasing with the increase in the sea sand replacement rate.
- (5)
- In the short-term (270 d) exposure to the tidal environment, the increase in duration of service causes a significant decrease in the initial rigidity, peak deflection, energy dissipation index and ductility index of the specimens, but has less effect on the cracking load and peak load of the specimens.
- (6)
- Based on the Chinese design standard, the method to calculate the flexural capacity of reinforced marine sand concrete beams after exposure to a tidal environment is proposed by considering the effect of concrete strength variation and combining with experimental data. It provides a reference for the design of reinforced marine sand concrete beams in offshore projects.
- (7)
- The bending performance variation of reinforced sea sand concrete beams exposed to a tidal environment (270 d) is revealed. For the specimens with longer duration of service in the tidal environment, further experimental studies are needed to provide more abundant data for engineering applications.
Author Contributions
Z.C.: Conceptualization, Funding acquisition, Writing—review and editing. Y.P.: Conceptualization, Formal analysis, Writing—original draft. J.Z.: Conceptualization, Formal analysis, Writing—original draft. Y.L.: Conceptualization, Formal analysis, Writing—original draft. All authors have read and agreed to the published version of the manuscript.
Funding
This research report was financially supported by the Natural Science Foundation of China (51578163), Bagui Scholars Special Funding Project ([2019] No.79), Guangxi Science and Technology Base and Talent Special Project (Guike AD21075031), Projects Funded by the Central Government to Guide Local Scientific and Technological Development (Guike ZY21195010), Guangxi Key Research and Development Projects (Guike AB21195010), Innovation Project of Guangxi Graduate Education (YCBZ2021020).
Institutional Review Board Statement
Not applicable.
Informed Consent Statement
Not applicable.
Data Availability Statement
The data presented in this study are available on request from the corresponding author. The data are not publicly available due to requirements of the funder.
Acknowledgments
The authors are very grateful for the support of the above project funds.
Conflicts of Interest
The authors declare that they have no known competing financial interest or personal relationships that could have appeared to influence the work reported in this paper.
References
- Lv, J.; Wang, M.; Hu, X.; Cao, Z.; Ba, H. Experimental study on the durability and microstructure of marine concrete covered with barnacles. Constr. Build. Mater. 2022, 317, 125900. [Google Scholar] [CrossRef]
- Lv, J.; Cao, Z.; Hu, X. Effect of biological coating (Crassostrea gigas) on marine concrete: Enhanced durability and mechanisms. Constr. Build. Mater. 2021, 285, 122914. [Google Scholar] [CrossRef]
- Chalee, W.; Cheewaket, T.; Jaturapitakkul, C. Enhanced durability of concrete with palm oil fuel ash in a marine environment. J. Mater. Res. Technol. 2021, 13, 128–137. [Google Scholar] [CrossRef]
- Bastidas, D.M.; González, J.A.; Feliu, S.; Cobo, A.; Miranda, J.M. A Quantitative Study of Concrete-Embedded Steel Corrosion Using Potentiostatic Pulses. CORROSION 2007, 63, 1094–1100. [Google Scholar] [CrossRef]
- Fan, L.F.; Zhong, W.L.; Zhang, X.G. Chloride-induced corrosion of reinforcement in simulated pore solution of geopolymer. Constr. Build. Mater. 2021, 291, 123385. [Google Scholar] [CrossRef]
- Coronelli, D.; Hanjari, K.Z.; Lundgren, K. Severely Corroded RC with Cover Cracking. J. Struct. Eng. 2013, 139, 221–232. [Google Scholar] [CrossRef]
- Val, D.V.; Chernin, L. Serviceability Reliability of Reinforced Concrete Beams with Corroded Reinforcement. J. Struct. Eng. 2009, 135, 896–905. [Google Scholar] [CrossRef]
- Chen, H.; Jiang, Y.; Xiao, L.; Liu, J. Lifetime reliability analysis of concrete columns damaged by reinforcement corrosion. Front. Mater. 2022, 9, 926259. [Google Scholar] [CrossRef]
- Val, D.V. Deterioration of Strength of RC Beams due to Corrosion and Its Influence on Beam Reliability. J. Struct. Eng. 2007, 133, 1297–1306. [Google Scholar] [CrossRef]
- Higgins, C.; Farrow, W.C., III. Tests of reinforced concrete beams with corrosion-damaged stirrups. ACI Mater. J. 2006, 103, 133. [Google Scholar]
- Zheng, S.; Qi, L.; He, R.; Wu, J.; Wang, Z. Erosion damage and expansion evolution of interfacial transition zone in concrete under dry-wet cycles and sulfate erosion. Constr. Build. Mater. 2021, 307, 124954. [Google Scholar] [CrossRef]
- Baldermann, C.; Baldermann, A.; Furat, O.; Krüger, M.; Nachtnebel, M.; Schroettner, H.; Juhart, J.; Schmidt, V.; Tritthart, J. Mineralogical and microstructural response of hydrated cement blends to leaching. Constr. Build. Mater. 2019, 229, 116902. [Google Scholar] [CrossRef]
- Maes, M.; De Belie, N. Resistance of concrete and mortar against combined attack of chloride and sodium sulphate. Cem. Concr. Compos. 2014, 53, 59–72. [Google Scholar] [CrossRef]
- Guo, M.; Hu, B.; Xing, F.; Zhou, X.; Sun, M.; Sui, L.; Zhou, Y. Characterization of the mechanical properties of eco-friendly concrete made with untreated sea sand and seawater based on statistical analysis. Constr. Build. Mater. 2020, 234, 117339. [Google Scholar] [CrossRef]
- Liu, J.; An, R.; Jiang, Z.; Jin, H.; Zhu, J.; Liu, W.; Huang, Z.; Xing, F.; Liu, J.; Fan, X.; et al. Effects of w/b ratio, fly ash, limestone calcined clay, seawater and sea-sand on workability, mechanical properties, drying shrinkage behavior and micro-structural characteristics of concrete. Constr. Build. Mater. 2022, 321, 126333. [Google Scholar] [CrossRef]
- Xiao, J.; Qiang, C.; Nanni, A.; Zhang, K. Use of sea-sand and seawater in concrete construction: Current status and future opportunities. Constr. Build. Mater. 2017, 155, 1101–1111. [Google Scholar] [CrossRef]
- Li, H.; Li, B.; Jin, R.; Li, S.; Yu, J.-G. Effects of sustained loading and corrosion on the performance of reinforced concrete beams. Constr. Build. Mater. 2018, 169, 179–187. [Google Scholar] [CrossRef]
- Ma, Y.; Che, Y.; Gong, J. Behavior of corrosion damaged circular reinforced concrete columns under cyclic loading. Constr. Build. Mater. 2012, 29, 548–556. [Google Scholar] [CrossRef]
- Dang, V.H.; François, R. Influence of long-term corrosion in chloride environment on mechanical behaviour of RC beam. Eng. Struct. 2013, 48, 558–568. [Google Scholar] [CrossRef]
- Tapan, M.; Aboutaha, R.S. Effect of steel corrosion and loss of concrete cover on strength of deteriorated RC columns. Constr. Build. Mater. 2011, 25, 2596–2603. [Google Scholar] [CrossRef]
- Yalciner, H.; Kumbasaroglu, A. Experimental Evaluation and Modeling of Corroded Reinforced Concrete Columns. ACI Struct. J. 2020, 117, 61–76. [Google Scholar]
- Işık, E.; Harirchian, E.; Bilgin, H.; Kaya, B.; Karaşin, İ.B. The Effect of Insufficient Cover Thickness on Structural Performance of Reinforced Concrete Buildings. In Proceedings of the International Conference on Organization and Technology of Maintenance, Osijek, Croatia, 8 December 2021; Springer: Cham, Switzerland, 2021; pp. 262–277. [Google Scholar]
- Ansari, W.S.; Chang, J.; ur Rehman, Z.; Nawaz, U.; Junaid, M.F. A novel approach to improve carbonation resistance of Calcium Sulfoaluminate cement by assimilating fine cement-sand mix. Constr. Build. Mater. 2022, 317, 125598. [Google Scholar] [CrossRef]
- Dong, Z.; Wu, G.; Zhao, X.L.; Zhu, H.; Lian, J.L. Durability test on the flexural performance of seawater sea-sand concrete beams completely reinforced with FRP bars. Constr. Build. Mater. 2018, 192, 671–682. [Google Scholar] [CrossRef]
- Ahmad, I.; Qing, L.; Khan, S.; Cao, G.; Ijaz, N.; Mu, R. Experimental investigations on fracture parameters of random and aligned steel fiber reinforced cementitious composites. Constr. Build. Mater. 2021, 284, 122680. [Google Scholar] [CrossRef]
- Hariche, L.; Ballim, Y.; Bouhicha, M.; Kenai, S. Effects of reinforcement configuration and sustained load on the behaviour of reinforced concrete beams affected by reinforcing steel corrosion. Cem. Concr. Compos. 2012, 34, 1202–1209. [Google Scholar] [CrossRef]
- Chen, H.P.; Jiang, Y.; Markou, G. Structural performance deterioration of corroding reinforced concrete columns in marine environments. Ocean. Eng. 2022, 262, 112155. [Google Scholar] [CrossRef]
- Poupard, O.; L’Hostis, V.; Catinaud, S.; Petre-Lazar, I. Corrosion damage diagnosis of a reinforced concrete beam after 40 years natural exposure in marine environment. Cem. Concr. Res. 2006, 36, 504–520. [Google Scholar] [CrossRef]
- GB/T 14684-2011; Sand for Construction. China Standard Press: Beijing, China, 2011.
- GB/T 50081-2002; Method for Testing Mechanical Properties of Normal Concrete. China Standard Press: Beijing, China, 2002.
- Wang, C. Theory of Reinforced Concrete Structures; China Architecture & Building Press: Beijing, China, 1989. [Google Scholar]
- GB50010-2010; Code for Design of Concrete Structures. China Architecture & Building Press: Beijing, China, 2011.
- Chen, Z.; Li, S.; Zhou, J.; Xu, R.; Dai, S. Flexural behavior of GFRP bars reinforced seawater sea sand concrete beams exposed to marine environment: Experimental and numerical study. Constr. Build. Mater. 2022, 349, 128784. [Google Scholar]
- Gao, R.; Zhao, S.; Li, Q.; Chen, J. Experimental study of the deterioration mechanism of concrete under sulfate attack in wet-dry cycles. China Civ. Eng. J. 2010, 43, 48–54. [Google Scholar]
Publisher’s Note: MDPI stays neutral with regard to jurisdictional claims in published maps and institutional affiliations. |
© 2022 by the authors. Licensee MDPI, Basel, Switzerland. This article is an open access article distributed under the terms and conditions of the Creative Commons Attribution (CC BY) license (https://creativecommons.org/licenses/by/4.0/).