Article

Study on the Erosion Morphology of Cohesive Soil under the Vertical Impact of a High-Pressure Moving Water Jet

1
School of Resources and Environmental Engineering, Jiangxi University of Science and Technology, Ganzhou 341000, China
2
School of Civil and Surveying and Mapping Engineering, Jiangxi University of Science and Technology, Ganzhou 341000, China
*
Author to whom correspondence should be addressed.
Appl. Sci. 2022, 12(23), 12343; https://doi.org/10.3390/app122312343
Submission received: 28 October 2022 / Revised: 26 November 2022 / Accepted: 29 November 2022 / Published: 2 December 2022

Abstract

:
In the in situ leaching process of ionic rare earth ore, high-pressure moving water jet technology has been applied to improve floor leakage problems. However, it has been found that the morphology of the erosion surface formed by a moving water jet cannot be accurately predicted. The range of the erosion surface has an important influence on the stability of liquid collection engineering and the liquid collection rate of rare earth resources, which is an important basis for the design of liquid collection engineering. To study this, soil-breaking tests using high-pressure moving water jets for a Pingnan mine were conducted. The influences of jet pressure and nozzle moving speed on soil-breaking morphology were analysed. The mechanism of erosion surface formation was revealed by erosion theory, and a method of predicting the erosion surface geometry based on jet pressure and nozzle speed is proposed. The results show that, in the jet pressure range of 5~10 MPa, with increases in jet pressure and decreases in nozzle speed, the geometric shape of the erosion surface tends to expand, and these parameters have no effect on the morphological characteristics of the erosion surface. In the soil-breaking process, the erosion speed decreases with increases in jet distance. As the nozzle speed becomes greater, the degree of the attenuation of erosion speed at a given jet pressure also becomes greater. Soil-breaking depth has a quadratic relationship with jet pressure and a 0.5 power function relationship with nozzle speed. The geometry of the erosion surface has self-similarity and can be divided into straight and curved sections. Accordingly, an empirical formula of the erosion surface geometric shape is proposed. The error of predicting the soil-breaking depth is less than 11%, which can provide a reference for engineering applications.

1. Introduction

High-pressure moving water jets are widely used in metal processing [1,2,3], coal mining [4,5], foundation treatment [6], and waterway dredging [7,8]. In recent years, some scholars [9] have applied high-pressure water jet technology to the liquid collection process in the in situ leaching mining of ionic rare earth ore. In this process, a high-pressure moving water jet breaks soil on both sides of a horizontal diversion hole to form a ‘V’-shaped erosion trough. This increases the radiation range of the diversion hole to improve the efficiency of liquid collection. Therefore, it is very necessary to study the soil breaking morphology of high-pressure moving water jets.
At present, high-pressure water jet technology is often used to cut hard materials, such as metal, coal rock, and ceramics. Abrasive water jet technology came into being under low working pressure, and a certain amount of abrasive particles are added to a pure water jet to greatly improve the cutting ability of the water jet. The existing literature [1,2,3] mainly focuses on factors such as jet pressure, abrasive flow, abrasive particle size, orifice size, and nozzle feed rate in the process of abrasive water jet cutting depth, and it has made a series of research results. However, the floor soil of ionic rare earth mines is cohesive soil, which is obviously different from the physical and mechanical properties of hard materials such as metal and rock. At present, pure water jet technology is often used to cut soil in practical projects such as channel dredging [7,8]. Therefore, the existing mature abrasive water jet cutting theory cannot provide scientific and effective guidance for pure water jet soil-breaking technology.
In view of the above problems, some scholars have carried out targeted research on water jet soil-breaking mechanisms. Of the experimental studies, Rajaratnam and Beltaos [10] analysed the erosion of non-cohesive soil by fluids, proposed erosion parameters, and described the relationship between the parameters and the jet distance with an exponential function. Hogg et al. [11] proposed an empirical formula for the erosion pits made by a fixed jet in cohesionless soil. Mazurek et al. [12] studied the influence of a plane fixed jet on cohesive soil, finding that erosion depth is linearly related to the logarithm of the jet time. Hou et al. [13] carried out submerged water jet soil-breaking tests under different jet angles and distances and analysed the influence of the jet’s parameters on the depth of the erosion pit. Of the numerical simulation studies, Deng et al. [14] used the control volume method to calculate the scouring of underwater bedrock and to analyse the degree of bedrock scouring occurring at different jet velocities. Nguyen et al. [15] carried out a numerical study on the problem of the two-dimensional-plane fixed-jet scouring of sediment. An F-equation was constructed to describe the shear stress conversion between the flow phase and sediment phase, and a general governing equation for calculating the two phases at the same time was obtained. Gaël et al. [16] used Flow-3D software to simulate the three-dimensional fixed jet erosion process and found that the jet erosion angle has an important influence on the shape of the erosion pit. Kuang et al. [17] used computational fluid dynamics and discrete element methods to quantitatively analyse the influence of jet velocity and sediment characteristics on erosion pit morphology. These studies have greatly promoted the development of fixed jet soil breaking. However, in the application of water jet technology in ionic rare earth mines, most of the encountered problems are soil breaking by moving water jets, and more concern is given to the geometric shape of the erosion surface formed after soil breaking. In-depth research on this issue has not yet been conducted.
In recent years, some scholars have used erosion theory to analyse the process of water jets breaking clay [18,19,20]. Erosion theory is mainly used to evaluate soil erodibility, and its key parameters are the erodibility coefficient and critical shear stress of the soil. At present, the methods commonly used to test the key parameters of erosion include the flume test method, the rotating cylinder test method, the jet erosion test method, and the pipe hole erosion test method. The above test methods have their own advantages and disadvantages, which can be seen in [21,22,23]. In this paper, a principle of jet erosion test methods is used to further analyse the development law of the erosion surface in the process of jet soil breaking. The jet test method mainly uses the jet to scour the clay interface. In the experiment, the jet is perpendicular to the clay surface, and the erosion rate is obtained by testing the shape of the scour surface at different times. The shear force on the scour surface is used to predict the wall shear force distribution at different positions by the impinging jet theory. However, the current standard jet erosion test device [20,24,25] only obtains the key parameters of erosion by analysing the erosion of a fixed jet. For moving jets, the device cannot effectively analyse the soil breaking mechanism of the moving jet process, so it is urgent to design a moving jet device.
To solve the above problems, we designed a set of jet soil-breaking test systems that can control the jet pressure and nozzle movement speed. These were used to study the morphological characteristics of the soil and to predict the effect of soil breaking by high-pressure moving water jets. The failure geometry of cohesive soil under the impact of a high-pressure water jet is described, and the evolution of the erosion surface during the soil-breaking process is studied. Based on the tests, the geometric shape of the erosion surface is divided into straight and curved segments, and an empirical formula for the geometry is proposed. The results provide guidance for solving floor leakage problems in the mining of ionic rare earth ore.

2. Materials and Methods
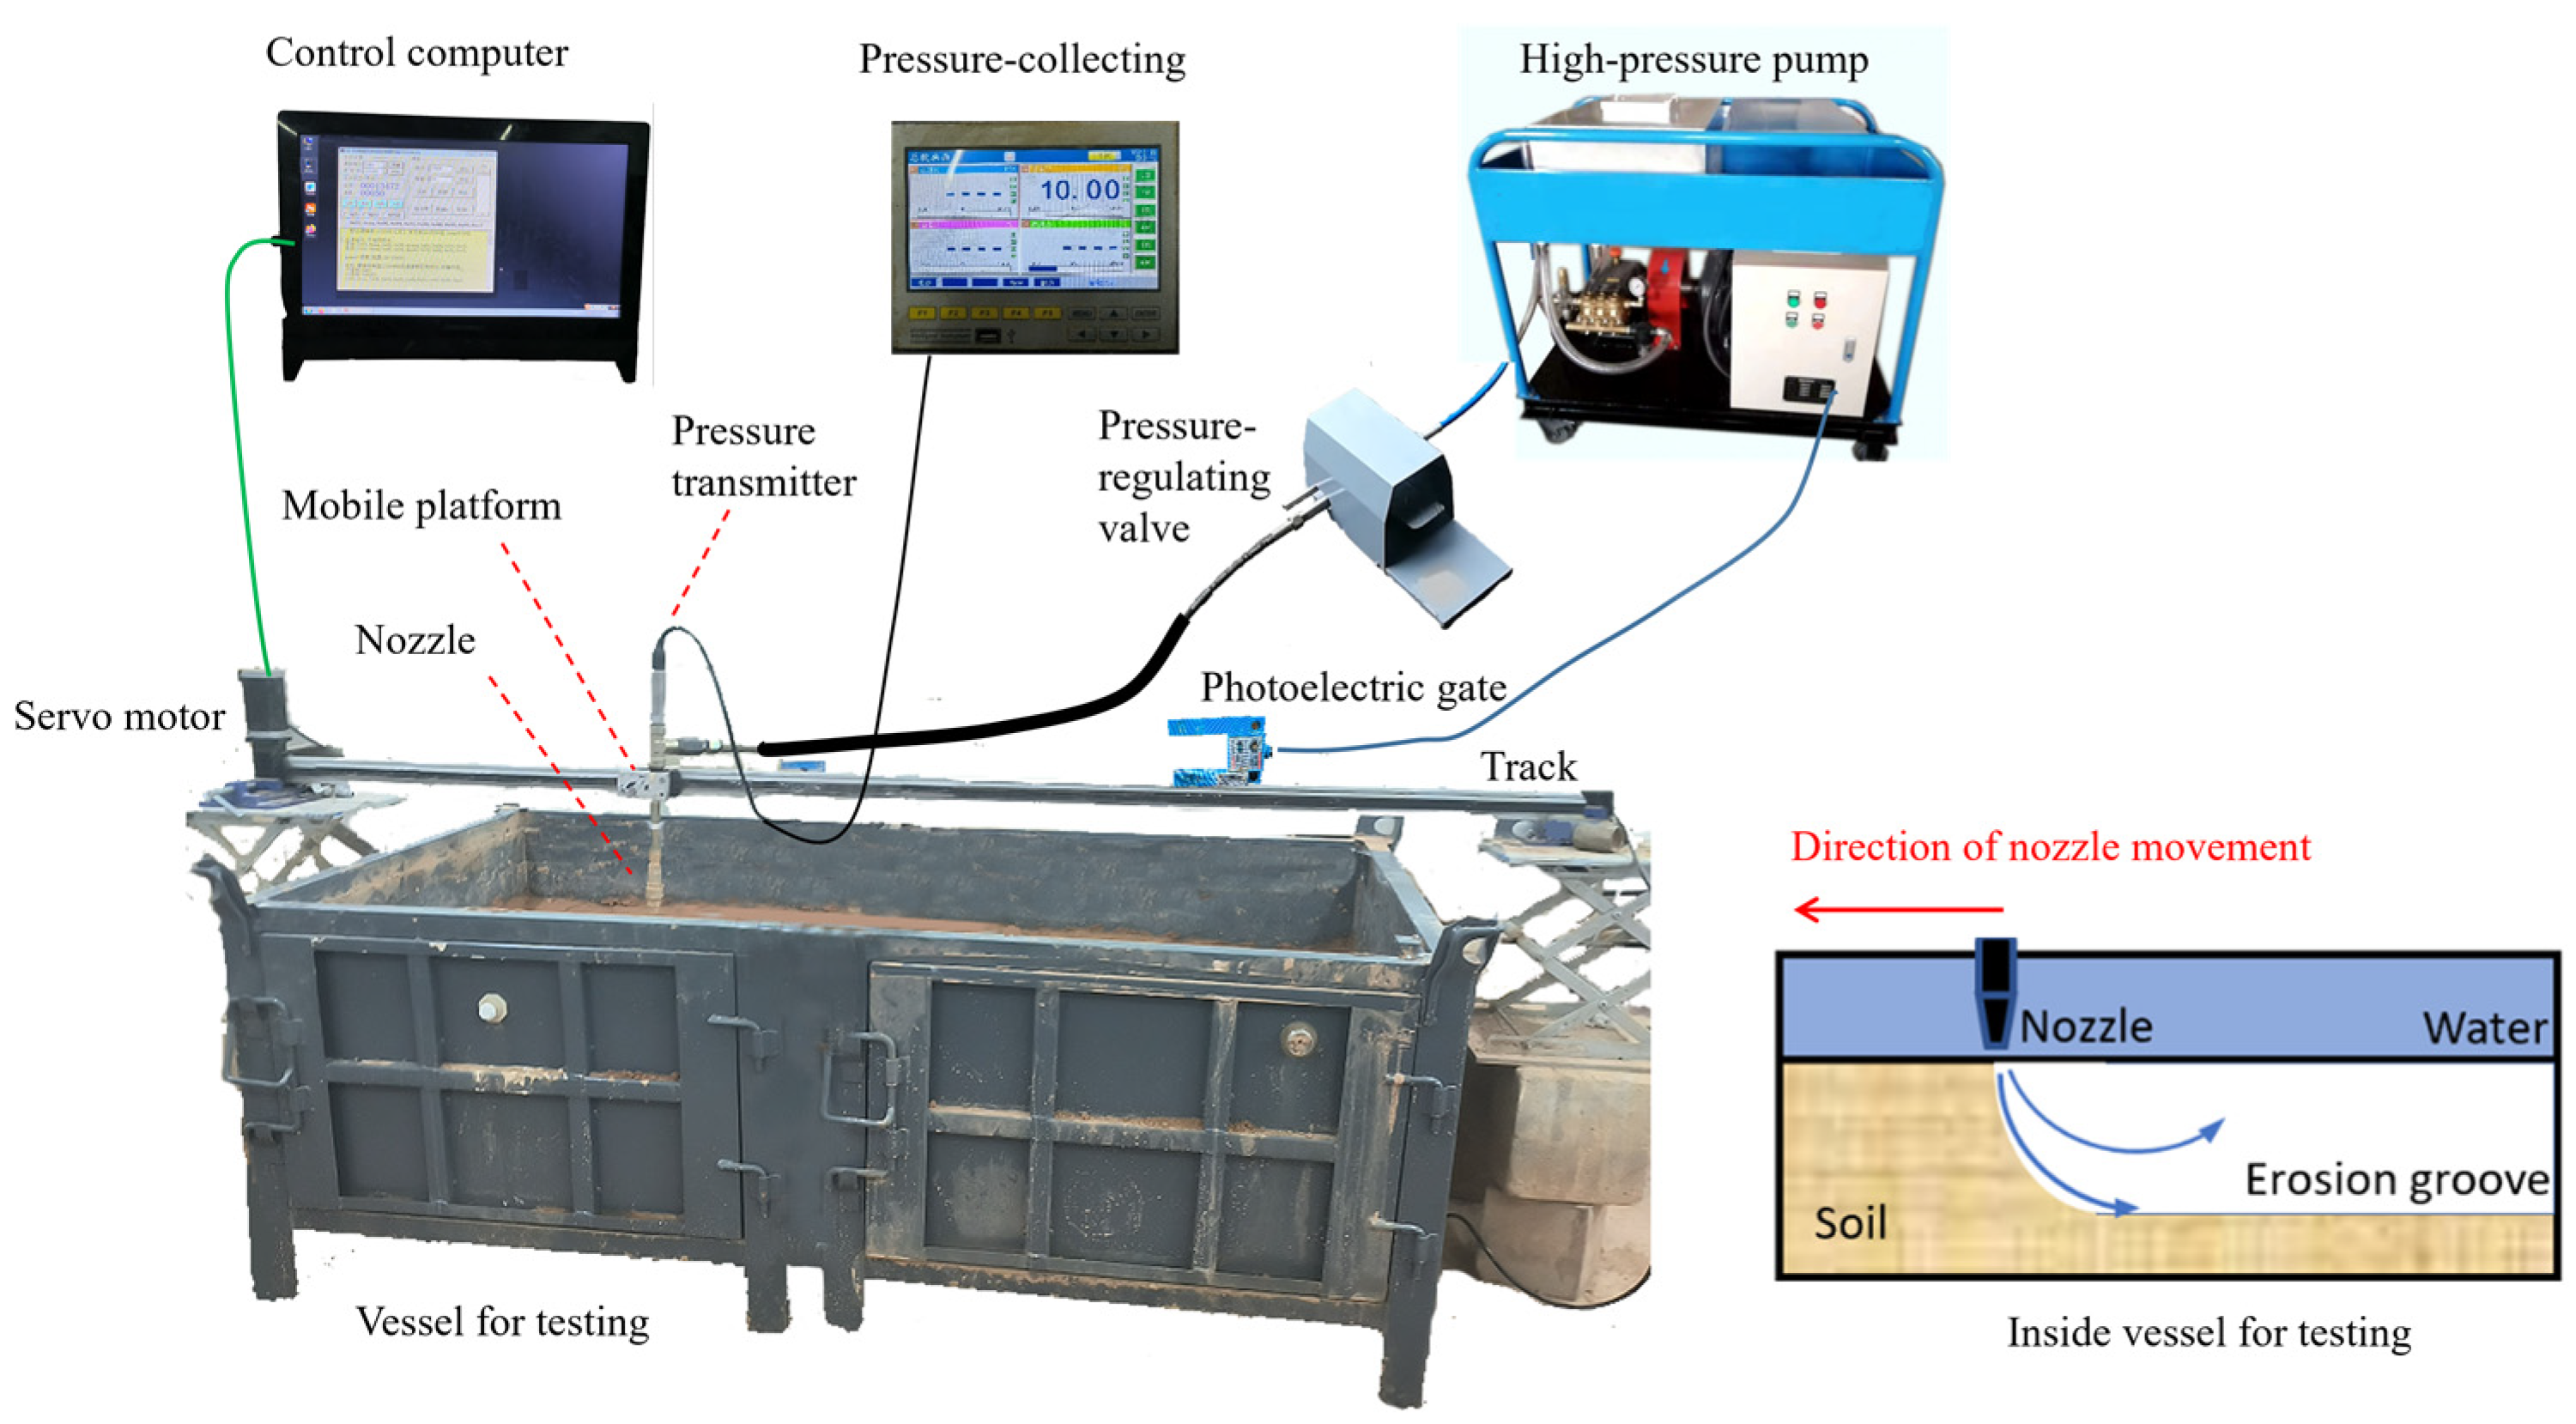
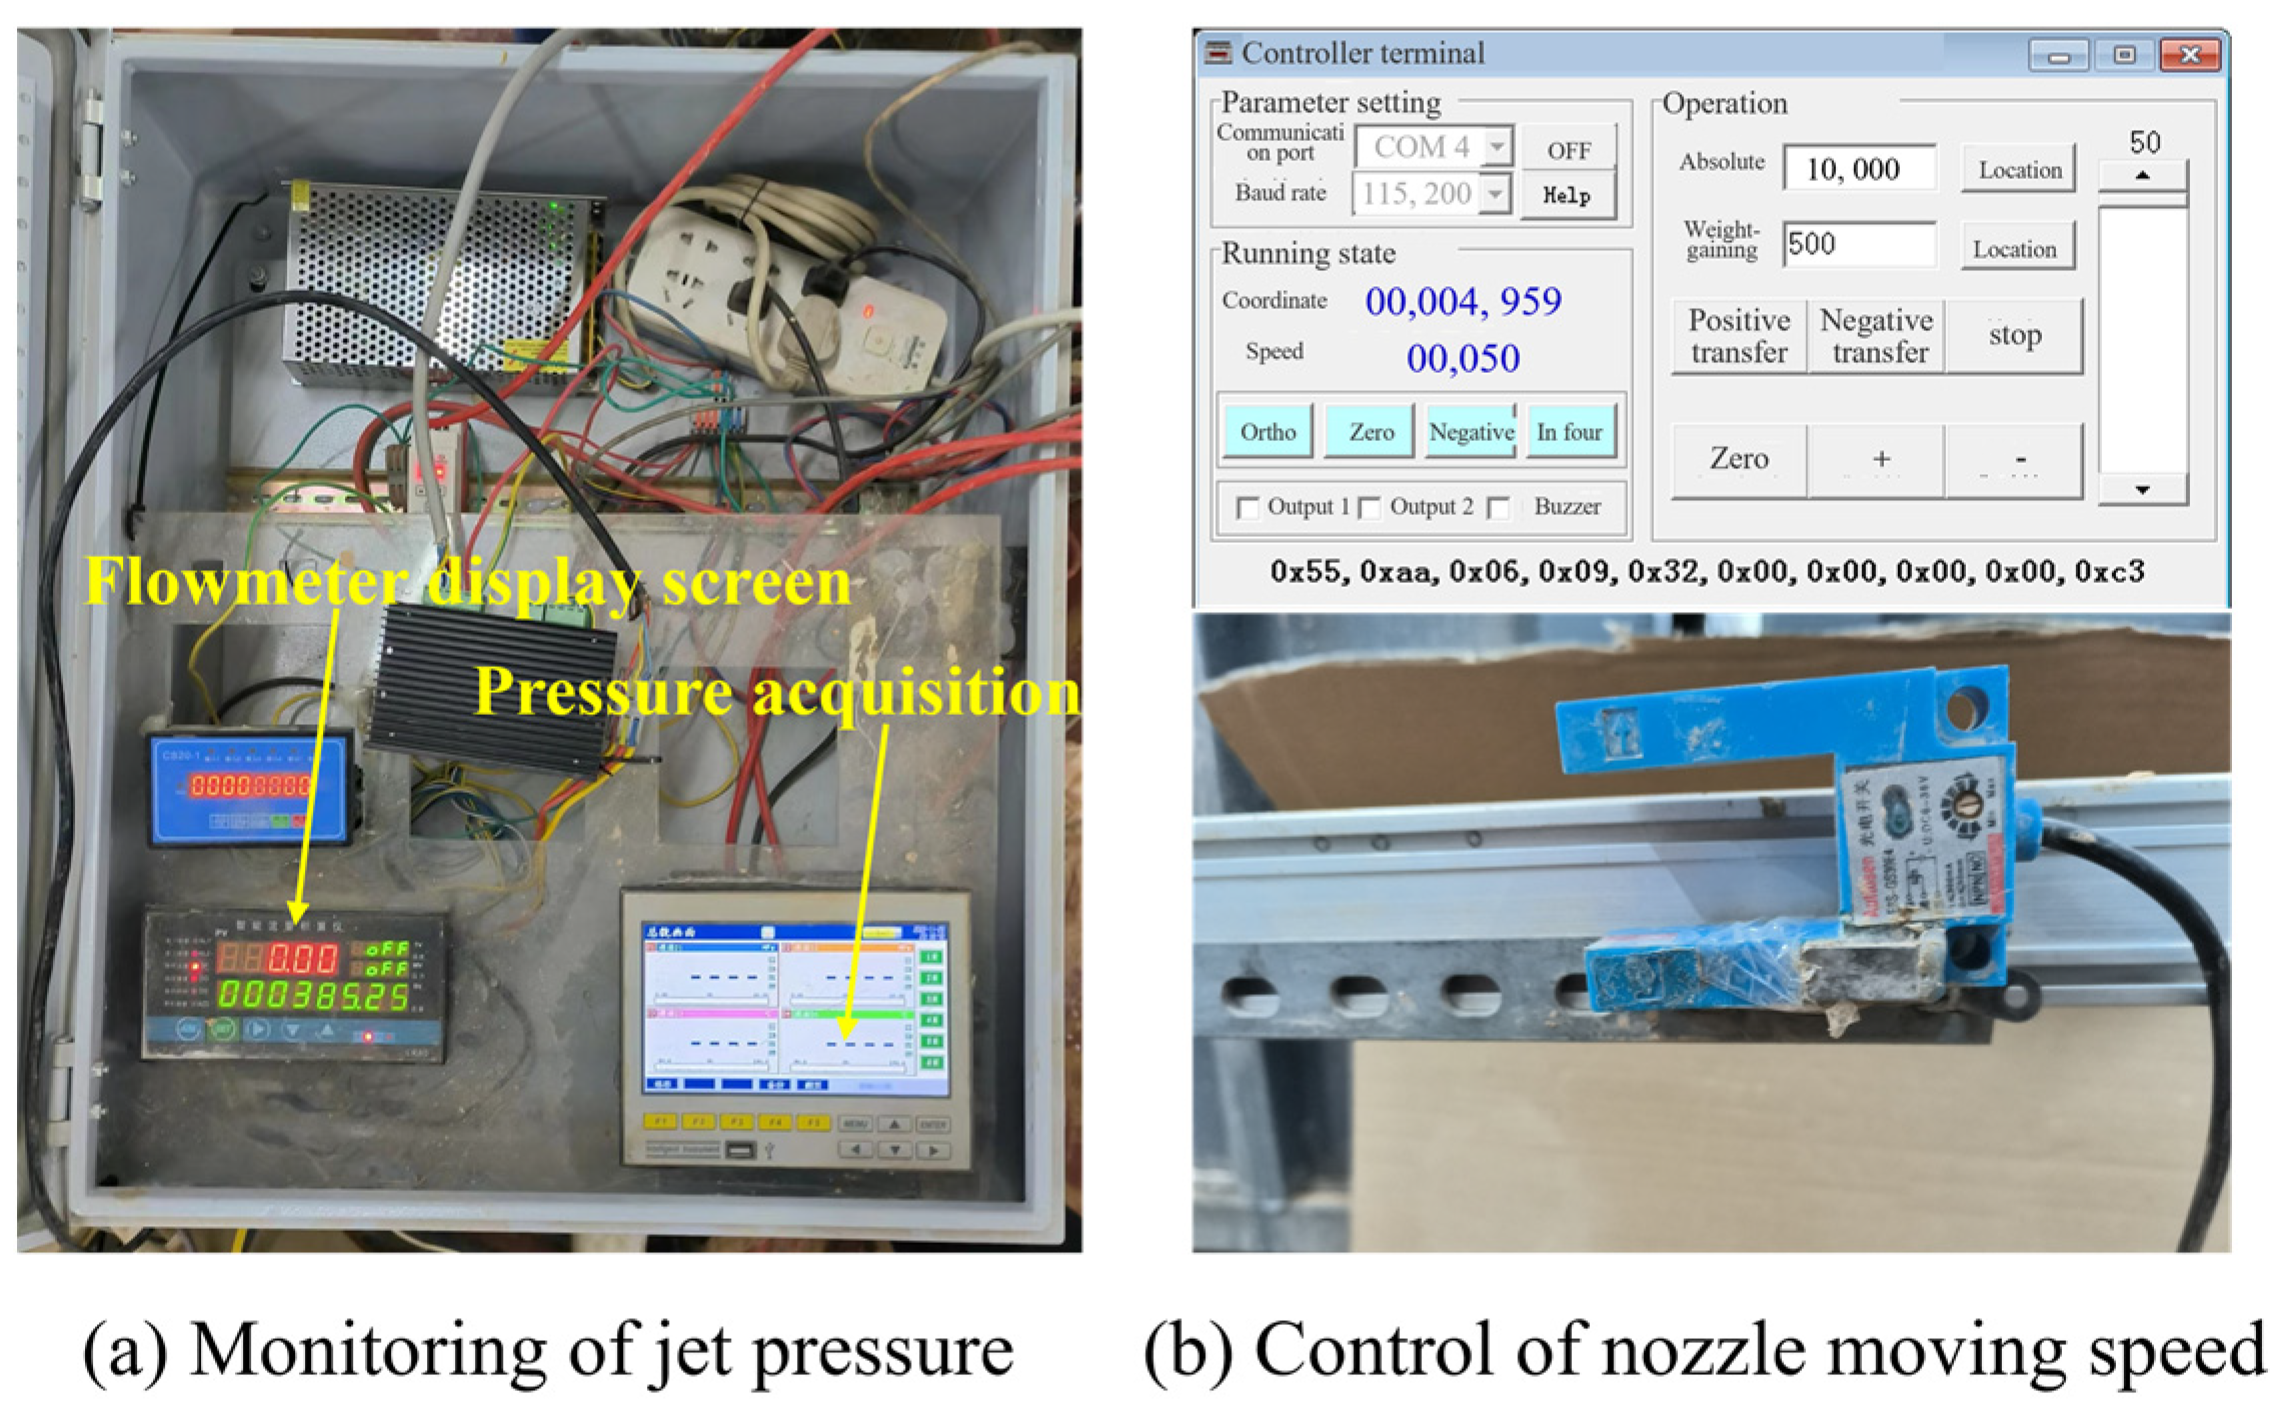
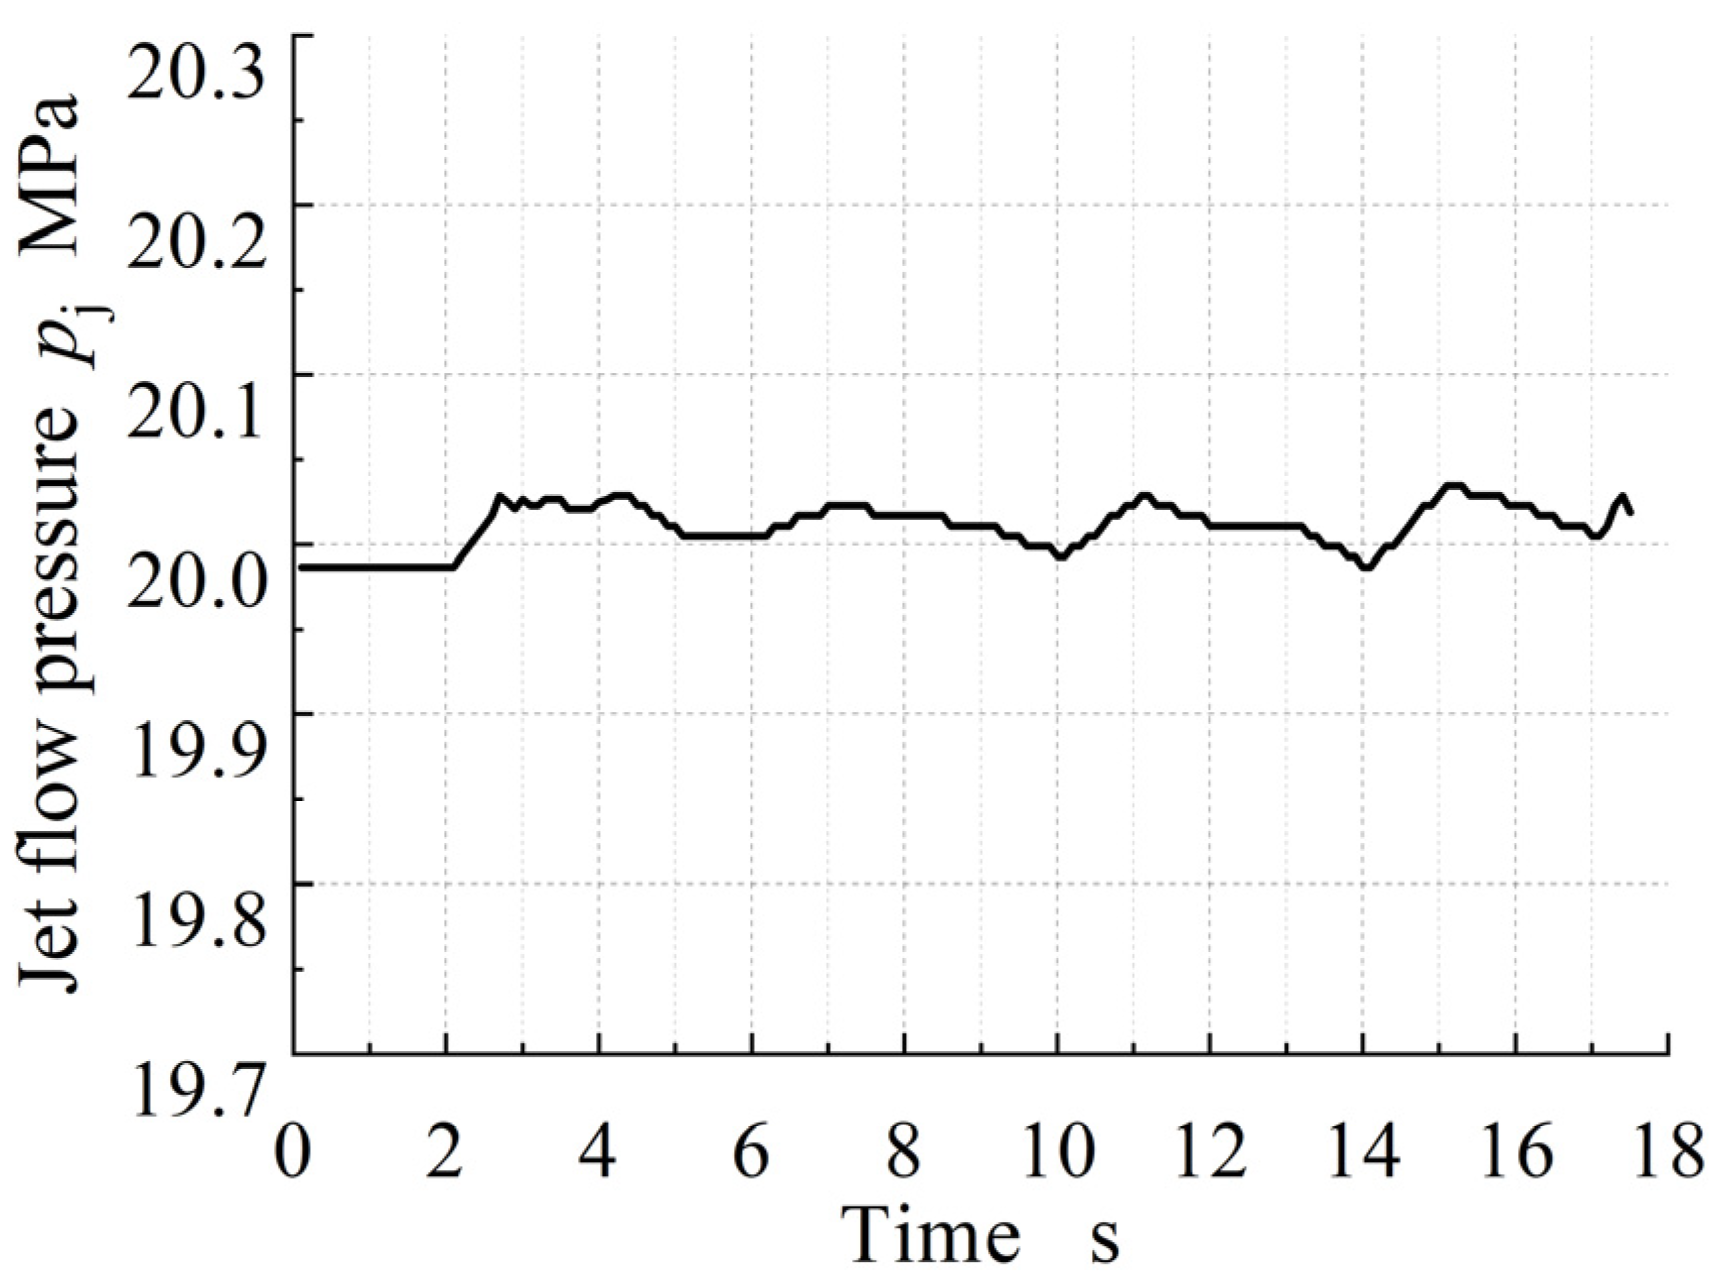
2.1. Test System

Previous studies [12,20,26] have indicated that the key parameters of a moving jet include the nozzle diameter, jet pressure, nozzle moving speed, and soil shear strength. The nozzle diameter and injection pressure are dynamic parameters, which have a significant impact on the power consumption, weight, and cost of the equipment. The moving speed of the nozzle is determined by the requirements of the grooving operation, and the shear strength of the soil depends on the local geological conditions. These four parameters are all important influences on the erosion notch. Considering the stability and cost of a diversion hole erosion notch, a jet scheme of high pressure and low moving speed is given priority. Therefore, combinations of different jet pressures and moving speeds were tested in this experiment to study their influences on the morphological characteristics of soil breaking.
Considering the uneven water content of natural mine soil, soil strength varies greatly with depth. In this experiment, the soil was made into large remoulded soil samples in a square box with the unified compaction method. The moving speed of the nozzle, i.e., the duration of action between the jet and the soil, needed to be accurately controlled for accurate jet module movements. Therefore, the water jet soil-breaking test system mainly comprised a test box, a jet pressure supply module, and a control module. A schematic diagram of the test system is shown in Figure 1.
(1)
Test box
The side lengths of the test box were 1500 mm, 1000 mm and 500 mm. The box was made of steel–plastic composite plates with a thickness of 80 mm connected by high-strength bolts. Therefore, the whole box had high deformation resistance and could be disassembled.
(2)
Jet pressure supply module
At present, there are two common ways for supplying jet pressure. One is performed by applying water head pressure to the pressure water storage tank with an air compressor and other equipment, and then by providing a stable jet pressure through a high-pressure pipe and a regulating valve [24,27]. The second is performed by pumping a certain pressure of water directly through a high-pressure pump [7,20]. Considering that the second way is often used to provide high-pressure water in practical engineering, the pressure supply device in this test uses a high-pressure pump.
The jet pressure supply module mainly included a high-pressure pump, a throttle-pressure-regulating valve, ahigh-pressure pipe, and a nozzle, as shown in Figure 2. The high-pressure pump was a plunger pump with a maximum output pressure of 50 MPa. The pump body was a TW5570 triplex high-pressure plunger pump produced by Italia COMET. The plunger was made of ceramic material. The motor had a rated power of 23 kW and a speed of 1450 r/min. The jet pressure in the test was adjusted by a throttle-pressure-regulating valve. The end of the high-pressure pipe was connected to a high-pressure nozzle and a pressure transmitter. The nozzle diameter was d = 1.37 mm. The structure size of the nozzle is shown in Figure 3.
(3)
Control module
The control module mainly controlled the jet pressure and nozzle moving speed during the tests, as shown in Figure 4. Monitoring of the jet pressure was achieved by a Firstrate glass micro-melt core pressure transmitter. The pressure transmitter of the core had high impact resistance and a short pressure response time. The output was a 4–20 mA electrical signal, which monitored jet pressures of 0–50 MPa. Control of the nozzle’s moving speed was realised by a servo motor controlling a moving platform on a track. There was a photoelectric door and a relay at the end position, which stopped the high-pressure pump when the end position was reached.
To test whether the high-pressure pump could provide a stable jet pressure, the pressure transmitter was set close to the front end of the nozzle where the jet pressure of the nozzle was measured. A jet pressure of 20.00 MPa was selected as the test jet pressure. During the test, the pressure regulator valve was adjusted to set the pressure to 20.00 MPa, and the pressure transmitter was used to record the pressure reading every 0.1 s within 17 s. The pressure transmitter measurement accuracy was 1‰. The monitored jet pressure is shown in Figure 5. The figure shows 170 recorded pressure values, with a maximum of 20.03 MPa, a minimum of 19.99 MPa, a variance of 0.00017, and an average relative error of 0.05%. It was verified that this high-pressure pump can provide a stable jet pressure.

2.2. Test Scheme

(1)
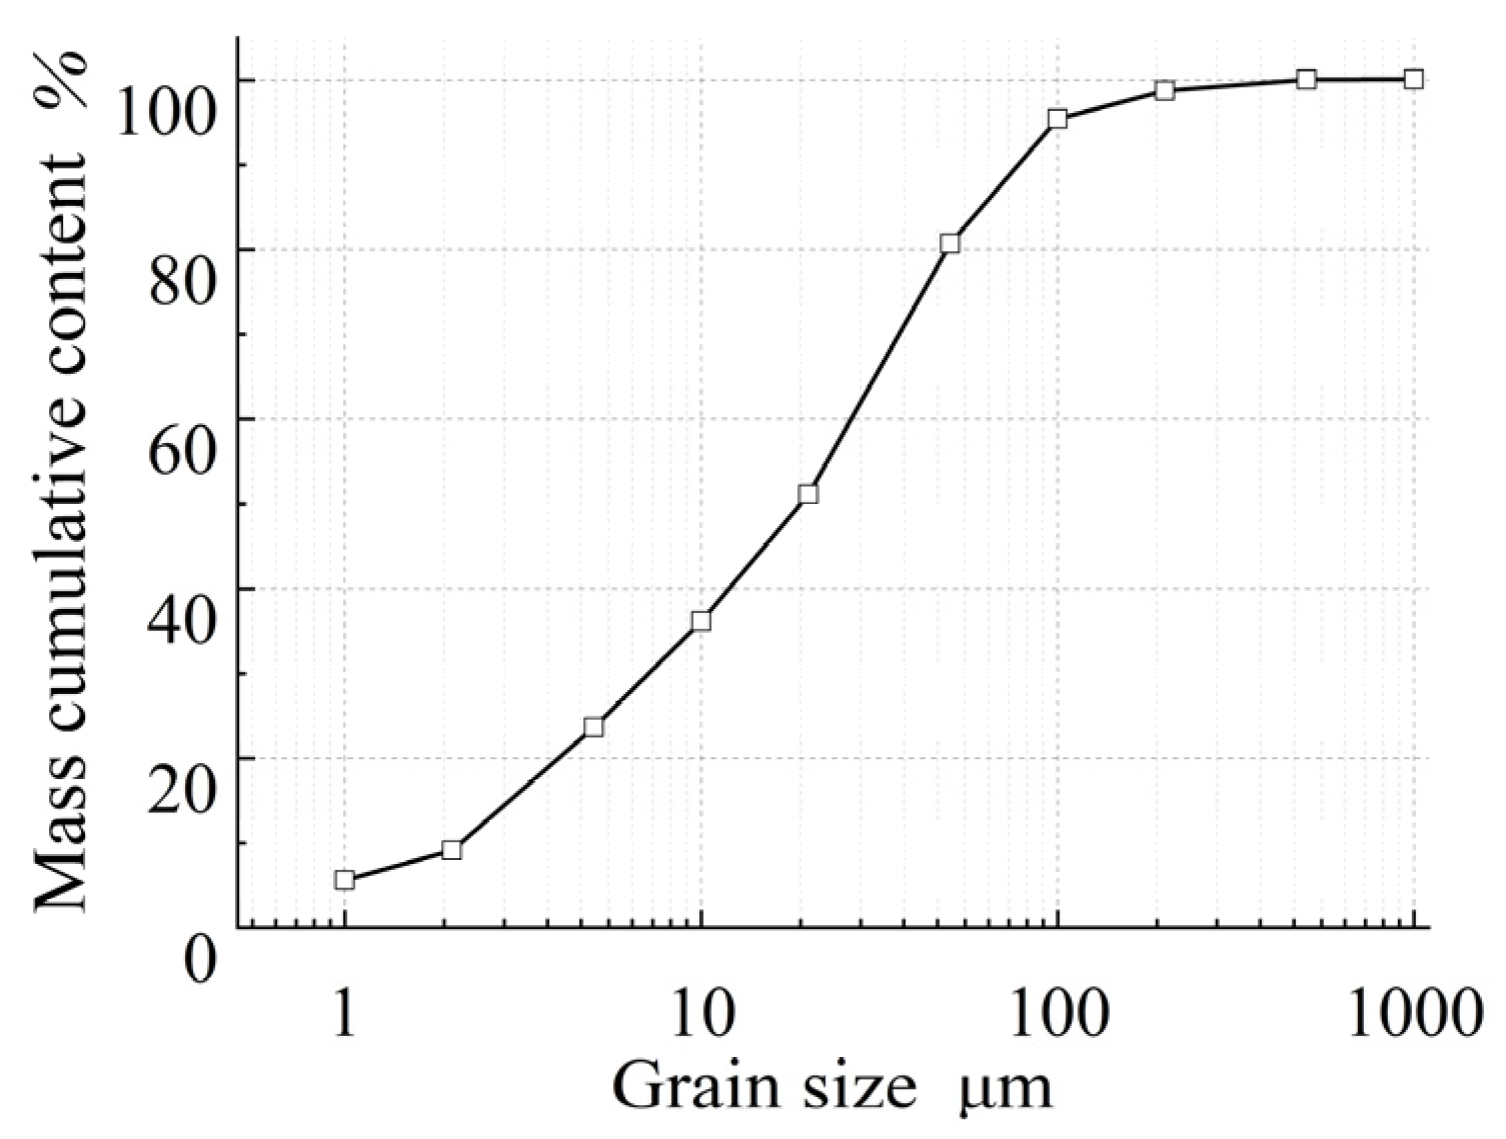
Selection of test soil samples
The selected mine is a leaching rare earth mine in Pingnan County, Fujian Province. It is located in the fully weathered layer. The weathering crust of the mine rock mass is thick, and the shell structure is well developed. The fluid collection project was located in the full regolith, from which the soil was sampled. The properties of the soil sample were as follows: the mineral composition was mainly plagioclase, quartz, potassium feldspar, and carbonated lava-like material. The plagioclase was grayish white, and the content was about 30~40%. The potassium feldspar was a light flesh red, with a content of about 20~30%. The quartz was grayish white, and the content was about 20~25%. The quartz chip had been broken locally. The acid lava-like material was mainly composed of fine-grained feldspar and quartz, the content of which was about 20~25%, and had been partially kaolinised.
Pingnan rare earth ore samples were selected for the test, which were taken after stripping the surface clay of the mine. The average void ratio of undisturbed soil samples was 0.90, the density was 1.73 g/cm3, and the average water content was 18% by mass, as obtained via the cutting ring method. The values of c and φ were measured with a GDS triaxial apparatus. The particle gradation of soil samples was measured with a screening method and a laser particle size analyser. The particle gradation curve is shown in Figure 6, and the particle composition distribution of Pingnan soil is shown in Table 1. According to the American Soil Texture Classification Standard [28], the soil texture of that in Pingnan is loam.
The test soil samples were compacted according to their original moisture content and void ratio. The shear strength of the soil sample surface was measured with a miniature vane shear apparatus. The permeability coefficient was measured with variable head column immersion tests. The physical parameters of the test soil samples are shown in Table 2.
Loose soil samples were mixed at a water content of 18% and were stirred evenly. They were added to the test container for layered compaction. The void ratio of the compacted soil sample was 0.9, and the thickness of each layer was 5 cm. Layers were added until the thickness was 40 cm. Then, the upper part of the containers was covered with film to maintain the humidity of the soil samples, which were left to stand for 2 days before testing.
(2)
Test conditions
The test used a moving nozzle to erode the remoulded soil samples, and the shape of the erosion groove was recorded. The area from the nozzle bottom to the groove bottom showed the erosion surface morphology, which was the focus of this study. The soil-breaking pressure commonly used in some projects is 5–20 MPa, so the jet pressure was controlled to 5–30 MPa with a moving speed range of 1–20 cm/s. During the test, it was found that, when the jet pressure exceeded 20 MPa, the high-speed water flow broke through the bottom of the soil box, so the shape of the erosion groove could not be completely recorded. Therefore, above a jet pressure of 20 MPa, only certain working conditions were used, so the complete shape of the erosion groove could be recorded. The test scheme is shown in Table 3.

2.3. Test Procedure

(1) The position of the track and moving platform was adjusted such that the nozzle height was 1 cm above the soil sample. Water was added to the test container to submerge the soil sample by 10 cm, and the water temperature was 20 °C.
(2) After starting the high-pressure pump, the pressure-regulating valve was used to control the jet pressure. When it stabilised to pj, the nozzle moved at a constant speed through the computer-controlled mobile platform.
(3) After moving at a constant speed for about 100 cm, the high-pressure pump and moving platform were stopped at the same time, and water on the upper part of the soil sample was discharged.
(4) Gypsum slurry was infused into the erosion groove with a grouting device. After the gypsum solidified, the sidewall of the test box was removed, and the solidified gypsum body in the erosion groove was carefully excavated. The size and shape of the solidified body were then photographed.

3. Results and Discussion

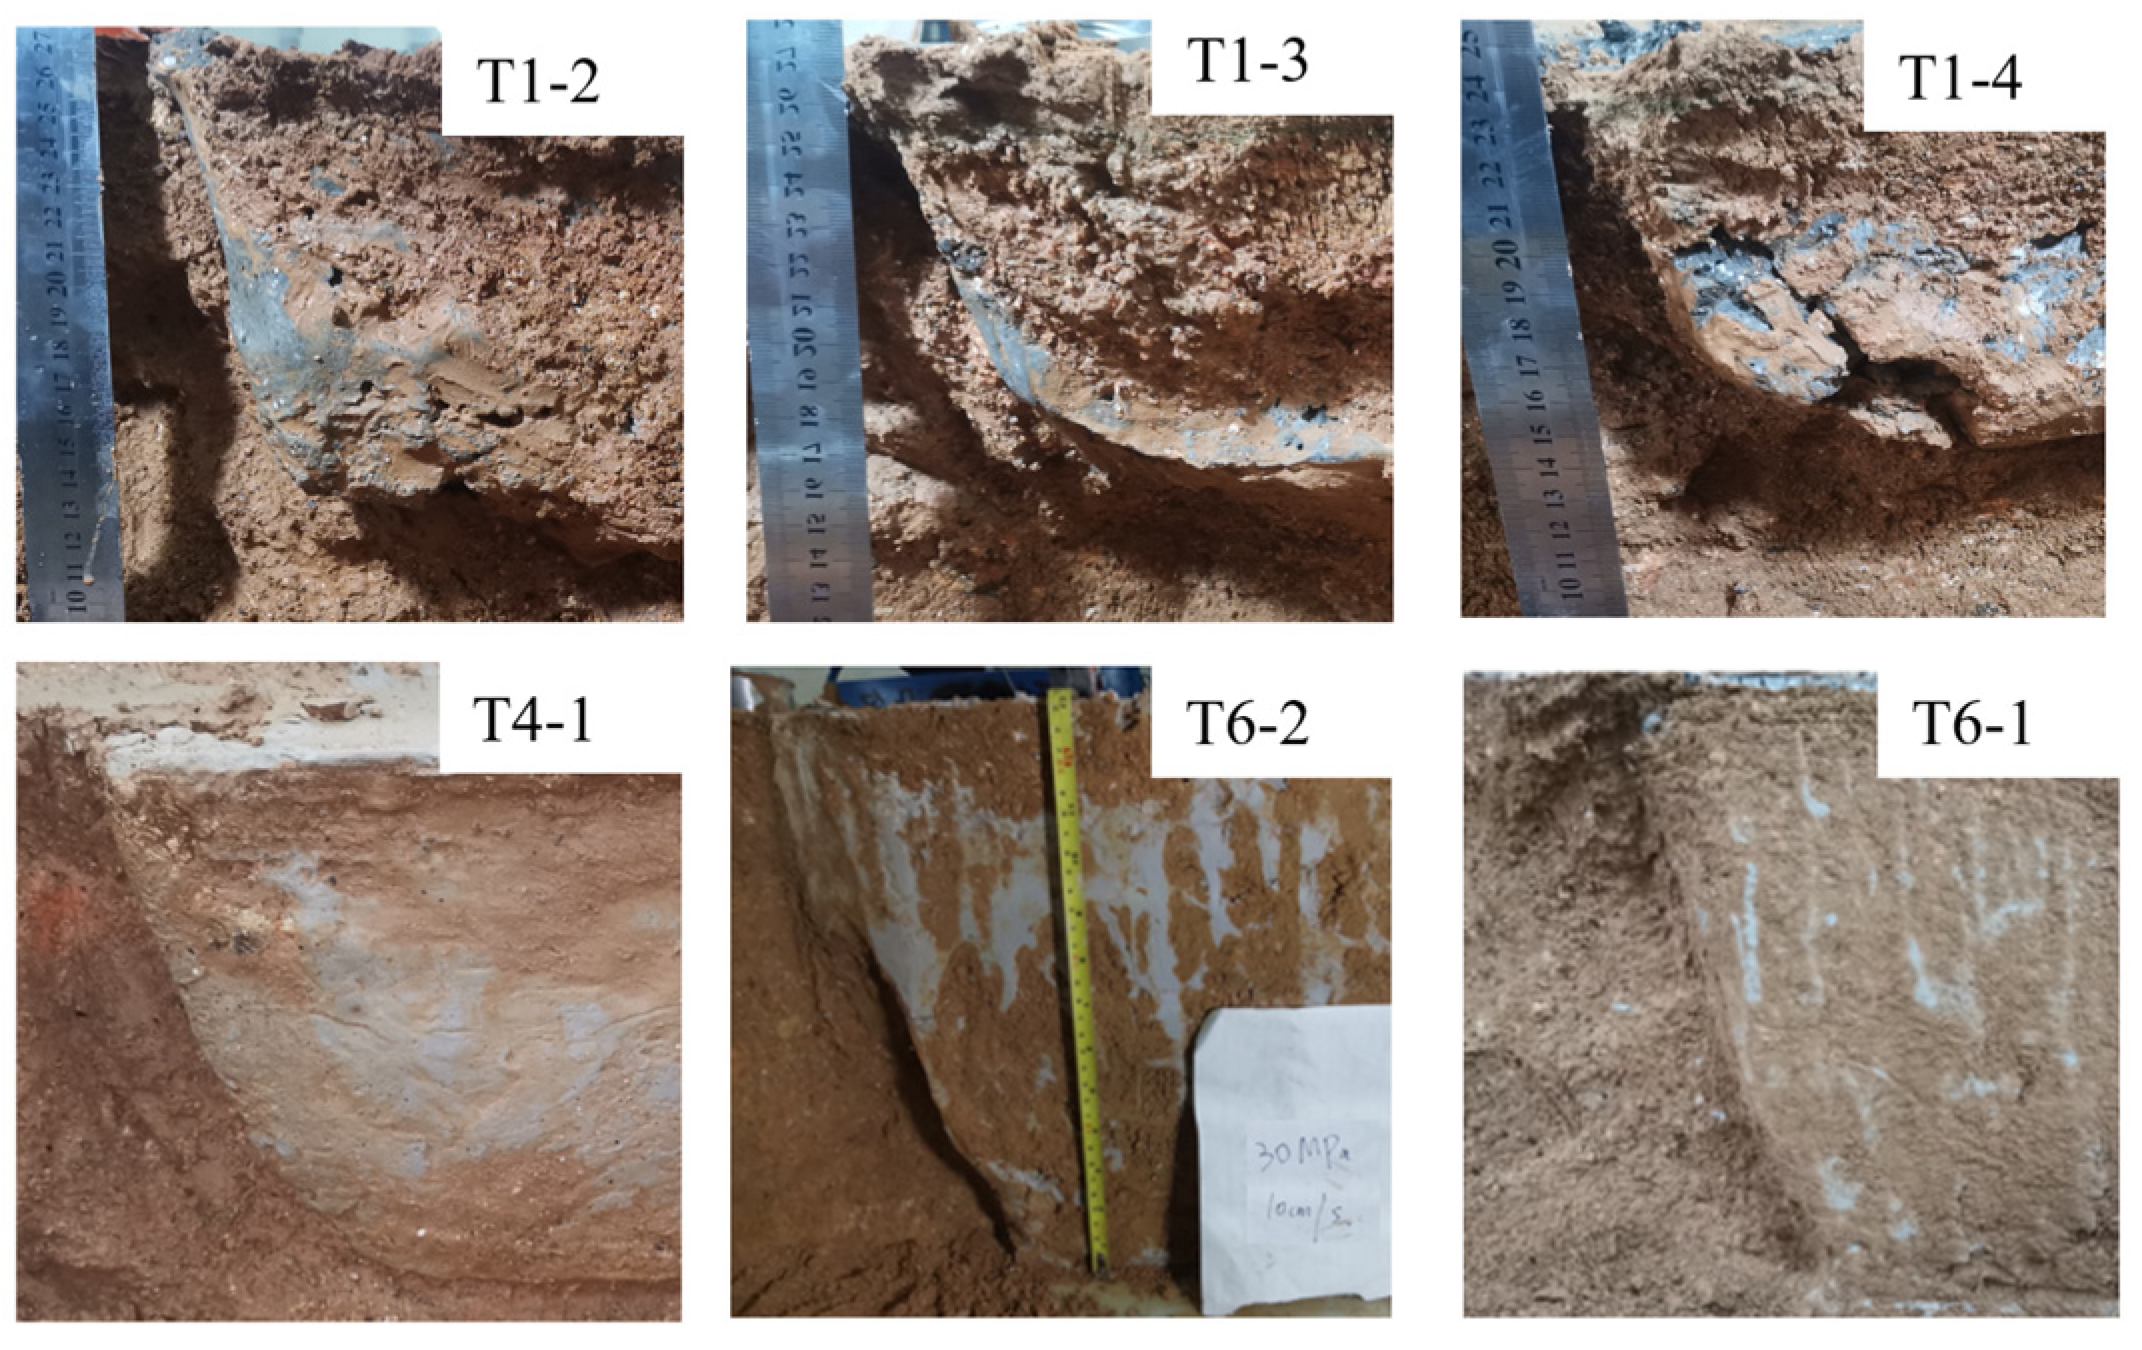
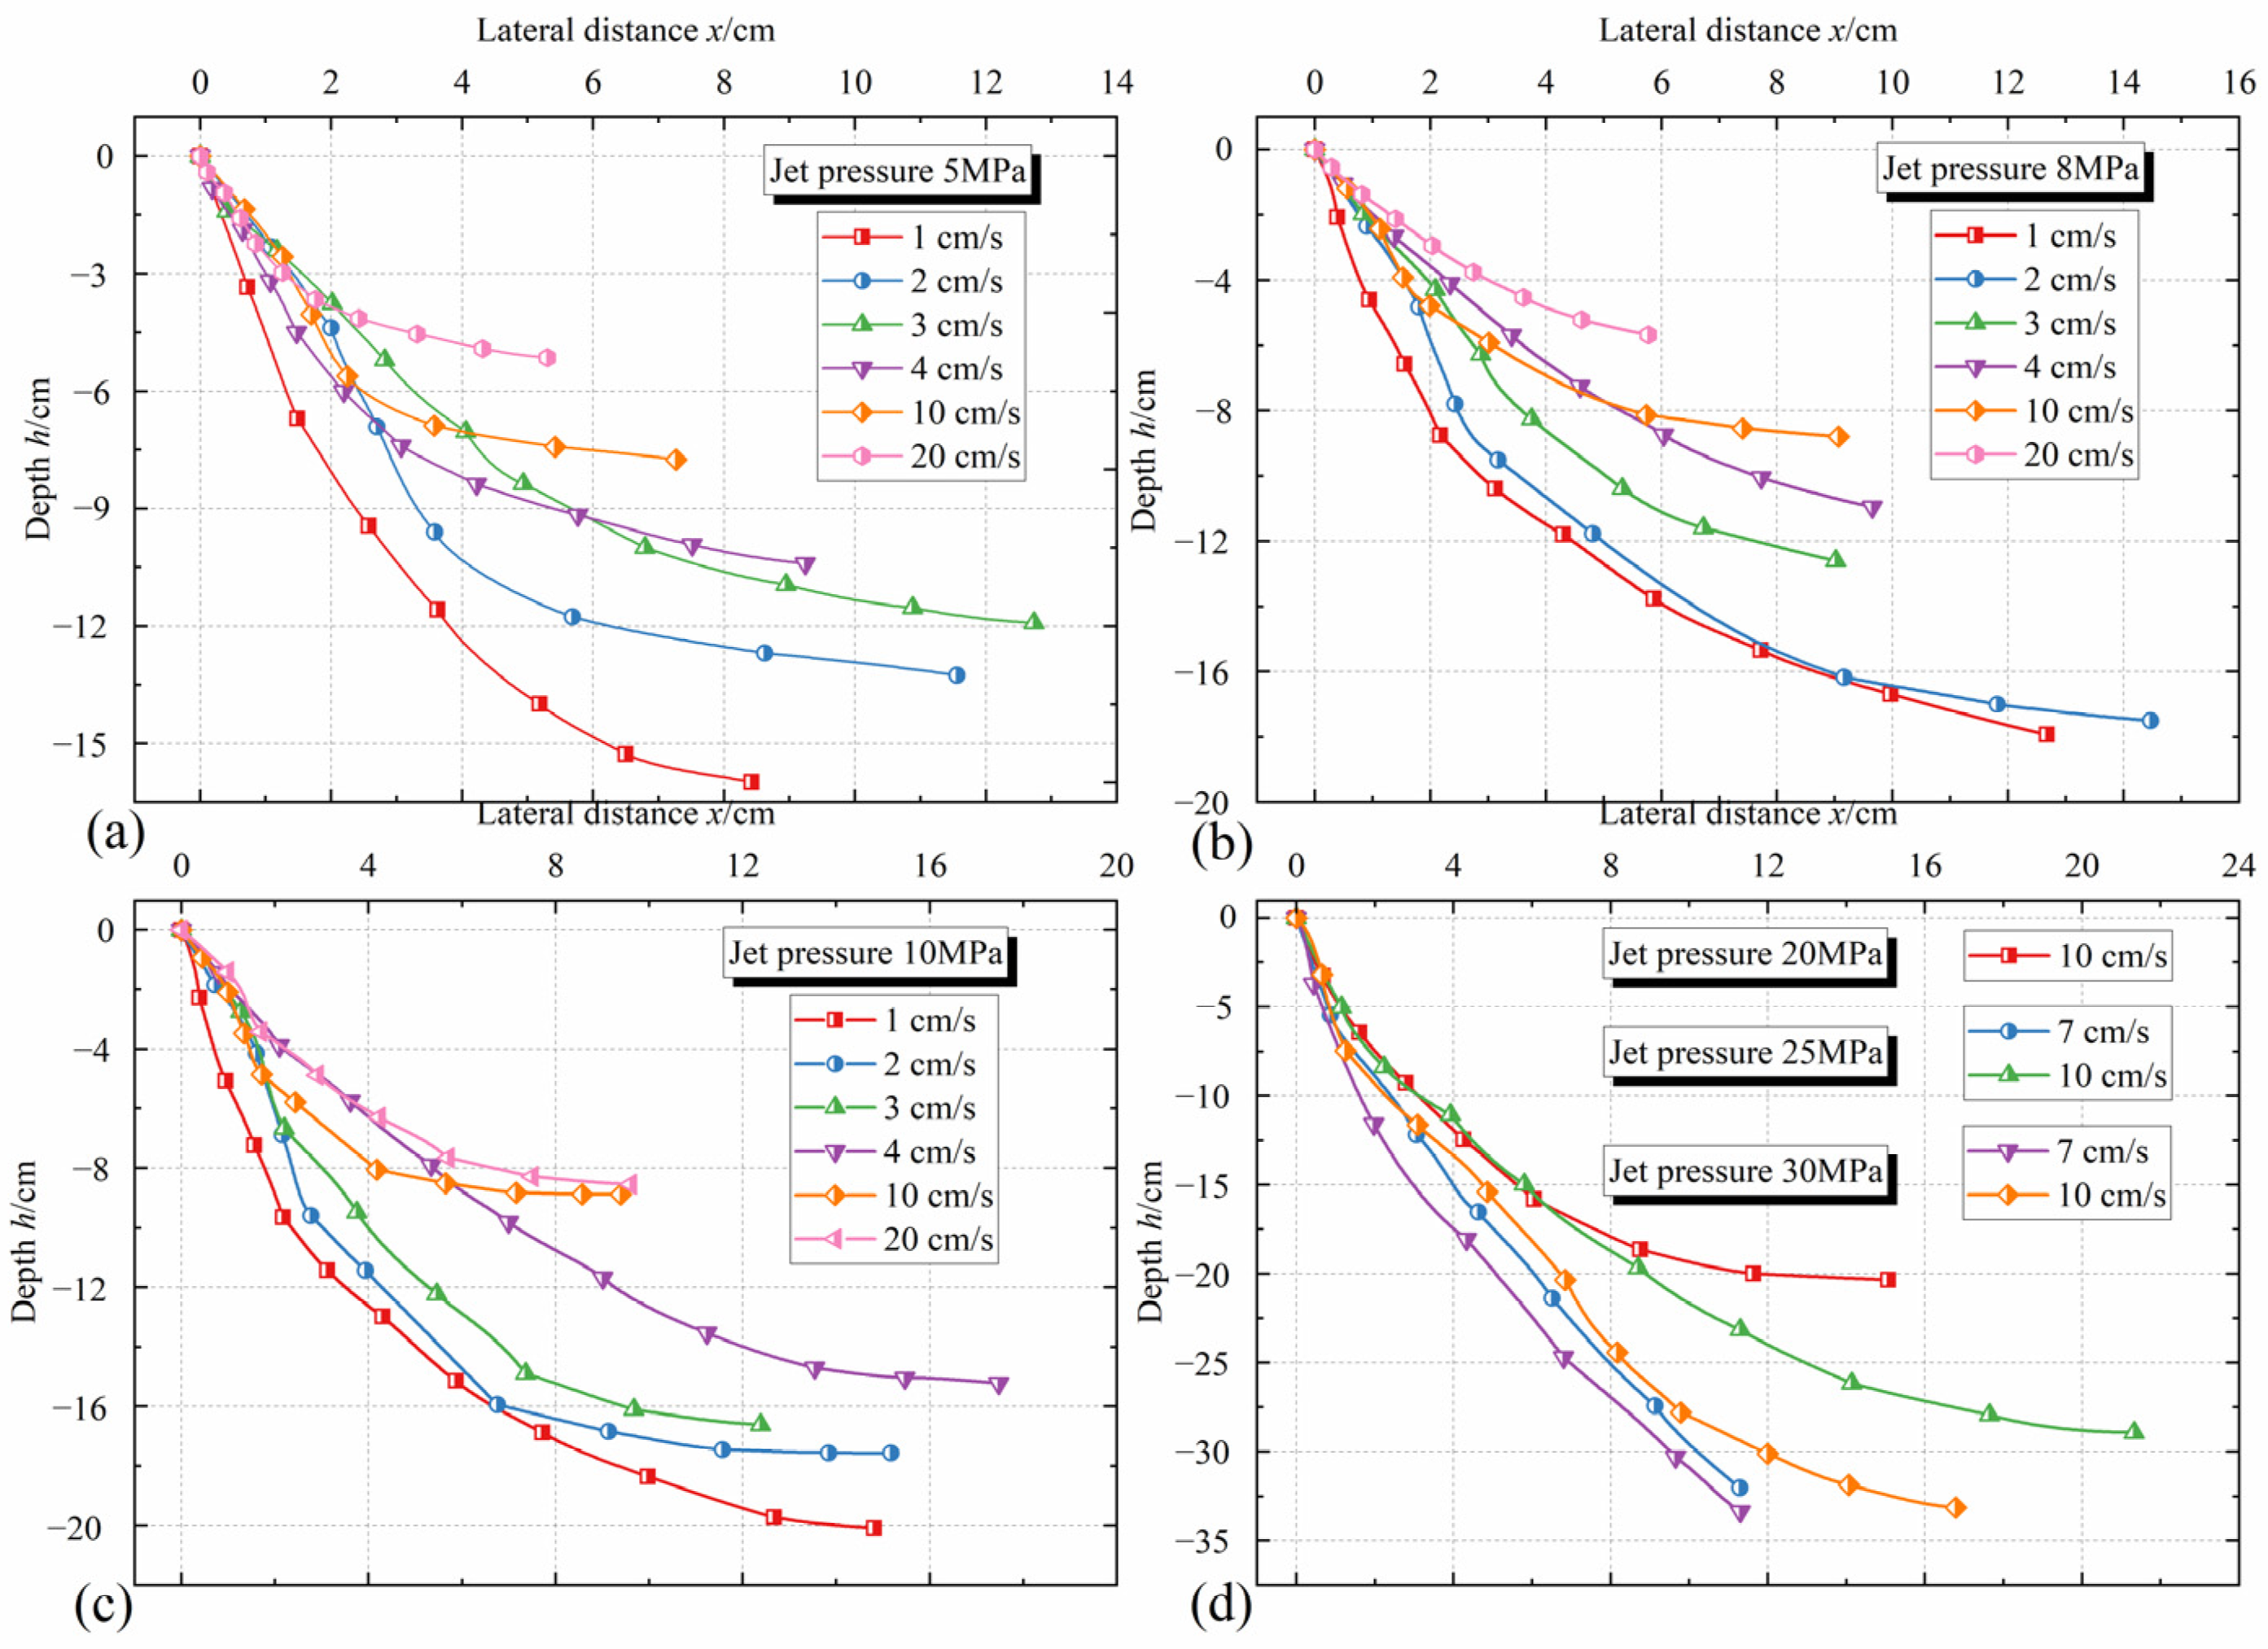
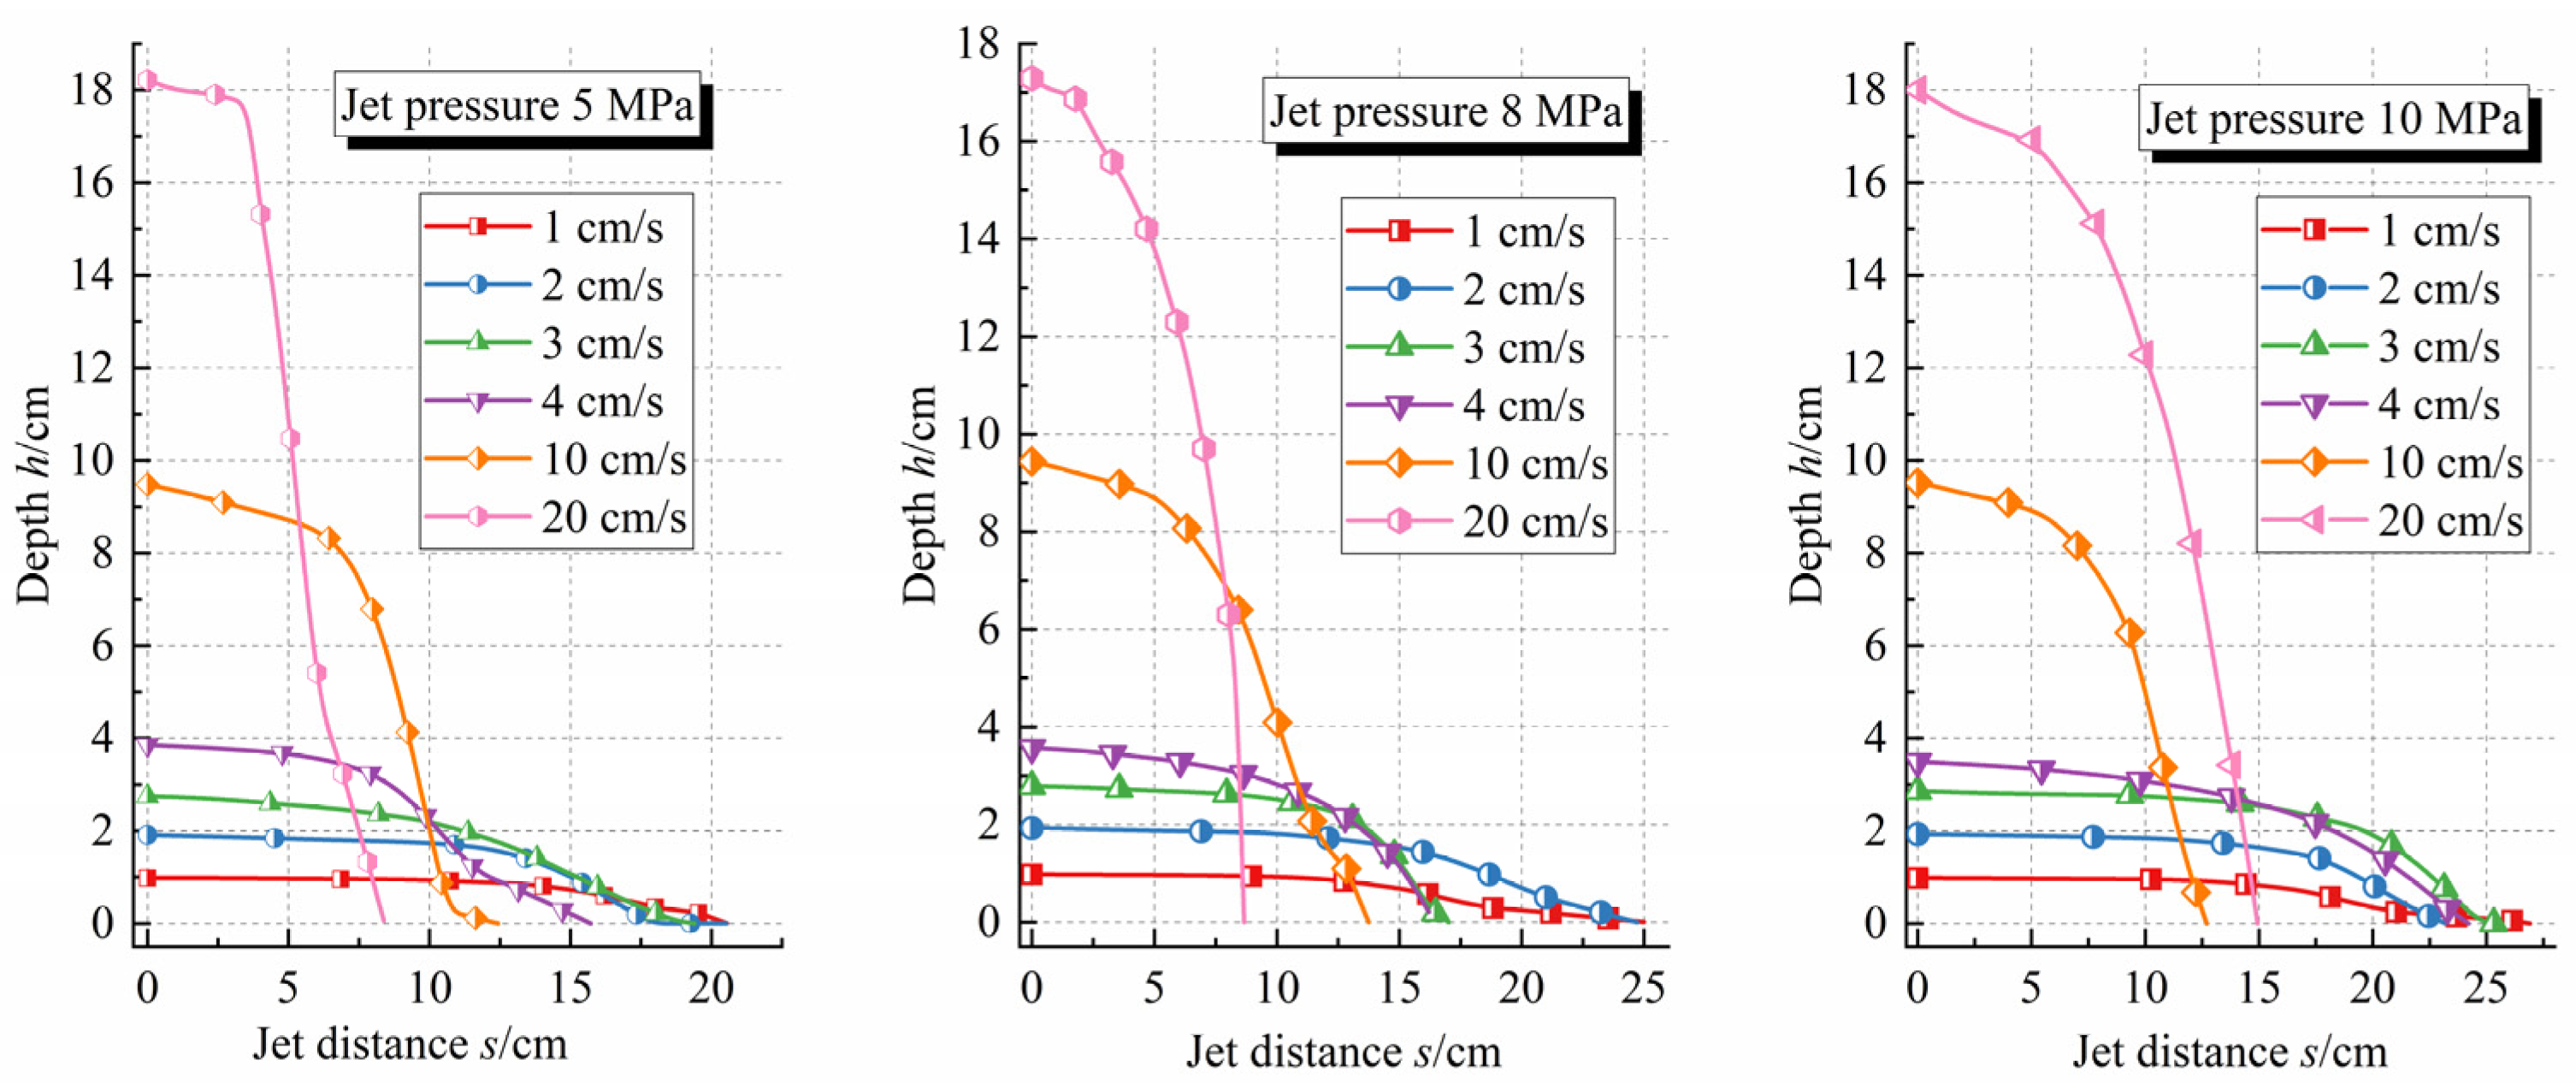
3.1. Morphological Characteristics of Erosion Surface

The moving jet soil-breaking tests were carried out at jet pressures of 5–30 MPa and nozzle speeds of 1–10 cm/s. Some of the erosion groove photographs are shown in Figure 7.
The arc erosion surface of the solidified gypsum body is depicted in Figure 8, where the x-axis represents lateral distance, and the negative h-axis represents depth. With increases in jet pressure and decreases in nozzle speed, the geometric shape of the erosion surface tended to expand; however, changes in jet pressure and nozzle speed had almost no effect on the shape of the erosion surface. The soil-breaking depth near the nozzle was approximately linear with lateral distance, and the growth rate of the soil breaking depth away from the nozzle gradually slowed down to zero with increases in lateral distance. At a given jet pressure, the soil-breaking depth increased greatly with decreases in nozzle speed. For example, at a jet pressure of 5 MPa, the maximum soil-breaking depth was only 5.5 cm at a nozzle speed of 20 cm/s, but it reached 16.5 cm at 1 cm/s. At a given nozzle moving speed, with increases in jet pressure, the soil-breaking depth generally increased, but the growth rate was small at low pressures (5–10 MPa) and large at high pressures (10–30 MPa). In practical engineering, increasing the jet pressure and reducing the nozzle speed can increase the range of soil breaking. However, a small increase in jet pressure has little effect, whereas a large increase requires different pumping equipment. Moreover, reducing the nozzle speed reduces the soil-breaking efficiency. Therefore, considering the influences of jet pressure, nozzle speed, mining safety, and cost, the optimal parameters of jet pressure and nozzle speed need to be determined. For this, it is necessary to predict the erosion surface geometry under different jet pressures and nozzle speeds.

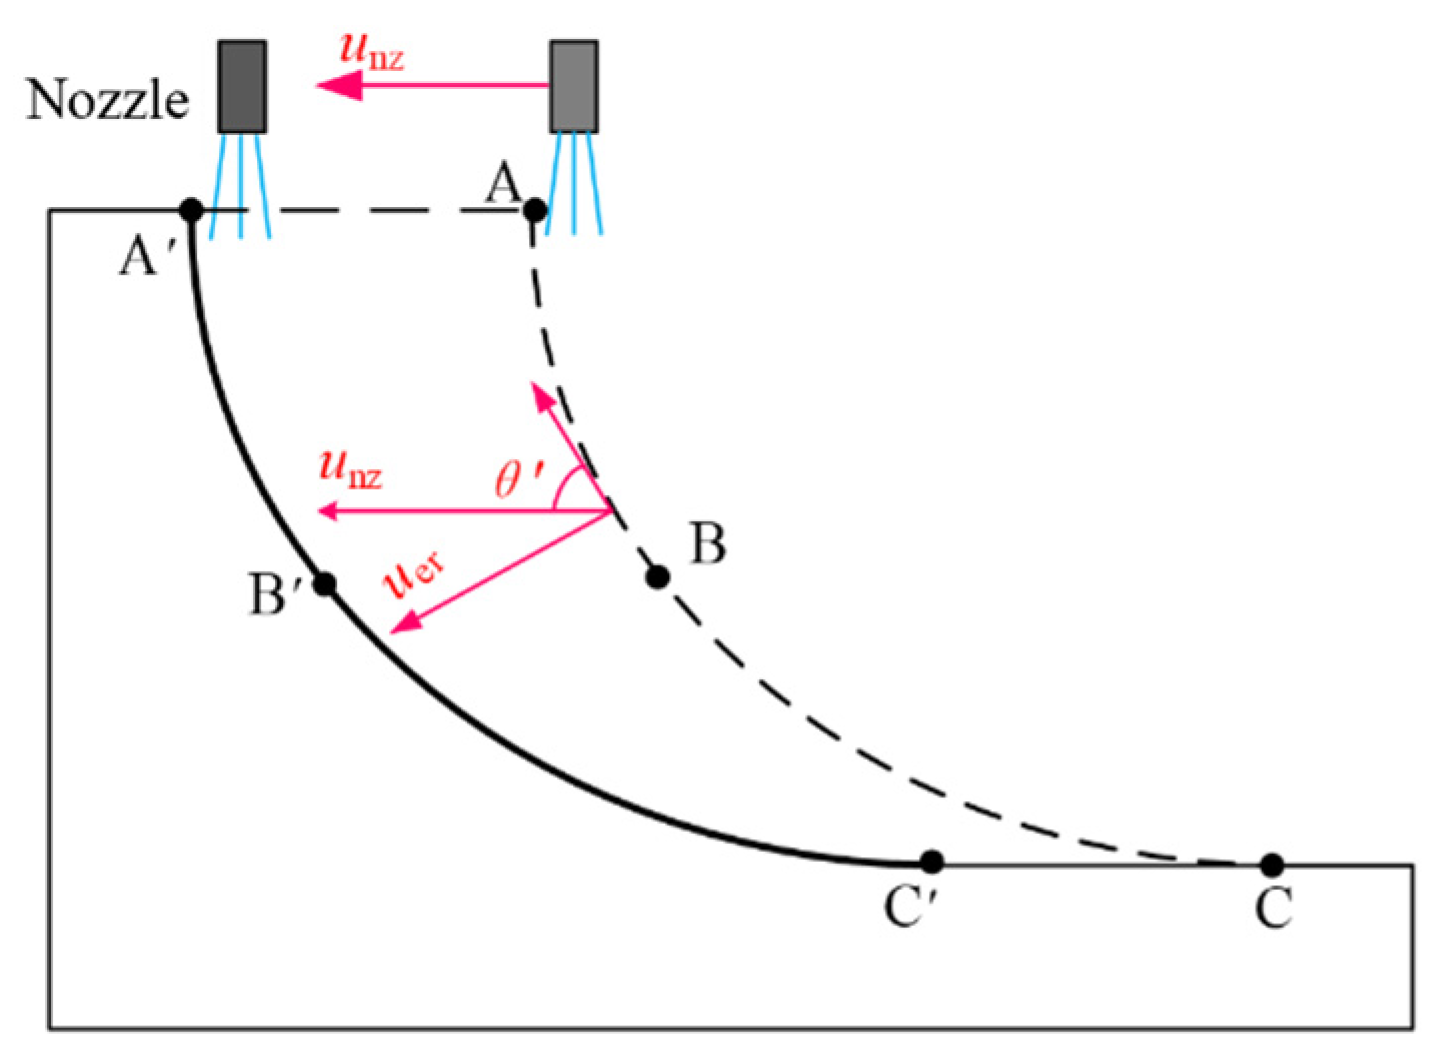
3.2. Mechanism of Surface Erosion

The influences of jet pressure and nozzle speed on the geometric shape of the erosion surface were analysed. However, the mechanism of erosion surface formation remains unknown. At present, some scholars [24,29,30] have used erosion theory to analyse erosion by vertical jets. This paper also refers to erosion theory to analyse the mechanism of erosion surface evolution during soil breaking with a moving water jet.
Erosion theory holds that the soil at the water–soil interface is mainly damaged by shear force. In the process of soil stripping, the expansion rate of the erosion surface corresponds to erosion speed, which is perpendicular to the shear force. Erosion can be divided into interfacial erosion and infiltration erosion according to its location. The erosion surface in this experiment moved rapidly with the nozzle, so the erosion was attributed to interfacial erosion without considering the infiltration effect within a short time. The erosion effect caused by shear stress on soil is far greater than that caused by compressive stress and is the main damaging factor. Soil particles at the interface are mainly stripped by the action of shear stress, which is tangential to the erosion surface. The erosion speed is the rate at which the erosion area expands to the non-erosion area in a direction perpendicular to the erosion surface. Therefore, the erosion speed and shear stress direction can be judged according to the shape of the surface.
The erosion surface formed by the moving water jet is shown in Figure 9. In the figure, point A is right below the nozzle, the ABC curve delineates the erosion surface shape, and the water jet flows along the erosion surface. Within a certain time Δt, the nozzle moves from point A to A′, and the erosion surface also extends from ABC to A′B′C′. The displacement of the nozzle is AA′ and AA′ = BB′ = CC′. The tangential slope angle at any point on the erosion surface ABC is θ′, and the erosion surface moves at a speed of unz as the nozzle moves forward. The erosion speed uer is a component of the normal direction of unz on the erosion surface.
uer = unz·sinθ
In the formula, unz is the nozzle moving speed, and θ′ is the tangential slope angle of the erosion surface.
According to the shape of the test erosion surface and Equation (1), erosion speed at jet pressures of 5–10 MPa is as shown in Figure 10. In the process of breaking soil with a water jet, erosion speed does not exceed the nozzle moving speed and decreases with increases in jet distance. At a given nozzle speed, erosion speed attenuation curves at different jet pressures have the same trends. The difference is that, as the jet pressure becomes greater, the slope of the attenuation curve becomes smaller. For example, at the same nozzle moving speed of 20 cm/s, when the jet pressure is 5 MPa, the erosion speed decreases to 0 at a jet distance of 8 cm, and when the jet pressure is 10 MPa, the erosion speed decreases to 0 until the jet pressure is 15 cm. At a given jet pressure, with decreases in nozzle speed, the erosion speed attenuation curve gradually becomes gentle. For example, at a jet pressure of 5 MPa and nozzle speed of 20 cm/s, the erosion speed approaches 0 at a jet distance of 8 cm. Moreover, at a nozzle speed of 1 cm/s, the erosion speed is still close to 1 cm/s at a jet distance of 15 cm. This illustrates the phenomenon of greater nozzle speeds being associated with smaller soil-breaking depths at a given jet pressure. Further analysis of the influence of erosion speed on soil-breaking depth shows that, at pressures of 5–10 MPa, the erosion speed is ver = 0.5unz, and when the jet distance reaches 58–83% of the total range, the soil-breaking depth reaches 80–96% of the soil-breaking depth. Therefore, areas with high flow velocity and high erosion speed, such as ver > 0.5unz, contribute most to the soil-breaking depth.

3.3. Prediction of the Erosion Surface Geometry

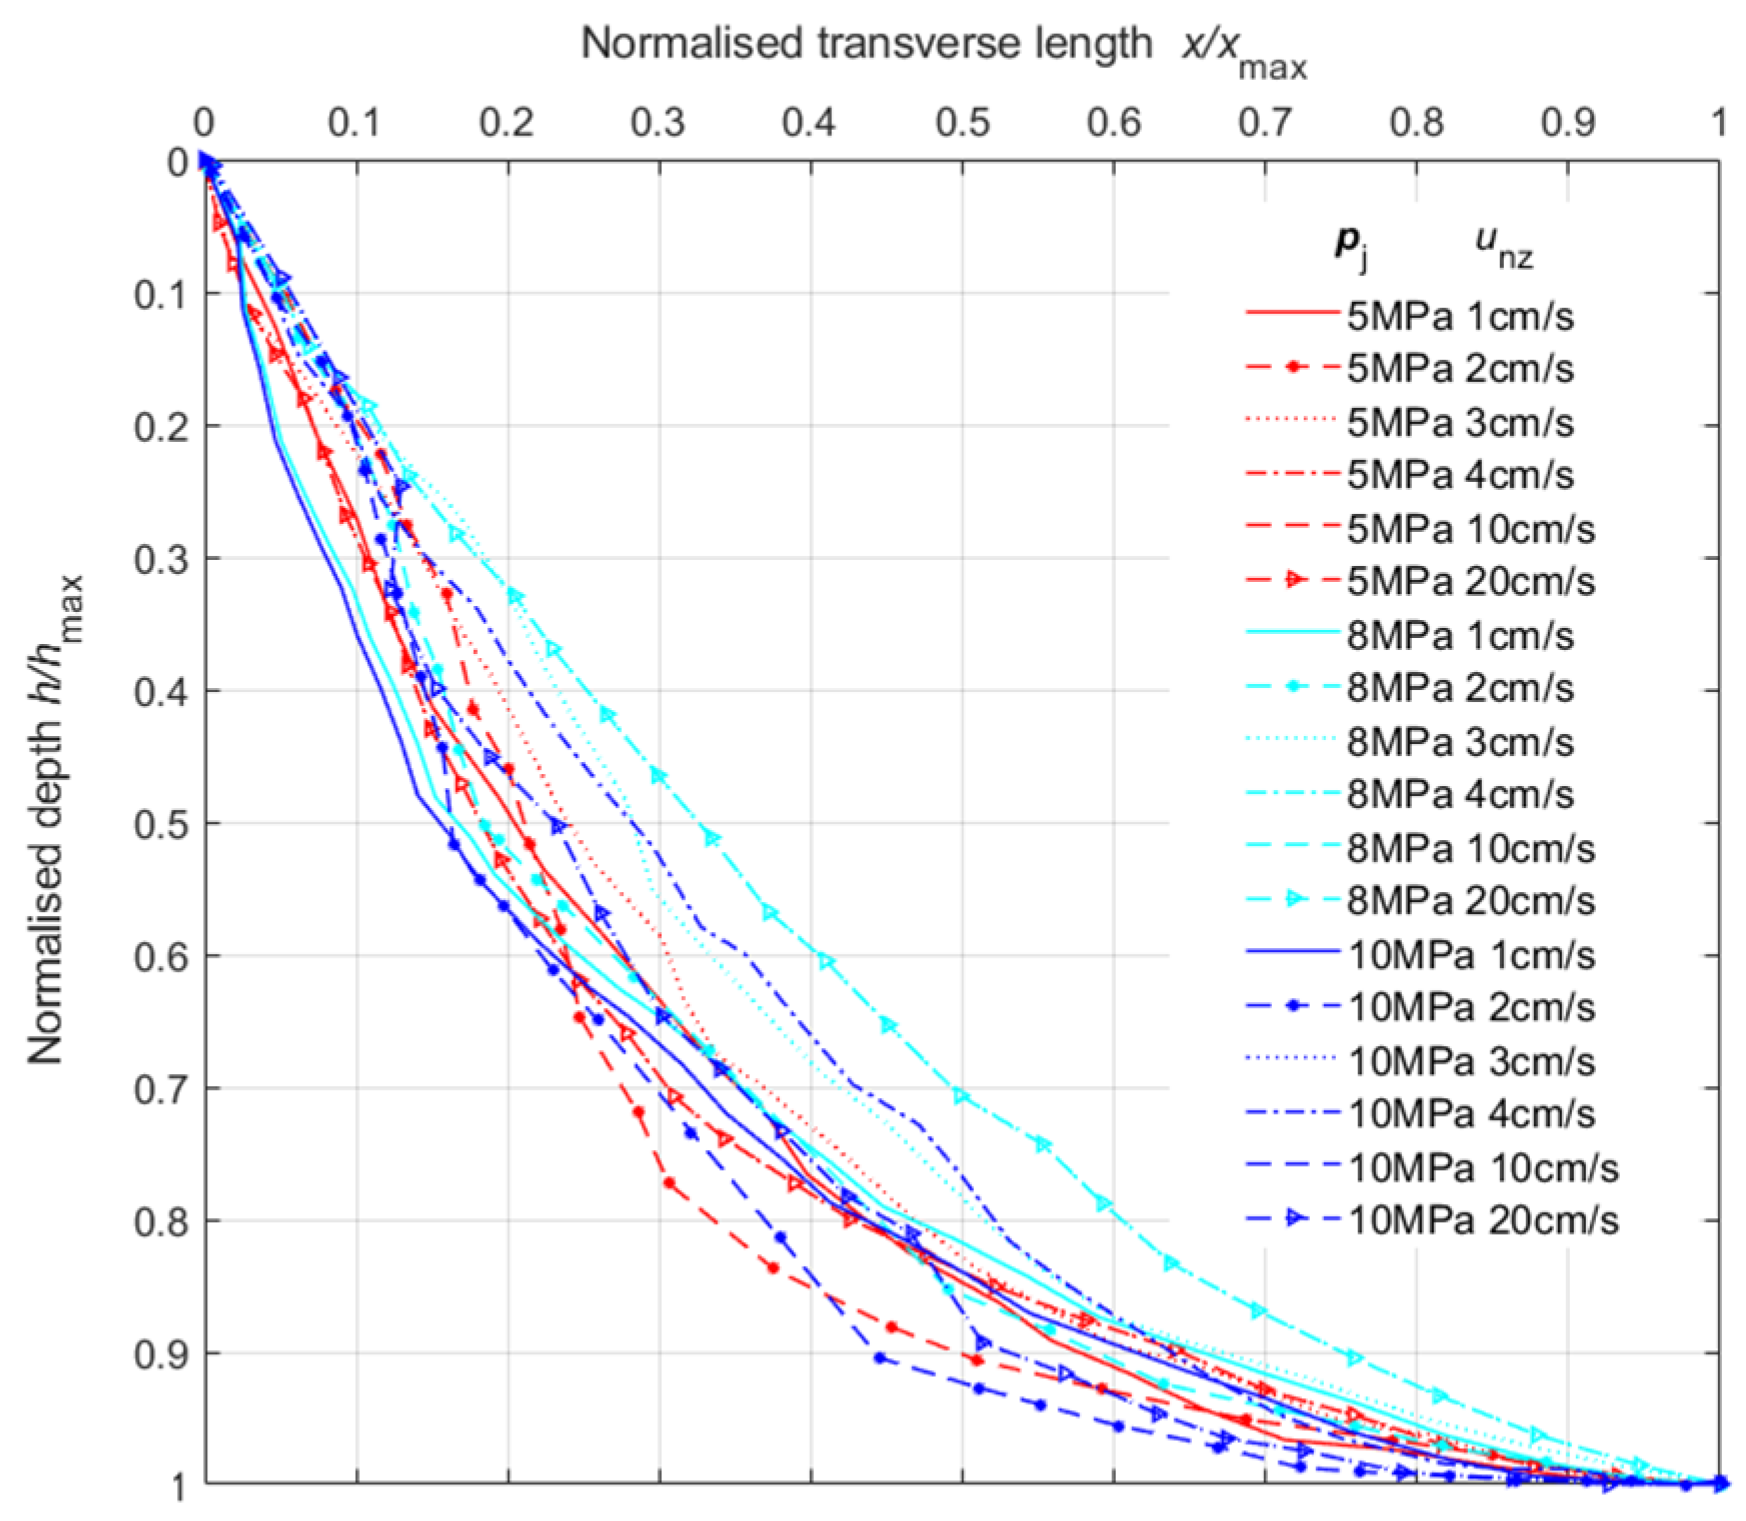
3.3.1. Segmentation of the Erosion Surface Curve

The mechanism of erosion surface evolution indicates that the soil-breaking depth increases sharply at erosion speeds of 0.5unzunz; while at erosion speeds of 0–0.5unz, the soil-breaking depth increases at a gradually slower rate. Combined with the geometric characteristics of each working condition shown in Figure 8, the erosion surface curve can be divided into straight and curved sections. The slope of the straight line is large, accounting for a large proportion of the erosion depth. The slope of the curve segment gradually decreases to 0, and the shape is similar to a longer ‘trailing’. The segmentation of the erosion surface curve is shown in Figure 11. The length and angle of the straight-line segment have important influences on the soil-breaking depth.
As shown in Figure 10, section AB of the erosion surface is approximately straight, section BC is a curve, hmax is the maximum soil-breaking depth, and xmax is the maximum distance of the erosion surface in the horizontal direction. The determination standard of section AB is as follows: The erosion surface ABC is divided into N points according to the jet distance, and the equal points are fitted to the straight line from point A. The part with correlation coefficients not less than 0.95 belong to the straight-line section, and the rest is a curved erosion surface section. According to this, the position of point B is determined. Combined with the shape of the erosion surface, the proportions of the straight line in the transverse distance, the depth, and the jet distance (erosion surface length) dimensions were obtained. The calculation results are shown in Table 4. The average slope angle of section AB is 70.6°, accounting for 33.1% (αx) of the horizontal distance of the entire erosion surface, 65.0% (αh) of the depth, and 49.2% (αs) of the jet distance. It can be seen that the AB straight-line section has a significant effect on the soil-breaking depth.

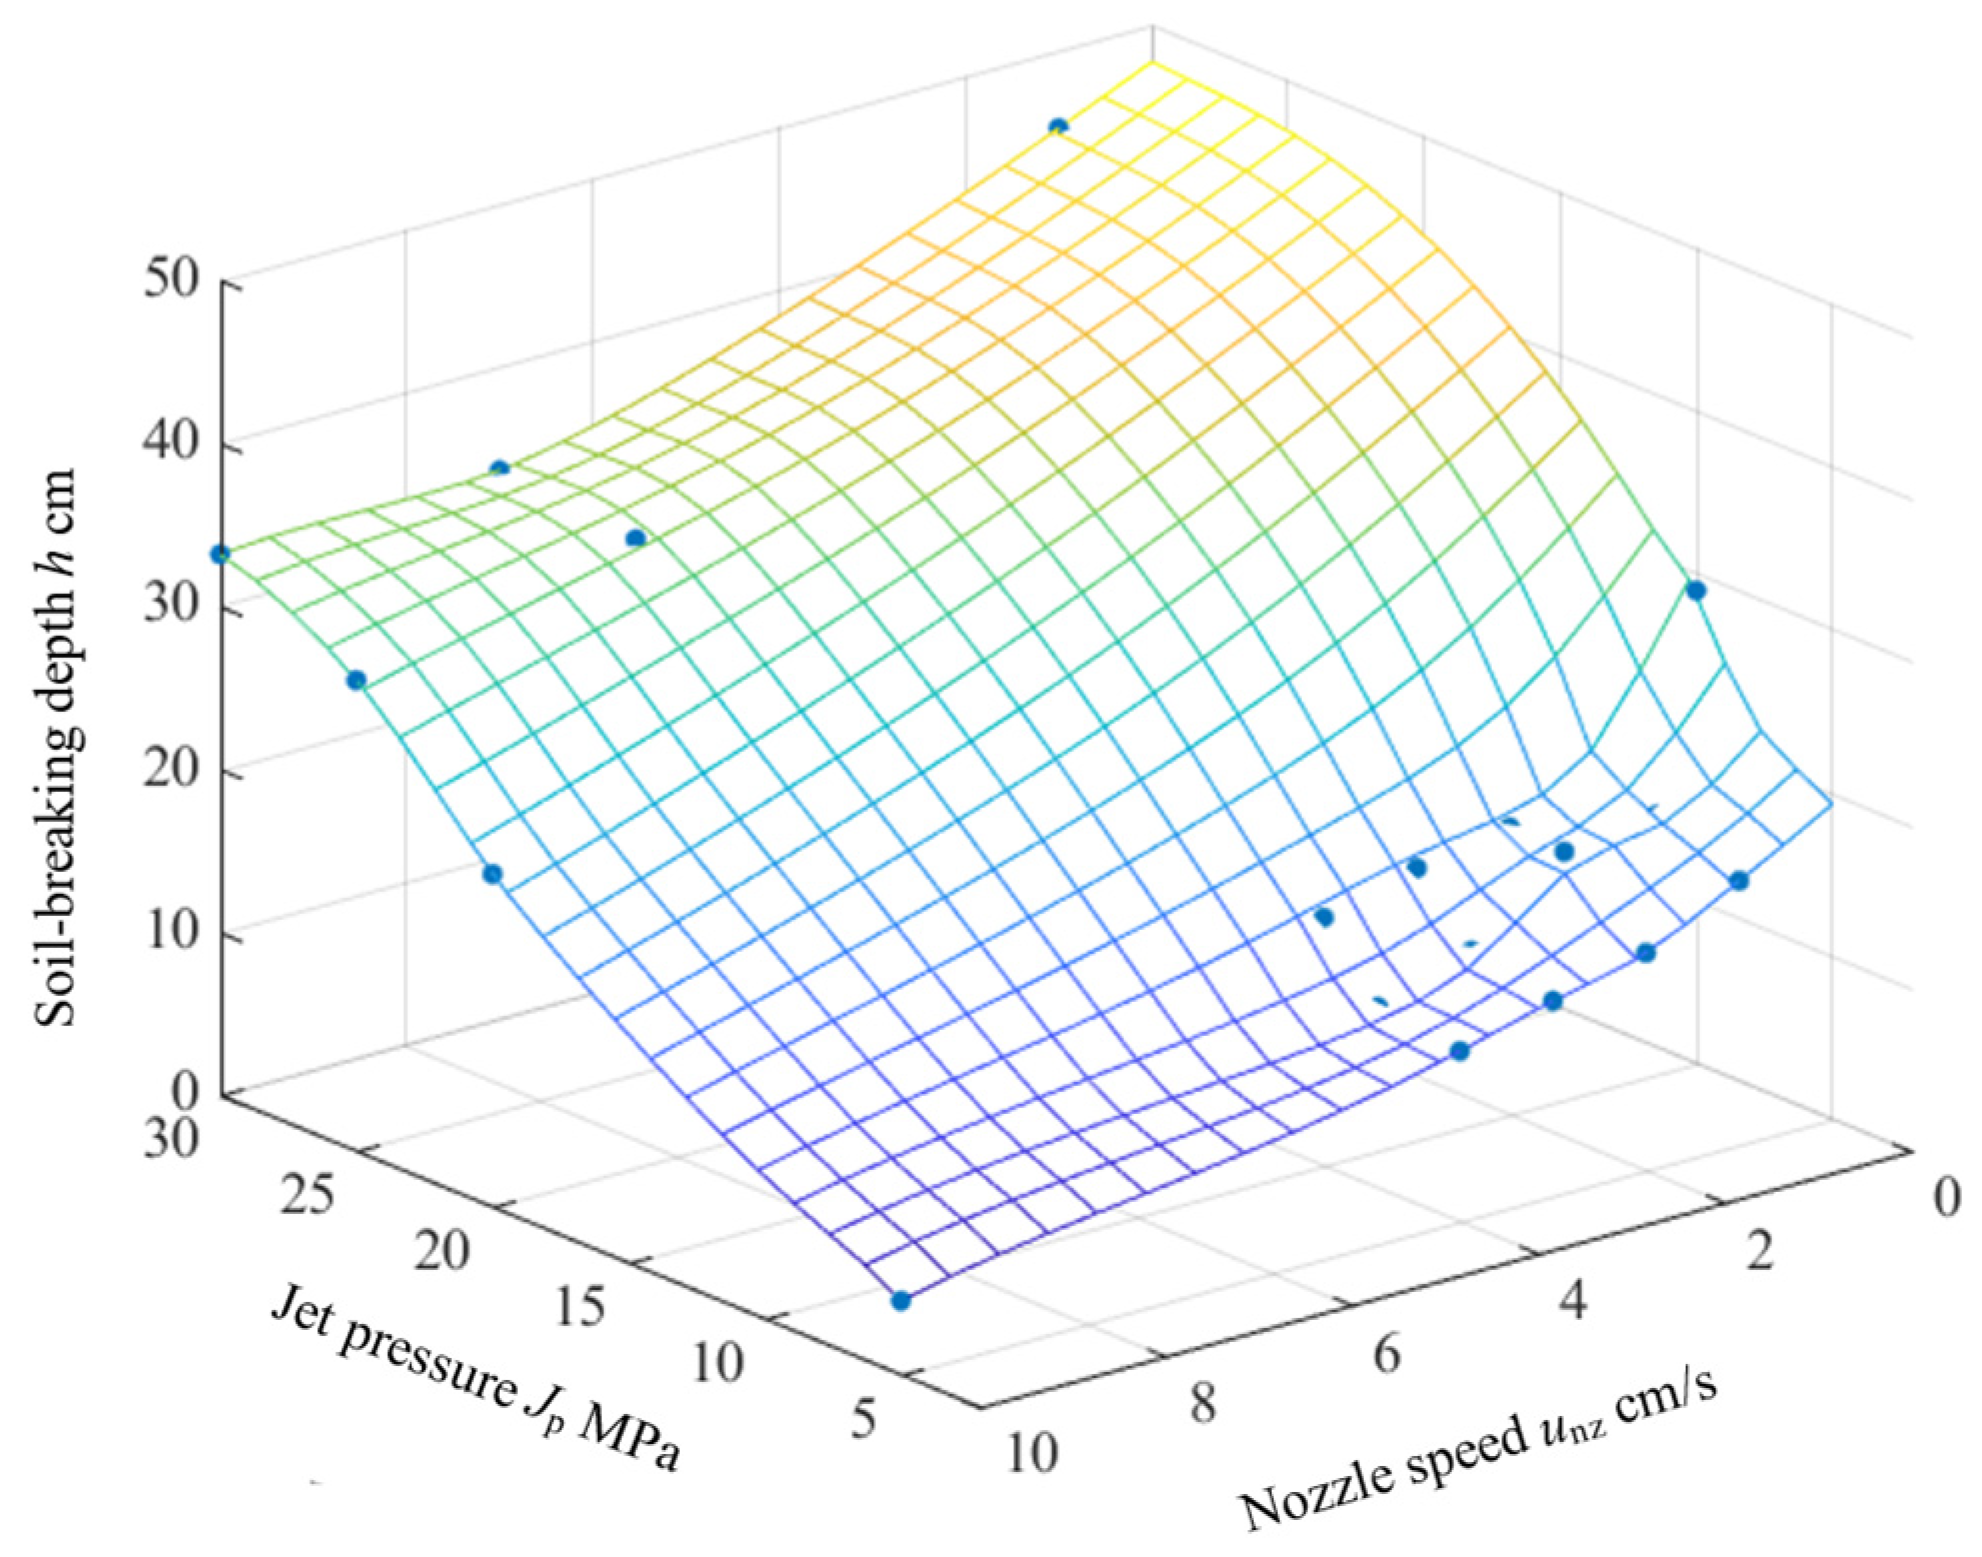
3.3.2. Prediction of Maximum Soil-Breaking Depth

To predict the geometric shape of the erosion surface, it is necessary to first determine one of the following: the maximum lateral distance, the maximum soil-breaking depth, and the maximum jet distance. Considering that the maximum soil-breaking depth is widely used in engineering, we selected this parameter for prediction analysis.
The points in Figure 12 are the soil-breaking depths corresponding to the jet pressures and nozzle moving speeds measured in the experiment. The influences of jet pressure and nozzle speed on soil-breaking depth can be analysed by connecting each point into a three-dimensional surface. Figure 7 shows that, as the jet pressure becomes greater, the nozzle speed becomes smaller, and the soil-breaking depth becomes greater. At a constant nozzle speed, increases in jet pressure always have a significant effect on the soil-breaking depth, and the curve can be approximated as a parabola. When the jet pressure is constant, the soil-breaking depth decreases gradually with increases in nozzle speed, and the curve can be approximated to a power function curve of 0.5.
Combined with the above analysis, the functional relationship between the soil-breaking depth and the two factors of jet pressure and nozzle moving speed can be fitted.
h max = 0.0393 p j 2 + 57.8 / ( u n z 0.5 + 1.65 ) 5.76
where pj is the jet pressure (MPa), unz is the nozzle moving speed (cm/s), and hmax is the soil-breaking depth (cm).
The analysis of the variance of Equation (2) shows a correlation coefficient of R2 = 0.94, indicating that the fitting effect of Equation (2) is good. Therefore, Equation (2) can be used as an empirical formula for predicting the depth of soil breaking by a moving high-pressure water jet. The applicable ranges are as follows: jet pressure = 5–30 MPa, nozzle speed = 1–20 cm/s.
Soil-breaking depth has a quadratic relationship with jet pressure and a 0.5 power function relationship with nozzle speed.

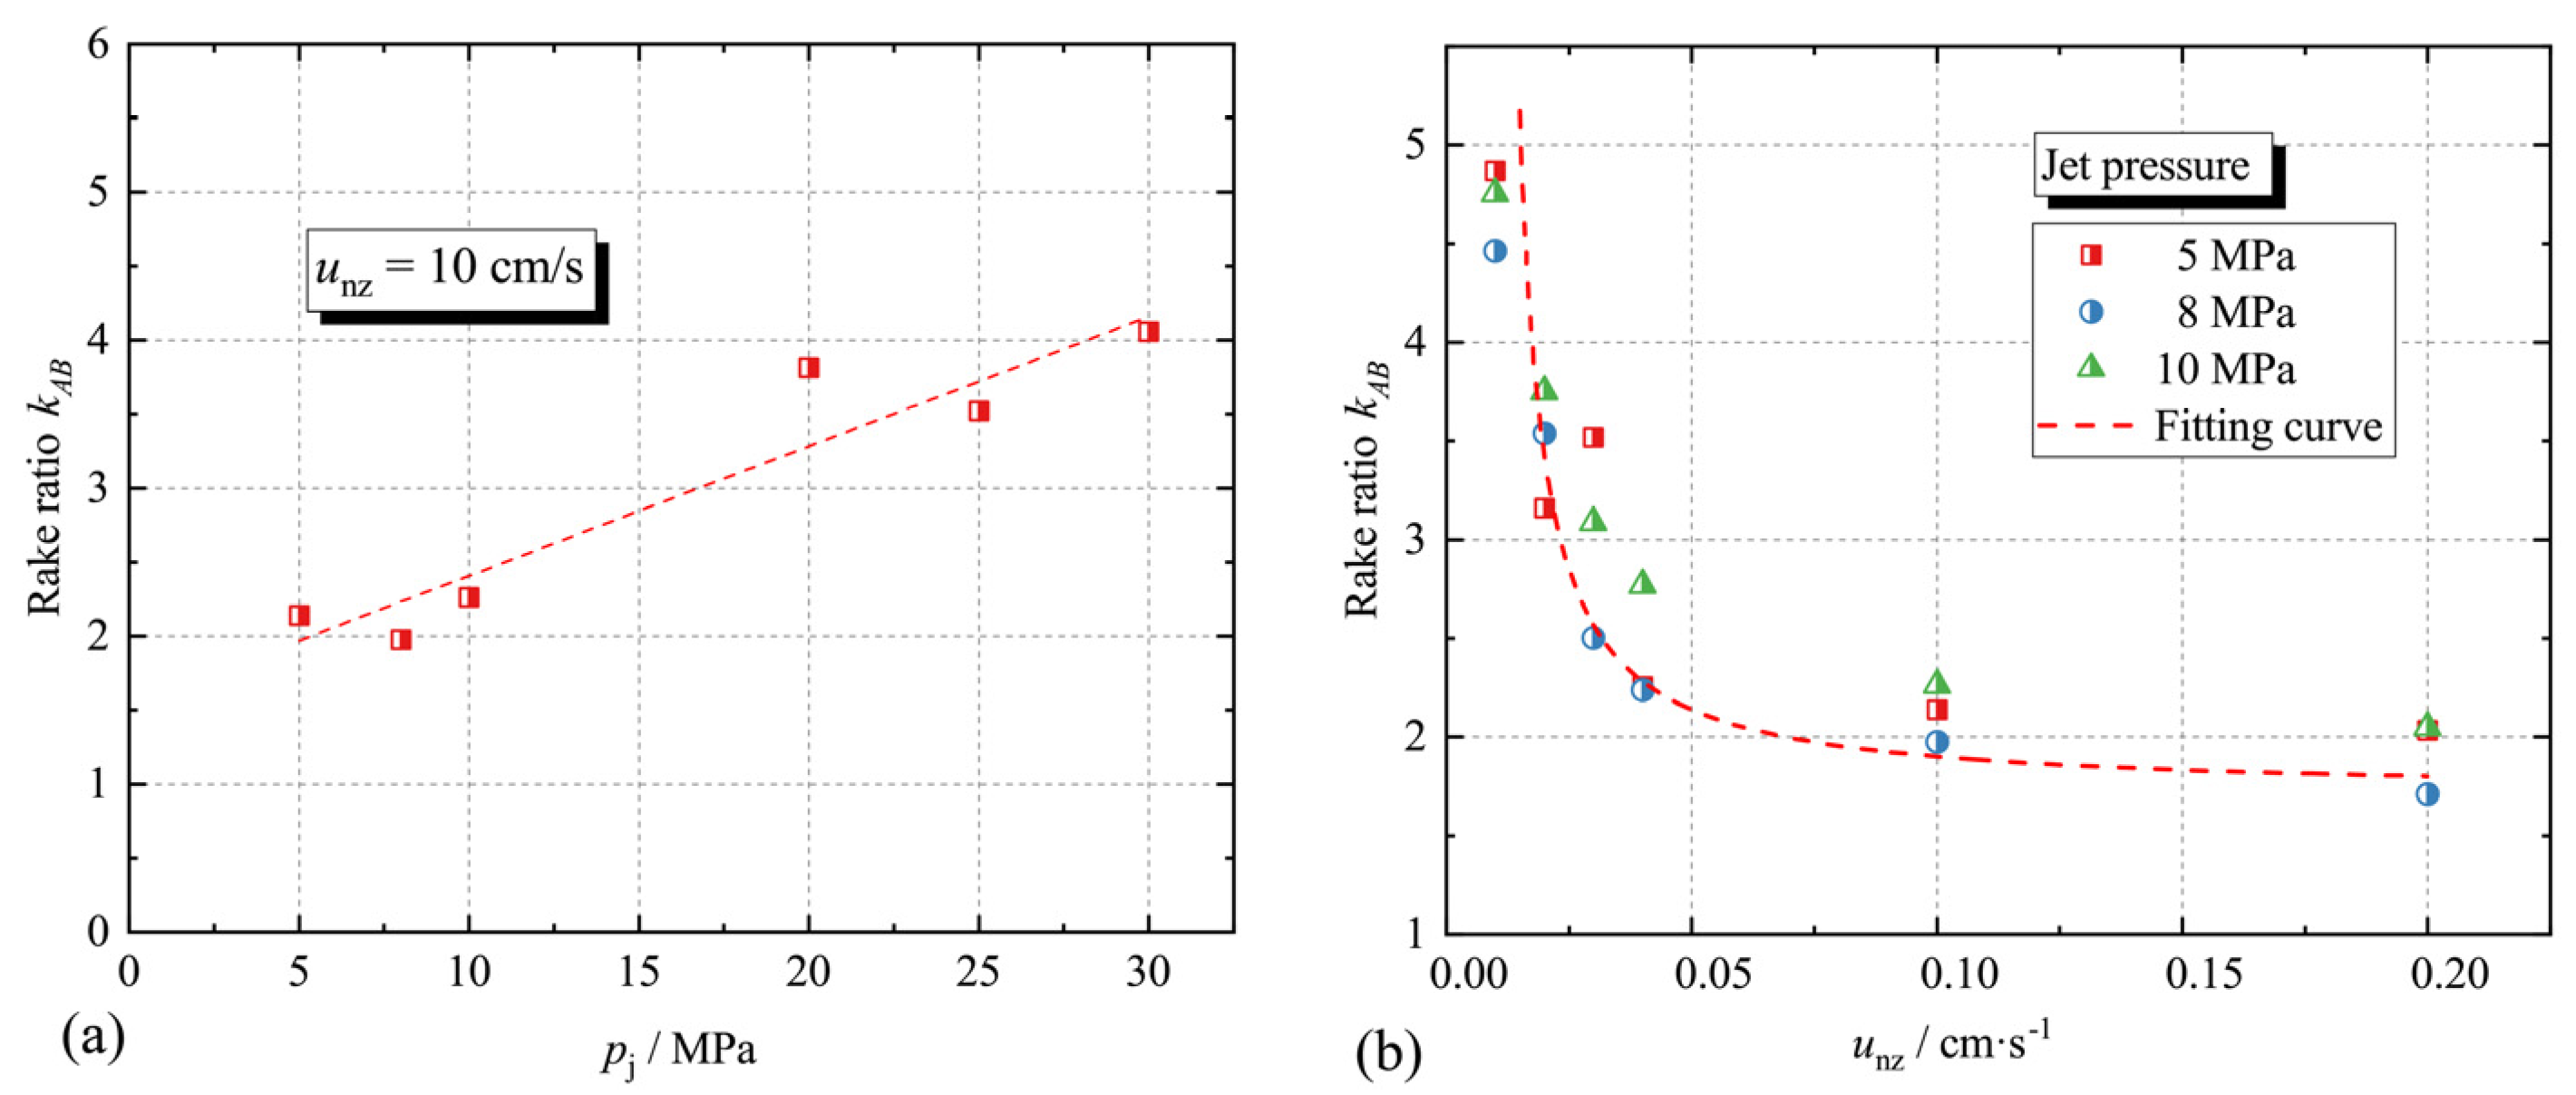
3.3.3. Determination of the Maximum Lateral Distance

In this section, the AB straight-line section of the erosion surface is predicted and analysed. At this point, the maximum depth of the erosion surface can be determined with Equation (2). The ordinate of point B in the AB straight-line section is αh·hmax, so it is necessary to determine the slope of the AB section of the erosion surface to predict the linear equation.
In Table 1, the slope of the straight line of the erosion surface is kAB, and the kAB range is 1.79–6.69. As the nozzle speed unz increases, kAB decreases. When pj is small (5–10 MPa), unz is the main factor affecting kAB. When pj is large (25–30 MPa), pj has a great influence on kAB.
kAB is positively correlated with pj and negatively correlated with unz. When pj is large, its increase has a more significant effect on kAB. The relationship between kAB and pj, unz is as follows:
k AB = 0.108 p j + 2.79 / u n z + 1.17
where kAB is the slope of the starting point of the erosion surface, pj is the jet pressure (MPa), and unz is the nozzle speed (cm/s).
Figure 13 shows the relationship between the values modelled using Equation (3) and the experimental values. The correlation coefficient of 0.95 indicates a good fit.
Thus, the abscissa xB of point B in the straight line AB can be obtained as follows:
x B = α h h max / k AB
The maximum lateral distance xmax can be obtained as follows:
x max = x B / α x = α h h max / α x k AB

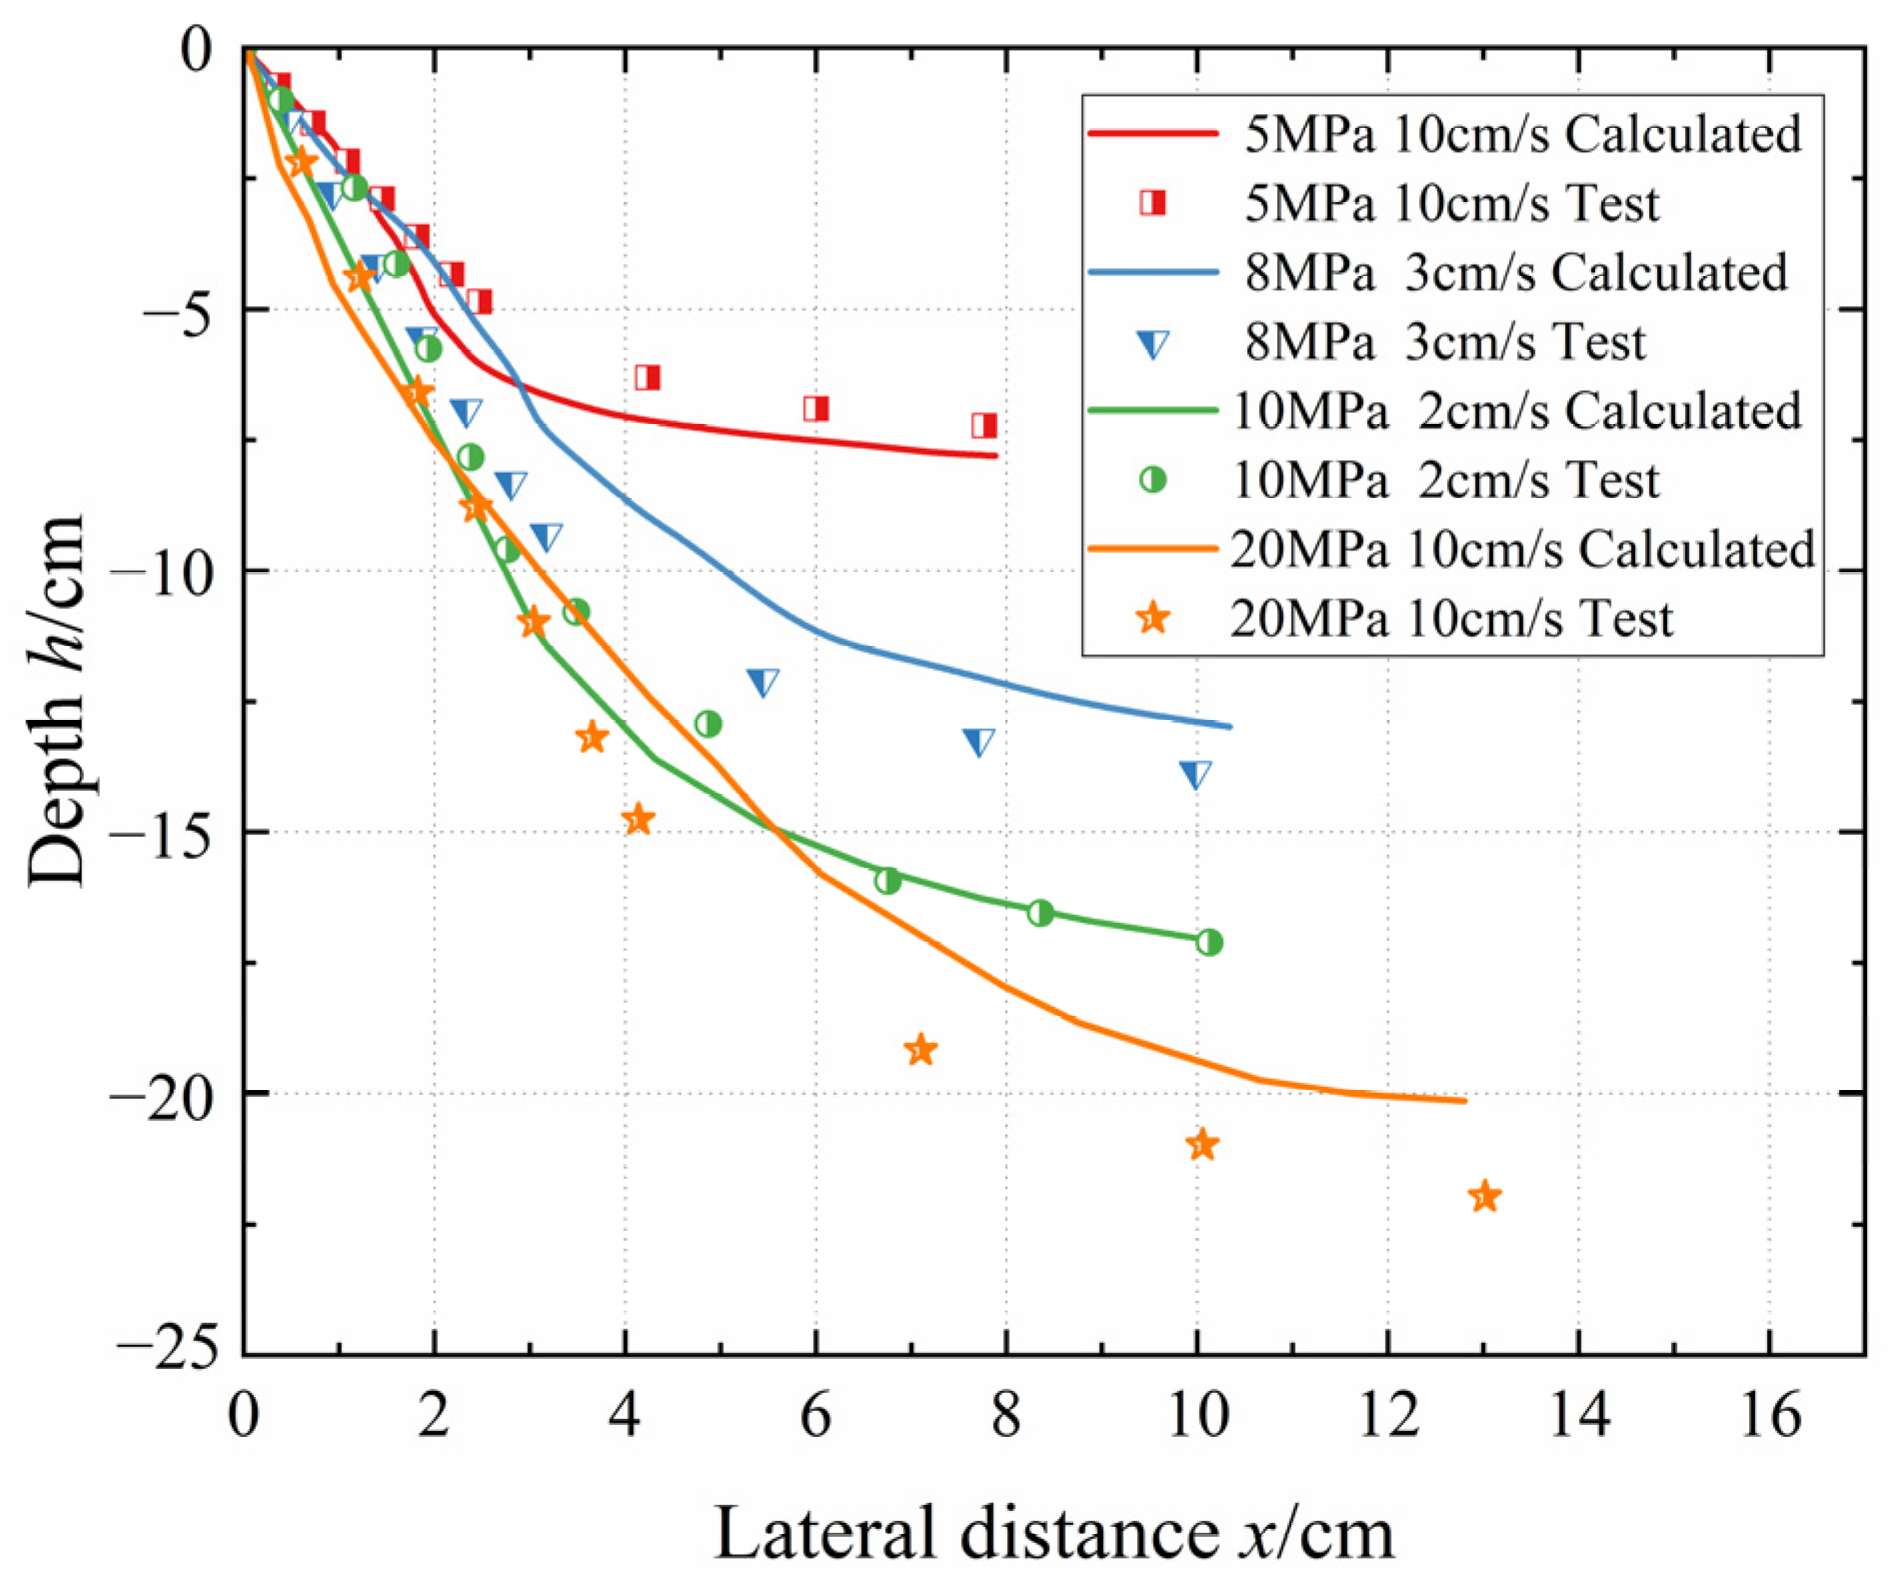
3.3.4. Prediction and Effect of Geometric Shape

After determining the maximum depth of soil breaking and the maximum lateral distance, the geometry of the erosion surface was further analysed and predicted. Table 4 shows that, although the slope and jet distance of the erosion surface are different, the range of fluctuation in the depth ratio and the jet distance of ratios of the straight section of the erosion surface are small, and the shape of the erosion surface changes according to similar rules. Therefore, the morphology of the erosion surface under different jet conditions can be normalised.
The conditions in Table 4 were selected for further tests, i.e., three jet pressures (pj = 5, 8, 10 MPa) and six nozzle speeds (unz = 1, 2, 3, 4, 10, 20 cm/s), making a total of 18 working conditions. The geometric contours of the erosion surfaces obtained from each test were normalised. The processing method was as follows: The horizontal and vertical coordinates of each point on the erosion surface were divided by the maximum lateral distance xmax and the maximum soil-breaking depth hmax. Thus, the erosion surface geometry under each test condition after normalisation was obtained, as shown in Figure 14. In the figure, the abscissa is the normalised transverse length, and the ordinate is the normalised depth. The degree of coincidence between the curves is high. There is a corresponding relationship between the point sets of different erosion surface contours, i.e., the shapes of the erosion surfaces have geometric similarity.
The starting point A of the straight-line segment of the normalised erosion surface is (0,0), the slope is 1.7–2.57 with an average of 2.14, and the end point of the curved segment is (−1,1). The curved segment is a decreasing function of increases in the second derivative. By comparing the inverse proportional function, logarithmic function, and exponential function, it can be seen that the error of the inverse proportional function is the smallest. The normalised erosion surface formula can be obtained by fitting according to:
{ h h max = 2.14 x x max   , ( x x max < α x ) h h max = 1.153 0.153 x max x , ( x x max α x )
The fitting correlation coefficient is 0.94, indicating that the normalised erosion cases are similar.
According to the depth, the normalised shape, and the slope of the erosion surface, an erosion surface profile under any jet pressure and nozzle speed can be calculated.
{ h max = 0.0393 p j 2 + 57.8 / ( u n z 0.5 + 1.65 ) 5.76 k A B = 0.108 p j + 2.79 / u n z + 1.17 x max = α h h max / α x k A B h h max = 2.14 x x max   , x x max < α x h h max = 1.153 0.153 x x max , x x max α x
Taking cases T2-3 (8 MPa, 3 cm/s) and T3-1 (10 MPa, 1 cm/s) as examples, the calculated and experimental results are as shown in Figure 15. The maximum error is <11%, which is acceptable for engineering applications.

4. Conclusions and Future Work

4.1. Conclusions

Based on high-pressure moving water-jet soil-breaking tests, this paper explored the influences of jet pressure and nozzle moving speed on the morphological characteristics of the erosion surface. An empirical formula was proposed that can predict the geometric shape of the erosion surface. The main findings are as follows:
(1) Increases in jet pressure and decreases in nozzle speed during the soil-breaking process expand the geometric shape of the erosion surface. At a given jet pressure, the soil-breaking depth decreases greatly with increases in nozzle speed. At a given nozzle speed, increases in jet pressure generally cause increases in soil-breaking depth.
(2) Based on erosion theory, it was found that increases in jet pressure greatly reduce the attenuation of erosion speed and then greatly increase the soil-breaking depth. The nozzle moving speed directly determines the initial value of the erosion speed. When the nozzle moving speed is small, the erosion speed attenuation degree is low, and when the nozzle moving speed is large, the erosion speed quickly drops to 0. This leads to greater nozzle moving speeds causing smaller soil-breaking depths.
(3) The geometric shape of the erosion surface can be divided into straight and curved segments. The proportion of straight lines in the depth, lateral distance, and jet distance was analysed. A model of the maximum soil-breaking depth according to jet pressure and nozzle speed was proposed. Furthermore, it was found that the geometric shape of the erosion surface has self-similarity; accordingly, an empirical formula that can predict the geometric shape of the erosion surface was proposed.

4.2. Future Work

(1) This paper only discusses the soil-breaking mechanism of pure water jets, and it analyses the influence of nozzle moving speed and jet pressure on the form of soil-breaking. At present, the more popular abrasive water jet has a good cutting effect on hard brittle materials, such as metals and rocks, but the soil breaking effect of flexible materials, such as soil, is still unknown, which is a problem worthy of further study.
(2) In this paper, Pingnan ionic rare earth mine was selected to analyse the soil-breaking mechanism of a high-pressure moving water jet. Only the two jet parameters of nozzle moving speed and jet pressure were considered. In fact, the shape of the water jet breaking soil is not only related to the jet’s parameters but is also closely related to the soil’s parameters. Therefore, the influence of the soil’s parameters, such as cohesion, density, and plasticity index, should be considered more in the future.

Author Contributions

Methodology, J.L.; Investigation, X.L., J.L. and Z.Y.; Writing—original draft preparation, J.L. and X.L.; Test technical support—J.L. and Z.Y.; Writing—review and editing, X.L.; Funding acquisition, G.W. and S.L.; Supervision, G.W. All authors have read and agreed to the published version of the manuscript.

Funding

This research was funded by the National Key Research and Development Program, grant number 2019YFC1805101.

Institutional Review Board Statement

Not applicable.

Informed Consent Statement

Not applicable.

Data Availability Statement

Not applicable.

Conflicts of Interest

The authors declare no conflict of interest.

References

  1. Kartal, F. A Review of the Current State of Abrasive Water-Jet Turning Machining Method. Int. J. Adv. Manuf. Technol. 2017, 88, 495–505. [Google Scholar] [CrossRef]
  2. Sharma, D.R.; Maurya, D.S.; Saini, D.R. A Review Paper on Current Research and Development in Abrasive Waterjet Machining. Math. Stat. Eng. Appl. 2022, 71, 4160–4169. [Google Scholar]
  3. Mardi, K.; Dixit, A.; Pramanik, A.; Basak, A.K. Tribology in (Abrasive) Water Jet Machining: A Review. In Machining and Tribology; Elsevier: Amsterdam, The Netherlands, 2022; pp. 113–125. ISBN 978-0-12-819889-6. [Google Scholar]
  4. Wen, J.; Chen, C.; Campos, U. Experimental Research on the Performances of Water Jet Devices and Proposing the Parameters of Borehole Hydraulic Mining for Oil Shale. PLoS ONE 2018, 13, e0199027. [Google Scholar] [CrossRef] [PubMed]
  5. Lu, Y.; Tang, J.; Ge, Z.; Xia, B.; Liu, Y. Hard Rock Drilling Technique with Abrasive Water Jet Assistance. Int. J. Rock Mech. Min. Sci. 2013, 60, 47–56. [Google Scholar] [CrossRef]
  6. Njock, P.G.A.; Shen, J.S.; Modoni, G.; Arulrajah, A. Recent Advances in Horizontal Jet Grouting (HJG): An Overview. Arab. J. Sci. Eng. 2018, 43, 1543–1560. [Google Scholar] [CrossRef]
  7. Zhang, S.; Wang, C.; Ge, T. Experimental Prediction of the Noncontact Jet Trencher’s Excavation Depth in Clay. Mar. Georesources Geotechnol. 2017, 35, 300–304. [Google Scholar] [CrossRef]
  8. Zhang, S.; Zhao, M.; Ge, T.; Wang, C. Experimental Research on Trenching in Stiff Clay by Submerged Vertical Traveling Jets. J. Coast. Res. 2016, 318, 365–373. [Google Scholar] [CrossRef]
  9. Yu, J.; Liu, J.; Wang, G.; Luo, S.; Wang, J. Correction of Realizable k-ε model for high pressure submerged water jets. Sci. Technol. Eng. 2021, 21, 5024–5030. [Google Scholar]
  10. Rajaratnam, N.; Beltaos, S. Erosion by Impinging Circular Turbulent Jets. J. Hydraul. Div. 1977, 103, 1191–1205. [Google Scholar] [CrossRef]
  11. Hogg, A.J.; Huppert, H.E.; Dade, W.B. Erosion by Planar Turbulent Wall Jets. J. Fluid Mech. 1997, 338, 317–340. [Google Scholar] [CrossRef] [Green Version]
  12. Mazurek, K.A.; Rajaratnam, N.; Sego, D.C. Scour of Cohesive Soil by Submerged Circular Turbulent Impinging Jets. J. Hydraul. Eng. 2001, 127, 598–606. [Google Scholar] [CrossRef]
  13. Hou, J.; Zhang, L.; Gong, Y.; Ning, D.; Zhang, Z. Theoretical and Experimental Study of Scour Depth by Submerged Water Jet. Adv. Mech. Eng. 2016, 8, 1687814016682392. [Google Scholar] [CrossRef]
  14. Jun, D.; Wei-lin, X.U.; Zhong-chao, Y.; Jin-xue, Q.U. Numerical simulation of scouring on bedrock. Skxjz 2005, 16, 47–51. [Google Scholar]
  15. Nguyen, D.; Uh Zapata, M.; Gauthier, G.; Gondret, P.; Pham Van Bang, D. A Two Phase Numerical Model For The Water Injection Dredging (WID) Technology: An Unified Formulation For Continuum Mechanic. CUNY Academic Works 17–21 August 2014. Available online: https://academicworks.cuny.edu/cc_conf_hic/437/ (accessed on 11 November 2022).
  16. Epely-Chauvin, G.; De Cesare, G.; Schwindt, S. Numerical Modelling of Plunge Pool Scour Evolution In Non-Cohesive Sediments. Eng. Appl. Comput. Fluid Mech. 2014, 8, 477–487. [Google Scholar] [CrossRef] [Green Version]
  17. Kuang, S.B.; LaMarche, C.Q.; Curtis, J.S.; Yu, A.B. Discrete Particle Simulation of Jet-Induced Cratering of a Granular Bed. Powder Technol. 2013, 239, 319–336. [Google Scholar] [CrossRef]
  18. Perng, A.T.H.; Capart, H. Underwater Sand Bed Erosion and Internal Jump Formation by Travelling Plane Jets. J. Fluid Mech. 2008, 595, 1–43. [Google Scholar] [CrossRef] [Green Version]
  19. Yeh, P.-H.; Chang, K.-A.; Henriksen, J.; Edge, B.; Chang, P.; Silver, A.; Vargas, A. Large-Scale Laboratory Experiment on Erosion of Sand Beds by Moving Circular Vertical Jets. Ocean Eng. 2009, 36, 248–255. [Google Scholar] [CrossRef]
  20. Dong, C.; Zhao, P.; Yu, G.; Zhang, M. Laboratory Flume Experiments on Cohesive Sediment Erosion by Oscillating Wall Jet. J. Coast. Res. 2020, 37, 179–190. [Google Scholar] [CrossRef]
  21. Zhang, M.; Yu, G.; La Rovere, A.; Ranzi, R. Erodibility of Fluidized Cohesive Sediments in Unidirectional Open Flows. Ocean Eng. 2017, 130, 523–530. [Google Scholar] [CrossRef]
  22. Benahmed, N.; Bonelli, S. Investigating Concentrated Leak Erosion Behaviour of Cohesive Soils by Performing Hole Erosion Tests. Eur. J. Environ. Civ. Eng. 2012, 16, 43–58. [Google Scholar] [CrossRef]
  23. Aderibigbe, O.O.; Rajaratnam, N. Erosion of Loose Beds by Submerged Circular Impinging Vertical Turbulent Jets. J. Hydraul. Res. 1996, 34, 19–33. [Google Scholar] [CrossRef]
  24. Al-Madhhachi, A.-S.; Hanson, G.; Fox, G.; Tyagi, A.; Bulut, R. Deriving Parameters of a Fundamental Detachment Model for Cohesive Soils from Flume and Jet Erosion Tests. Trans. ASABE 2013, 56, 489–504. [Google Scholar] [CrossRef]
  25. Utley, B.C.; Wynn, T.M. Cohesive Soil Erosion: Theory and Practice. In Proceedings of the World Environmental and Water Resources Congress 2008, American Society of Civil Engineers, Honolulu, HI, USA, 12–16 May 2008; pp. 1–10. [Google Scholar]
  26. Wang, B.; van Rhee, C.; Nobel, A.; Keetels, G. Modeling the Hydraulic Excavation of Cohesive Soil by a Moving Vertical Jet. Ocean Eng. 2021, 227, 108796. [Google Scholar] [CrossRef]
  27. Hanson, G.J. Surface erodibility of earthern channels at high stresses. Part I—Open channel testing. Trans. ASAE 1990, 33, 127–131. [Google Scholar] [CrossRef]
  28. ASTM D2487; Standard Practice for Classification of Soils for Engineering Purposes (Unified Soil Classification System). Annual Book of ASTM Standards. American Society for Testing Materials: West Conshohocken, PA, USA, 2006.
  29. Partheniades, E. Erosion and Deposition of Cohesive Soils. J. Hydraul. Div. 1965, 91, 105–139. [Google Scholar] [CrossRef]
  30. Knapen, A.; Poesen, J.; Govers, G.; Gyssels, G.; Nachtergaele, J. Resistance of Soils to Concentrated Flow Erosion: A Review. Earth-Sci. Rev. 2007, 80, 75–109. [Google Scholar] [CrossRef]
Figure 1. Schemes follow the same formatting.
Applsci 12 12343 g001
Figure 2. Jet pressure supply module.
Applsci 12 12343 g002
Figure 3. Nozzle size diagram.
Applsci 12 12343 g003
Figure 4. Control and acquisition module.
Applsci 12 12343 g004
Figure 5. Monitoring data of jet pressure.
Applsci 12 12343 g005
Figure 6. Particle size distribution diagram.
Applsci 12 12343 g006
Figure 7. Photos of erosion groove shapes.
Applsci 12 12343 g007
Figure 8. Erosion surface shape curves: (a) jet pressure 5 MPa; (b) jet pressure 8 MPa; (c) jet pressure 10 MPa; (d) jet pressure 20, 25 and 30 MPa.
Applsci 12 12343 g008
Figure 9. Erosion surface of moving jet.
Applsci 12 12343 g009
Figure 10. Erosion speed along the way.
Applsci 12 12343 g010
Figure 11. Division of erosion surface geometry.
Applsci 12 12343 g011
Figure 12. Relationship among soil-breaking depth, jet pressure, and nozzle speed.
Applsci 12 12343 g012
Figure 13. Relationship between the slope of the straight line and jet pressure and between the slope of the straight line and moving speed: (a) the relationship between slope and jet pressure under the premise of fixed nozzle moving speed of 10 cm/s; (b) the relationship between slope and nozzle moving speed under the premise of fixed jet pressure of 5, 8 and 10 MPa.
Applsci 12 12343 g013
Figure 14. Normalised erosion surface morphology.
Applsci 12 12343 g014
Figure 15. Comparative verification of prediction formulas.
Applsci 12 12343 g015
Table 1. Mechanical composition of soil.
Sample LocationDistribution of Soil Particle Size/%Soil Texture
Sand
(>0.05~2 mm)
Silt
(0.002~0.05 mm)
Clay
(<0.002 mm)
Pingnan52.7638.378.87Loam
Table 2. Physical and mechanical parameters of test soil samples.
ParameterTesting MeansValueUnit
Relative densityPycnometer method2.70g/cm3
densityCutting ring method1.73g/cm3
Water contentDrying method18%
Shear strengthMiniature vane10.6kPa
CohesionGDS triaxial apparatus23kPa
Internal friction angleGDS triaxial apparatus23.6°
Permeability coefficientColumn leaching test0.16m/d
Plasticity indexLiquid–plastic limit combined method9.6/
Table 3. Test scheme of water jet breaking soil.
Test
Conditions
Jet Pressure
MPa
Nozzle Traversal Speed
cm/s
Test
Conditions
Jet Pressure
MPa
Nozzle Traversal Speed
cm/s
T1-151T3-1101
T1-252T3-2102
T1-353T3-3103
T1-454T3-4104
T1-5510T3-51010
T1-6520T3-61020
T2-181T4-12010
T2-282T5-1257
T2-383T5-22510
T2-484T6-1307
T2-5810T6-23010
T2-6820
Table 4. Proportion of erosion surface straight-line segment.
Serial
Number
Jet Pressure
MPa
Nozzle Traversal Speed
cm/s
Horizontal
Ratio
xL/xmax %
Depth
Ratio
hL/hmax %
Distance
Ratio
sL/smax %
Initial
Slope
k0
T1-15127.560.650.24.92
T1-25230.066.948.03.19
T1-35334.565.447.62.28
T1-45423.056.340.93.56
T1-551030.066.946.92.97
T1-652023.056.338.93.07
T2-18120.551.940.44.53
T2-28228.061.446.83.58
T2-38351.078.465.62.51
T2-48454.574.664.51.99
T2-581028.061.443.82.87
T2-682054.574.663.21.72
T3-110120.553.841.64.82
T3-210227.065.347.13.79
T3-310334.568.452.13.11
T3-410447.074.757.31.78
T3-5101027.065.344.23.10
T3-6102034.568.446.62.07
Average value 33.165.049.23.10
Publisher’s Note: MDPI stays neutral with regard to jurisdictional claims in published maps and institutional affiliations.

