Article

Development of Polyamide 6 (PA6)/Polycaprolactone (PCL) Thermoplastic Self-Healing Polymer Blends for Multifunctional Structural Composites

Department of Industrial Engineering and INSTM Research Unit, University of Trento, Via Sommarive 9, 38123 Trento, Italy
*
Author to whom correspondence should be addressed.
Appl. Sci. 2022, 12(23), 12357; https://doi.org/10.3390/app122312357
Submission received: 28 October 2022 / Revised: 15 November 2022 / Accepted: 29 November 2022 / Published: 2 December 2022
(This article belongs to the Section Materials Science and Engineering)

Abstract

:
High-performance composites suffer from fatigue crack propagation during service. Traditional repair methods can be expensive and time-consuming. Therefore, research on composites with self-healing capabilities has considerably increased in the past decade. The aim of this work is to develop a polyamide 6 (PA6) matrix with self-healing properties. Polycaprolactone (PCL) was used as healing agent and melt compounded with PA6. PCL caused a decrease of the mechanical properties of PA6, due to its immiscibility and low mechanical properties. Nevertheless, acceptable fracture toughness values in quasi-static mode were obtained. Samples were thermally mended at 80 and 100 °C, and the healing efficiency was assessed by comparing the fracture toughness of virgin and repaired samples both in quasi-static and in impact mode. The blend with a PCL content of 30 wt% showed limited healing efficiency values (up to 6%) in quasi-static mode, while an interesting repair capability (53%) was detected under impact conditions. This discrepancy was explained through microstructural analysis and correlated to a different fracture morphology. In fact, under quasi-static mode, the PA6 matrix was severely plasticized, while under impact a brittle fracture surface was obtained. This morphology favored the flow of PCL during the thermal healing process.

1. Introduction

Polymer composites are versatile and high-performing structural materials, characterized by elevated strength, stiffness, fatigue, and corrosion resistance, coupled with low density and ease of fabrication [1,2]. However, one of their biggest failure problems is fatigue crack propagation under load, due to both interfacial delamination and matrix cracking. This failure is particularly hard to predict, and thus the monitoring and maintenance of composite structures still remains a major issue [3]. Various solutions have been implemented in order to delay crack propagation in composite materials [3,4], but if the damage is too extensive, structural repair is not an option, and the component has to be replaced. Considering also that repair operations can be often expensive and time-consuming, the research in the field of self-healing composites has increased in the past decade [5]. Self-healing composites are fabricated to heal cracks and damages, if present, and to enhance the longevity of the structures [6]. In order to improve self-healing efficiency, it is important to consider various factors related to the damage and repair mechanisms in these materials. Four important concepts should be taken into account: localization, time, mobility of the healing agent, and the actual self-healing mechanism [7,8]. First of all, damage assessment is essential, and for this reason, localization and damage scale need to be identified. The scale of damage can range from small surface scratches to deep cuts and fiber debonding or delamination. Moreover, time plays an important role in the healing process; there is a time gap between damage formation and the onset of the self-healing mechanism. Healing time is related to the healing agent’s mobility inside the damaged polymer. Finally, the type of self-healing mechanism also influences the efficiency of the process.
Self-healing mechanisms are generally divided in two broad classes: extrinsic and intrinsic [8]. These two repair methods differ in their reversibility [9]. While extrinsic self-healing is based on microencapsulation and vascular impregnation of the self-healing agent and is non-reversible, intrinsic healing is based on reversible bonding in the polymers or blends constituting the matrix [10]. The main advantage of extrinsic self-healing is given by the autonomous flow of the healing agent in the cracked area and the subsequent repair, without the need of external stimuli [11]. In the extrinsic mode, the healing agent is delivered to the damaged area upon capsule rupture and undergoes polymerization through the interaction with a catalyst after being released to the damaged site, thus repairing the crack [12,13]. Although an elevated healing efficiency can be achieved with this method, the introduction of capsules or vascular systems negatively impacts the mechanical properties of the composite. Moreover, the extrinsic self-healing mechanism can only be exploited once, since the broken storage sites cannot be refilled and subsequently re-polymerized upon further damage [14]. Conversely, the intrinsic self-healing mechanism is based on the inherent reversibility of bonding in the matrix phase or in the polymer identified as the healing agent [12]. In these conditions, the healing functionality is thus an intrinsic part of the matrix (either chemically or compositionally tuned), and a catalyst is not needed [15]. Intrinsic self-healing materials are also called non-autonomous, due to the necessity of external stimuli (heat, radiation, load) to trigger the healing mechanism. Furthermore, the biggest advantage of intrinsic self-healing materials compared to extrinsic ones is the ability to perform multiple healing cycles. Healing cycles can be theoretically unlimited if healing agent degradation does not occur, and this approach can be implemented for thermoplastics, thermosets, and elastomers [16]. Intrinsic systems are generally the ideal solution to repair minor damage, considering the close proximity of the healing agent to the damaged site [15]. Intrinsic self-healing can be obtained through physical and/or chemical interactions [16]; while physical mechanisms are based on molecular inter-diffusion [17], chemical interactions are based on reversible covalent bonds [11] and supramolecular interactions [18]. Furthermore, polymer blends [19] and shape memory polymers [20] have been implemented in order to exploit both physical and chemical interactions.
Taking into account that in the literature, the effectiveness of intrinsic self-healing composites constituted by a thermoplastic healing agent dispersed inside a thermosetting matrix has been already demonstrated [21,22], this mechanism could also be extended to thermoplastic composites (TPCs). Although less commonly employed than traditional thermosetting composites, TPCs are rising in popularity, with a global market of 17.7 Mt in 2021, mainly driven by the automotive, construction and aerospace industries [23]. A big advantage of thermoplastic composites compared to traditional ones is their better processability and lower cost, coupled with their ability to be recycled through grinding, melting, and reforming operations [24,25]. The major disadvantages of TPCs compared to thermosetting composites are their lower strength and thermal stability, which in turn lead to the need for more repair or re-consolidation operations throughout their service life. Although TPCs can be thermally repaired simply by melting/softening the matrix, this operation often results in high costs and can also cause geometrical distortions of the components. Therefore, the implementation of the intrinsic self-healing mechanism inside the thermoplastic matrix in TPCs could bypass this limitation, thus obtaining a cost-effective and environmentally friendly solution to maintain the structural integrity of these composites.
Although many studies about thermosetting self-healing composites, mainly focused on epoxy-based laminates [21,26,27], can be found in the open literature, only a few papers have focused on the self-healing mechanism exploited in thermoplastic matrices for the development of TPCs. Moreover, these studies are mainly focused on elastomers or thermoplastic polyurethane [28,29]. In the present study, polyamide 6 (PA6) was chosen as matrix material, as it is a high-performance thermoplastic polymer widely used in TPCs for the automotive and aircraft industry [30]. In the present paper, the polymer selected as a healing agent is polycaprolactone (PCL), which has already proven to have healing capability in thermosetting matrices [21,22]. Therefore, PA6/PCL blends at different relative amounts were prepared through melt compounding, and a comprehensive rheological, morphological, chemical, thermal, and mechanical characterization was carried out on the resulting materials. Considering that the evaluation of healing efficiency is usually carried out as the ratio of specific mechanical properties of the virgin and damaged materials after healing [31], it is possible to evaluate the repair capability through the comparison of the fracture toughness (KIC) of the virgin and healed materials, as reported in the literature [32]. Therefore, in the present work, the fracture toughness (KIC) of these blends was evaluated both in quasi-static and impact conditions, and the samples broken in these tests were thermally repaired by using a lab-made device. In this way, it was possible to understand the effect of the healing agent in the worst-case scenario, i.e., the complete failure of the component.

2. Materials and Methods

2.1. Materials

The thermoplastic matrix selected for this study was a Radilon S 24E 100 NAT polyamide 6, supplied by Radici Group Spa (Gandino, Italy) in form of polymer granules (density = 1.14 g/cm3, melting temperature = 220 °C). The healing agent was a polycaprolactone (PCL), purchased by Polysciences Inc. (Warrington, PA, USA) in form of polymer granules (density = 1.1 g/cm3, MW = 80,000 g/mol).

2.2. Sample Preparation

The blends were prepared in the molten state in a two-step process. Before processing, PA6 pellets were dried for 12 h in a vacuum oven at a temperature of 80 °C, while PCL pellets were dried in a ventilated oven at a temperature of 50 °C for 12 h. PA6 and PCL granules were manually mixed at different relative amounts and subsequently melt-compounded through a Thermo Haake Rheomix 600 internal mixer equipped with counter-rotating rotors, operating at 60 rpm for 5 min at a temperature of 230 °C. The obtained blends were then compression-molded in a Carver hot-plate press at 235 °C for 8 min, under an applied pressure of 1.9 MPa. In this way, square sheets 10 × 10 × 2 mm3 were prepared. Thicker sheets, having a thickness of 5 mm and the same lateral dimensions, were also prepared for the evaluation of the fracture toughness (both in quasi-static and impact conditions). The produced samples were denoted as PA6_xPCL, where “x” is the weight fraction of PCL in the blends, with x = 5, 10, 20, and 30 wt%. Also, the samples of the neat matrices (PA6, PCL) were prepared for comparison.

2.3. Experimental Techniques

2.3.1. Rheological Properties

Rheological measurements were performed with an HR-2 Discovery Hybrid Rheometer (TA Instruments, New Castle, DE, USA) in parallel plate configuration. The diameter of the plates was 25 mm, and a gap of 1.0 mm between the plates was utilized. Frequency sweep experiments were carried out at 230 °C in air, and the frequency range was set from 0.05 to 600 rad/s at a strain amplitude of 1%. In this configuration, the trends of the storage modulus (G′), loss modulus (G″), and complex viscosity (η*) as a function of the frequency were determined. At least three specimens were tested for each composition.

2.3.2. Microstructural Properties

Light microscope (LM) micrographs of the produced blends were acquired by embedding the specimens in cylindrical epoxy beads and observing them through a CH–9435 Heerbrugg optical microscope (Heerbrugg, Switzerland). ImageJ® software (National Institutes of Health campus, Bethesda, MD, USA) was used to measure the diameter of the PCL domains inside the PA6 matrix.
Field emission scanning electron microscopy (FESEM) images of the cryo-fractured and the fractured surfaces, before and after the healing process, of the samples were acquired by using a Zeiss Supra 40 microscope, operating at an accelerating voltage of 3.5 kV. Prior to the observations, the specimens were sputtered with a Pt–Pd (80:20) conductive coating.

2.3.3. Chemical Properties

Fourier-transformed infrared (FT-IR) spectroscopy was performed in attenuated total reflectance (ATR) mode by using a Perkin-Elmer Spectrum One instrument (Perkin-Elmer GmbH, Waltham, MA, USA) equipped with a ZnSe crystal and operating in a wavenumber range 650–4000 cm−1. In order to reduce the signal-to-noise ratio, a hundred scans were collected for each spectrum (resolution 4 cm−1).

2.3.4. Thermal Properties

Differential scanning calorimetry (DSC) tests were conducted through a Mettler DSC30 machine under a nitrogen flow of 100 mL/min in a temperature range from −100 to 250 °C at a heating/cooling rate of 10 °C/min. All the specimens, with a weight of approximately 10 mg, were subjected first to a heating scan, a cooling scan, and a second heating scan. In this way, the thermal transitions of both the blend constituents were detected, in particular the glass transition temperature (Tg) of the PCL, the melting temperature and enthalpy (Tm, Δ H m ) of both the PCL and PA6, and the crystallization temperature and enthalpy (Tc, Δ H c ) of both the PCL and PA6. Equation (1) shows how the degree of crystallinity (χ) of the PA6 and PCL phases in the blends was evaluated.
χ = Δ H m Δ H c c Δ H m *   ω   · 100
where Δ H c c is the enthalpy of cold crystallization of the PA6 (or PCL), Δ H m * is the enthalpy of melting of fully crystalline PA6 (or PCL), equal to 230 J/g [33] and 139.5 J/g [34], respectively, and ω is the weight fraction of PA6 (or PCL) in the blends.
Thermogravimetric analysis (TGA) was performed through a Mettler TG50IR thermobalance (Mettler Toledo Inc., Columbus, OH, USA), testing samples of approximately 10 mg at 10 °C/min from 35 °C up to 700 °C, under a nitrogen flow of 100 mL/min. This test allowed the calculation of the temperature associated to a mass loss of 1% (T1%) and of 5% (T5%) and of the temperature associated to the maximum mass loss rate (TD) of both PCL and PA6 phases, considered as the peak of the mass loss derivative (DTG) curves.

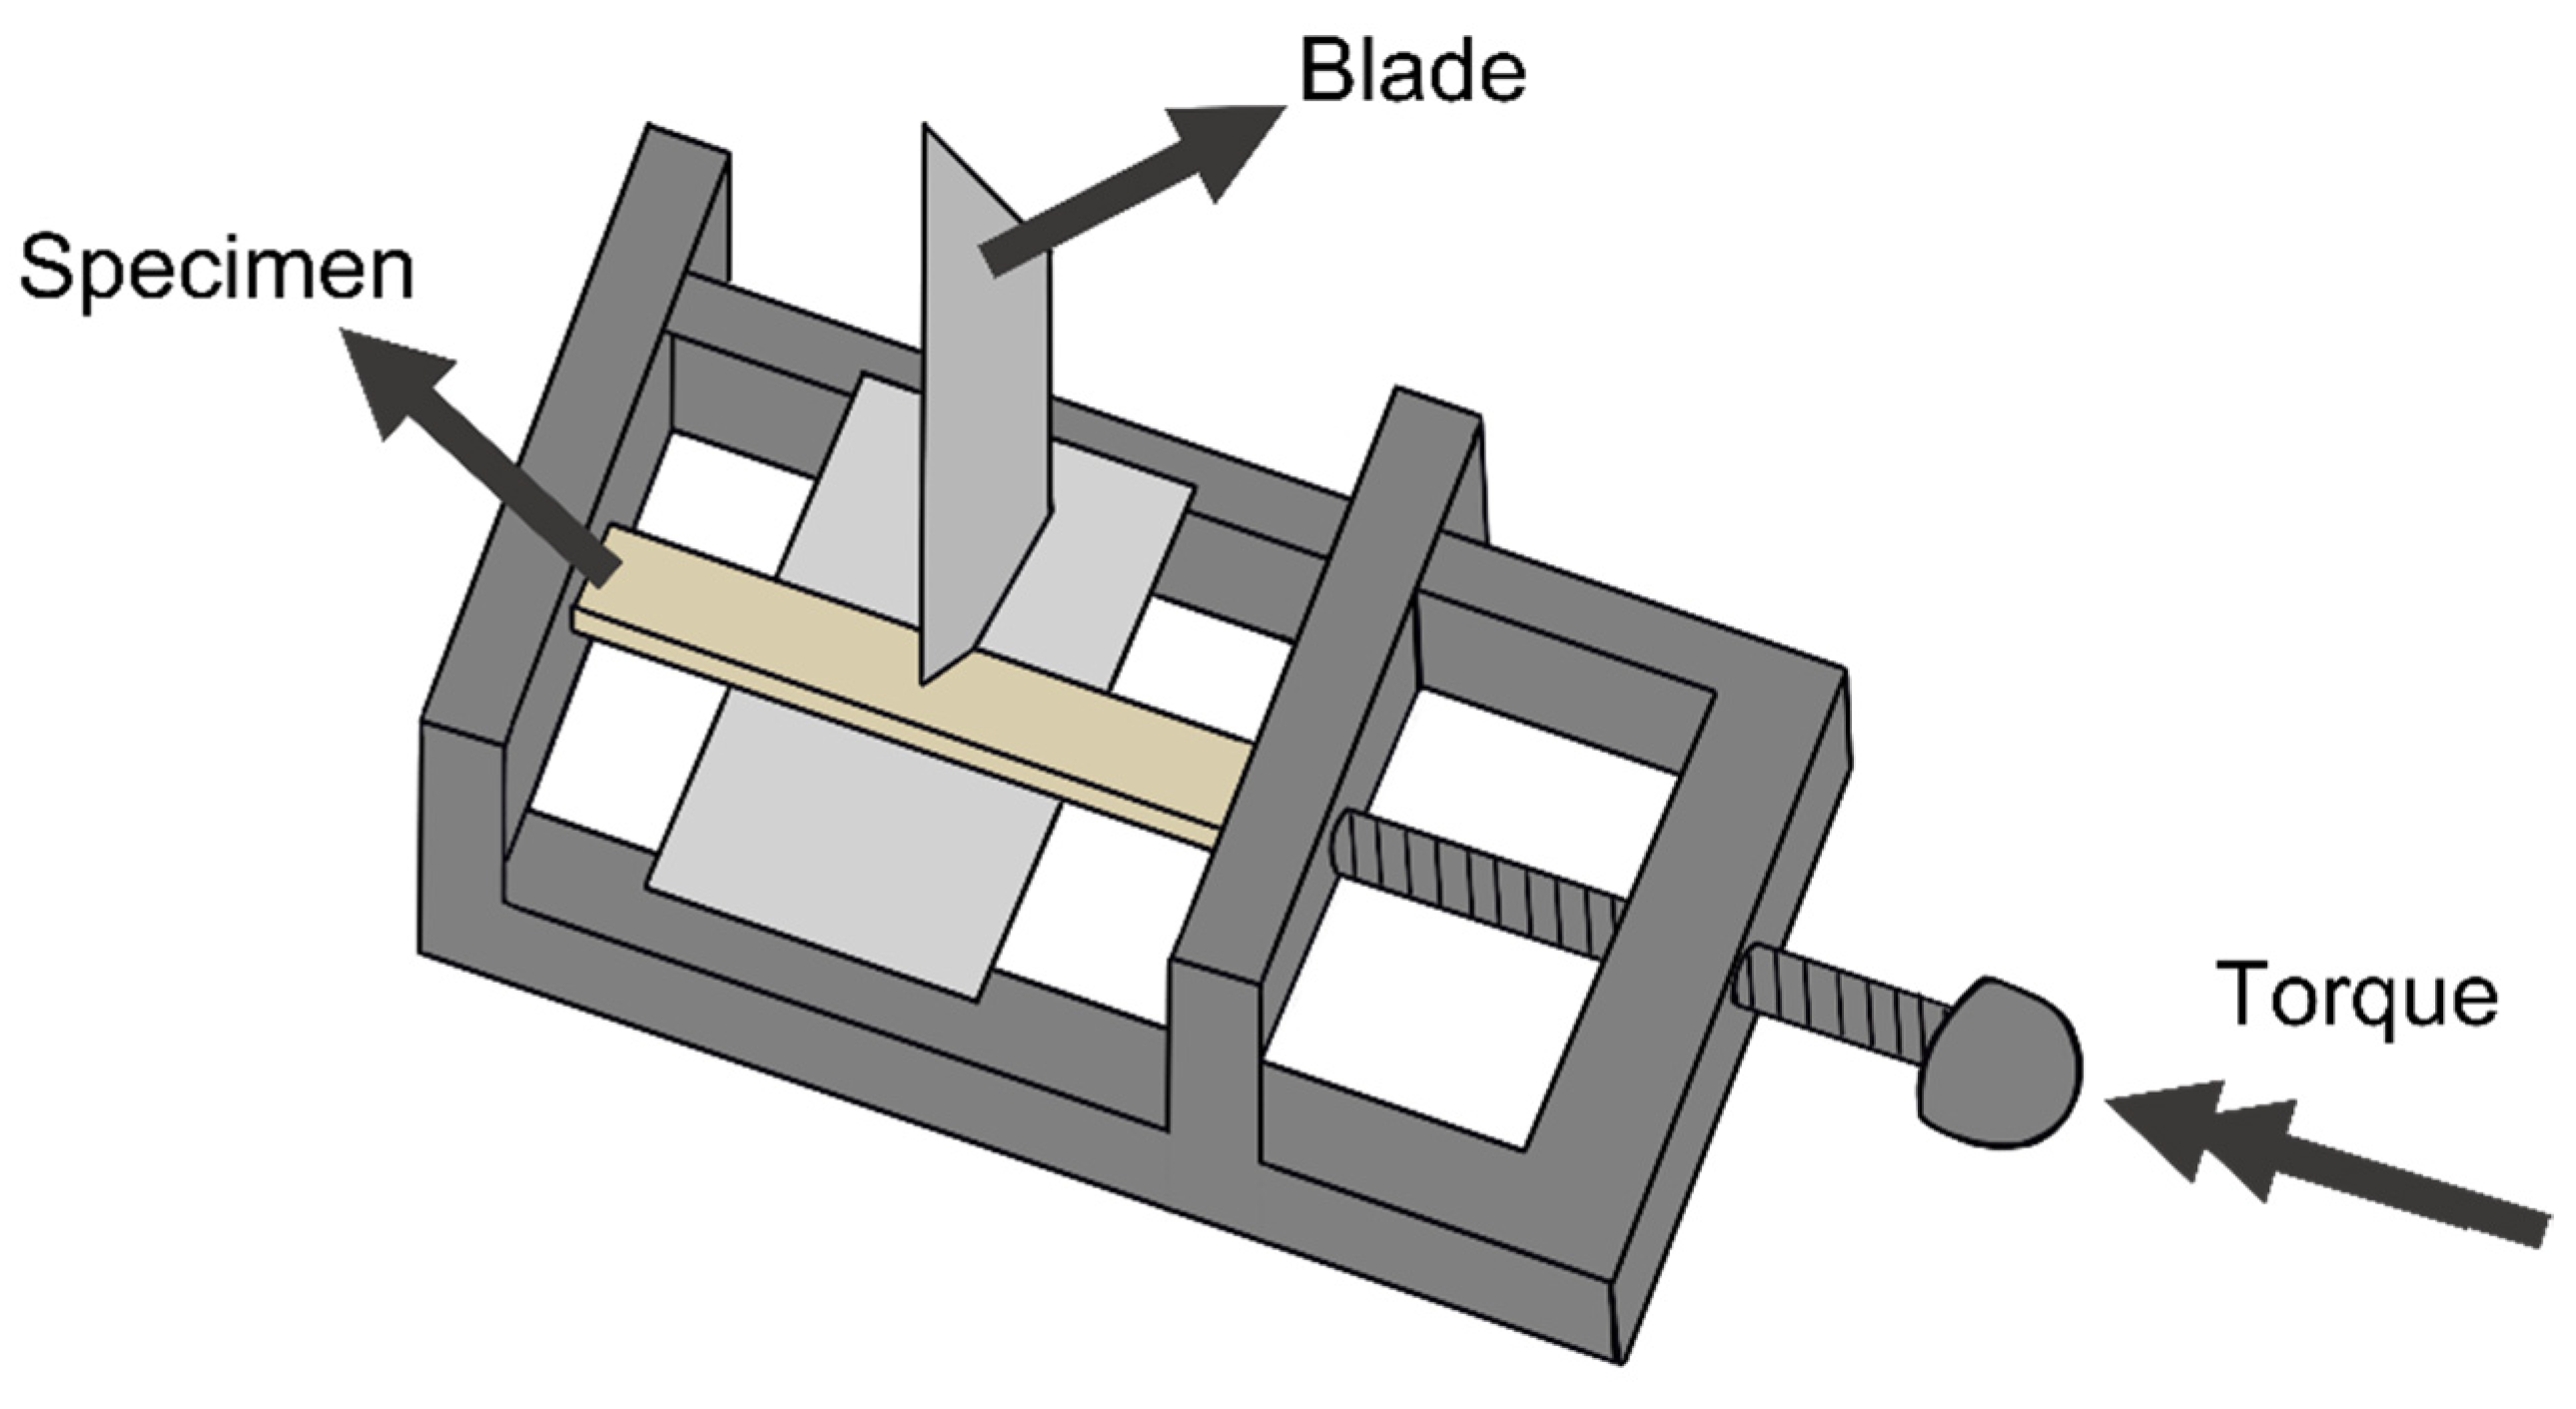
2.3.5. Mechanical Properties

Quasi-static tensile tests were carried out at room temperature using an Instron® 5969 tensile testing machine (ITW Test & Measurement and Equipment, Lake Bluff, IL, USA) equipped with a 1 kN load cell. The tests were performed on ISO 527 1BA specimens at a crosshead speed of 10 mm/min, and at least ten specimens were tested for each composition. In this way, the determination of the maximum stress (σmax) and of the strain at break (εb) was performed. The elastic modulus (E) was determined through tensile tests by using the same machine equipped with an Instron® 2620-601 extensometer, having a gauge length of 12.5 mm, at a crosshead speed of 0.25 mm/min. It was calculated as the secant modulus considering the stress levels associated to the strain values of 0.05% and 0.25%, as reported in the ISO-527 standard.
Regarding the modeling of the mechanical properties of the prepared blends, three different models were selected: series model (Equation (2)), parallel model (Equation (3)), and Maxwell–Eucken (ME) model (Equation (4)). The series and parallel models represent the upper and lower bounds of the mechanical properties, respectively. On the other hand, the Maxwell–Eucken (ME) model is able to predict the mechanical properties of a blend characterized by a droplet-matrix morphology [35].
P b   =   f P P A 6 + ( 1 f ) P P C L
P b   =   ( f P P A 6 + 1 f P P C L )
P b   =   P P A 6 f + P P C L ( 1 f ) 3 P P A 6 2 P P A 6 + P P C L f + ( 1 f ) 3 P P A 6 2 P P A 6 + P P C L
where Pb is the property of the blend, f is the volume fraction of PA6 in the sample, PPA6 is the property of neat PA6, and PPCL is the property of neat PCL.
The fracture toughness of the blends was evaluated according to the procedure described in the ASTM D5045 standard. The tests were carried out on Single Edge Notched Bending (SENB) specimens, having dimensions of 44 × 10 × 5 mm3, an initial notch length of 5 mm, and a span length of 40 mm. At least ten specimens were tested for each composition. Tests in quasi-static mode were performed in three-point bending configuration by using an Instron® 5969 electromechanical testing machine, at a crosshead speed of 10 mm/min. Tests in impact mode were performed using a Charpy impact machine provided by CEAST, following the ISO 17281 standard, and the load-displacement curves were recorded using a tup extensometer in the hammer. A mass of the hammer equal to 0.5 kg, a starting angle of 60°, and an impact speed of 1.5 m/s were utilized. From the load-displacement curves, the maximum load sustained by the samples (Pmax) was determined, and it was thus possible to obtain the critical stress intensity factor (KIC), both in quasi-static and impact conditions, according to the expressions reported in Equations (5) and (6):
K I C = ( P m a x B W 1 / 2 ) · f ( x )
f ( x ) = 6 x 1 / 2   1.99 x ( 1 x ) ( 2.15 3.93 x + 2.7 x 2 ) ( 1 + 2 x ) ( 1 x ) 3 / 2
where B is the thickness of the specimen, W is the width of the specimen, f(x) is a calibration factor, where x = a/W, and a is the notch length. Furthermore, according to ASTM D5045 standard, from the integration of the load-displacement curves, the critical strain energy release rate (GIC) values in quasi-static mode were also obtained, according to the expression reported in Equation (7):
G I C = Δ U B W φ
where ΔU is the difference between the total energy absorbed by the sample and the energy absorbed in the indentation tests and φ is an energy calibration factor, whose expression is reported in Equations (8)–(10):
φ = A + 18.64 d A / d x  
A = [ 16 x 2 ( 1 x ) 2 ] [ 8.9 33.717 x + 79.616   x 2 112.952 x 3 + 84.815 x 4 25.672 x 5 ]
d A d x = [ 16 x 2 ( 1 x ) 2 ] [ 33.717 + 159.232 x 338.856 x 2 + 339.26 x 3 128.36   x 4 ] + [ 32 x ( 1 x ) 3 ] [ 8.9 33.717 x + 79.616   x 2 112.952 x 3 + 84.815 x 4 25.672 x 5 ]

2.3.6. Evaluation of the Healing Efficiency

As reported in the introduction, a thermal mending process was performed to promote the intrinsic self-healing in the prepared blends. Specimens broken in fracture toughness tests both in quasi-static and impact mode were inserted in an iron vice with an applied pressure of 0.5 MPa and then healed in an oven at three different temperatures: 80, 100, and 140 °C. These parameters were selected after preliminary trials and on the basis of a previous paper by our group [36]. The selected temperatures were higher than the Tm of PCL and could also guarantee a sufficient macromolecular mobility of the healing agent within the PA6 matrix during the thermal mending process. A schematic representation of the device adopted for the healing process is shown in Figure 1. Before inserting the specimens in the iron vice, a polytetrafluoroethylene (PTFE) film was inserted below and on the extremity of the samples in order to limit their adhesion with the vice. The healing process was performed on neat PA6, and PA6_30PCL samples. Neat PA6 was selected as reference, while PA6_30PCL composition was chosen for its good quasi-static mechanical properties.
After the healing process, the samples were tested again in order to obtain the critical stress intensity factor of the healed specimens (KIC,Healed). The healing efficiency ( η K I C ) was evaluated through a comparison with the fracture toughness of the virgin specimens (KIC,virgin), as reported in Equation (11):
η K I C = K I C , H e a l e d K I C , V i r g i n × 100  

3. Results and Discussions

3.1. Rheological Properties

A complete rheological investigation was carried out on the produced blends in order to understand their processability and the miscibility conditions [37]. Figure 2a,b report the results obtained from the dynamic rheological measurements on the prepared blends in terms of dynamic moduli, i.e., storage and loss modulus, and complex viscosity. The low-frequency G′ values of the PA6_xPCL samples are slightly higher with respect to their individual components, especially in the case of the PA6_30PCL blend. In addition, by looking at the G′ plots, it can be observed that by increasing the PCL concentration, the storage modulus tends to increase. The presence of small PCL domains within the PA6 matrix could result in a superior energy storage capacity of the blends with respect to the neat constituents [38]. On the other hand, G″ values also tend to increase with the PCL content. Figure 2b reports the complex viscosity curves of all the produced blends, and the classic shear thinning behavior of polymeric materials can be detected [39], with a η* decrease at elevated frequencies [40]. The value of complex viscosity of the neat PA6 is significantly lower in comparison to that of the neat PCL over the whole frequency range, and an increase in the complex viscosity of the blends can be registered with the PCL content. It is possible to infer that the presence of PCL domains inside the PA6 matrix tends to hinder the motion of PA6 macromolecules at the molten state [41].
One of the possible ways to investigate the morphological changes in polymer blends at the molten state is through the so-called Cole–Cole plots. These plots represent the description of the viscoelastic properties of polymer blends characterized by high relaxation time distributions, thus highlighting phase separation phenomena within the blends [42]. In the Cole–Cole plot, the imaginary viscosity (η″) is reported as a function of real viscosity (η′), and in doing so, two different outcomes can be observed. If a smooth and semicircular arc of a curve is present, a good compatibility between the constituents of the polymer blend in the molten state can be predicted. On the other hand, if two different circular arcs or tails can be observed, the existence of phase heterogeneity and immiscibility within the blend can be demonstrated [43]. Another possible way of investigating the miscibility conditions of polymer blends is through the Han plot, in which the log G′ versus log G″ are reported, generally resulting in a linear correlation [44]. The compatibility of the polymer blend can be demonstrated if the slope of the obtained curves at different relative concentrations of the constituents is the same [45,46]. On the contrary, if these curves show different slopes, then the analyzed blend is considered to be immiscible [47,48]. Figure 3a reports the Cole–Cole plots of the neat matrices and of their blends. The relaxation process of both neat PA6 and neat PCL is described by a single circular arc, while by increasing the PCL fraction in the blends, the appearance of two-stage relaxation phenomena can be observed, thus proving the immiscibility of the prepared blends [49]. Furthermore, Figure 3b reports the Han plot of neat PA6, neat PCL, and of their blends. From these plots, it is possible to highlight a linear region at elevated G″ values, but the slope of these lines is systematically different, thus confirming that these blends can be considered immiscible [50,51].

3.2. Microstructural Properties

Through the optical microscopy it was possible to analyze the microstructure of the samples, specifically the PCL domains’ dispersion inside the PA6 matrix. Figure 4a–e shows the micrographs of the cross-section of the prepared blends obtained through light microscopy. From these images, it can be observed how different PCL domain dimensions can be found in the blends, especially at elevated PCL levels. Lower levels of PCL in the blends (namely 5 and 10 wt%) generally generate domains of reduced dimensions compared to blends with higher PCL contents (namely 20 and 30 wt%). An important fraction of small domains is present alongside larger domains, indicating the presence of coalescence phenomena, especially in blend compositions with higher PCL levels, as already shown by Dell’Erba et al. in a poly-L-lactic acid/polycaprolactone blend [52]. Moreover, the size distribution of PCL domains was fitted through a lognormal distribution, and the average domain size was reported in Figure 4f. This plot confirms that the dimension of PCL domains increases with the PCL content within the blends, passing from 0.96 μm for the PA6_5PCL sample to 1.93 μm for the PA6_30PCL composition. In any case, it is confirmed that the prepared blends are immiscible, and a clear phase separation occurs over the whole investigated concentration range.
FESEM analysis was performed on cryo-fractured specimens in order to observe the interaction between the blend constituents, and Figure 5a–f reports the micrographs of the prepared samples. Due to the fact that the prepared blends undergo phase separation, a droplet-matrix-type morphology can be detected [53]. The blend immiscibility is evident since the PCL domains are easily recognizable inside the PA6 matrix, and they are visibly smaller in the samples with lower PCL contents. These results are consistent with those obtained from the rheological analyses and LM micrographs (see Figure 3a,b) and Figure 4a–f. The PCL domains are well dispersed inside the PCL matrix, with a domain diameter distribution ranging from a few micrometers to tens of micrometers. Once again, the higher domain size detected for higher concentrations of PCL could be attributed to coalescence phenomena [54]. Furthermore, a rather poor interfacial adhesion can be observed between the two constituents at all the relative concentrations. In the recent work of Marischal et al. [55], the investigation of PA6/PCL blends filled with multiwalled carbon nanotubes was carried out, and in that case a lack of adhesion between the constituents was also observed. This lack of interfacial interactions could probably lead to a worsening of the mechanical properties of the prepared blends.

3.3. Chemical Properties

Figure 6a–c reports the FTIR spectra of the neat constituents and of the prepared blends. In particular, Figure 6b highlights the functional groups region of single bonds stretch (signals between 4000 cm−1 and 2500 cm−1), while Figure 6c shows the functional groups region of double bonds stretch and fingerprint region (signals between 2000 cm−1 and 650 cm−1). The spectrum of PA6 shows a signal at 3302 cm−1, which can be assigned to the N-H bending vibration of the amine [56]. The signal at 1646 cm−1 represents C=O amide stretching while the signal at 1551 cm−1 is associated with the combination of N-H and C-H stretching [57]. Moreover, the characteristic signal of polyamides corresponding to the N-H Fermi resonance can be identified at 3086 cm−1 [58]. The two signals at 2930 cm−1 and at 2862 cm−1 are associated with asymmetric and symmetric C−H stretching vibrations present in both polymers, respectively [59]. Considering the spectra of neat PCL, it shows a very sharp signal at 1750 cm−1, which corresponds to the ester group [60]. Regarding the spectra of PA6/PCL blends, most signals of the blend constituents are present with different intensity, generally proportional to their relative concentration in the blends. However, there are no signals which cannot be associated with either the PA6 or PCL phase in the blend samples, and no peak shifts due to physical (or chemical) interaction between the constituents can be detected. This is a further confirmation of the immiscibility of the blends over the whole range of investigated compositions.

3.4. Thermal Properties

The DSC thermograms of the analyzed blends are shown in Figure 7, while the most important results are summarized in Table 1. Concerning PA6, double melting phenomena can be observed at 219.8 and 226.3 °C, while its Tg can be detected in the proximity of 60 °C, even though the signal is particularly weak. Considering neat PCL, it exhibits a Tg approximately at −60 °C and melting phenomena at 60 °C, which are in perfect agreement with the values found in the literature [61]. It is immediately apparent how, as expected, signal intensity changes as a function of the relative composition of the samples. Specifically, melting and crystallization signals of PA6 experience an intensity loss with an increase in PCL content, while the intensity of the PCL melting and crystallization signals increases with the PCL amount. Moreover, it can be observed that there is no interaction between PA6 and PCL, due to the fact that the thermal properties of both PA6 and PCL phases are not substantially affected by the presence of another phase in the blends. The presence of double melting phenomena in the PA6 phase can be ascribed to its ability to form polymorphic crystals. Two different types of crystals can be formed; the first and most stable is labeled α-phase (with monoclinic cell), which is formed due to low under-cooling, whilst the second and the less stable is labeled γ-mesophase (with pseudo-hexagonal cell), which can be genrerated due to high under-cooling [62]. Through a peak deconvolution procedure, it was possible to discriminate the melting temperatures of both the α-phase (Tm2) and the γ-phase (Tm1). By adding PCL to the PA6 matrix, it can be observed that the generation of double melting phenomena tends to be enhanced, and the addition of PCL hinders the formation of more stable PA6 α-crystallites. However, both the melting and crystallization temperature of PA6 do not have significant variations with the PCL amount in the blends. It is extremely interesting to notice the change in the melting temperature of PCL between the first and second heating scans, as the second scan Tm is significantly lower than that observed in the first heating scan. This experimental evidence can be attributed to the fact that the blend was kept in a controlled atmosphere before testing, and PCL was thus able to reach a high degree of crystallinity, with a consequent increase in the melting temperature. During the DSC analysis, PCL did not have enough time to reach the same crystallinity degree, with a decrease in melting temperature in the second heating scan [63]. In any case, the immiscibility of the produced blends was demonstrated also through DSC analysis.
Figure 8a,b shows the TGA thermograms and the derivative thermogravimetric (DTG) curves of the constituents and of the prepared blends, whilst the most important results are summarized in Table 2. It can be observed that no residual mass is present at the end of the analysis, since the analyzed blend is fully organic and its decomposition products are volatiles. Given the degradation profile of the produced blends, it is thus possible to infer that the thermal degradation resistance is decreased by increasing the PCL amount in the blends. Both the T1% and T5% tend to decrease with the PCL concentration, going from 326.5 and 398.3 °C for neat PA6 down to 249.3 and 389.2 °C for neat PCL, respectively. However, the produced blends maintain acceptable thermal stability even at elevated PCL amounts.

3.5. Mechanical Properties

Figure 9a–c reports the trends of the elastic modulus (E), of the ultimate tensile strength (UTS), and of the elongation at break (εb) of all the prepared blends, obtained from quasi-static tensile tests. It is worth mentioning that two different behaviors can be identified during the test. PA6 and PA6/PCL samples do not present any yielding and have limited strain at break values, while the neat PCL shows an evident yielding and elevated elongation at break values (representative stress–strain curves were not reported for brevity). Generally speaking, the mechanical properties of the produced blends tend to decrease by increasing the PCL content. The elastic modulus decreases from 3.6 GPa for neat PA6 to 2.0 GPa for the PA6_30PCL sample (relative drop of 44%), the UTS decreases from 72.3 MPa for neat PA6 to 39.2 MPa for the PA6_30PCL blend (relative drop of 46%), and the elongation at break decreases from 6.6% for neat PA6 to 5.1% for the PA6_30PCL blend (relative drop of 23%). Several phenomena tend to influence the mechanical properties of an immiscible polymer blend, such as cavitation during the deformation process, the limited mechanical properties of the dispersed phase, and the limited interfacial adhesion between the constituents [64]. The immiscibility of the produced blends was demonstrated in several analyses, i.e., the Cole–Cole plot (Figure 3a), in which different relaxation processes can be observed, and the SEM micrographs (Figure 5), in which the limited interfacial adhesion between PA6 and PCL can be observed. Thus, the limited interaction between the constituents, together with the lower mechanical properties of the dispersed phase, leads to a general decrease in the mechanical properties of these blends. The mechanical properties of the prepared blends were modeled through the expressions reported in Equations (2)–(4). It can be seen that the trend of the elastic modulus of the blends is not correctly modeled by the used models, and in particular, it is possible to see that the ME model fails to predict the stiffness of the blends at limited PCL amounts. Both the UTS and the εb values of the prepared blends are overestimated by the three models considered, and the reason could be the very low adhesion between the two constituents.
The results reported in Table 3 describe the fracture behavior of the prepared blends in quasi-static mode and impact mode and in particular, the trends of the KIC and of the GIC as a function of the volume fraction of PCL. The specimens containing PCL did not completely fulfill the elasticity requirements reported in the ASTM D5045 standard, owing to the excessive plasticization of the PCL phase within the blends, and thus the tentative value of the fracture toughness (KQ) was considered in this plot. The obtained KIC value for neat PA6 is 2.8 MPa·m1/2, and, interestingly, for low amounts of PCL, both KIC and GIC increase due to toughening mechanisms played by the presence of PCL [65]. The increase of both KIC and GIC at limited PCL concentrations could be attributed to the toughening mechanism known as particle debonding [66,67]. This mechanism is responsible for an alteration of the stress state in the surrounding matrix enabling the matrix to yield at low-stress levels, and thus initiating the plastic deformation inside the matrix, with a consequent increase in the absorbed fracture energy [68,69]. This hypothesis will be confirmed by the results of the microstructural analysis reported hereafter. On the other hand, at higher percentages of PCL, the fracture toughness slightly decreases due to the lower fracture toughness of PCL. However, the observed drop in fracture toughness at elevated PCL amounts is not dramatic. Overall, the fracture toughness under quasi-static conditions of the PA6 is not negatively affected by the introduction of PCL, even if the two polymers are immiscible. Concerning the results obtained in impact mode, it can be observed that for low concentrations of PCL, the KIC of the blends is comparable with that of neat PA6, and the slight decrease observed for elevated PCL content can be probably attributed to the limited adhesion between the PCL and the PA6 matrix. Moreover, the KIC values calculated in impact mode are significantly higher than those reported in quasi-static conditions, and a possible reason can be related to the higher deformation speed, which may lead to the activation of different fracture mechanisms.
Figure 10 reports the SEM micrographs of the tested SENB specimens in both quasi-static and impact mode. The surface of the tested specimens in quasi-static conditions is noticeably different with respect to that observed in impact mode. In quasi-static mode, it is possible to see that the fracture surface of the PA6_20PCL and PA6_30 PCL blends is quite irregular, the PA6 matrix is plastically deformed, and the voids formed during the particle debonding process are clearly visible. Particle debonding and PA6 matrix deformation dissipates a large amount of energy; in these conditions crack propagation is hindered [70]. The observed morphology clearly explains the improvement in the fracture toughness of the prepared blends observed in quasi-static conditions. On the contrary, the surfaces of the specimens tested in impact mode are much smoother, with no plastic deformation phenomena. Indeed, the particle debonding toughening mechanism does occur, since the voids left by PCL domains can be clearly detected, but this effect is counterbalanced by the lack of plastic deformation of the PA6 matrix [71].

3.6. Evaluation of Healing Efficiency

The KIC values obtained in quasi-static and impact mode for the blend containing 30 wt% of PCL, before and after the healing process, are reported in Figure 11. By looking at the obtained results, the healing efficiency in quasi-static mode is 5.8% and 4.9% for the healing performed at 80 and 100 °C, respectively. On the other hand, in impact mode, the healing efficiency is 51.5 and 53.0% at the same healing temperatures. Furthermore, the healing efficiency of neat PA6 at 140 °C is 0%, since only PCL is capable of melting and flowing into the crack area during the healing process. Therefore, it is interesting to observe that the overall healing efficiency evaluated in impact mode is significantly higher with respect to that observed in quasi-static mode. The reason behind this discrepancy is related to the different testing speed adopted in these two tests, which produces different fracture surface morphology, as reported in Figure 10. The fracture surface of the specimen tested in quasi-static mode is heavily plastically deformed, thus resulting in a high specific surface area. On the contrary, the fracture surface of the specimens tested in impact mode does not report any deformation, and therefore the specific surface areas are rather low. Being that the PCL domains are evenly distributed in both quasi-static and impact mode samples, if the specific surface area of the crack is higher, then the PCL will fill the cracked area in a more difficult and non-efficient way, as the diffusion of the molten healing agent in the crack zone will be hindered by the presence of a jagged surface. Surprisingly, the healing efficiency obtained for the sample healed at 140 °C is zero, as the fracture surfaces were not attached after the thermal mending treatment.
The differences in the quasi-static and impact mode fracture surfaces, before and after the healing process, are the key to understanding the reason for the different healing efficiency values obtained. Thus, the SEM micrographs of the crack propagation surfaces before and after the healing process in quasi-static mode and in impact mode of the PA6_30PCL blend are reported in Figure 12. Regardless to the testing speed, the fracture surfaces after the healing process have a much smoother appearance, and the PCL domains are transformed into a thin film, as also reported in the work of Dorigato et al. on an epoxy/PCL intrinsic self-healing matrix [72]. As previously explained, the samples tested in quasi-static mode present a higher specific surface area with respect to those tested in impact mode. Thus, the PCL layer is not able to fill the crack as efficiently as in the specimens tested in impact mode. Regarding the specimens tested in impact mode, it is possible to see that the PCL layer is covering the majority of the fracture surface, thus efficiently healing the damaged area. On the other hand, by increasing the healing temperature to 140 °C, something strange happens. The PCL only partially remains on the fractured surface, while the greatest part flows out, over the Teflon film. The reason for this phenomenon is that the healing temperature is too high, thus enabling the PCL to melt and flow even outside the specimens. Although PCL could be an effective healing agent, its adhesion with the PA6 matrix is very poor, and therefore the healing efficiency of the prepared PA6/PCL systems is rather limited. Therefore, this work demonstrates the possibility to partially heal PA6 matrices utilized in TPCs with the introduction of a proper amount of PCL and the selection of a proper healing temperature. However, further improvements will be necessary to increase the efficiency of the healing process. For instance, the overall healing efficiency could be increased by means of a proper compatibilizer. For instance, the use of a glycidyl methacrylate compatibilizer could significantly improve the adhesion between PA6 and PCL constituents. The epoxide groups present in this compatibilizer could react with the hydroxyl group of PCL and the carboxyl groups of PA6, thus producing ester linkages at the interface between PA6 and PCL [73]. This could lead to an increase in the overall healing efficiency, both in quasi-static and impact mode.

4. Conclusions

In this work, PA6/PCL blends were developed and characterized in order to explore their possible application as thermoplastic matrices for structural composites with thermally activated self-healing properties. The healing process was carried out through thermal mending, exploiting the limited melting temperature of the healing agent (PCL). The interactions between blend constituents in the prepared blends were analyzed through rheological measurements, and the blend was identified as immiscible. The morphology of the produced blends was investigated through optical microscopy and FESEM, highlighting a good dispersion of PCL domains inside the PA6 matrix, with a dimension ranging from a few micrometers to tens of micrometers, and confirming the immiscibility of the blends. The mechanical properties of the materials were evaluated through quasi-static tensile tests and fracture toughness tests, performed both in quasi-static mode and impact mode. The PCL addition caused a significant decrease in elastic modulus, passing from 3.6 GPa of neat PA6 to 1.9 GPa of PA6_30PCL. Furthermore, the ultimate tensile strength decreased from 72.3 MPa of neat PA6 to 39.2 MPa of PA6_30PCL. The worsening of the mechanical properties was due to the lower mechanical properties of PCL compared to PA6 and to the blend immiscibility. On the other hand, the fracture toughness of the blends was not dramatically affected by the PCL introduction, both in quasi-static and impact mode. The healing efficiency values, evaluated as the ratio of the KIC before and after the healing process, were then determined. The healing processes, performed in a temperature interval between 80 and 100 °C, led to a healing efficiency for the PA6_30PCL sample up to 6% in quasi-static mode and 53% in impact conditions. Through the FESEM analysis of the fracture surfaces before and after the healing process, it was possible to highlight that during the mending processes at 80 and 100 °C, the PCL domains melted, enabling the healing agent to flow, and thus producing a molten PCL layer across the surface. The diffusion of the molten healing agent in the crack zone, and thus the resulting healing efficiency, was strictly correlated to the roughness of the fracture surface. Considering the obtained results, further investigations must be performed to optimize the healing process in order to increase its efficiency, also by taking into consideration the use of compatibilizers. In the future, these matrices, coupled with reinforcing fibers, could be utilized in novel self-healing TPCs for structural applications.

Author Contributions

Conceptualization, D.P. and A.D.; methodology, D.P. and G.O.; software, G.O.; validation, D.P. and G.O.; formal analysis, D.P. and G.O.; investigation, G.O.; resources, A.D. and A.P.; data curation, D.P. and G.O.; writing—original draft preparation, D.P. and G.O.; writing—review and editing, D.P., G.O., A.D., and A.P.; visualization, D.P.; supervision, D.P. and A.D.; project administration, A.D.; funding acquisition, A.D. and A.P. All authors have read and agreed to the published version of the manuscript.

Funding

This research received no external funding.

Institutional Review Board Statement

Not applicable.

Informed Consent Statement

Not applicable.

Data Availability Statement

Not applicable.

Conflicts of Interest

The authors declare no conflict of interest.

References

  1. Das, T.K.; Ghosh, P.; Das, N.C. Preparation, development, outcomes, and application versatility of carbon fiber-based polymer composites: A review. Adv. Compos. Hybrid Mater. 2019, 2, 214–233. [Google Scholar] [CrossRef]
  2. Fafenrot, S.; Korger, M.; Ehrmann, A. 20-Mechanical properties of composites from textiles and three-dimensional printed materials. In Mechanical and Physical Testing of Biocomposites, Fibre-Reinforced Composites and Hybrid Composites; Jawaid, M., Thariq, M., Saba, N., Eds.; Woodhead Publishing: Sawston, UK, 2019; pp. 409–425. [Google Scholar]
  3. Papadopoulos, G.A.; Papanicolaou, G.C. Dynamic crack propagation in rubber-modified composite models. J. Mater. Sci. 1988, 23, 3421–3434. [Google Scholar] [CrossRef]
  4. Katnam, K.B.; Comer, A.J.; Roy, D.; da Silva, L.F.M.; Young, T.M. Composite Repair in Wind Turbine Blades: An Overview. J. Adhes. 2015, 91, 113–139. [Google Scholar] [CrossRef]
  5. Kanu, N.J.; Gupta, E.; Vates, U.K.; Singh, G.K. Self-healing composites: A state-of-the-art review. Compos. Part A Appl. Sci. Manuf. 2019, 121, 474–486. [Google Scholar] [CrossRef]
  6. Khan, A.; Ahmed, N.; Rabnawaz, M. Covalent Adaptable Network and Self-Healing Materials: Current Trends and Future Prospects in Sustainability. Polymers 2020, 12, 2027. [Google Scholar] [CrossRef] [PubMed]
  7. Van der Zwaag, S.; Brinkman, E. Self Healing Materials: Pioneering Research in the Netherlands; IOS Press: Amsterdam, The Netherlands, 2015. [Google Scholar]
  8. Utrera-Barrios, S.; Verdejo, R.; López-Manchado, M.A.; Santana, M.H. Evolution of self-healing elastomers, from extrinsic to combined intrinsic mechanisms: A review. Mater. Horiz. 2020, 7, 2882–2902. [Google Scholar] [CrossRef]
  9. Mobaraki, M.; Ghaffari, M.; Mozafari, M. Basics of self-healing composite materials. In Self-Healing Composite Materials; Elsevier: Amsterdam, The Netherlands, 2020; pp. 15–31. [Google Scholar]
  10. Idumah, C.I. Recent advancements in self-healing polymers, polymer blends, and nanocomposites. Polym. Polym. Compos. 2020, 29, 246–258. [Google Scholar] [CrossRef]
  11. Billiet, S.; Hillewaere, X.K.D.; Teixeira, R.F.A.; Du Prez, F.E. Chemistry of Crosslinking Processes for Self-Healing Polymers. Macromol. Rapid Commun. 2013, 34, 290–309. [Google Scholar] [CrossRef]
  12. Bekas, D.G.; Tsirka, K.; Baltzis, D.; Paipetis, A.S. Self-healing materials: A review of advances in materials, evaluation, characterization and monitoring techniques. Compos. Part B Eng. 2016, 87, 92–119. [Google Scholar] [CrossRef]
  13. Luterbacher, R.; Coope, T.S.; Trask, R.S.; Bond, I.P. Vascular self-healing within carbon fibre reinforced polymer stringer run-out configurations. Compos. Sci. Technol. 2016, 136, 67–75. [Google Scholar] [CrossRef]
  14. Wang, Y.; Pham, D.T.; Ji, C. Self-healing composites: A review. Cogent Eng. 2015, 2, 1075686. [Google Scholar] [CrossRef] [Green Version]
  15. Banshiwal, J.K.; Tripathi, D.N. Self-healing polymer composites for structural application. In Functional Materials; Sahu, D.R., Ed.; Intechopen: London, UK, 2019. [Google Scholar]
  16. Garcia, S.J. Effect of polymer architecture on the intrinsic self-healing character of polymers. Eur. Polym. J. 2014, 53, 118–125. [Google Scholar] [CrossRef] [Green Version]
  17. Wool, R.P.; O’Connor, K.M. A theory crack healing in polymers. J. Appl. Phys. 1981, 52, 5953–5963. [Google Scholar] [CrossRef]
  18. Herbst, F.; Döhler, D.; Michael, P.; Binder, W.H. Self-Healing Polymers via Supramolecular Forces. Macromol. Rapid Commun. 2013, 34, 203–220. [Google Scholar] [CrossRef] [PubMed]
  19. Swait, T.J.; Rauf, A.; Grainger, R.; Bailey, P.B.S.; Lafferty, A.D.; Fleet, E.J.; Hand, R.J.; Hayes, S.A. Smart composite materials for self-sensing and self-healing. Plast. Rubber Compos. 2012, 41, 215–224. [Google Scholar] [CrossRef]
  20. Meng, H.; Li, G. A review of stimuli-responsive shape memory polymer composites. Polymer 2013, 54, 2199–2221. [Google Scholar]
  21. Karger-Kocsis, J. Self-healing properties of epoxy resins with poly(ε-caprolactone) healing agent. Polym. Bull. 2016, 73, 3081–3093. [Google Scholar] [CrossRef] [Green Version]
  22. Bhattacharya, S.; Hailstone, R.; Lewis, C.L. Thermoplastic Blend Exhibiting Shape Memory-Assisted Self-Healing Functionality. ACS Appl. Mater. Interfaces 2020, 12, 46733–46742. [Google Scholar] [CrossRef]
  23. Bernatas, R.; Dagréou, S.; Despax-Ferreres, A.; Barasinski, A. Recycling of fiber reinforced composites with a focus on thermoplastic composites. Clean. Eng. Technol. 2021, 5, 100272. [Google Scholar] [CrossRef]
  24. Li, H.; Englund, K. Recycling of carbon fiber-reinforced thermoplastic composite wastes from the aerospace industry. J. Compos. Mater. 2016, 51, 1265–1273. [Google Scholar] [CrossRef]
  25. Stewart, R. Thermoplastic composites-recyclable and fast to process. Reinf. Plast. 2011, 55, 22–28. [Google Scholar] [CrossRef]
  26. Luo, X.; Ou, R.; Eberly, D.E.; Singhal, A.; Viratyaporn, W.; Mather, P.T. A Thermoplastic/Thermoset Blend Exhibiting Thermal Mending and Reversible Adhesion. ACS Appl. Mater. Interfaces 2009, 1, 612–620. [Google Scholar] [CrossRef] [PubMed]
  27. Cohades, A.; Manfredi, E.; Plummer, C.J.G.; Michaud, V. Thermal mending in immiscible poly(ε-caprolactone)/epoxy blends. Eur. Polym. J. 2016, 81, 114–128. [Google Scholar] [CrossRef] [Green Version]
  28. Xu, X.; Fan, P.; Ren, J.; Cheng, Y.; Ren, J.; Zhao, J.; Song, R. Self-healing thermoplastic polyurethane (TPU)/polycaprolactone (PCL) /multi-wall carbon nanotubes (MWCNTs) blend as shape-memory composites. Compos. Sci. Technol. 2018, 168, 255–262. [Google Scholar] [CrossRef]
  29. Lai, S.-M.; Liu, J.-L.; Huang, Y.-H. Preparation of Self-healing Natural Rubber/Polycaprolactone (NR/PCL) Blends. J. Macromol. Sci. Part B 2020, 59, 587–607. [Google Scholar] [CrossRef]
  30. Nguyen-Tran, H.-D.; Hoang, V.-T.; Do, V.-T.; Chun, D.-M.; Yum, Y.-J. Effect of Multiwalled Carbon Nanotubes on the Mechanical Properties of Carbon Fiber-Reinforced Polyamide-6/Polypropylene Composites for Lightweight Automotive Parts. Materials 2018, 11, 429. [Google Scholar] [CrossRef] [Green Version]
  31. Diesendruck, C.E.; Sottos, N.R.; Moore, J.S.; White, S.R. Biomimetic Self-Healing. Angew. Chem. Int. Ed. 2015, 54, 10428–10447. [Google Scholar] [CrossRef]
  32. Dorigato, A.; Mahmood, H.; Pegoretti, A. Optimization of the thermal mending process in epoxy/cyclic olefin copolymer blends. J. Appl. Polym. Sci. 2021, 138, 49937. [Google Scholar] [CrossRef]
  33. Millot, C.; Fillot, L.-A.; Lame, O.; Sotta, P.; Seguela, R. Assessment of polyamide-6 crystallinity by DSC. J. Therm. Anal. Calorim. 2015, 122, 307–314. [Google Scholar] [CrossRef]
  34. Gupta, B.; Geeta; Ray, A.R. Preparation of poly(ε-caprolactone)/poly(ε-caprolactone-co-lactide) (PCL/PLCL) blend filament by melt spinning. J. Appl. Polym. Sci. 2012, 123, 1944–1950. [Google Scholar] [CrossRef]
  35. Wang, J.F.; Carson, J.K.; North, M.F.; Cleland, D.J. A knotted and interconnected skeleton structural model for predicting Young’s modulus of binary phase polymer blends. Polym. Eng. Sci. 2010, 50, 643–651. [Google Scholar] [CrossRef]
  36. Zovi, R.C.; Mahmood, H.; Dorigato, A.; Fredi, G.; Pegoretti, A. Cyclic Olefin Copolymer Interleaves for Thermally Mendable Carbon/Epoxy Laminates. Molecules 2020, 25, 5347. [Google Scholar] [CrossRef] [PubMed]
  37. Sadiku-Agboola, O.; Sadiku, E.R.; Adegbola, A.T.; Biotidara, O.F. Rheological Properties of Polymers: Structure and Morphology of Molten Polymer Blends. Mater. Sci. Appl. 2011, 2, 30–41. [Google Scholar] [CrossRef] [Green Version]
  38. Khalili, R.; Jafari, S.H.; Saeb, M.R.; Khonakdar, H.A.; Wagenknecht, U.; Heinrich, G. Toward In Situ Compatibilization of Polyolefin Ternary Blends through Morphological Manipulations. Macromol. Mater. Eng. 2014, 299, 1197–1212. [Google Scholar] [CrossRef]
  39. Poslinski, A.J.; Ryan, M.E.; Gupta, R.K.; Seshadri, S.G.; Frechette, F.J. Rheological Behavior of Filled Polymeric Systems I. Yield Stress and Shear-Thinning Effects. J. Rheol. 1988, 32, 703–735. [Google Scholar] [CrossRef]
  40. Lee, H.M.; Park, O.O. Rheology and dynamics of immiscible polymer blends. J. Rheol. 1994, 38, 1405–1425. [Google Scholar] [CrossRef]
  41. Butnaru, I.; Fernández-Ronco, M.P.; Czech-Polak, J.; Heneczkowski, M.; Bruma, M.; Gaan, S. Effect of Meltable Triazine-DOPO Additive on Rheological, Mechanical, and Flammability Properties of PA6. Polymers 2015, 7, 1541–1563. [Google Scholar] [CrossRef] [Green Version]
  42. Salehiyan, R.; Ray, S.S.; Stadler, F.J.; Ojijo, V. Rheology–Microstructure Relationships in Melt-Processed Polylactide/Poly(vinylidene Fluoride) Blends. Materials 2018, 11, 2450. [Google Scholar] [CrossRef] [Green Version]
  43. Codou, A.; Anstey, A.; Misra, M.; Mohanty, A.K. Novel compatibilized nylon-based ternary blends with polypropylene and poly(lactic acid): Morphology evolution and rheological behaviour. RSC Adv. 2018, 8, 15709–15724. [Google Scholar] [CrossRef] [Green Version]
  44. Han, C.D.; Kim, J. Rheological technique for determining the order–disorder transition of block copolymers. J. Polym. Sci. Part B Polym. Phys. 1987, 25, 1741–1764. [Google Scholar] [CrossRef]
  45. Chopra, D.; Kontopoulou, M.; Vlassopoulos, D.; Hatzikiriakos, S.G. Effect of maleic anhydride content on the rheology and phase behavior of poly(styrene-co-maleic anhydride)/poly(methyl methacrylate) blends. Rheol. Acta 2002, 41, 10–24. [Google Scholar]
  46. Jafari, S.H.; Pötschke, P.; Stephan, M.; Warth, H.; Alberts, H. Multicomponent blends based on polyamide 6 and styrenic polymers: Morphology and melt rheology. Polymer 2002, 43, 6985–6992. [Google Scholar] [CrossRef]
  47. Lamnawar, K.; Vion-Loisel, F.; Maazouz, A. Rheological, morphological, and heat seal properties of linear low density polyethylene and cyclo olefine copolymer (LLDPE/COC) blends. J. Appl. Polym. Sci. 2010, 116, 2015–2022. [Google Scholar] [CrossRef]
  48. Walha, F.; Lamnawar, K.; Maazouz, A.; Jaziri, M. Rheological, Morphological and Mechanical Studies of Sustainably Sourced Polymer Blends Based on Poly(Lactic Acid) and Polyamide 11. Polymers 2016, 8, 61. [Google Scholar] [CrossRef] [PubMed] [Green Version]
  49. Li, L.; Yin, B.; Zhou, Y.; Gong, L.; Yang, M.B.; Xie, B.; Chen, C. Characterization of PA6/EPDM-g-MA/HDPE ternary blends: The role of core-shell structure. Polymer 2012, 53, 3043–3051. [Google Scholar] [CrossRef]
  50. Zhang, Y.; Zuo, M.; Song, Y.; Yan, X.; Zheng, Q. Dynamic rheology and dielectric relaxation of poly(vinylidene fluoride)/poly(methyl methacrylate) blends. Compos. Sci. Technol. 2015, 106, 39–46. [Google Scholar] [CrossRef]
  51. Kwag, H.; Rana, D.; Cho, K.; Rhee, J.; Woo, T.; Lee, B.H.; Choe, S. Binary blends of metallocene polyethylene with conventional polyolefins: Rheological and morphological properties. Polym. Eng. Sci. 2000, 40, 1672–1681. [Google Scholar] [CrossRef]
  52. Dell′Erba, R.; Groeninckx, G.; Maglio, G.; Malinconico, M.; Migliozzi, A. Immiscible polymer blends of semicrystalline biocompatible components: Thermal properties and phase morphology analysis of PLLA/PCL blends. Polymer 2001, 42, 7831–7840. [Google Scholar] [CrossRef] [Green Version]
  53. Utracki, L.A.; Shi, Z.H. Development of polymer blend morphology during compounding in a twin-screw extruder. Part I: Droplet dispersion and coalescence—A review. Polym. Eng. Sci. 1992, 32, 1824–1833. [Google Scholar] [CrossRef]
  54. Rossato, J.H.H.; Lemos, H.G.; Mantovani, G.L. The influence of viscosity and composition of ABS on the ABS/SBS blend morphology and properties. J. Appl. Polym. Sci. 2019, 136, 47075. [Google Scholar] [CrossRef]
  55. Marischal, L.; Cayla, A.; Lemort, G.; Campagne, C.; Devaux, É. Selection of Immiscible Polymer Blends Filled with Carbon Nanotubes for Heating Applications. Polymers 2019, 11, 1827. [Google Scholar] [CrossRef] [PubMed] [Green Version]
  56. Yeh, J.T.; Wei, W.; Tsai, F.C.; Lai, Y.C. Drawing Properties of Modified Polyamide 6 Fibers. Adv. Mater. Res. 2011, 189–193, 3031–3034. [Google Scholar] [CrossRef]
  57. Cakir, S.; Jasinska-Walc, L.; Villani, M.; Hansen, M.R.; Koning, C.E. Morphology and local chain structure of polyamide 6 modified in the solid state with a semi-aromatic nylon salt. Mater. Today Commun. 2015, 2, e62–e69. [Google Scholar] [CrossRef]
  58. Lee, K.H.; Kim, K.W.; Pesapane, A.; Kim, H.Y.; Rabolt, J.F. Polarized FT-IR Study of Macroscopically Oriented Electrospun Nylon-6 Nanofibers. Macromolecules 2008, 41, 1494–1498. [Google Scholar] [CrossRef]
  59. Colthup, N.B. Infrared Spectroscopy. In Encyclopedia of Physical Science and Technology, 3rd ed.; Meyers, R.A., Ed.; Academic Press: New York, NY, USA, 2003; pp. 793–816. [Google Scholar]
  60. Benkaddour, A.; Jradi, K.; Robert, S.; Daneault, C. Grafting of Polycaprolactone on Oxidized Nanocelluloses by Click Chemistry. Nanomaterials 2013, 3, 141–157. [Google Scholar] [CrossRef] [Green Version]
  61. Mohamed, A.; Finkenstadt, V.L.; Gordon, S.H.; Biresaw, G.; Palmquist, D.E.; Rayas-Duarte, P. Thermal properties of PCL/gluten bioblends characterized by TGA, DSC, SEM, and infrared-PAS. J. Appl. Polym. Sci. 2008, 110, 3256–3266. [Google Scholar] [CrossRef]
  62. Parodi, E.; Govaert, L.E.; Peters, G.W.M. Glass transition temperature versus structure of polyamide 6: A flash-DSC study. Thermochim. Acta 2017, 657, 110–122. [Google Scholar] [CrossRef]
  63. Amestoy, H.; Diego, P.; Meaurio, E.; Muñoz, J.; Sarasua, J.-R. Crystallization Behavior and Mechanical Properties of Poly(ε-caprolactone) Reinforced with Barium Sulfate Submicron Particles. Materials 2021, 14, 2368. [Google Scholar] [CrossRef]
  64. Bartczak, Z.; Galeski, A. Mechanical Properties of Polymer Blends. In Polymer Blends Handbook; Utracki, L.A., Wilkie, C.A., Eds.; Springer: Dordrecht, The Netherlands, 2014; pp. 1203–1297. [Google Scholar]
  65. Kılıçoğlu, M.; Bat, E.; Gündüz, G.; Yıldırım, M.U.; Urgun, K.; Maviş, B. Fibers of thermoplastic polymer blends activate multiple interlayer toughening mechanisms. Compos. Part A Appl. Sci. Manuf. 2022, 158, 106982. [Google Scholar] [CrossRef]
  66. Bucknall, C.B.; Paul, D.R. Notched impact behavior of polymer blends: Part 1: New model for particle size dependence. Polymer 2009, 50, 5539–5548. [Google Scholar] [CrossRef] [Green Version]
  67. Bucknall, C.B.; Paul, D.R. Notched impact behaviour of polymer blends: Part 2: Dependence of critical particle size on rubber particle volume fraction. Polymer 2013, 54, 320–329. [Google Scholar] [CrossRef]
  68. Argon, A.S.; Cohen, R.E. Toughenability of polymers. Polymer 2003, 44, 6013–6032. [Google Scholar] [CrossRef]
  69. Bucknall, C.B. Deformation mechanisms in rubber-toughened polymers. In Polymer Blends Volume 2: Performance; Paul, D.R., Bucknall, C.B., Eds.; Wiley-Interscience: New York, NY, USA, 2000; pp. 83–117. [Google Scholar]
  70. Chen, Z.; Zhou, Y.; Wu, Y.; Liu, S.; Huang, H.; Zhao, J. Fluorinated polyimide with polyhedral oligomeric silsesquioxane aggregates: Toward low dielectric constant and high toughness. Compos. Sci. Technol. 2019, 181, 107700. [Google Scholar] [CrossRef]
  71. Musteață, A.; Pelin, G.; Botan, M.; Popescu, A.; Deleanu, L. The Behavior of Polymeric Blends (PP + PA6) in Tensile Tests. Mater. Plast. 2020, 57, 153–166. [Google Scholar] [CrossRef]
  72. Dorigato, A.; Rigotti, D.; Pegoretti, A. Novel Poly(Caprolactone)/Epoxy Blends by Additive Manufacturing. Materials 2020, 13, 819. [Google Scholar] [CrossRef] [PubMed] [Green Version]
  73. Al-Itry, R.; Lamnawar, K.; Maazouz, A. Improvement of thermal stability, rheological and mechanical properties of PLA, PBAT and their blends by reactive extrusion with functionalized epoxy. Polym. Degrad. Stab. 2012, 97, 1898–1914. [Google Scholar] [CrossRef]
Figure 1. Schematic representation of the device used for the thermal mending process.
Applsci 12 12357 g001
Figure 2. Dynamic rheological behavior of the produced PA6/PCL blends. Trends of (a) storage and loss modulus and of (b) complex viscosity as a function of the angular frequency.
Applsci 12 12357 g002
Figure 3. Rheological analysis of neat PA6, neat PCL, and their blends: (a) Cole–Cole plot and (b) Han plot.
Applsci 12 12357 g003
Figure 4. LM micrographs of the prepared PA6/PCL blends. (a) PA6, (b) PA6_5PCL, (c) PA6_10 PCL, (d) PA6_20 PCL, (e) PA6_30PCL, and (f) lognormal distribution of the diameters of the PCL domains in the blends.
Applsci 12 12357 g004
Figure 5. FESEM micrographs of the prepared PA6/PCL blends. (a) PA6, (b) PA6_5PCL, (c) PA6_10 PCL, (d) PA6_20PCL, (e) PA6_30PCL, (f) PCL.
Applsci 12 12357 g005
Figure 6. ATR−FTIR spectra of the prepared PA6/PCL blends. (a) Full spectra, (b) spectra in the region 3500–2700 cm−1, and (c) spectra in the region 1800–650 cm−1.
Applsci 12 12357 g006
Figure 7. DSC thermograms of the produced PA6/PCL blends. (a) First heating scan, (b) cooling scan, (c) second heating scan.
Applsci 12 12357 g007
Figure 8. TGA tests on the prepared PA6/PCL blends. (a) Residual mass and (b) mass loss derivative curves.
Applsci 12 12357 g008
Figure 9. Results of quasi-static tensile tests on the prepared PA6/PCL blends. (a) Elastic modulus, (b) ultimate tensile strength, (c) elongation at break.
Applsci 12 12357 g009
Figure 10. SEM micrographs of the SENB specimens of the blends tested in quasi-static mode and impact mode.
Applsci 12 12357 g010
Figure 11. Evaluation of the healing efficiency in quasi-static and impact mode for the PA6_30PCL blend. (a) Quasi-static mode, (b) impact mode.
Applsci 12 12357 g011
Figure 12. SEM micrographs of the fracture surface of the PA6_30PCL blends before and after the healing process (tested both in quasi-static and impact conditions).
Applsci 12 12357 g012
Table 1. Results of the DSC tests on the prepared PA6/PCL blends.
First Heating Scan
SampleTm PCL (a) [°C]ΔHm PCL (b) [J/g]χ PCL(c) [%]Tm1PA6 (d) [°C]Tm2 PA(e) [°C]ΔHm PA6 (f) [J/g]χ PA6 (g) [%]
PA6---219.8226.379.834.7
PA6_5PCL60.36.289.2217.6224.267.330.8
PA6_10PCL62.410.978.1-225.278.037.7
PA6_20PCL63.720.774.1220.0225.955.630.2
PA6_30PCL64.626.362.7220.3226.854.333.8
PCL66.874.953.7----
Cooling Scan
SampleTc PA6 (h) [°C]ΔHc PA6 (i) [J/g]χ PA6 [%]Tc PCL(j) [°C]ΔHc PCL (k) [J/g]χ PCL [%]Tg(l)PCL [°C]
PA6190.789.739.0----
PA6_5PCL190.580.236.730.32.434.4-
PA6_10PCL190.375.036.230.75.740.9-
PA6_20PCL190.567.936.929.712.344.1-
PA6_30PCL190.661.938.428.517.742.3-
PCL---23.362.044.4-61.0
Second Heating Scan
SampleTm PCL [°C]ΔHm PCL [J/g]χ PCL [%]Tm1PA6 [°C]Tm2PA6 [°C]ΔHm PA6 [J/g]χ PA6 [%]
PA6--42.4-224.390.139.2
PA6_5PCL53.53.040.7-224.279.936.6
PA6_10PCL54.15.741.6218.6224.975.836.6
PA6_20PCL54.311.639.3217.9224.371.238.7
PA6_30PCL54.416.452.5217.8224.462.638.9
PCL54.573.3-----
(a)Tm PCL = melting temperature of PCL, (b) ΔHm PCL = enthalpy of melting of PCL, (c) χ PCL = degree of crystallinity of PCL, (d) Tm1 PA6 = melting temperature of γ-phase PA6 crystallites, (e) Tm2 PA6 = melting temperature of α-phase PA6 crystallites, (f) ΔHm PA6 = enthalpy of melting of PA6, (g) χ PA6 = degree of crystallinity of PA6, (h) Tc PA6 = crystallization temperature of PA6, (i) ΔHc PA6 = enthalpy of crystallization of PA6, (j) Tc PCL = crystallization temperature of PCL, (k) ΔHc PCL = crystallization enthalpy of PCL, (l) Tg PCL = glass transition temperature of PCL.
Table 2. Results of the TGA analysis performed on the prepared PA6/PCL blends.
SampleT1%(a) [°C]T5% (b) [°C]TD PCL (c) [°C]mD PCL(d) [%]TD PA6 (e) [°C]mD PA6 (f) [%]
PA6326.5398.3--461.532.9
PA6_5PCL278.0390.0419.581.1459.325.4
PA6_10PCL251.3391.5432.362.3468.718.2
PA6_20PCL283.7390.2423.758.7463.19.0
PA6_30PCL227.8384.3416.852.9457.35.7
PCL249.3389.2420.248.2--
(a)T1% = temperature associated to a mass loss of 1%, (b) T5%= temperature associated to a mass loss of 5%, (c) TD PCL = degradation temperature of PCL, (d) mD PCL = residual mass associated to the degradation temperature of PCL, (e) TD PA6= degradation temperature of PA6, and (f) mD PA6 = residual mass associated to the degradation temperature of PA6.
Table 3. Results describing the fracture behavior of the prepared PA6/PCL blends in quasi-static and impact mode.
Quasi-StaticImpact
SampleKIC [MPa m1/2] (a)GIC [kJ/m2] (b)KIC [MPa m1/2] (c)
PA62.79 ± 0.082.20 ± 0.149.44 ± 0.86
PA6_5PCL3.34 ± 0.233.25 ± 0.359.40 ± 0.87
PA6_10PCL3.08 ± 0.313.33 ± 0.458.77 ± 1.03
PA6_20PCL2.86 ± 0.303.54 ± 0.777.86 ± 1.36
PA6_30PCL2.24 ± 0.312.68 ± 0.717.32 ± 0.78
(a) Critical stress intensity factor (KIC) in quasi-static mode, (b) critical strain energy release rate (GIC) in quasi-static mode, and (c) critical stress intensity factor (KIC) in impact mode.
Publisher’s Note: MDPI stays neutral with regard to jurisdictional claims in published maps and institutional affiliations.

