Article

Assigning the Geographical Origin of Meat and Animal Rearing System Using Isotopic and Elemental Fingerprints

National Institute for Research and Development of Isotopic and Molecular Technologies, 67-103 Donat Street, 400293 Cluj-Napoca, Romania
*
Author to whom correspondence should be addressed.
Appl. Sci. 2022, 12(23), 12391; https://doi.org/10.3390/app122312391
Submission received: 15 November 2022 / Revised: 29 November 2022 / Accepted: 30 November 2022 / Published: 3 December 2022
(This article belongs to the Special Issue Emerging Technologies in Food and Beverages Authentication)

Abstract

:
In this study, the stable isotope, and elemental fingerprints of 120 meat samples were determined. The Partial Last Squares-Discriminant Analysis (PLS-DA) method was applied to build classification models for chicken and pork meat samples according to the geographical origin (different Romanian regions) and the animal growing system (animals coming from yard rearing systems versus animals coming from industrial farms). The accuracy of the geographical origin differentiation model was 93.8% for chicken and 71.8% for pork meat. The principal discrimination markers for this classification were: B, Na, K, V, As, Se, Rb, Nb, Cd, Sn, δ13C, δ2H, and δ18O (for chicken meat) and B, Na, Mg, K, Ca, V, Cr, Fe, Ni, Cu, Zn, As, Rb, Sr, Nb, Mo, Sn, Sb, Ba, Pb, δ13C, δ2H, and δ18O (for pork meat). The PLS-DA models were able to differentiate the meat samples according to the animal rearing system with 100% accuracy (for pork meat) and 98% accuracy (for chicken meat), based on the main predictors: B, K, V, Cr, Mn, Fe, Cu, Zn, Se, Rb, Nb, Sn, δ13C, and δ2H (for chicken meat) and Se, Rb, Nb, Sb, Ba, Pb, and δ13C (for pork meat).

1. Introduction

At the global level, meat consumption has doubled in the last 20 years, and it is expected to grow by another 13% per year by 2028 [1]. Meat represents an important source of nutrition for many people around the world. Globally, pig meat is the most popular, but poultry production is growing the most quickly. The economic increase is an important factor in meat consumption. Income growth enables the purchase of meat, which is typically a more expensive source of protein. In this context, consumer preferences for meat origin and meat production system, including traceability and animal diet, are increasing faster than in the past. Therefore, they are willing to pay a higher price for meat that meets their individual standards and specific requirements. However, due to the COVID-19 pandemic, food prices were rising, and now, in the context of the East European conflict, the meat price index was up 15% during this year [2], and it is a concern that mislabeling (false declaration of geographical origin or farming system) of food commodities could occur. Consequently, there is a continuous requirement for the development of reliable analytical methods that can be used for authentication goals [3]. In this regard, by combining stable isotopes with multi-element analysis and then applying statistical treatments, reliable information about the geographical origin of various food products such as honey [4,5], milk [6,7], meat [7,8], and fruit distillates [9,10] could be obtained. The isotopic fingerprint of animal tissues and products is the summation of feeds ingested throughout their life. The 18O/16O and 2H/1H ratios reflect the consumed water and subsequently the isotopic signature of the local precipitation from the production area, depending on the distance to the ocean and the altitude above the sea, while the 13C/12C ratio reflects mainly differences in the food resources. The ratio 13C/12C of plant material is determined primarily by the photosynthesis type of the plant but also by the local and temporal climate conditions under which it has grown, and through the food chain, the isotope fingerprint is correspondingly transferred to animal material [8,11].
In this context, one aim of the present study was to determine the isotopic (δ13C, δ2H, and δ18O) and elemental (Na, M, K, Ca, Fe, Zn, Rb, Cu, Cr, B, Ni, Ba, Mn, Se, Mo, Li, Sr, V, Co, La, Nb, Pd, In, Pb, Sn, As, Sb, and Cd) profiles of 120 meat samples (49 chicken and 71 pork) from different Romanian regions. The second objective was related to building the chemometric models for chicken and pork meat differentiation according to: (1) their geographical origin and (2) the animal breeding system (animals coming from yard rearing systems versus animals coming from conventional/industrial farms). A feature selection step was applied prior to the construction of the PLS-DA models in order to identify the variables having the highest discrimination power.

2. Materials and Methods

2.1. Sample Description

A total of 120 meat samples were investigated by Isotope Ratio Mass Spectrometry (IRMS) and Inductively Coupled Plasma-Mass Spectrometry (ICP-MS) techniques. The sample set consisted of pork (n = 71) and chicken (n = 49) meat samples that were collected from local supermarkets and from different rural regions in Romania (Figure 1). The samples were placed in plastic bags and stored in the fridge for less than 24 h prior to being prepared for the subsequent analysis. Some of the samples were collected directly from the yard of pig and chicken farms located in rural regions (33 chicken and 24 pork meat samples). A total of 16 chicken and 47 pork meat samples were acquired, according to the label, from different industrial farms in Romania.

2.2. Sample Preparation for Analysis

2.2.1. Preparation for Stable Isotope Analysis

Prior to determining the isotopic fingerprint of 2H, 18O, and 13C from meat, the samples were prepared following a specific protocol. Thus:
(i)
the water was extracted from meat without isotopic fractionation by a procedure consisting of cryogenic distillation under vacuum [12]. The isotopic values of 2H and 18O were then determined from the extracted water;
(ii)
for 13C measurements, the first step of the preparation protocol consisted of drying the meat samples in an oven at 60 °C for 48 h. Each meat sample (5 mg) was then converted to CO2 by dry combustion in excess oxygen at 550 °C for 3 hours.
In the next step, the obtained CO2 was purified from other combustion gases by cryogenic separation and afterward measured by the Isotope Ratio Mass Spectrometry (IRMS) technique.

2.2.2. Sample Digestion Procedure for Elemental Profile Determinations

In order to determine the elemental content by Inductively Coupled Plasma-Mass Spectrometry (ICP-MS) analysis, a microwave digestion procedure was applied. Five grams of the homogenized sample was dried in an oven at 100 °C for 12 h. After that, 0.3 g of the meat sample were accurately weighed in a PTFE digestion vessel, and then, 5 mL of HNO3 (60% v/v) and 2 mL of H2O2 (30% v/v) were added for sample mineralization using a microwave digester (Speed ENTRY by Berghof®). The microwave system was set to ramp from room temperature to 50 °C in 2 min, hold for 5 min; from 50 to 75 °C in 2 min, hold for 15 min; from this temperature to 190 °C in 5 min, hold for 20 min; and finally, from 190 to 75 °C in 5 min, hold for 10 min. The digested solutions were left to cool to room temperature and then diluted with ultrapure water (resistivity 18 MΩ cm−1, Millipore, Bedford, MA, USA water purification system) to a final volume of 50 mL. The sample digestion of the blank solutions and certified reference material was made using the same preparation steps. The method’s accuracy was checked by using NCS ZC85006, as standard reference material.

2.3. Sample Measurements

2.3.1. Stable Isotope Analysis

Isotopic values are reported in conventional δ notation (isotopic composition or signature) versus international standards: Vienna Pee Dee Belemnite (V-PDB) for δ13C and Vienna Standard Mean Ocean Water (V-SMOW) for δ2H and δ18O, according to Equation (1) [13]:
δ i X   =   ( R sample R standard 1 ) 1000
where i is the mass number of the heavier isotope of the element X (13C, 2H, and 18O), Rsample is the isotope number ratio of a sample (13C/12C; 2H/1H; and 18O/16O), and Rstandard is that of the international standard. The delta values are multiplied by 1000 and are expressed in units “per mil” (‰).
An isotope ratio mass spectrometer (Delta V Advantage, Thermo Scientific, Waltham, MA, USA) in line with a dual inlet system was used to determine the carbon isotope ratios of CO2. All meat samples were measured in duplicate. One working standard was measured daily before beginning meat sample analyses. This working standard was calibrated against NBS–22 oil certified reference material from IAEA Vienna (International Atomic Energy Agency), whose isotopic composition is δ13CVPDB = −30.03‰. The uncertainty was ±0.3‰.
A liquid-water isotope analyzer (DLT–100, Los Gatos Research) was used to measure the isotopic signatures of δ18O and δ2H. A set of five working standards was used (working standard 1, δ18O = −19.57 ± 0.1‰ and δ2H = −154.1 ± 1‰; working standard 2, δ18O = −15.55 ± 0.1‰ and δ2H = −117.0 ± 1‰; working standard 3, δ18O = −11.54 ± 0.1‰ and δ2H = −79.0 ± 1‰; working standard 4, δ18O = −7.14 ± 0.1‰ and δ2H = −43.6 ± 1‰; and working standard 5, δ18O = −2.96 ± 0.1‰ and δ2H = −9.8 ± 1‰). For 18O/16O, the uncertainty was ±0.2‰, while for 2H/1H, it was ±1‰.

2.3.2. Elemental Profile Analysis

The elemental concentrations were analyzed by ICP-MS using an ELAN RDC (e) mass spectrometer (PerkinElmer SCIEX®, Billerica, MA, USA) equipped with a Meinhart nebulizer, and the operating conditions were the following: nebulizer gas flow of 0.92 L/min; auxiliary gas flow of 1.2 L/min; plasma gas flow of 15 L/min; lens voltage of 7.25 V; radiofrequency power of 1100 W; CeO/Ce of 0.025; and Ba++/Ba+ of 0.020. Certified multi-element solutions composed of Ce, Dy, Er, Eu, Gd, Ho, La, Lu, Nd, Pr, Sm, Sc, Tb, Th, Tm, Y, and Yb (10 μg/mL, PerkinElmer Pure Plus, U.S.A.); Ag, Al, As, Ba, Be, Bi, Ca, Cd, Co, Cr, Cs, Cu, Fe, Ga, In, K, Li, Mg, Mn, Na, Ni, Pb, Rb, Se, Sr, Tl, U, V, and Zn (10 μg/mL, PerkinElmer Pure Plus, Billerica, MA, USA); and Au, Hf, Ir, Pd, Pt, Rh, Ru, Sb, Sn, and Te (10 mg/L, PerkinElmer Pure Plus, Billerica, MA, USA) were used for the standard stock solutions preparation, by dissolving the multi-element solutions with ultrapure water. For the calibration curve, the working solutions of a specific concentration and volume were prepared by diluting the stock solution.

2.3.3. Statistical Data Processing

The software SOLO 8.9.1, 2021 (Eigenvector Research Incorporated, 2022 Manson, WA, USA) was used to perform the statistical evaluation of experimental data. Partial Least Squares-Discriminant Analysis (PLS-DA) is a multivariate supervised method that allows the creation of discrimination models, giving the maximum covariance between measured data (isotopic and elemental content) and the response variable (represented, in this study, by the membership degrees with respect to their geographical origin and animal rearing system) [14]. Therefore, this technique was applied in order to classify meat samples according to the geographic origin and to determine significant differences between animal meat coming from rural regions and industrial farms. The performance of the differentiation models was evaluated in an unbiased manner, by applying the 10-fold cross-validation technique in order to compute the accuracy, sensitivity, and specificity measures.

3. Results and Discussion

The isotopic and elemental profile analysis of chicken and pork meat from different Romanian areas was used, firstly, to verify the geographical origin of meat, and, secondly, to differentiate the samples with respect to the animal breeding system (animals coming from yard rearing system versus animals coming from conventional/industrial farms). Table 1 presents the isotopic and elemental content (as minimum, maximum, and mean values) for the investigated meat samples.
Isotopic signature of chicken and pork meat
Isotopic signature of hydrogen and oxygen
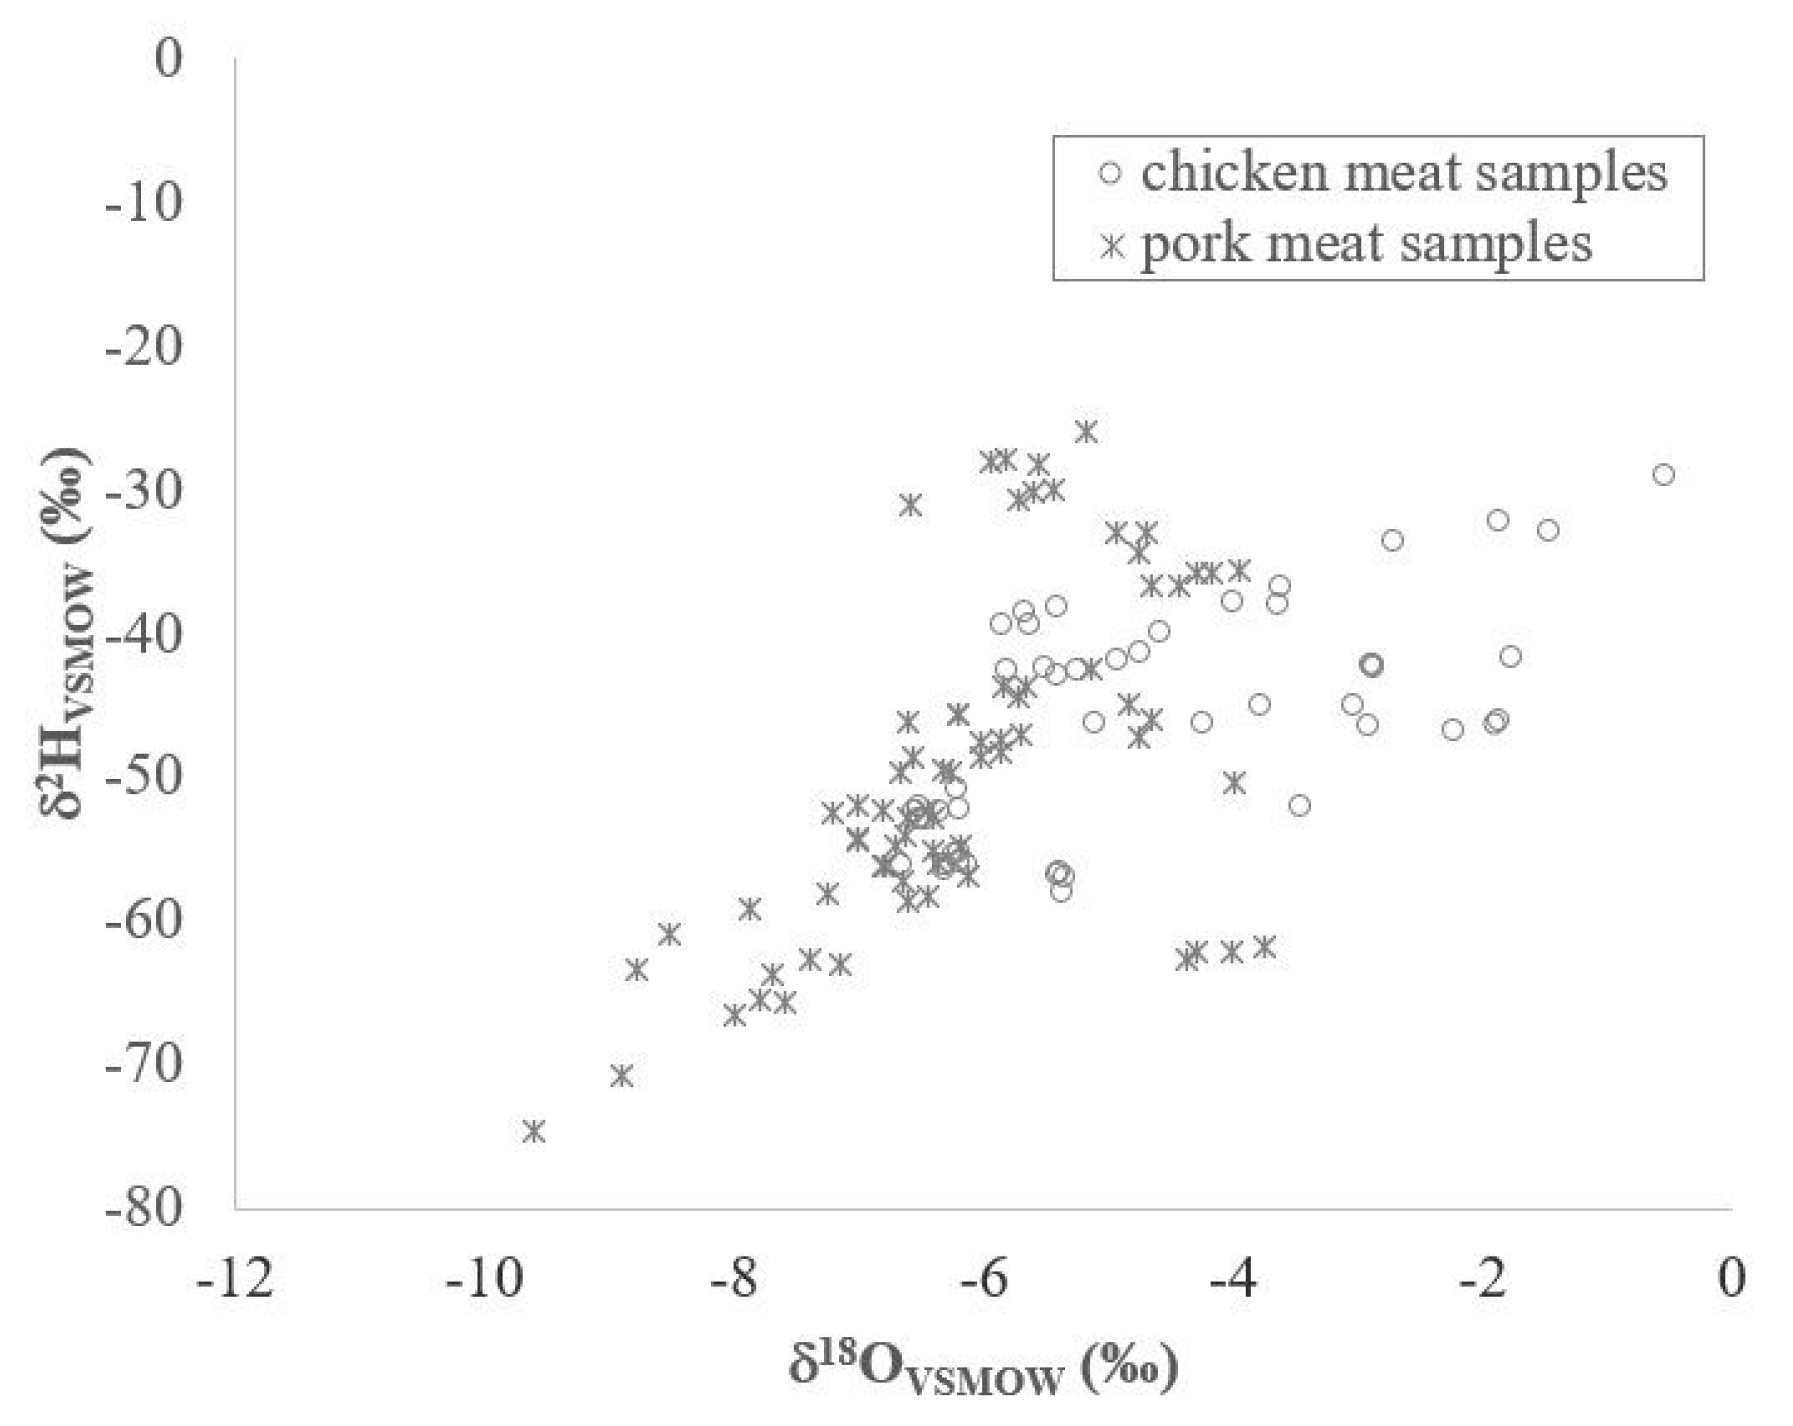
The isotopic composition of hydrogen ranged from −58.1 to −28.1‰ for chicken meat samples and from −74.7 to −25.9‰ for pork meat samples. The δ18O values for chicken ranged between −6.6 and −0.5‰, while those for pork ranged between −9.6 and −3.7‰ (mean value −6.1‰). To compare the results obtained in other parts of Europe, Thiem, Lupke, and Seifert (2004) [15] reported, for pork samples coming from the northern part of Germany, an average value for δ18O of −7.1‰ (min −8.5‰ and max −6.0‰). The lowest values of 2H and 18O from investigated meat samples belong to a pork meat sample coming from Maramures county. This region is situated in the north of the country (47°39′09.00” N, 23°34′08.40” E), having a colder climate throughout the year compared to other Romanian areas [16]. The δ2H and δ18O values of precipitations from this location will be reflected in the animals’ drinking water, and then the isotopic fingerprint of the drinking water will be transferred to the animal by consuming the water, proving the fact that isotopic values of 2H and 18O are very good indicators for the geographical assignment [11,17]. As it can be observed in Figure 2, there are chicken meat samples having enriched values of 2H and 18O as compared with those of the pork meat samples, but there is also an overlap in the range of values for chicken and pork. The reason for this is that the samples with similar values are from the same county (Cluj) or neighboring regions (Salaj, Alba).
Isotopic Signature of Carbon
The δ13C value in the animal body is directly influenced by the composition of the animal diet, which is formed of different plant species [11]. The δ13C isotopic signature of plants is different as a function of the photosynthetic pathway, C3 or C4. Most plants and herbs (most fruits and vegetables, cereals—barley, oats, wheat) have a C3 photosynthetic cycle. Corn and sugarcane are the best-known examples of C4 plants. For C3 plants, δ13C ranges from −30 to −23‰, while for C4 plants, δ13C values are higher, from −14 to −12‰ [11]. Thus, the δ13C values of the investigated meat samples will depend on the proportion of C3 and C4 plants introduced in the feeding regime of the animal.
As it can be observed in Figure 3, there is a very good separation between the animals grown in different systems. The δ13C range of variation for chicken grown in conventional systems is very narrow, between −22.3 and −21‰ (mean value −21.5‰), proving a similar diet among farms, a mix of C3 (barley, oats, rye, and wheat) and C4 (corn) plants. Rhodes et al. (2010) [18] obtained a mean value of δ13C = −20.75‰ for commercially grown corn-fed chickens, reporting that a calibration of the δ13C analysis versus the corn proportion in the diet produced a linear relation. Thus, by their developed method, Rhodes et al. (2010) [18] proposed a critical value δ13C = −22.5‰ of chicken meat that could assign (>97.5%) chicken as non-corn fed if the diet contains no more than 23.3% corn.
The 13C isotopic values of chicken meat samples obtained through a yard rearing system were higher than those obtained through a conventional growth system. For 30 of the 33 chickens raised in the yard, δ13C values ranged from −20.4 to −17.3‰. These values demonstrate that the feed was based on a combined C3 and C4 diet, with an important proportion of corn. For the other three samples, the mean isotopic composition of 13C was −13.2‰, confirming the fact that chickens were exclusively fed corn.
Regarding pork meat samples, the δ13C range of variation for pigs grown in conventional systems is between −24.1 and −20.0‰ (mean value −21.8‰). In the industrial system of growing, a wide variety of feed ingredients are used for the pig’s diet: flaked barley, fish meal, flaked maize, potato protein, full-fat soya, ground micronized wheat, whey powder, maize starch, etc. These values are similar to those reported by Park et al. (2018) [8] for Spanish conventional pork meat samples, which varied from −23.0 to −22.3‰ (mean value −22.6‰).
For the swine coming from the yard-rearing system, the isotopic fingerprint of 13C varied from −20.1 to−14.2‰. These swine are grown in a semi-open system, moving outdoors. The feed consists of a boiled mixture of herbs and plants that grow in that geographical area, these plants being different throughout the year, with each season having its own specific plants [12]. Furthermore, these farm-raised animals are fed boiled potatoes and corn, a rich corn-based diet that is an old Romanian tradition for pig yard rearing systems in rural areas. Thus, they form their own fat deposits to help them cope with low temperatures during the cold season. This kind of rearing system leads to a special taste in pork meat, which is very appreciated by consumers.
A similar trend of results was obtained by Zhao et al. (2020) [7], with significantly lower δ13C values for conventional pork as compared to organic pork from the same area.
Content of macro-, micro-, trace-, and toxic elements in chicken and pork meat
ICP-MS represents one of the most advanced and accurate analytical methods used for multi-element determinations. A total of 28 elements, namely, macro- (K, Na, Mg, and Ca); micro- (Fe, Zn, Rb, Cu, Cr, B, Ni, Ba, Mn, Se, Mo, Li, and Sr); trace elements (V, Co, La, Nb, Pd, and In); and metals with toxic potential (Pb, Sn, Sb, As, and Pb) were determined from the chicken and pork meat samples. The minimum, maximum, and mean concentrations of these elements are presented in Table 1.
For the chicken meat, the most abundant mineral was K, with a mean value of 4513.4 mg/kg (fresh weight), followed by Na, Mg, and Ca, with mean values of 1037.9 mg/kg (fresh weight), 804.7 mg/kg (fresh weight), and 80.2 mg/kg (fresh weight), respectively. Islam et al. (2022) [19] obtained the same decreasing order for macroelements in chicken breast from conventional and sustainable farms in Korea. The values of macroelements (in mg/kg) in chicken meat samples, presented in other studies, ranged between: 4250 and 5140 [19], 2425 and 3236 [20], 3621 and 4010 [21] for K; 280 and 470 [19], 312.03 and 4036 [20] for Na; 260 and 310 [19], 220.75 and 292.62 [20], 278 and 330 [21] for Mg; and 50 and 80 [19], 39.08 and 88.30 [20], 41–77 [21] for Ca, respectively.
In the present study, based on the mean values, the concentrations were reported in descending order as follows: Fe > Zn > Rb > Cu > Cr > B > Ni > Ba > Mn > Se > Mo > Li > Sr (for microelements); V > Co > La > Nb > Pd > In (for trace elements); and Pb > Sn > As > Sb > Cd (for potentially toxic elements). The mean concentrations (in mg/kg fresh weight) of some essential microelements obtained from investigated chicken meat were: 2.02 (Cu), 7.12 (Fe), 0.17 (Mn), 0.10 (Se), 3.73 (Zn), and 0.05 (Mo). For these essential minerals, the values reported in the literature [19,20,21,22] for chicken meat (in mg/kg) were: Brazil (2.2 and 6.0 for Cu, 19.8 and 42.1 for Fe, 0.326 and 0.470 for Mn, 0.421 and 0.455 for Se, 51 and 108 for Zn, and 0.206 and 0.120 for Mo, in confined chicken and free range chicken, respectively), South Korea (0.23 and 0.22 for Cu, 0.15 for Mn, 0.036 and 0.043 for Se, and 3.83 and 4.33 for Zn in meat from conventional and sustainable chicken farms), Brazil (1.99 for Cu, 3.95 for Fe, and 7.72 for Zn in a chicken breast sample), and Croatia (0.36 for Cu, 0.32 for Mn, 0.19 for Se, and 7.6 for Zn).
For investigated pork meat, the concentration levels of the elements (as mean values) follow a decreasing trend, namely: K > Na > Mg > Ca (macroelements), Zn > Fe > Rb > Cr > Cu > Ni > B > Ba > Se > Mn > Mo > Sr > Li (microelements), Pd > Co > V > La > Nb > In (trace elements), and Pb > Sn > As > Cd > Sb (potentially toxic elements), respectively. Some researchers [23,24] discovered a similar trend in microelement concentrations in Korean and Serbian pork meat. The same decreasing order was obtained by Song et al. (2021) [23] for microelement levels in animal welfare and conventional pork samples. The concentration ranges (mg/kg) of the most abundant macro minerals were K (1093.1–4161.3), followed by Na (303.3–5681.1), Mg (123.1–405.9), and Ca (19.2–405.0). There have been published studies [21,22,23,25,26] on the levels of macro- and micro-elements (in mg/kg) in pork meat from other countries, such as: Korea (3600–4430 for K, 360–410 for Na, 210–270 for Mg, 40–60 for Ca, 0.64–0.85 for Cu, 5.37–13.26 for Fe, 0.16–0.28 for Mn, 0.21–0.43 for Se, and 12.24–14.79 for Zn), Croatia (2.6–4440 for K, 17–346 for Mg and 0.36–65 for Ca, 0.38–1.1 for Cu, 0.66–56 for Fe, 0.03–0.81 for Mn, 0.03–0.26 for Se, and 11–90 for Zn), China (15046 and 14,369 for K, 1343 and 1426 for Na, 942 and 958 for Mg, 127 and 145 for Ca, 1.80 and 1.49 for Cu, 22.6 and 18.9 for Zn, 0.695 and 0.473 for Mn, 0.151 and 0.291 for Se, and 50.8 and 49.1 for Zn in organic and conventional rearing system, respectively), Brazil (355–1266 for Mg, 1.8–7.2 for Cu, 3.9–69 for Fe, 0.081–0.563 for Mn, 0.280–1.150 for Se, 26–176 for Zn, and 0.025–0.085 for Mo) and South Africa (211.2–263.2 for Mg, 2868–3684 for K, 712–830 for Na, 285–397 for Ca, 1.1–1.7 for Fe, and 2.0–2.3 for Zn).
As reported in the literature, the elemental content of the meat depends on both the animal species [27,28] and the geographical origin [12,29], animal rearing system, or animal feeding [25,30,31], respectively.
In order to find the most significant parameters that differentiate the meat according to the geographical origin and the growing system, a model-based feature selection based on Partial Least Squares (PLS) was applied in the present study. The identification of the most relevant parameters is crucial in constructing efficient discrimination models. In this study, the feature selection procedure was performed before the final model construction in order to identify those variables that have the highest discrimination potential for a specific classification. Thus, the classification models constructed through PLS-DA were based on the parameters identified through the selection step.
Classification of chicken and pork meat according to their geographical origin
The dataset consisted of 120 samples (49 chicken meat and 71 pork meat) separated by regions (Cluj, n = 33; Arad, n = 12; and Calarasi, n = 4, for chicken samples; Maramures, n = 12; Salaj, n = 20; Cluj, n = 23; Alba, n = 4; and Iasi, n = 12, for pork samples) and 31 variables (δ13C, δ2H, δ18O, Li, B, Na, Mg, K, Ca, V, Cr, Mn, Fe, Co, Ni, Cu, Zn, As, Se, Rb, Sr, Nb, La, Mo, Pd, Cd, In, Sn, Sb, Ba, and Pb).
By applying the feature selection procedure, the relevant variables for the discrimination model of the geographical origin of meat samples were identified. Thus, the main predictors for the geographical origin differentiation of the samples were: B, Na, K, V, As, Se, Rb, Nb, Ag, Cd, Sn, Ir, Tl, δ13C, δ2H, and δ18O (for chicken meat) and B, Na, Mg, K, Ca, V, Cr, Fe, Ni, Cu, Zn, As, Rb, Sr, Nb, Mo, Sn, Sb, Ba, Pb, δ13C, δ2H, and δ18O (for pork meat).
The performance of the PLS-DA models developed for differentiating the meat samples with respect to their geographical origin is displayed in Table 2. Sensitivity refers to the ratio between the number of samples correctly identified as being part of a class and the total number of samples in that class, whereas specificity is the number of samples correctly predicted not to be part of a class divided by the actual number of samples not belonging to the class [32]. RMSEC (root mean square error in calibration) is a measure of how well the model fits the experimental concentrations, whereas RMSECV (root mean square error of cross-validation) is a measure of how well the model will predict the class of the validation samples [33].
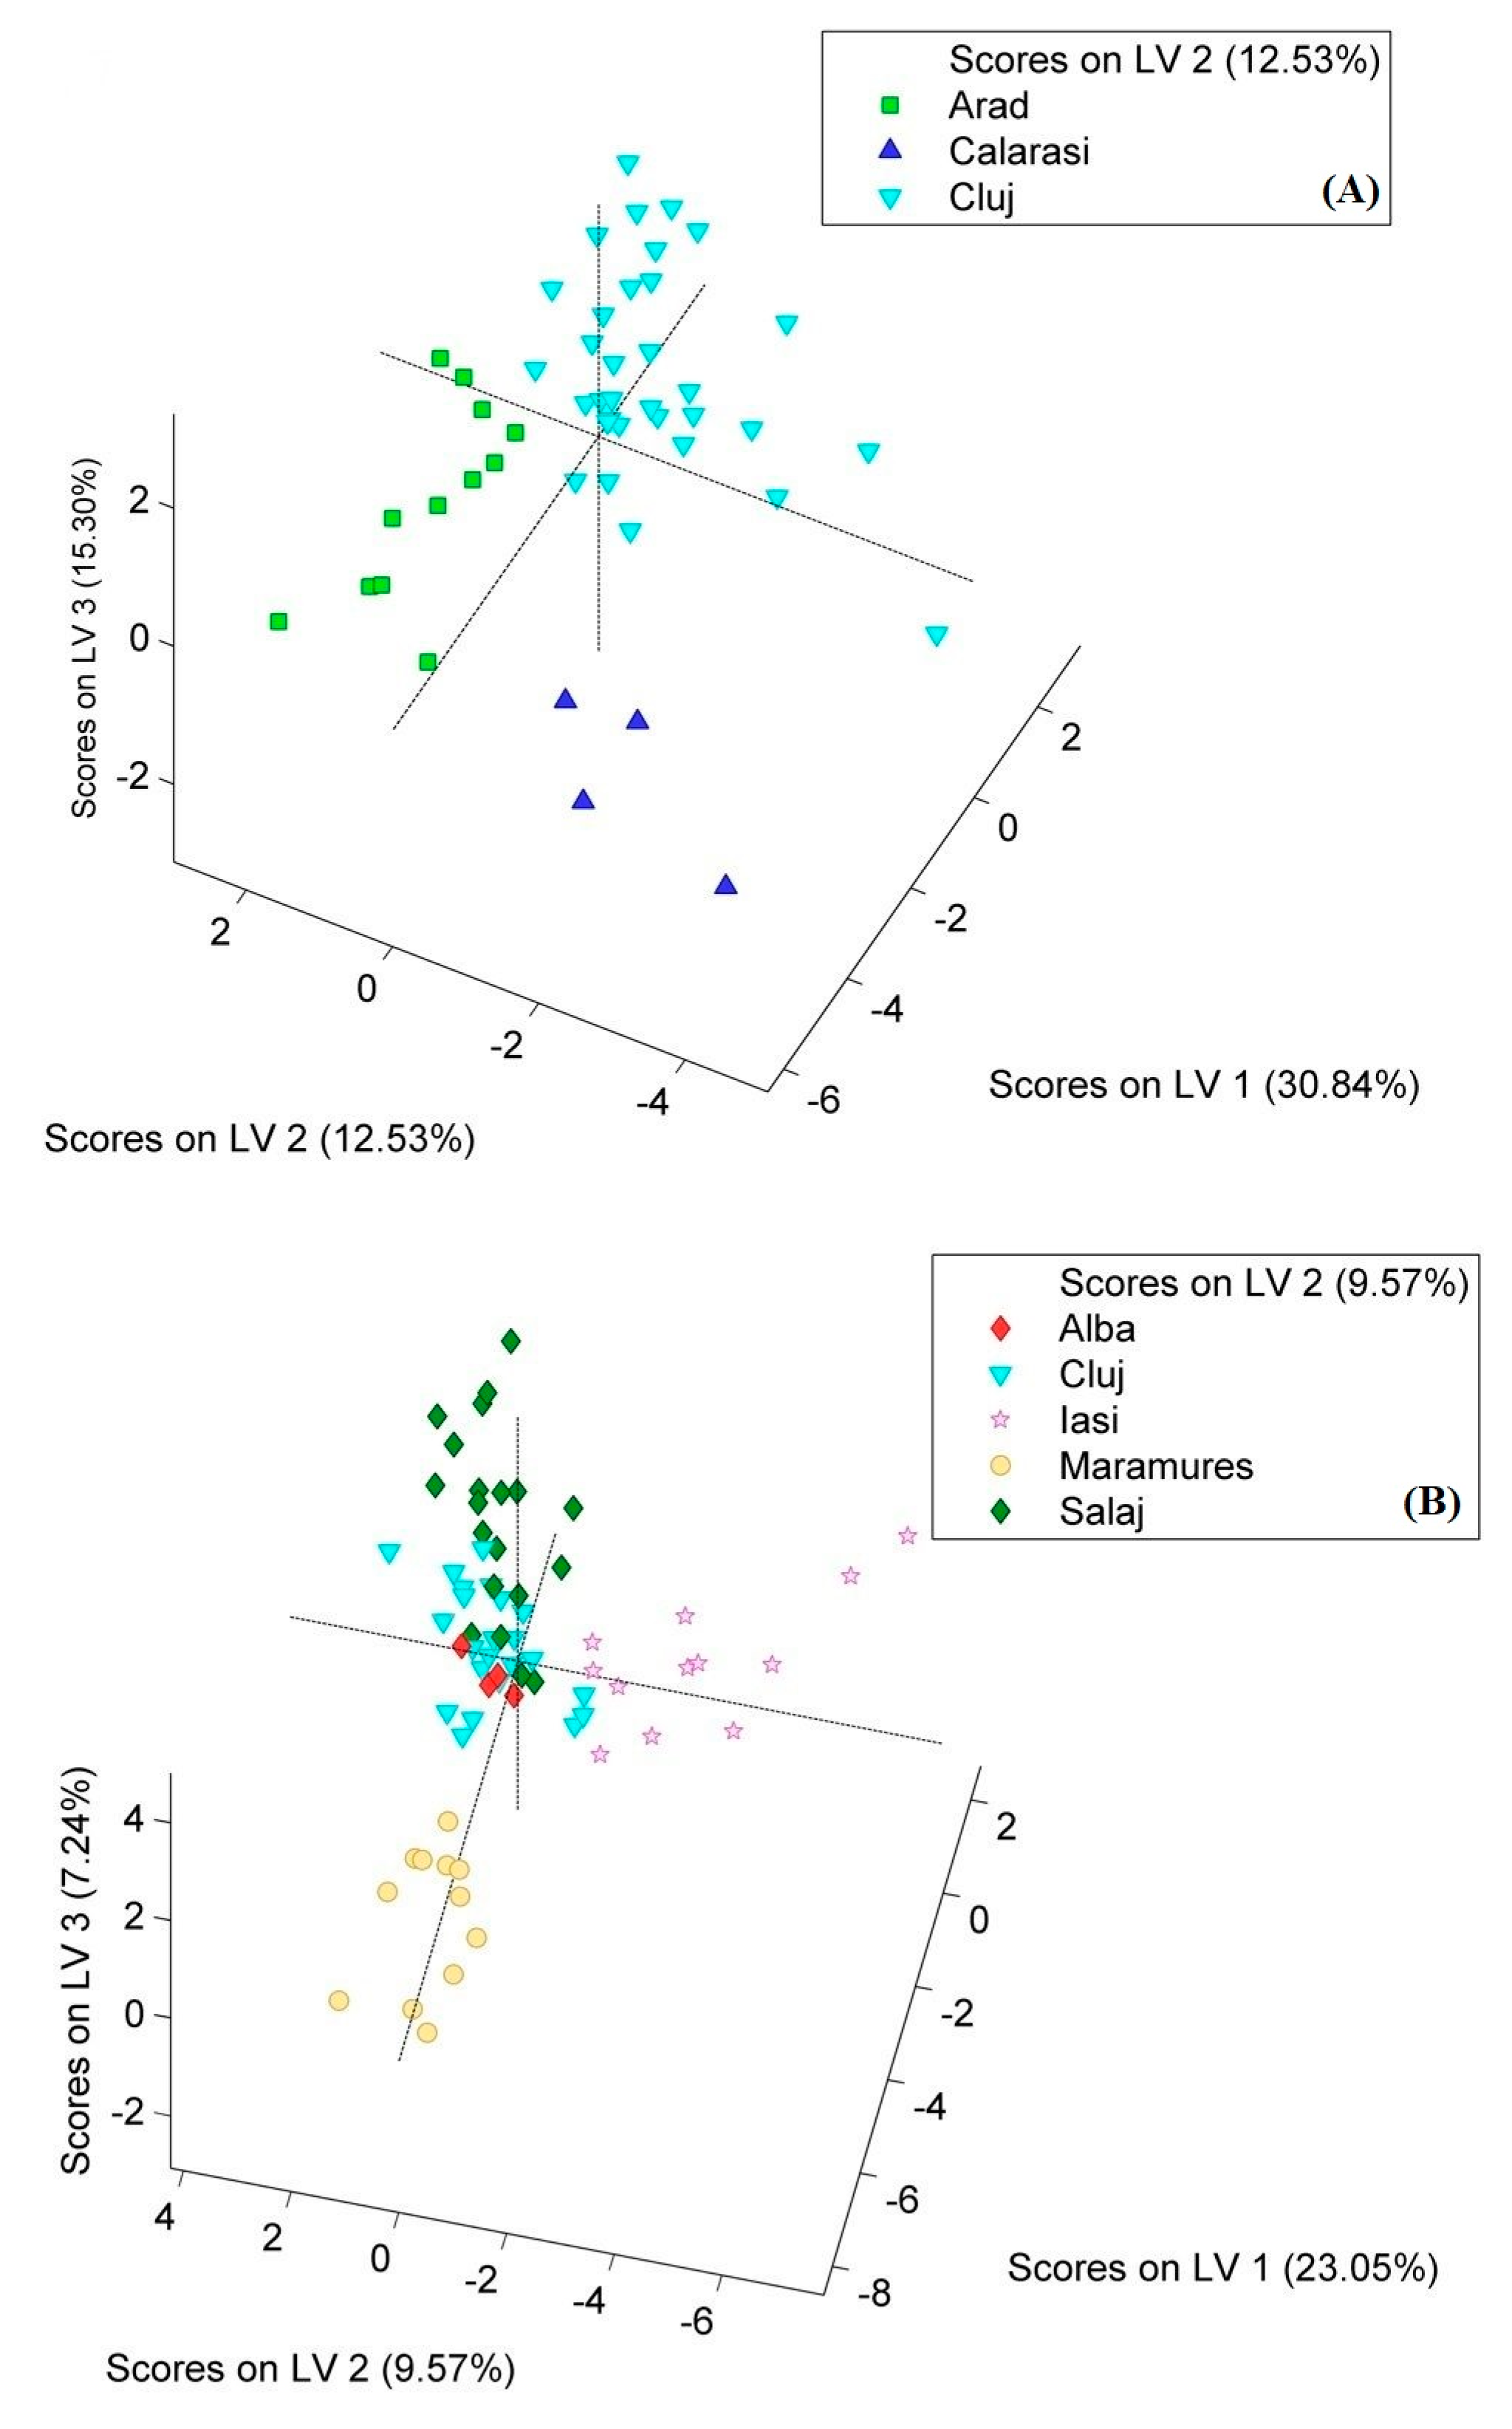
The chicken meat samples from Arad, Calarasi, and Cluj were correctly classified in percentages of 91.6, 100, and 93.9%, respectively, leading to reliable results with an accuracy rate of 93.8%. Therefore, the number of correctly differentiated samples with respect to their geographical origin was 46 out of 49 samples (11–Arad, 4–Calarasi, and 31–Cluj). One meat sample from Arad was wrongly assigned to Cluj, while two samples from Cluj were mistakenly predicted as samples from Arad and Calarasi, respectively.
A percentage of 60.8, 91.6, 100, and 70.0% of pork meat samples from Cluj, Iasi, Maramures, and Salaj were correctly classified by the PLS-DA statistical method. Nine out of twenty-three meat samples from Cluj were incorrectly assigned (one sample to Iasi, three samples to Salaj, and five samples to Alba). One sample from Iasi was assigned to the Maramures group, and six samples from Salaj were predicted to belong to the Cluj group. The identification of the correct geographical region in the case of samples from Alba was unsatisfactory and might be explained by the fact that the pork meat samples came from neighboring geographical regions with very similar geographical conditions, like the Alba/Cluj areas. Therefore, the PLS-DA model was characterized by an accuracy score of 71.8% when classifying pork meat samples according to their geographical origin.
Figure 4 shows the graphical representation of the PLS-DA results of chicken and pork meat samples based on the first three latent variables (LVs), which captured 58.67% of the variance for chicken meat and 39.86% for pork meat, respectively.
Among the best predictors obtained for the geographical origin differentiation of meat samples, 11 (B, Na, K, V, As, Rb, Nb, Sn, δ13C, δ2H, and δ18O) are common for both groups (chicken and pork).
Meat contains very low concentrations of boron as compared to boron-rich foods such as prunes (20–30 μg/g), raisins (22 μg/g), or peanuts (17 μg/g) [34]. Boron improves magnesium absorption and calcium retention. However, boron is an essential trace element for plants. The quantity of bioavailable boron in soil can influence the boron concentration in plants, and then the animals will consume the plants [35]. For the past 50 years, B has been used on B-deficient soils to improve yields of crops of grains, vegetables, and fruits [36]. Boron was also recorded as a discrimination marker for geographical origin in our previous study related to Transylvanian fruit spirits [9].
It was not surprising to find Na among the primary parameters in geographical origin differentiation. Sodium was also found as a discriminator marker for Transylvanian pork meat [12] and vegetables [37], due to the fact that this region is recognized as having a higher Na content in the soil. Soil characteristics differ among different regions. Thus, the concentration and availability of minerals in soil are reflected in plants, and then in the animals that consume the plants. Arsenic was identified as a predictor for the geographical origin assignment of Romanian honey [4], potatoes grown in distinct regions of Romania [38], and the authentication of Transylvanian fruit spirits [10].
It is a well-known fact that δ2H and δ18O are tracers for geographical origin because the chicken and pork body water takes its rise from drinking water, which in turn depends on latitude, altitude, and distance from the sea [11], reflecting a region-specific distribution [39].
Discrimination of the meat samples according to the animal’s growing system
A similar strategy to the one followed for the geographical origin authentication of meat samples was adopted: selecting the most relevant parameters that contribute to the discrimination of the animal breeding system (animals coming from yard rearing systems versus animals coming from conventional farms) and subsequently using them as input data for the PLS-DA models.
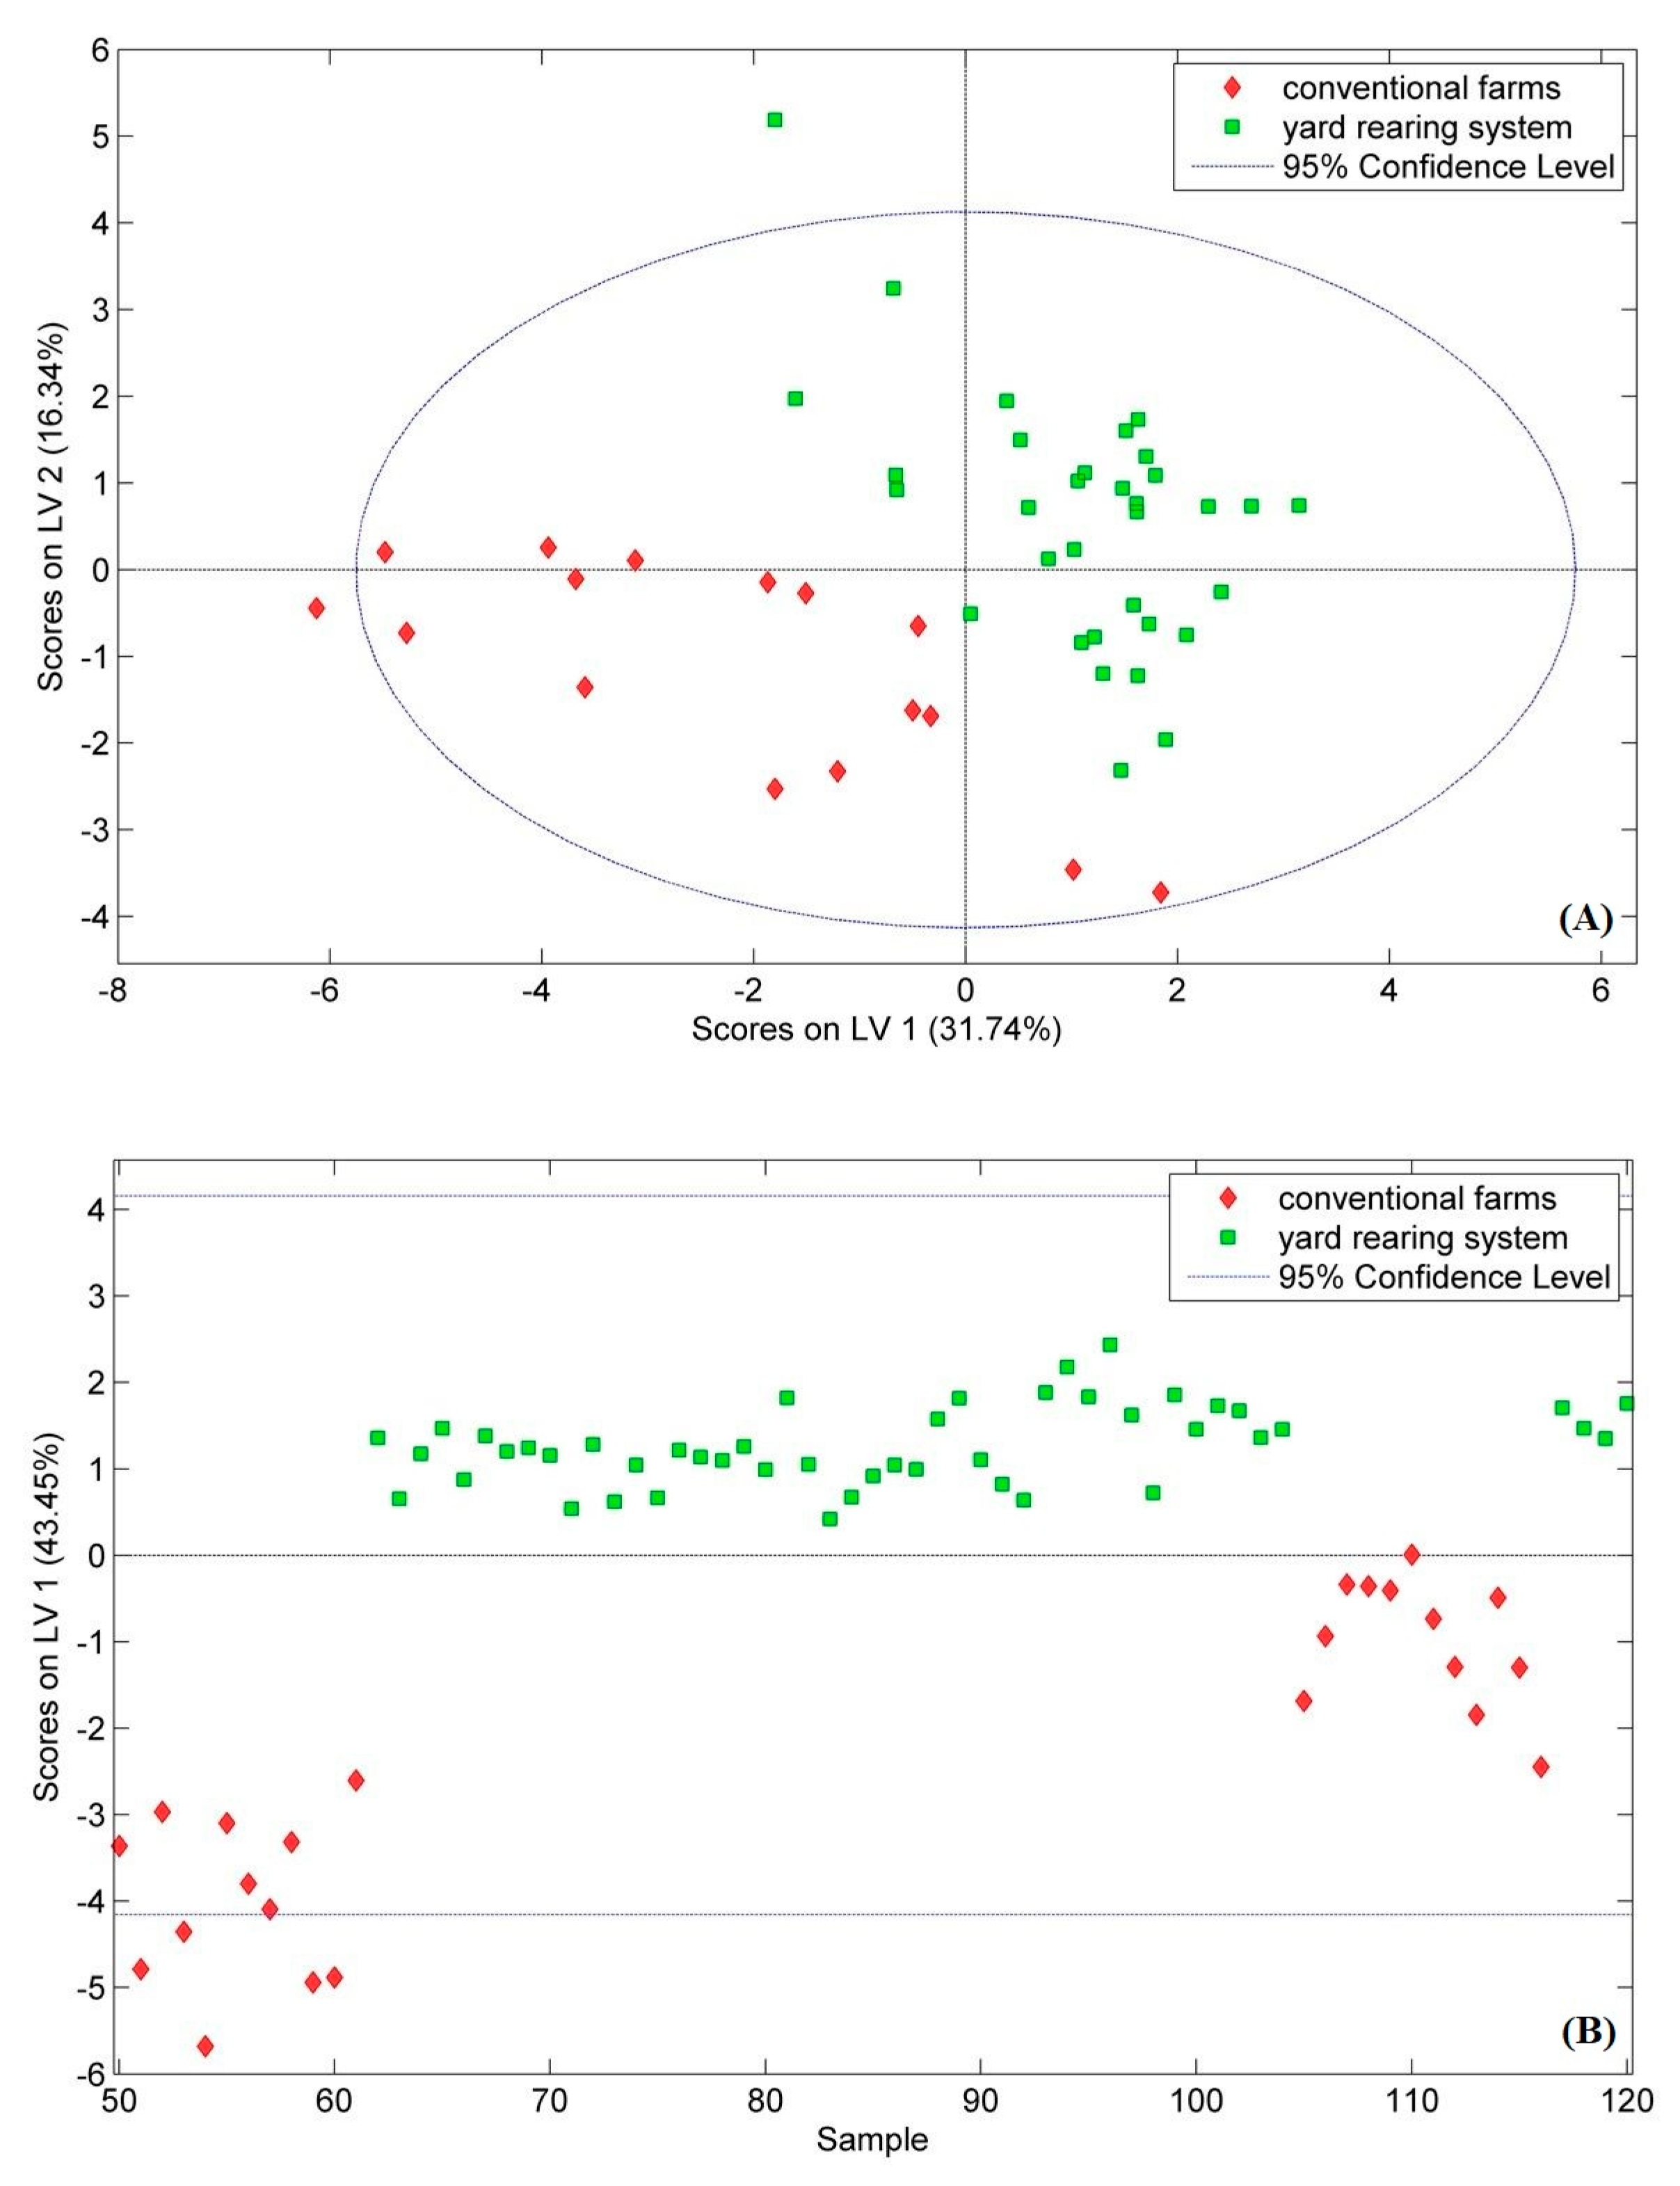
The sample set included 49 chicken meat samples (33 from yard rearing systems and 16 from conventional farms) and 71 pork meat samples (47 from yard rearing systems and 24 from conventional farms). The final PLS-DA models (Figure 5) were built based on the variables that have the highest discrimination potential, as identified in the feature selection procedure, namely: B, K, V, Cr, Mn, Fe, Cu, Zn, Se, Rb, Nb, Sn, δ13C, and δ2H (for chicken meat) and Se, Rb, Nb, Sb, Ba, Pb, and δ13C (for pork meat).
The developed PLS-DA models showed excellent levels of sensitivity and specificity (Table 3). In accordance with the cross-validation results, the PLS-DA models were able to differentiate the meat samples with respect to the animal breeding system with an accuracy of 100% (for pork meat), and 97.9% (for chicken meat), respectively.

4. Conclusions

In the present study, the isotopic and multi-element profiles of 120 meat samples (49 samples of chicken meat and 71 samples of pork meat) were evaluated. This work is focused on the application of PLS-DA, a supervised statistical method, to differentiate the meat samples according to their geographical origin (among different Romanian regions) and the animal breeding system (animals coming from a yard-rearing system versus animals coming from conventional/farms, respectively). The PLS-DA models were able to discriminate the meat samples according to their origin, with a predictive ability of 93.8% for chicken and 71.8% for pork meat. Additionally, the results demonstrated the usefulness of isotopic and multi-element fingerprints as indicators for the differentiation of meat samples according to the breeding system, leading to an accuracy of PLS-DA models of 100% for pork meat and 97.9% for chicken meat.

Author Contributions

Conceptualization, A.D. and G.C.; methodology, A.D, G.C. and R.P.; software, A.R.H.; validation, A.R.H. and D.A.M.; formal analysis, G.C., R.P. and A.D.; investigation, G.C., R.P. and A.D.; resources, G.C., R.P. and A.D.; data curation, A.R.H. and A.D.; writing—original draft preparation, A.D., G.C. and D.A.M.; writing—review and editing, A.D., G.C. and D.A.M.; visualization, A.D. and G.C.; supervision, D.A.M.; project administration, G.C.; funding acquisition, G.C. All authors have read and agreed to the published version of the manuscript.

Funding

This work was supported by a grant from the Ministry of Research, Innovation and Digitalization, CNCS–UEFISCDI, under project number PN-III-P1-1.1-TE-2021-0060 (contract no. TE 42/2022), within PNCDI III.

Institutional Review Board Statement

Not applicable.

Informed Consent Statement

Not applicable.

Data Availability Statement

The data presented in this study are available on request from the corresponding author.

Conflicts of Interest

The authors declare no conflict of interest.

References

  1. Tostado, L. Meat consumption: Everyday food and luxury good. In Meat Atlas; European Union: Brussels, Belgium, 2021; Available online: https://eu.boell.org/en/2021/09/07/consumption-everyday-food-and-luxury-good (accessed on 14 November 2022).
  2. Jagtap, S.; Trollman, H.; Trollman, F.; Garcia-Garcia, G.; Parra-López, C.; Duong, L.; Martindale, W.; Munekata, P.E.S.; Lorenzo, J.M.; Hdaifeh, A.; et al. The Russia-Ukraine Conflict: Its Implications for the Global Food Supply Chains. Foods 2022, 11, 2098. [Google Scholar] [CrossRef]
  3. Hrbek, V.; Zdenkova, K.; Jilkova, D.; Cermakova, E.; Jiru, M.; Demnerova, K.; Pulkrabova, J.; Hajslova, J. Authentication of Meat and Meat Products Using Triacylglycerols Profiling and by DNA Analysis. Foods 2020, 9, 1269. [Google Scholar] [CrossRef]
  4. Magdas, D.A.; Guyon, F.; Puscas, R.; Vigouroux, A.; Gaillard, L.; Dehelean, A.; Feher, I.; Cristea, G. Applications of emerging stable isotopes and elemental markers for geographical and varietal recognition of Romanian and French honeys. Food Chem. 2021, 334, 127599. [Google Scholar] [CrossRef]
  5. Zhou, X.; Taylor, M.P.; Salouros, H.; Prasad, S. Authenticity and geographic origin of global honeys determined using carbon isotope ratios and trace elements. Sci. Rep. 2018, 8, 14639. [Google Scholar] [CrossRef] [Green Version]
  6. Griboff, J.; Baroni, M.V.; Horacek, M.; Wunderlin, D.A.; Monferran, M.V. Multielemental isotopic fingerprint enables linking soil, water, forage and milk composition, assessing the geographical origin of Argentinean milk. Food Chem. 2019, 283, 549–558. [Google Scholar] [CrossRef]
  7. Zhao, Y.; Tu, T.; Tang, X.; Zhao, S.; Qie, M.; Chen, A.; Yang, S. Authentication of organic pork and identification of geographical origins of pork in four regions of China by combined analysis of stable isotopes and multi-elements. Meat Sci. 2020, 165, 108129. [Google Scholar] [CrossRef]
  8. Park, Y.M.; Lee, C.M.; Hong, J.H.; Jamila, N.; Naeem, K.; Jung, J.H.; Jung, Y.C.; Kyong, S.K. Origin discrimination of defatted pork via trace elements profiling, stable isotope ratios analysis, and multivariate statistical techniques. Meat Sci. 2018, 143, 93–103. [Google Scholar] [CrossRef]
  9. Dehelean, A.; Cristea, G.; Feher, I.; Hategam, A.R.; Magdas, D.A. Differentiation of Transylvanian fruit distillates using supervised statistical tools based on isotopic and elemental fingerprint. J. Sci. Food Agric. 2022. [Google Scholar] [CrossRef]
  10. Magdas, D.A.; Cristea, G.; Pirnau, A.; Feher, I.; Hategan, A.R.; Dehelean, A. Authentication of Transylvanian Spirits Based on Isotope and Elemental Signatures in Conjunction with Statistical Methods. Foods 2021, 10, 3000. [Google Scholar] [CrossRef]
  11. Camin, F.; Bontempo, L.; Perini, M.; Piasentier, E. Stable Isotope Ratio Analysis for Assessing the Authenticity of Food of Animal Origin. Compr. Rev. Food Sci. Food Saf. 2016, 15, 868–877. [Google Scholar] [CrossRef]
  12. Cristea, G.; Voica, C.; Feher, I.; Puscas, R.; Magdas, D.A. Isotopic and elemental characterization of Romanian pork meat in corroboration with advanced chemometric methods: A first exploratory study. Meat Sci. 2022, 189, 108825. [Google Scholar] [CrossRef]
  13. Brand, W.A.; Coplen, T.B.; Vogl, J.; Rosner, M.; Prohaska, T. Assessment of international reference materials for stable isotope ratio analysis 2013 (IUPAC). Pure Appl. Chem. 2014, 86, 425–467. [Google Scholar] [CrossRef] [Green Version]
  14. Barker, M.; Rayens, W. Partial Least Squares for Discrimination. J. Chemom. 2003, 17, 166–173. [Google Scholar] [CrossRef]
  15. Thiem, I.; Lupke, M.; Seifert, H. Factors influencing the 18O/16O-ratio in meat juices. Isot. Environ. Health Stud. 2004, 40, 191–197. [Google Scholar] [CrossRef]
  16. Nagavciuc, V.; Perșoiu, A.; Bădăluță, C.-A.; Bogdevich, O.; Bănică, S.; Bîrsan, M.-V.; Boengiu, S.; Onaca, A.; Ionita, M. Defining a Precipitation Stable Isotope Framework in the Wider Carpathian Region. Water 2022, 14, 2547. [Google Scholar] [CrossRef]
  17. Horacek, M.; Eisinger, E.; Papesch, W. Reliability of stable isotope values from meat juice for the determination of the meat origin. Food Chem. 2010, 118, 910–914. [Google Scholar] [CrossRef]
  18. Rhodes, C.N.; Lofthouse, J.H.; Hird, S.; Rose, P.; Reece, P.; Christy, J.; Macarthur, R.; Brereton, P.A. The use of stable carbon isotopes to authenticate claims that poultry have been corn-fed. Food Chem. 2010, 118, 927–932. [Google Scholar] [CrossRef]
  19. Islam, M.A.; Young Jeong, J.Y.; Kim, E.J.; Khan, N.; Jamila, N.; Kim, K.S. Multielemental characterization of chicken breasts from conventional and sustainable farms by Inductively Coupled Plasma—Optical Emission Spectrometry (ICP-OES) and Inductively Coupled Plasma-Mass Spectrometry (ICP-MS). Anal. Lett. 2022, 1–14. [Google Scholar] [CrossRef]
  20. Pinto, A.M.T.P.; Boeira, A.C.S.; Lisboa, M.T.; Medina, A.L.; Ribeiro, A.S.; Vieira, M.A. Development of an Analytical Method for the Determination of Metals in Chicken Breast by Microwave Induced Plasma Optical Emission Spectrometry (MIP-OES). J. Braz. Chem. Soc. 2019, 30, 1–9. [Google Scholar] [CrossRef]
  21. Bilandzic, N.; Sedak, M.; Calopek, B.; Đokic, M.; Varenina, I.; Kolanovic, B.S.; Luburic, D.B.; Varga, I.; Hruskar, M. Dietary exposure of the adult Croatian population to meat, liver and meat products from the Croatian market: Health risk assessment. J. Food Compost. Anal. 2021, 95, 103672. [Google Scholar] [CrossRef]
  22. Batista, B.L.; Grotto, D.; Carneiro, M.F.H.; Barbosa, F., Jr. Evaluation of the concentration of nonessential and essential elements in chicken, pork, and beef samples produced in Brazil. J. Toxicol. Environ. Health-A 2012, 75, 1269–1279. [Google Scholar] [CrossRef] [PubMed]
  23. Song, O.Y.; Islam, M.A.; Son, J.H.; Jeong, J.Y.; Kim, H.E.; Yeon, L.S.; Khan, N.; Jamila, N.; Kim, K.S. Elemental composition of pork meat from conventional and animal welfare farms by inductively coupled plasma-optical emission spectrometry (ICP-OES) and ICP-mass spectrometry (ICP-MS) and their authentication via multivariate chemometric analysis. Meat Sci. 2021, 172, 108344. [Google Scholar] [CrossRef] [PubMed]
  24. Tomovic, V.M.; Ljiljana, S.; Petrovic, M.S.; Tomovic, Z.S.; Kevrešan, N.; Dzinic, R. Determination of mineral contents of semimembranosus muscle and liver from pure and crossbred pigs in Vojvodina (northern Serbia). Food Chem. 2011, 124, 342–348. [Google Scholar] [CrossRef]
  25. Zhao, Y.; Wang, D.; Yang, S. Effect of organic and conventional rearing system on the mineral content of pork. Meat Sci. 2016, 118, 103–107. [Google Scholar] [CrossRef] [PubMed]
  26. Heerden, S.M.V.; Smith, M.F. The nutrient composition of three cuts obtained from P-class South African pork carcasses. Food Chem. 2013, 140, 458–465. [Google Scholar] [CrossRef]
  27. Han, J.L.; Pan, X.D.; Chen, Q. Distribution and safety assessment of heavy metals in fresh meat from Zhejiang, China. Sci. Rep. 2022, 12, 3241. [Google Scholar] [CrossRef]
  28. Gerber, N.; Brogioli, R.; Hattendorf, B.; Scheeder, M.R.L.; Wenk, C.; Gunther, D. Variability of selected trace elements of different meat cuts determined by ICP-MS and DRC-ICPMS. Animal 2009, 3, 166–172. [Google Scholar] [CrossRef] [PubMed] [Green Version]
  29. Franke, B.M.; Gremaud, G.; Hardorn, R.; Kreuzer, M. Geographic origin of meat-elements of an analytical approach to its authentication. Eur. Food Res. Technol. 2005, 221, 493–505. [Google Scholar] [CrossRef]
  30. Jukna, V.; Valaitiene, V.; Meskinyte-Kausiliene, E.; Jankauskas, A. Comparative evaluation of large white pigs and their crossbreeds meat nutritional value and mineral content. Vet. Med. Zoot. 2013, 62, 44–49. [Google Scholar]
  31. Wang, X.; Zhang, Y.; Geng, Z.; Liu, Y.; Guo, L.; Xiao, G. Spatial analysis of heavy metals in meat products in China during 2015–2017. Food Control. 2019, 104, 174–180. [Google Scholar] [CrossRef]
  32. Mazivila, S., Jr.; Gontijo, L.C.; Bachion de Santana, F.; Mitsutake, H.; Santos, D.Q.; Neto, W.B. Fast Detection of Adulterants/Contaminants in Biodiesel/Diesel Blend (B5) Employing Mid-Infrared Spectroscopy and PLS-DA. Energy Fuels 2015, 29, 227–232. [Google Scholar] [CrossRef]
  33. Bassbasi, M.; De Luca, M.; Ioele, G.; Oussama, A.; Ragno, G. Prediction of the geographical origin of butters by partial least square discriminant analysis (PLS-DA) applied to infrared spectroscopy (FTIR) data. J. Food Compos. Anal. 2014, 33, 210–215. [Google Scholar] [CrossRef]
  34. Rainey, C.J.; Nyquist, L.A.; Christensen, R.E.; Strong, P.L.; Culver, B.D.; Coughlin, J.R. Daily boron intake from the American diet. J. Am. Diet. Assoc. 1999, 99, 335–340. [Google Scholar] [CrossRef]
  35. Nielsen, F.H. Boron. In Encyclopedia of Food and Health; Caballero, B., Finglas, P.M., Toldrá, F., Eds.; Academic Press: Cambridge, MA, USA, 2016; pp. 451–455. ISBN 9780123849533. [Google Scholar] [CrossRef]
  36. Eisler, R. Boron Hazards to Fish, Wildlife, and Invertebrates: A Synoptic Review. 1990. Available online: https://www.pwrc.usgs.gov/eisler/CHR_20_Boron.pdf (accessed on 14 November 2022).
  37. Cristea, G.; Feher, I.; Voica, C.; Radu, S.; Magdas, D.A. Isotopic and elemental profiling alongside with chemometric methods for vegetable differentiation. Isot. Environ. Health Stud. 2020, 56, 69–82. [Google Scholar] [CrossRef]
  38. Magdas, D.A.; Dehelean, A.; Feher, I.; Radu, S. Isotopic and multielemental fingerprinting of organically and conventionally grown potatoes. Isot. Environ. Health Stud. 2017, 53, 610–619. [Google Scholar] [CrossRef]
  39. Franke, B.M.; Hadorn, R.; Bosset, J.O.; Gremaud, G.; Kreuzer, M. Is authentication of the geographic origin of poultry meat and dried beef improved by combining multiple trace element and oxygen isotope analysis? Meat Sci. 2008, 80, 944–947. [Google Scholar] [CrossRef]
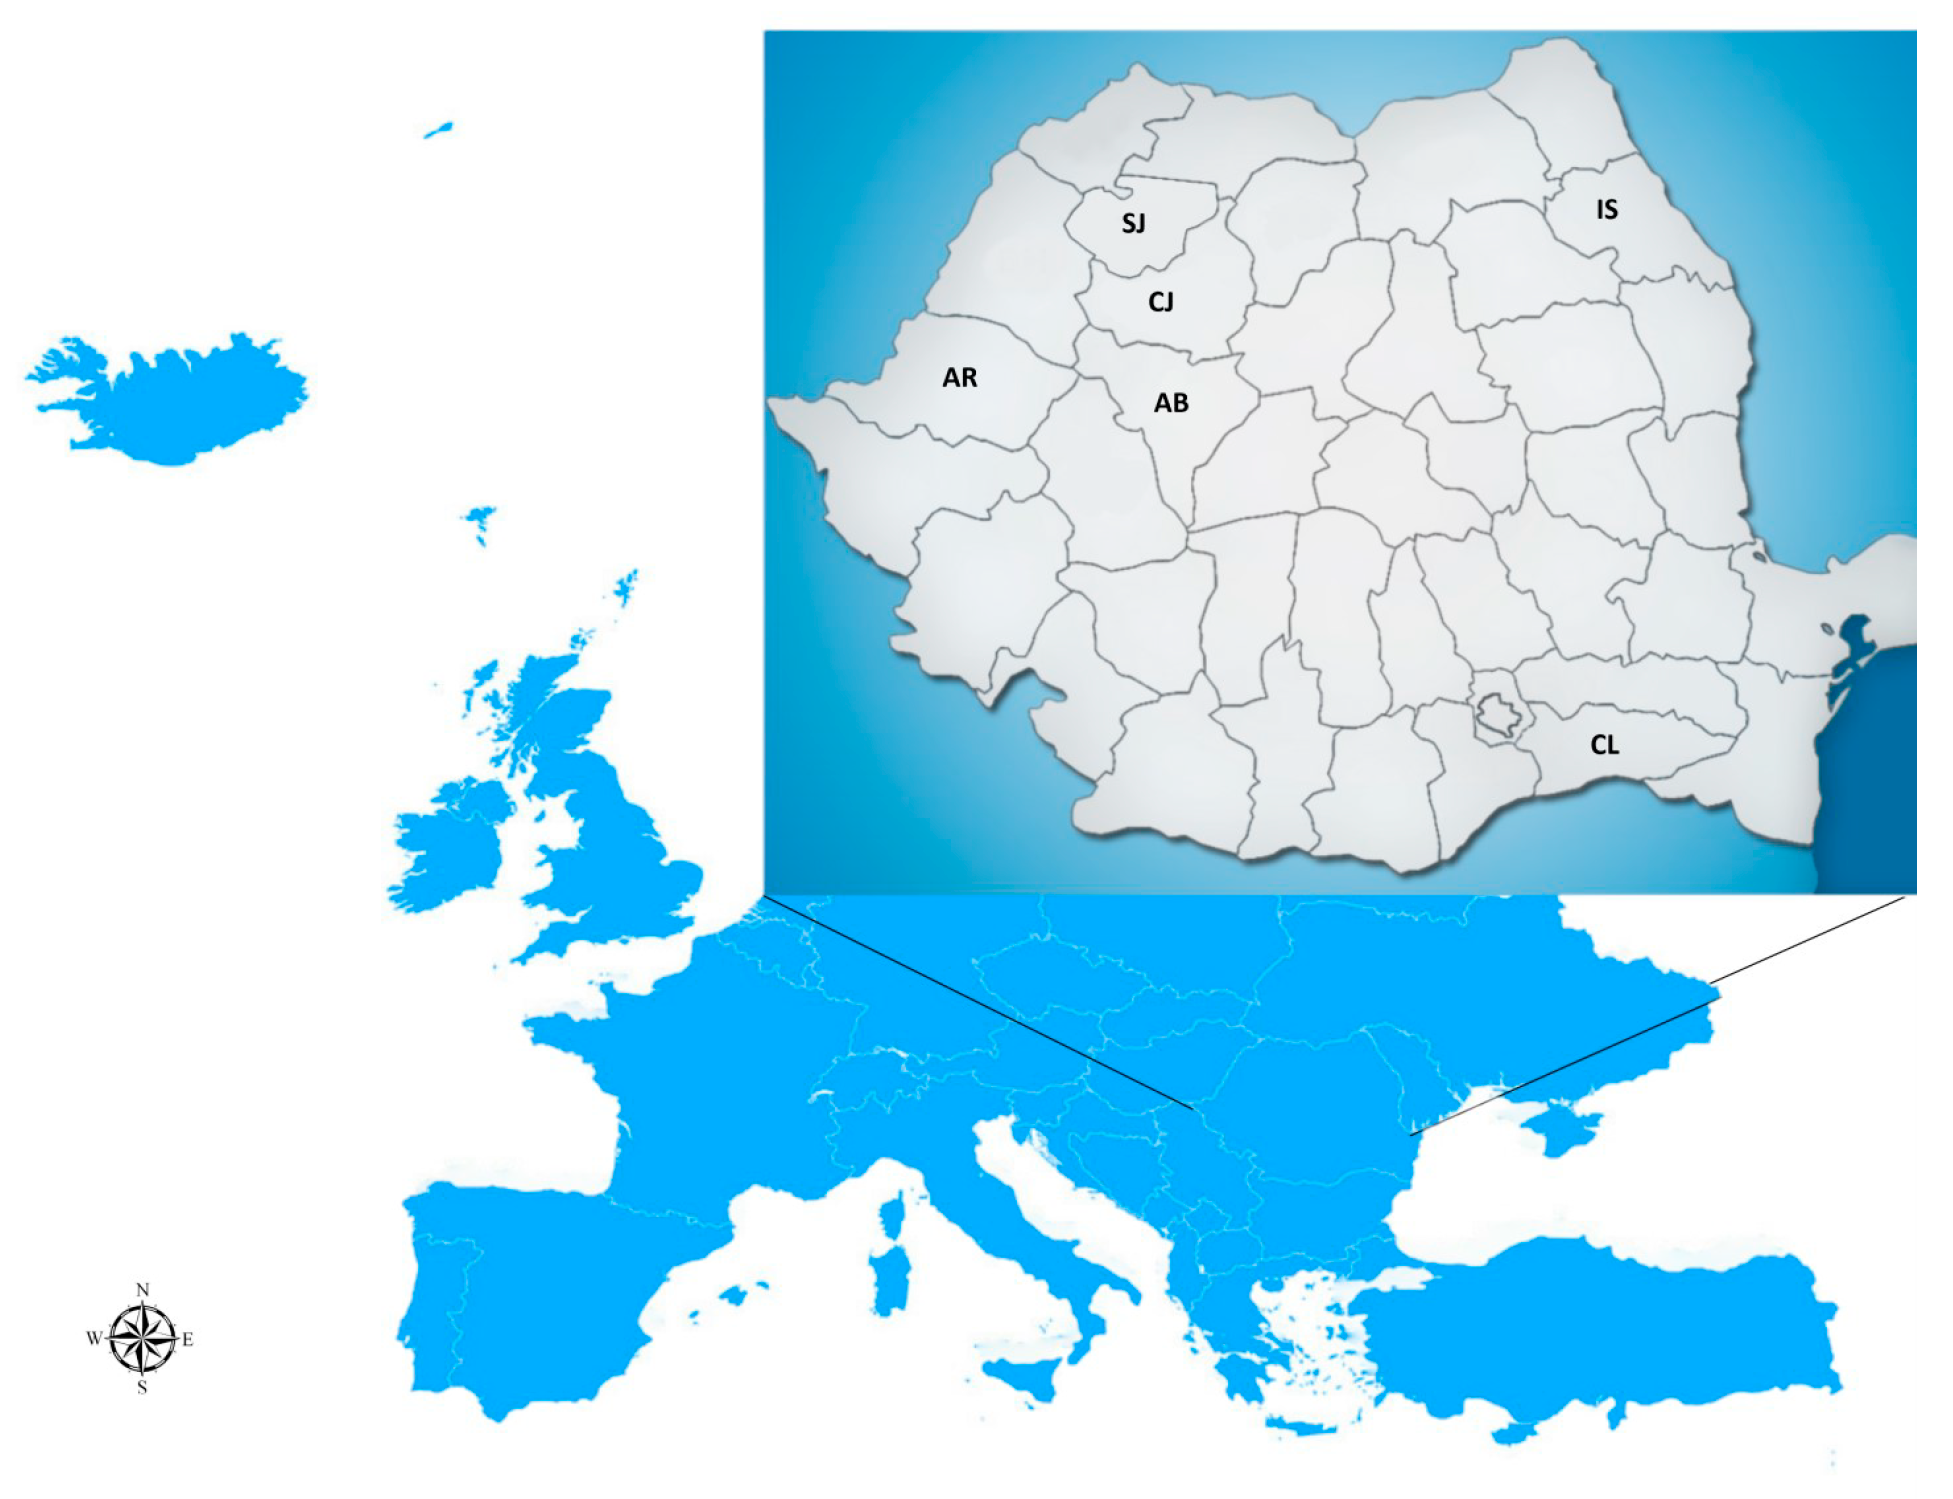
Figure 1. The map of the meat sample’s locations.
Applsci 12 12391 g001
Figure 2. Isotopic composition (δ2H versus δ18O) for investigated meat samples.
Applsci 12 12391 g002
Figure 3. δ13C versus δ2H for investigated meat samples.
Applsci 12 12391 g003
Figure 4. PLS-DA score plot obtained for the classification of meat samples according to their geographical origin: (A) chicken and (B) pork.
Applsci 12 12391 g004
Figure 5. PLS-DA score plot obtained for meat sample discrimination based on animal growing system: (A) chicken and (B) pork.
Applsci 12 12391 g005
Table 1. The minimum, maximum, and mean content of determined elements in chicken and pork meat samples.
ElementChicken MeatPork Meat
MinMaxMeanMinMaxMean
δ13CVPDB−22.3−12.8−19.3−24.1−14.2−19.0
δ2HVSMOW−58.1−29.1−46.3−74.7−25.9−49.5
δ18OVSMOW−6.6−0.5−4.6−9.6−3.7−6.1
Concentration (mg/kg fresh meat)
K774.87818.74513.41093.14161.32724.1
Na253.22621.21037.9303.35681.1837.7
Mg261.11756.5804.7123.1405.9272.3
Ca4.7206.880.219.2405.059.0
Fe0.4025.027.125.4870.7527.24
Zn0.0128.713.726.8563.7419.19
Rb0.387.552.430.906.202.72
Cu0.2522.992.020.265.321.05
B0.010.990.56LOQ0.760.19
Ba0.040.790.180.010.630.09
Se0.040.410.100.010.440.26
Cr0.0048.641.700.375.481.79
Ni0.0031.450.360.133.410.48
Mn0.0010.680.170.092.060.23
Mo<LOQ0.140.05LOQ0.200.04
LiLOQ0.340.03LOQ0.370.02
SrLOQ0.160.030.010.230.04
VLOQ0.060.020.0010.080.02
CoLOQ0.030.010.0010.140.02
LaLOQ 0.130.004LOQ0.100.003
NbLOQ0.010.004LOQ0.010.002
PdLOQ0.050.003LOQ0.210.01
InLOQ0.010.001LOQ0.010.0006
PbLOQ4.120.600.021.050.27
SnLOQ 0.160.05LOQ0.170.04
SbLOQ0.010.001LOQ0.0010.0005
AsLOQ0.520.02LOQ0.050.005
CdLOQ0.050.002LOQ0.010.002
Table 2. Results of PLS-DA models applied for chicken and pork meat samples; dataset, for both the calibration set and cross-validation test.
Meat ModelsOriginRMSEC *RMSECV **Sensitivity CalSpecificity CalSensitivity CVSpecificity CV
chickenArad0.260.351.000.940.910.91
Calarasi0.190.291.000.971.000.95
Cluj0.250.300.971.000.971.00
porkAlba0.220.231.000.640.750.65
Cluj0.350.380.950.770.910.75
Iasi0.200.221.000.940.910.93
Maramures0.100.121.001.001.000.98
Salaj0.320.360.750.900.700.86
* RMSEC—Root mean square error in calibration, ** RMSECV—Root mean square error in cross-validation.
Table 3. Classification results obtained by applying PLS-DA for the differentiation of meat samples according to the animal breeding system.
ParameterAnimal Coming from Yard Rearing SystemAnimal Coming from Conventional System
ChickenPorkChickenPork
RMSEC *0.230.240.230.24
RMSECV **0.260.240.260.24
Sensitivity (Cal)0.971.001.001.00
Sensitivity (CV)0.971.001.001.00
Specificity (Cal)1.001.000.971.00
Sensitivity (CV)1.001.000.971.00
* RMSEC—Root mean square error in calibration, ** RMSECV—Root mean square error in cross-validation.
Publisher’s Note: MDPI stays neutral with regard to jurisdictional claims in published maps and institutional affiliations.