Article

Experimental Investigation of the Influence of Freeze–Thaw Mode on Damage Characteristics of Sandstone

1
Faculty of Architecture and Civil Engineering, Huaiyin Institute of Technology, Huaian 223001, China
2
Institute for Conservation of Cultural Heritage, Shanghai University, Shanghai 200444, China
3
Northwest Research Institute Limited Company of China Railway Engineering Corporation, Lanzhou 730001, China
4
Department of Civil Engineering, Lanzhou University, Lanzhou 730001, China
*
Authors to whom correspondence should be addressed.
Appl. Sci. 2022, 12(23), 12395; https://doi.org/10.3390/app122312395
Submission received: 2 November 2022 / Revised: 24 November 2022 / Accepted: 29 November 2022 / Published: 3 December 2022

Abstract

:
The influence of rock weathering caused by freezing–thawing on stone cultural relics cannot be ignored. For immovable stone cultural relics, different parts under different environmental conditions will be under different freeze–thaw actions and suffer different degrees of damage. In this paper, three typical freeze–thaw cycle tests of sandstone are designed, namely immersion test, capillary action test, and periodic saturation test. The macroscopic and microscopic morphologies of rock samples under different freeze–thaw cycles were analyzed. Weathering indicators such as porosity, water content, wave velocity, and surface hardness were tested, as well as uniaxial compressive strength. The variation law of weathering index and uniaxial compressive strength under different freezing–thawing cycles was obtained, and the quantitative relationship between each index parameter was further analyzed. The results show that under different freezing–thawing conditions, the apparent morphology of rock samples is different, and the trend of weathering indexes is similar, but the rate of change is different. The water content of rock has a great influence on the test results of wave velocity but has little influence on the surface hardness. The function relationship between weathering index and compressive strength under different freezing–thawing modes is similar, but the fitting parameters are different. Finally, the strength and wave velocity damage factors were used to quantitatively evaluate the degree of rock weathering. The results show that the immersion freeze–thaw damage is the highest, the periodic saturated freeze–thaw damage is the second highest, and the capillary freeze–thaw damage is the least highest. This is consistent with the field observation results. The conclusion of this paper can provide reference for the detection of stone cultural relics and provides a scientific basis for the anti-weathering protection of stone cultural relics.

1. Introduction

As one of the most important categories of cultural heritage, stone cultural relics occupy a very important position in the world cultural heritage resources. There were as many as 24,422 stone cultural relics in China as of December 2021 [1]. As immovable stone cultural relics are mostly exposed to the natural environment for a very long time, they experience thousands of years of irreversible weathering and erosion and deteriorate in different degrees, which greatly affects the preservation status of the stone cultural relics. Among the deteriorated stone cultural relics, sandstone cultural relics, which account for more than 80% of the grottoes, are the most typical, which are characterized by a rapid deterioration rate, high damage degree, and wide distribution. The factors causing the weathering of stone cultural relics are mainly divided into physical weathering, chemical weathering, and biological weathering. There are many stone cultural relics in northern China, where physical weathering is mainly caused by freezing–thawing, temperature difference, and dry–wet alternation [2]. Among these physical types of weathering, freeze–thaw weathering is one of the most severe. Therefore, it is of great significance to study the physical and mechanical properties of sandstone under cyclic freeze–thaw conditions by laboratory tests for the stability evaluation of stone cultural relics and the anti-weathering protection project.
As a typical natural porous material, rock stores water on the surface and inside for a long time. With the change in external temperature, the change in water state (solid, liquid, and gas) in the pore leads to the destruction of rock structure, and the thermal expansion and cold contraction of different kinds of particles also accelerate the damage. Park et al. [3] found that frozen water in rock pores causes frost-heaving pressure inside rocks for the volume of water to expand by about 9%, and this pressure will gradually disappear when the ice melts. The freeze–thaw action of water inside pores and cracks plays a dominant role in frost weathering of rocks where the temperature fluctuates across 0 °C, The dual effect caused by water–ice phase transition is the main mechanism of rock damage. Scholars have carried out many studies on the damage mechanism, influencing factors, damage process, and weathering degree of freeze–thaw, and achieved abundant achievement. Existing studies have shown that both the properties of stone, including lithology, porosity, and water content, and the experimental environment, including cycle times, temperature change rate, and stress state, affect the freeze–thaw failure effect [4,5,6,7]. Yamabet et al. [8] took Sirahama sandstone in Japan as the research object and designed an experiment based on three factors, including temperature, cycle times, and confining pressure, to compare the differences and similarities between saturated and dry rock samples. The axial deformation of saturated rock samples is mainly plastic deformation, while that of dry rock samples is elastic deformation. With the lower freezing temperature, more cycles, and higher confining pressure, the mechanical parameters of rock decrease. Gholamreza et al. [9] studied the influence of water content, temperature, and loading rate on rock strength and fracture process under freeze–thaw, and believed that water led to a significant increase in rock strength and initial fracture stress. When other conditions are the same, the decrease in rock strength is aggravated by temperature decrease, and the change in tensile strength is larger than that of compressive strength.
Wave velocity, porosity, surface hardness, and mechanical properties are also used to evaluate the deterioration of stone [10,11]. Chen et al. [12] analyzed the changes in porosity, wave velocity, uniaxial compressive strength, and apparent morphology and concluded that the deterioration effect would suddenly increase when the saturation of samples was higher than 70%. Sarici et al. [13] showed that mass loss rate, surface hardness, point load strength, and porosity changed to different degrees with the increase of freeze–thaw times, among which hardness was closely related to point load strength, and it was believed that point load strength could be inferred based on rock surface hardness. Jia H et al. [14] used nuclear magnetic resonance to analyze the damage law of sandstone under freeze–thaw action according to the size, distribution, number, and connectivity of pores, and concluded that the microstructure changed significantly, and the changes in each index were significantly different. Gholamreza et al. [9] evaluated the deterioration degree of five types of sandstone under freeze–thaw conditions by using indexes such as porosity, wave velocity, and com-pressive strength and believed that the deterioration law of strength could be predicted by a function.
To sum up, scholars have carried out in-depth studies on the damage process and mechanism of rock under the action of freezing and thawing considering different factors, and the research ideas and methods are becoming increasingly mature. However, there is no exact standard for freeze–thaw cycle tests of stone cultural relics at present, and experimental design is usually carried out according to the environment of cultural relics. It is worth noting that even in the same cultural relic, due to the different environments of rocks in different parts, they are subjected to different freezing and thawing modes, as shown in Figure 1. Under different freezing and thawing conditions, the changes in weathering process and damage characteristics of stone cultural relics are worth exploring. Because of this, this paper designed three environmental models for freeze–thaw tests of sandstone cultural relics and then used a variety of analysis and detection methods to analyze the variation law of various physical indexes of sandstone in the freeze–thaw weathering processes. Finally, this paper further discusses the relationship between relevant mechanical indexes and physical properties indexes. The results of this paper can provide theoretical support and a scientific basis for the protection of sandstone cultural relics.

2. Experimental Scheme

2.1. Sample Preparation

The yellow sandstone samples used in this experiment were taken from the vicinity of Qingyang North Grottoes, Gansu Province, China, as shown in Figure 2. The chalk (K) sandstone in the grotto area is gently horizontal in production and is an earthy yellow fine-grained feldspar and quartz sandstone with medium-thick bedding. The cement is mainly argillaceous, composed of montmorillonite, illite, and kaolinite, and is mainly pore-cemented. The rocks are of fine to medium grain structure, and the local deposition rhythm is small in the strata. They are inclined bedded and interbedded, with interbedded soft and hard. The sandstone was made into a cube of 50 mm × 50 mm × 50 mm, and samples with a uniform structure and uniform morphology were selected for the test. To reduce the interference of soluble salt, the rock sample was desalted with warm water before the freeze–thaw cycle.

2.2. Freeze–Thaw Modes and Conditions

Different parts of the grottoes, cliff statues, and other cultural relics are in different surroundings. As shown in Figure 1, the bottom of the cultural relic is immersed in water for a long time due to the influence of groundwater and surface runoff. The lower regions suffer from capillarity, while the upper regions are saturated when affected by rainfall and snowfall.
On this basis, tests of three typical freeze–thaw modes can be used as follow: immersion freeze–thaw cycles, capillary freeze–thaw cycles, and periodic saturation freeze–thaw cycles. The simulation of freeze–thaw conditions is shown in Figure 3. The immersed freeze–thawed rock samples were completely immersed in water during the cycles, the capillary freeze–thaw rock samples were placed on the cotton towels filled with water in the tray, and the periodically saturated freeze–thaw rock samples were placed on the iron frame for five freeze–thaw cycles after 48 h of saturation. The times of freeze–thaw cycles were set to 0, 5, 10, 20, 40, 60, and 80 times, and there are totaling 147 rock samples, as shown in Table 1. The samples of control groups (0 cycle) of various modes were placed in the same water environment and maintained at a constant temperature of 25 °C.
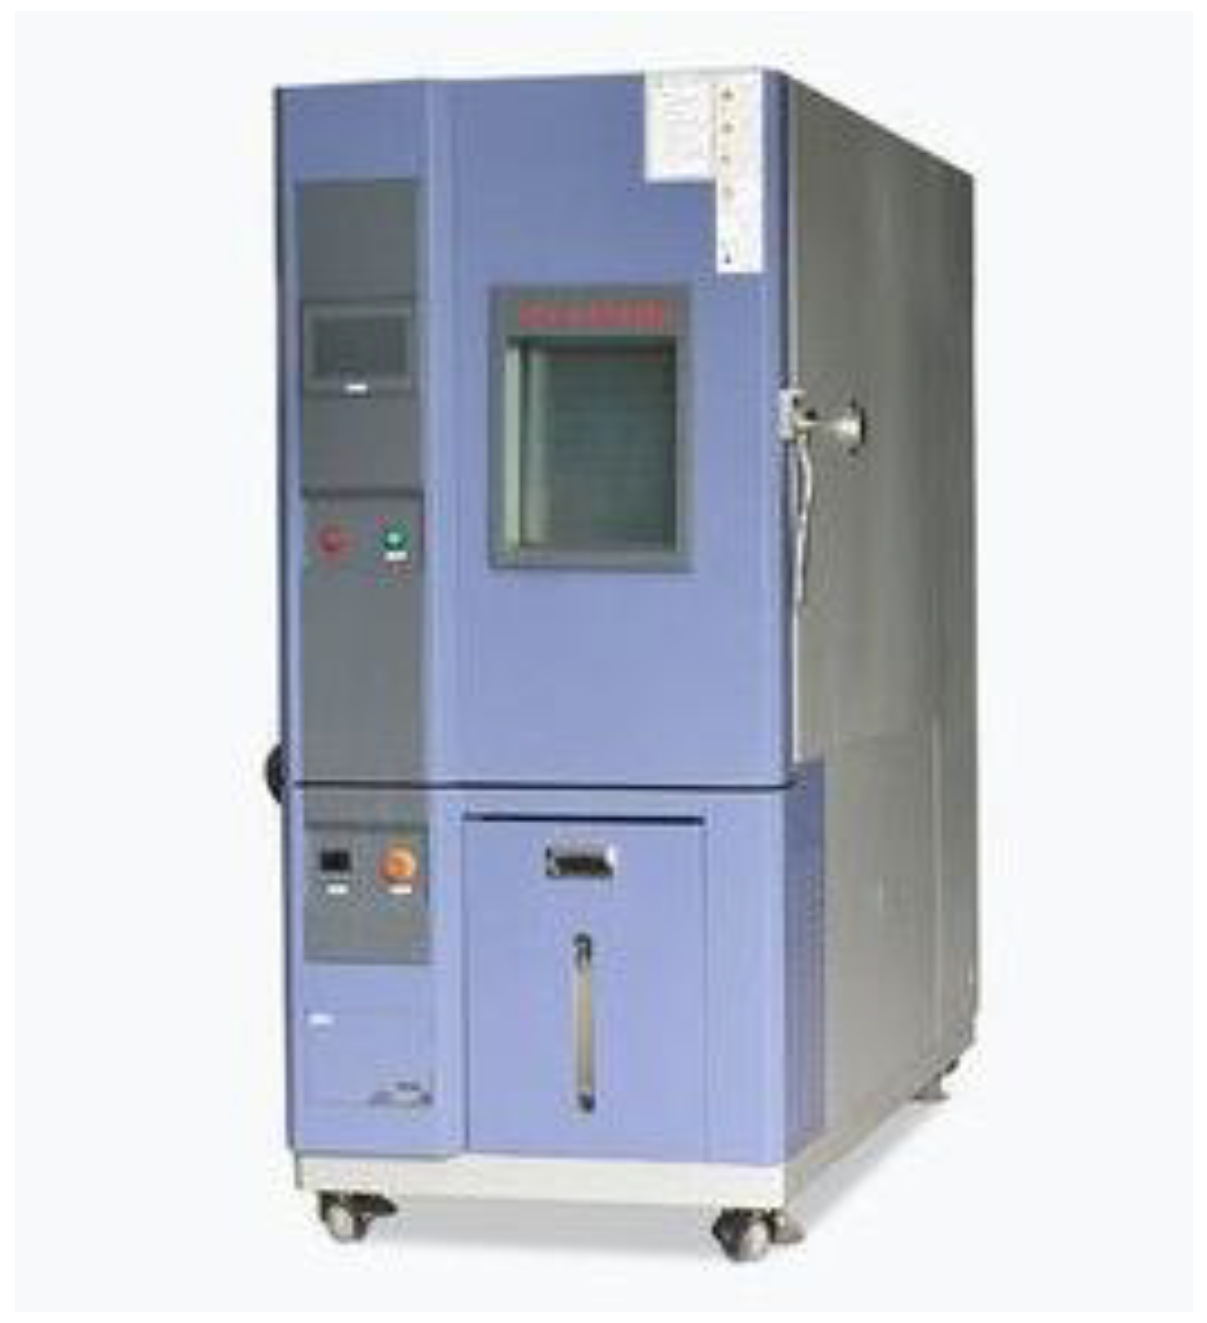
The freeze–thaw test is carried out in the humid heat chamber with rapid temperature change. The temperature control range is from −40 °C to +120 °C, and the allowable error is ±1 °C. The heating and cooling rates are up to 10 °C/min, which meets the requirements of the test, the test chamber is shown in Figure 4. According to meteorological data of the North Grottoes in Qingyang, Gansu, the climatic temperature in the region in recent 10 years is 30 °C at the highest and −20 °C at the lowest. The surface temperature of the caves in summer afternoon is around 40 °C and in the winter the surface temperature is close to −25 °C, with a moderate increase on the basis of the historical true temperature. The annual trend of seasonal relative temperature in the Qingyang shows that the time period of below and above 0 °C is about 6 months. The present study investigates the failure characteristics and variation rules of rock mass under extreme temperature conditions.
The temperature control cycle of the freeze–thaw test is as follows: cooling from 40 °C to −25 °C using 0.5 h, and freezing for 3.5 h; heating from −20 °C to 40 °C using 0.5 h for 0.5 h, and melting for 3.5 h. One cycle lasts 8 h, and the temperature change is shown in Figure 5. To ensure the test indexes can be referred to, in the experiment, two test conditions were set for nondestructive indexes such as surface hardness and wave velocity: (1) the rock samples are placed in an environment with a temperature of 25 °C and humidity of 60% for more than 48 h (simulated in situ test conditions); (2) the rock samples are dried (laboratory test conditions).
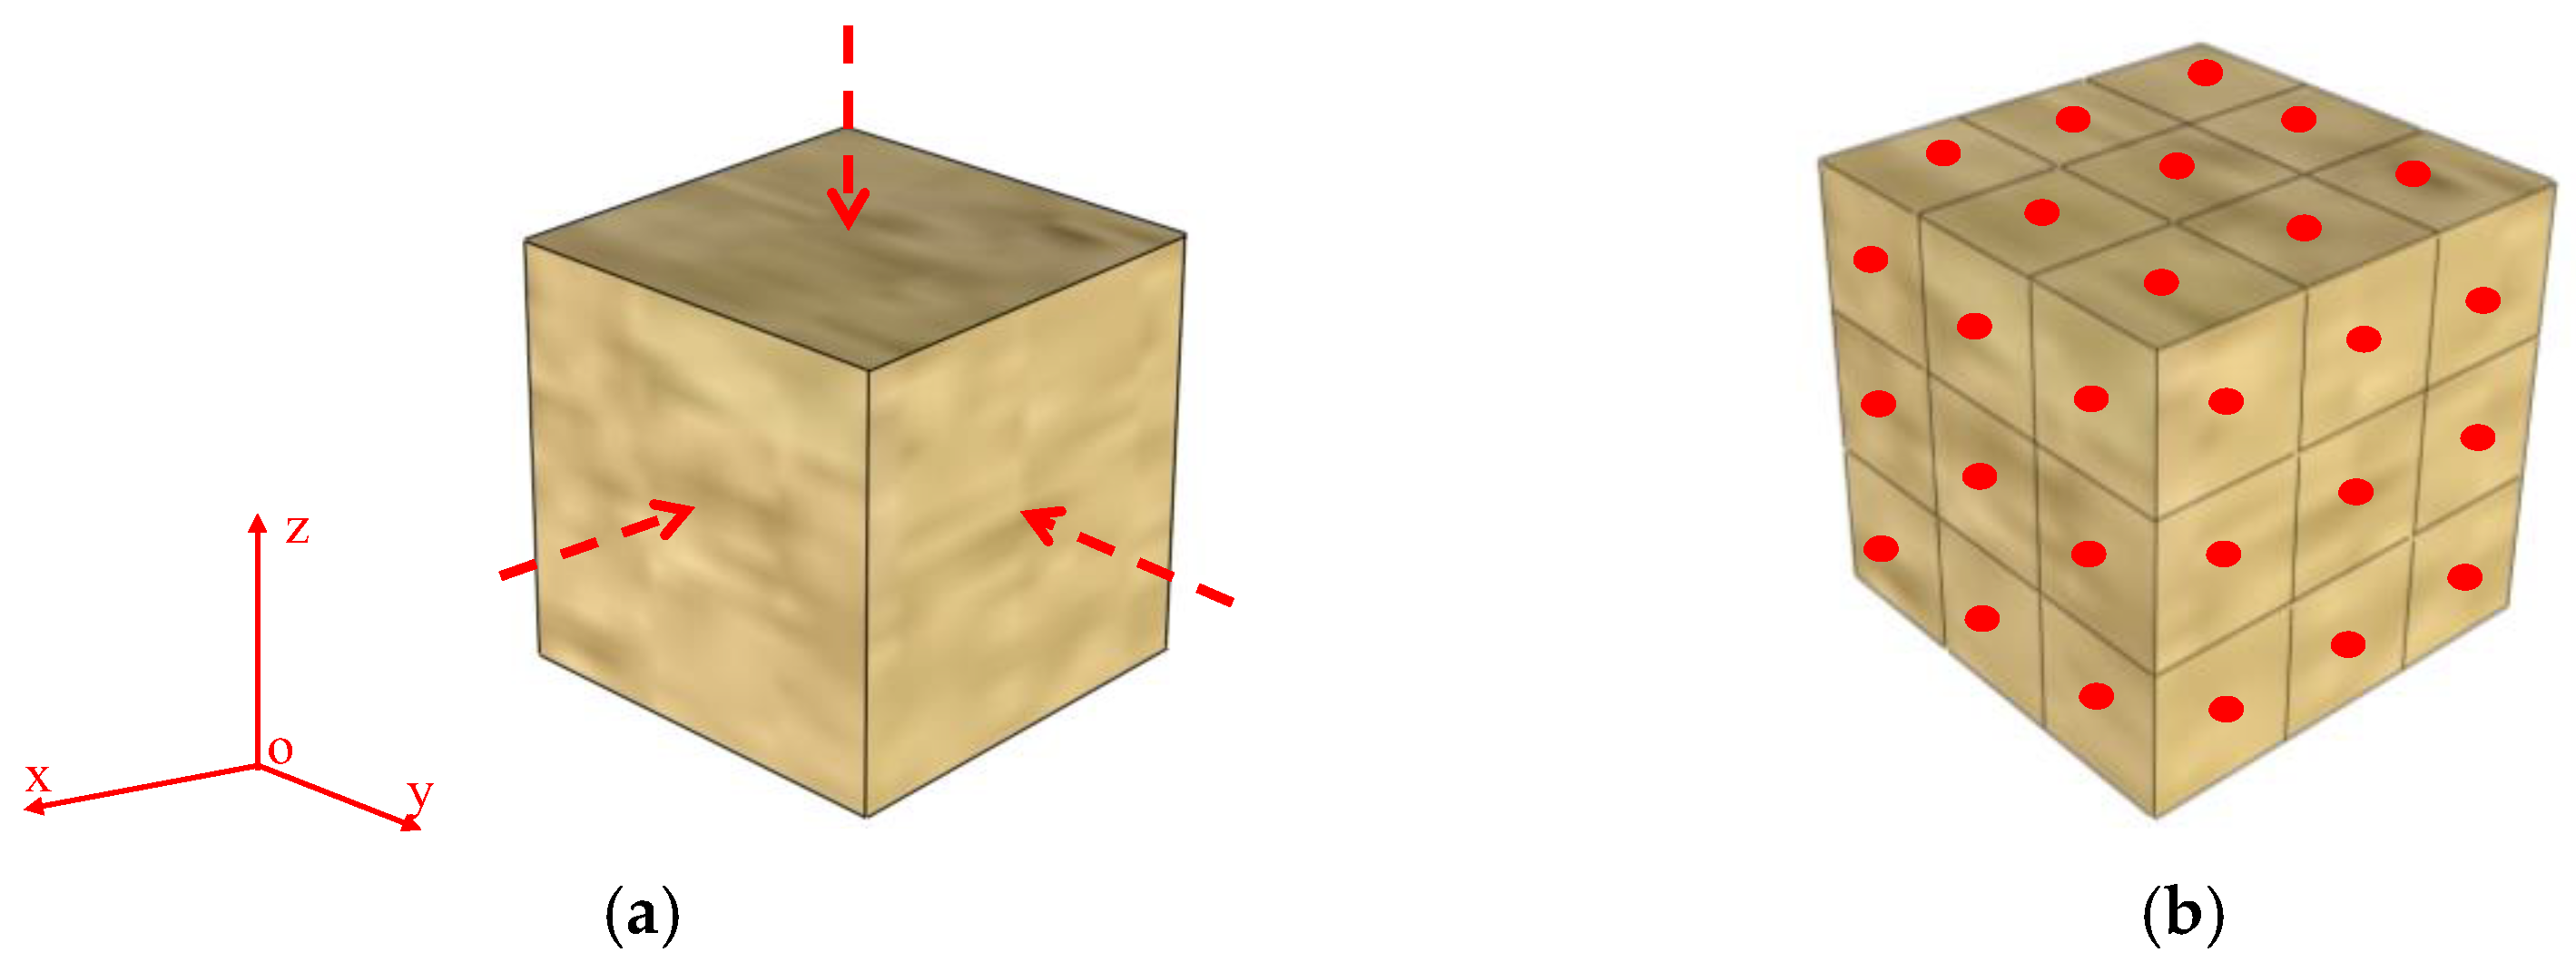
Generally, the degree of weathering can be evaluated by nondestructive or destructive testing [15]. As a destructive test, uniaxial compressive strength (UCS) could directly reflect the mechanical properties of degraded rock, and it can be used as a reference for the non-destructive tests. In this experiment, electronic Hydrostatical balance (Shunyu JA5003, Yuyao, China) was used to determine the mass of the samples and calculate water absorption and porosity. A Leeb abrasion tester (Botech BH200C, Guangzhou, China), non-metallic ultrasonic detector (Koncrete NM-4B, Beijing, China), and universal testing machine (Kexin CSS-WAW 1000DL, Changchun, China) were applied, respectively, to measure the surface hardness, ultrasonic wave velocity, and UCS. The scanning electron microscope (Hitachi S-3000N, Tokyo, Japan) was used to analyze the micro-topography of the samples. The cube rock sample is convenient for testing the surface hardness and wave velocity in multiple areas and directions. For example, the wave velocity values were measured from three directions in space, the surface hardness was measured for 27 areas on three surfaces, and the mean values of the measured values were taken for analysis. The schematic diagram of the test is shown in Figure 6. The indexes of fresh yellow sandstones are shown in Table 2.

3. Results

3.1. Apparent Morphology

The differences in rock samples under different freeze–thaw conditions can be seen from the macroscopic morphology during the tests, as shown in Figure 7. The damage to rock samples under immersion freeze–thaw is the most serious. Rock samples are damaged from the edges and corners, cracks continued to develop along the bedding, particles kept peeling off, and other parts of the rock suffered minor damage. Some rock samples are seriously damaged after 40 cycles. The rock sample as a whole is no longer intact and completely damaged after 80 cycles. The rock samples in the capillary freeze–thaw test showed salt precipitation gradually. After 10 cycles, layered destruction occurred about 2 mm from the bottom, indicating that salt still existed after desalting treatment. Cultural relics in the open air were generally still subjected to salt weathering, the bottom water content of the capillary rock was high, and the damaging effect of freeze–thaw was stronger. In the periodic saturated freeze–thaw test, the macroscopic morphology of rock samples did not change significantly within the testing cycle range, and the touch sensation became rough. A small number of particles peeled off at the edge of rock samples, and the edges and corners became uneven, with slight damage in local areas.
Figure 8 shows the current state of weathering on the façade of the North Grottoes in Qingyang, Gansu, China. It can be seen that, under the influence of freeze–thaw action and cave building environment, the bottom and interior of the cave are seriously damaged by seepage erosion, and the cave deteriorated obviously. There are many longitudinal and transverse pore cracks in the surface layer. In the severely weathered area, part of the surface layer has spalled off. The upper part of the cave, the middle part, and the Buddha in the cave were affected by capillity, the particle loss is serious, and the surface has white crystal precipitation. The appearance of the cavity is similar to the test results, with obvious discoloration and longitudinal and transverse cracks [16].
In terms of the law of change of the micromorphology, the phenological deterioration rate of rock samples under different freeze–thaw modes is different, but the change law of rock samples under the three freeze–thaw conditions is similar. The sample with periodic saturated freeze–thaw cycles is taken as an example, and its micromorphology is shown in Figure 9. At the beginning of the test (Figure 9a), the particles were closely arranged, the pores and cracks were small, and the cement was filled between the particles. After 10 cycles (Figure 9b), the sample was in a state that was “rapid metamorphic”. Compared with the initial compact arrangement, microcracks between grains gradually developed, and some cements were affected by hydrolysis and developed more internal cracks. Small particles such as calcite can be seen attached. During the 10 cycles (Figure 9c), on the one hand, the mass loss of cement led to the formation of pores and the connection of fractures; on the other hand, feldspar and dolomite particles were broken under the influence of hydrolysis, and new fractures were generated on the surface. Finally, at the time of failure (Figure 9d–f), the cracks have been completely connected, and the particles were scattered and cut by them. Some particles also developed internally, and some particles also developed cracks within and became fragments. In general, with the increase in the number of cycles, the cracks of sandstone particles continue to expand, and the pores in rock samples gradually increase and the pore size becomes larger. In addition, the pores continue to expand and extend and gradually form connected cracks; typical variations in rock micro-morphology are shown in the red circle area.

3.2. Open Porosity

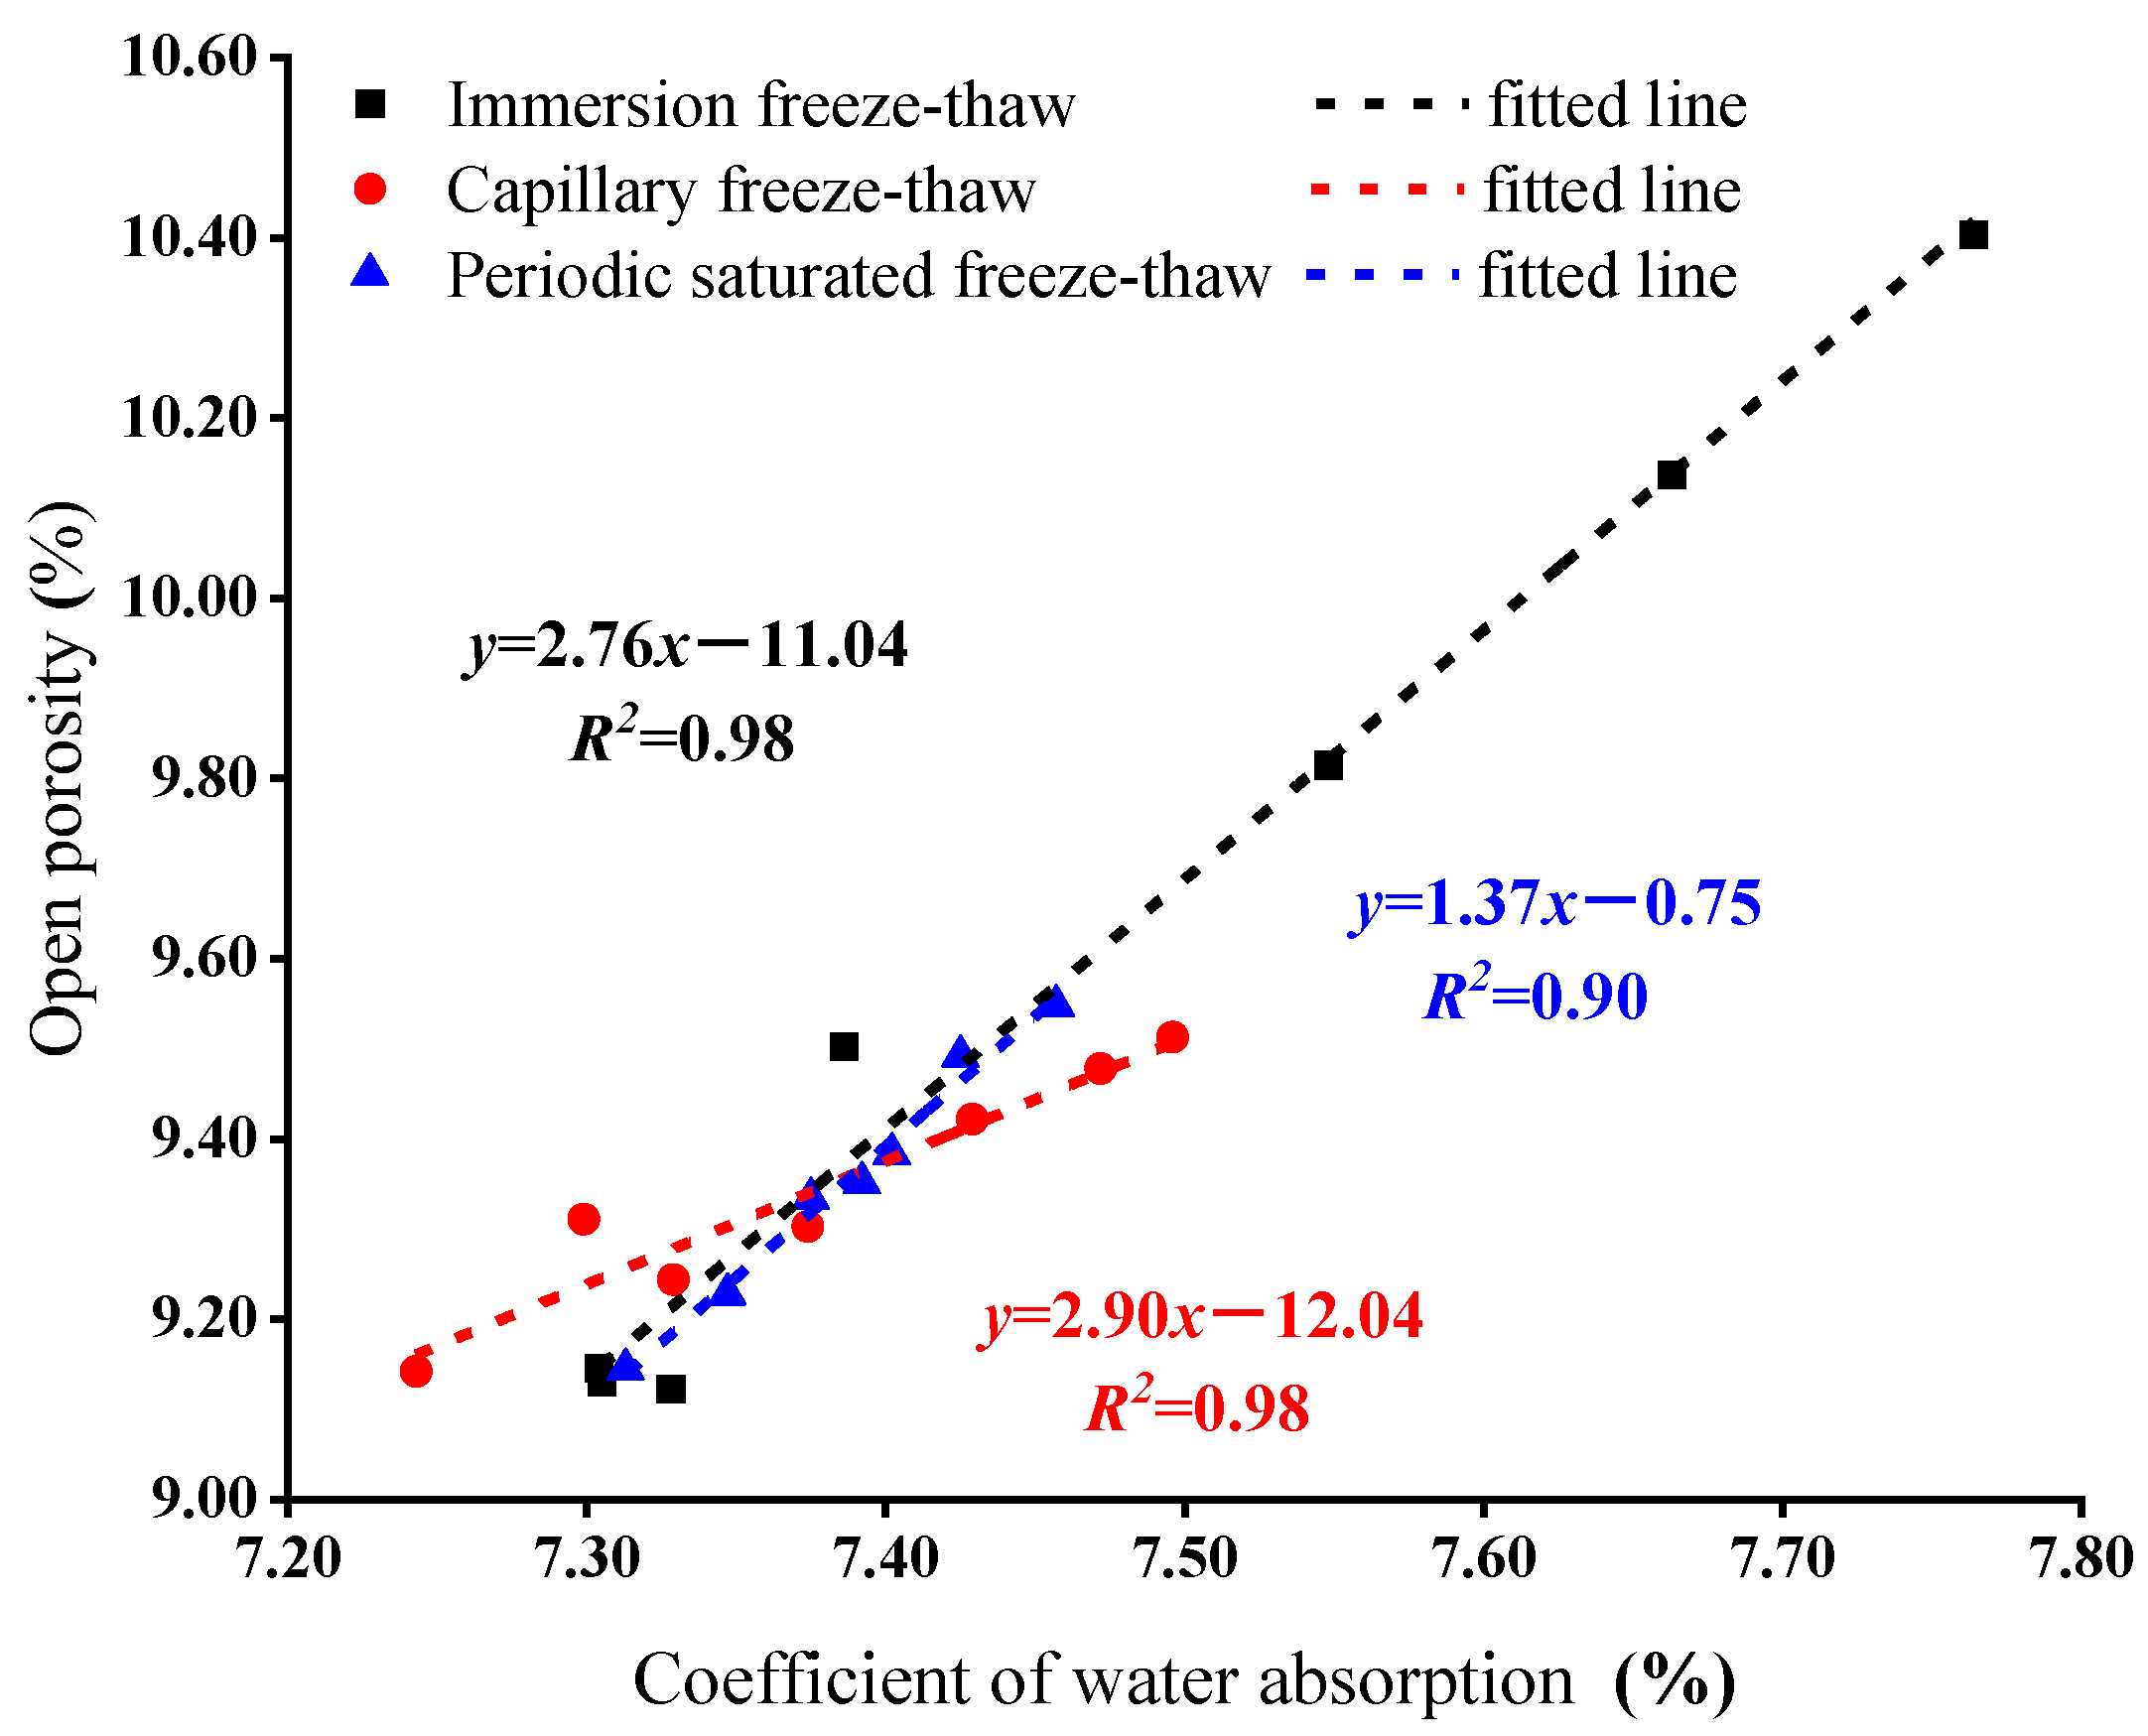
Due to the expansion force caused by pore water freezing or the tension caused by different shrinkage coefficients of each component of the rock sample in the cooling process, the pore size of the rock sample becomes larger, and at the same time, micro-cracks are generated, connecting unopened pores, and the porosity of open pores increases. Figure 10 is the fitting curve of the porosity of the rock sample. With the increase in freeze–thaw cycle times, the porosity of rock samples increases rapidly in the early stage but decreases in the later stage, presenting a logarithmic growth trend. The porosity of the rock samples with 80 freeze–thaw cycles increased to 10.41%. However, the porosity of open pores in capillary and periodic saturated freeze–thaw rock samples is about 9.50%. Water absorption is also an important indicator to reflect the development of rock pores and fractures, and it is easier to measure water absorption in field tests. In this paper, water absorption and porosity are correlated, as shown in Figure 11. It can be seen that there is a good linear correlation between water absorption and open porosity, indicating that the water absorption test can adequately characterize the open porosity of the rock, but the correlation coefficient between the two is different under different freeze–thaw methods, and the water absorption measured on site needs to be calibrated to accurately determine the porosity of rock opening.

3.3. Wave Velocity

Under the preset environment, the wave velocity of the rock sample in the test generally shows a downward trend, as shown in Figure 12. Compare the wave velocity values under the dry state and the preset environment state. The wave velocity of the rock sample under the preset environment is smaller than in the dry state. Because freezing–thawing results in the expansion of rock fissures and the relative increase in rock moisture content, while the wave velocity propagates at a lower speed in the water. Meanwhile, water leads to refraction and energy loss when the wave propagates in porous media. The attenuation law of wave velocity is different under the two test conditions, which means that the water content of rock should be considered when evaluating the degree of weathering of rock by wave velocity [17]. It is true that some stone cultural relics in the open air have a huge volume, and the water content of different parts will be different. This paper only discusses the changes in wave velocity in two representative states of rock.

3.4. Surface Hardness

Surface hardness is one of the important means of nondestructive testing on site. The surface hardness curves of samples are shown in Figure 13. With the increase in freeze–thaw cycle times, the hardness of rock samples decreases to different degrees. As a whole, the hardness value in the immersion freeze–thaw test attenuates greatly, the total loss rate is about 35.6%, and the hardness attenuates more greatly in the early stage. The hardness values of capillary and periodic saturated rock samples do not change much, and the total loss rate is only 3.5%, indicating that the immersion freeze–thaw effect on the surface weathering of rock samples is stronger than that of the other two methods. There is little difference between the surface hardness of dry rock samples and that under the preset environment, indicating that the water content of rock samples has little influence on the hardness value. There is a good exponential decay between surface hardness value and freeze–thaw times:
R = a e ( n / b ) + c
where a, b, and c are constants, R is the value of surface hardness, and n is the number of freeze–thaw cycles.

3.5. Uniaxial Compressive Strength

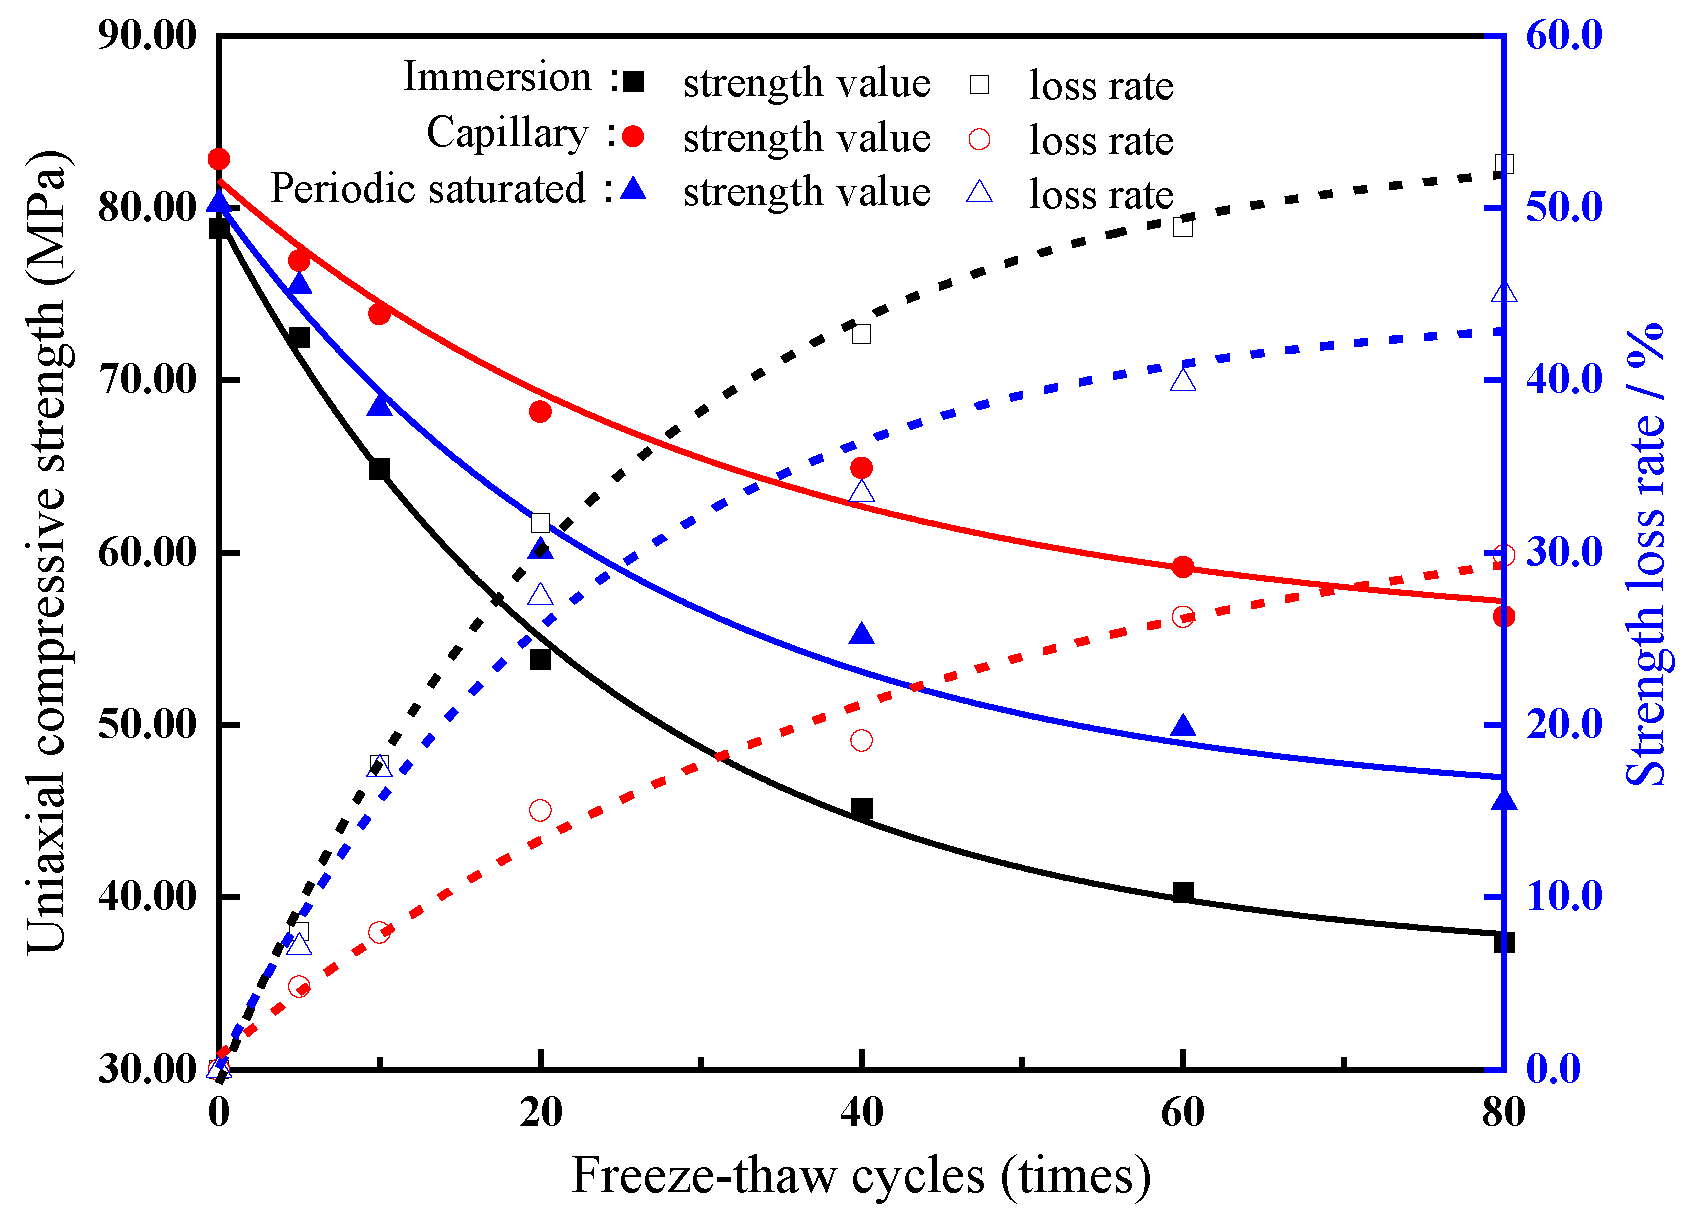
The uniaxial compressive strength (UCS) is an intuitive mechanics index of rocks, and its variation curves and loss rate with the number of freeze–thaw cycles are shown in Figure 14. UCS decreases exponentially with the increase in freeze–thaw cycle times, while the strength loss rate increases exponentially. The attenuation degree of UCS of rock samples in different freeze–thaw modes is different. The strength attenuation of the first 20 freeze–thaw cycles is the fastest, accounting for about 60% of the total attenuation amount, indicating that the sandstone with a better initial state under freeze–thaw action has a faster deterioration rate. With the deepening of the degree of weathering, the deterioration rate of rock samples with the same freeze–thaw cycle times gradually slows down.

3.6. Relationship between Weathering Index and UCS

As a reference index, the quantitative relationship between UCS and the non-destructive index can be analyzed, and then the corresponding physical parameters can be measured by non-destructive testing to evaluate the overall deterioration of stone cultural relics. In general, it is not possible to sample stone heritage sites for the determination of strength parameters for conservation purposes. Research on the internal relationship between indexes, especially in evaluating strength parameters based on non-destructive indexes and establishing their functional relationship, can better evaluate the deterioration degree of cultural heritages and evaluate the trend of change. Hebib et al. [18] established a quantitative relationship with compressive strength based on dry density, porosity, and surface hardness to predict rock mechanical parameters. Sarkar et al. [19] took three types of rocks as research objects and took wave velocity as an independent variable to explore its internal relationship with strength, density, and other indicators. Tamrakar et al. [20], Buyuksagis et al. [21], and Fener et al. [22] compared the laboratory test results with the field test data and believed that the rock strength value could be inferred based on the nondestructive index.
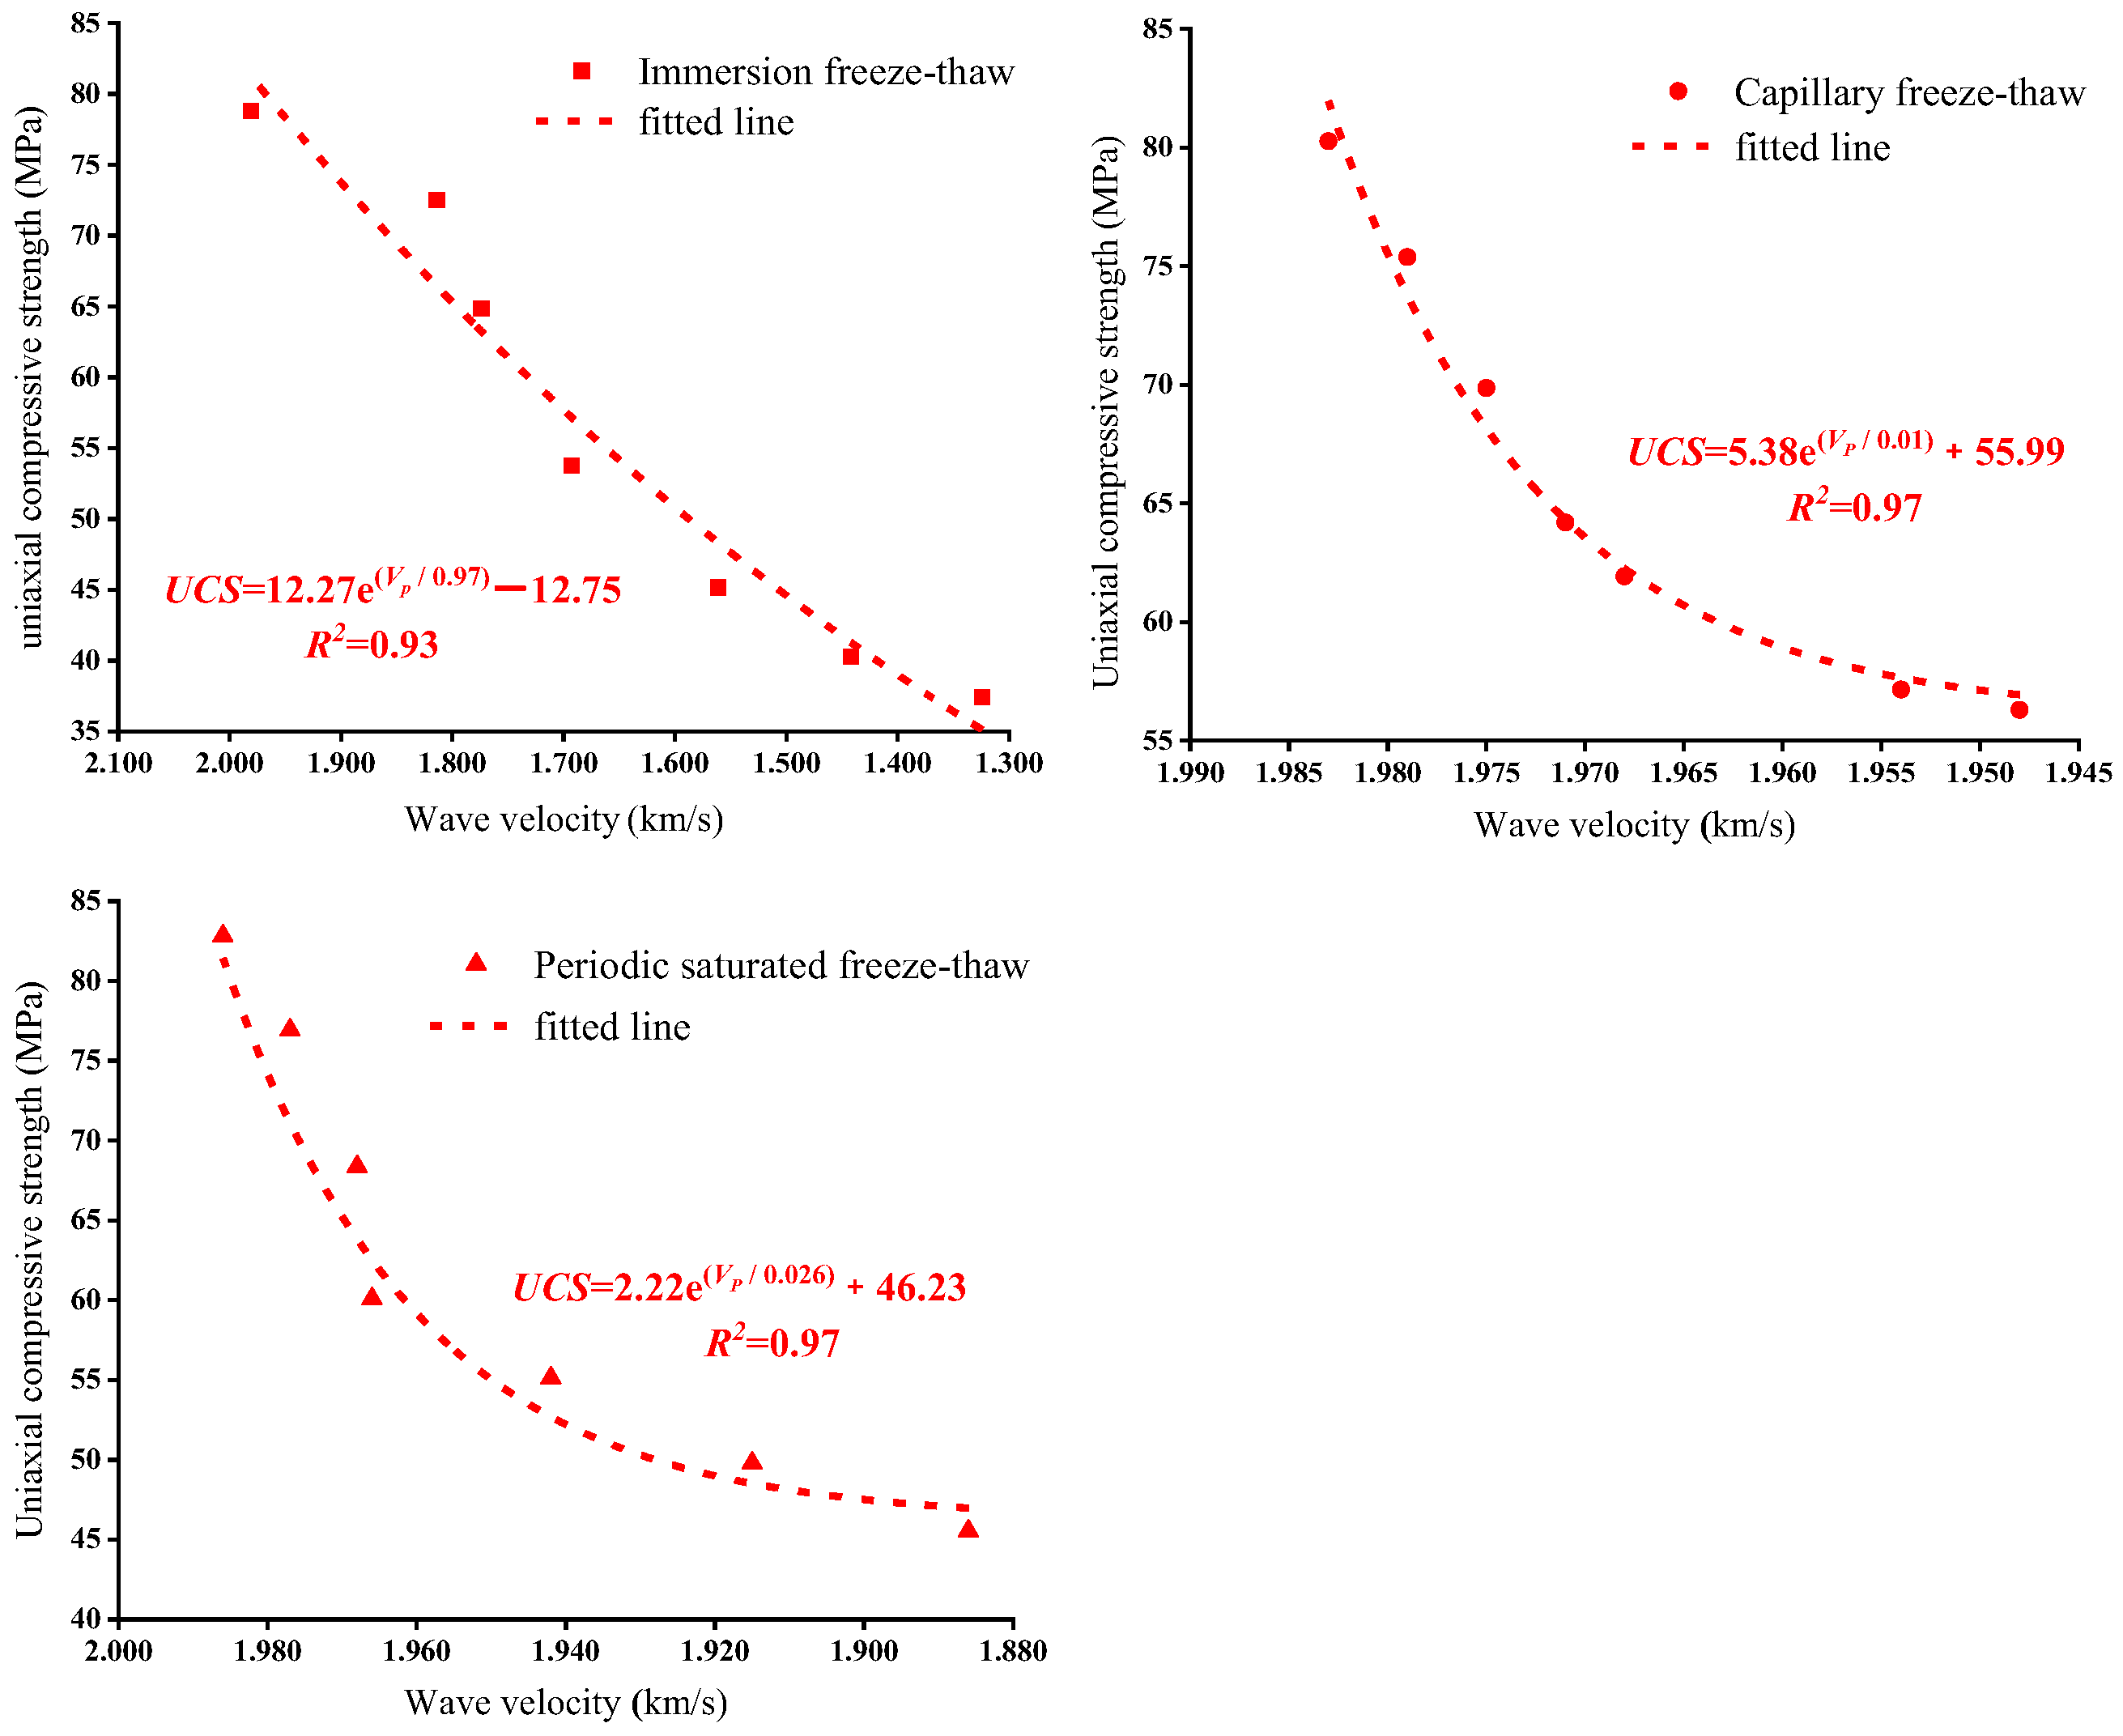
In this study, nondestructive indexes were taken as independent variables and strength parameters were taken as dependent variables to establish functional relationships among indexes. In a certain range, the more serious the internal deterioration of rock, the more significant the pore development, the smaller the ultrasonic wave velocity, and the lower the UCS. Wave velocities and UCS of each series of rock samples were fitted, as shown in Figure 15. There is an exponential relationship between wave velocity and compressive strength:
UCS = a e ( V p / b ) + c
where, a, b and c are constants, and Vp is wave velocity.
Pore porosity is an index reflecting the size and number of rock fissures. Surface hardness is one of the main indexes reflecting the damage to rock surface structure. In this paper, the variation trend of the two characterization indexes and UCS is analyzed, and the concrete relationship between the microstructure and mechanical properties of rock is discussed. The porosity of open holes was fitted to the measured points of compressive strength, as shown in Figure 16.
The curves in Figure 13 show that there is a linear correlation between open porosity and UCS of rock samples under freeze–thaw action, and its variation trend is in line with the functional relationship of Equation (3):
UCS = a b × φ
where a and b are constants, and φ is the open porosity.
Although the porosity and UCS of rock samples in different freeze–thaw environments are linearly fitted, the decrease rate of porosity is different due to the different uniformity of rock porosity changes caused by different freeze–thaw modes.
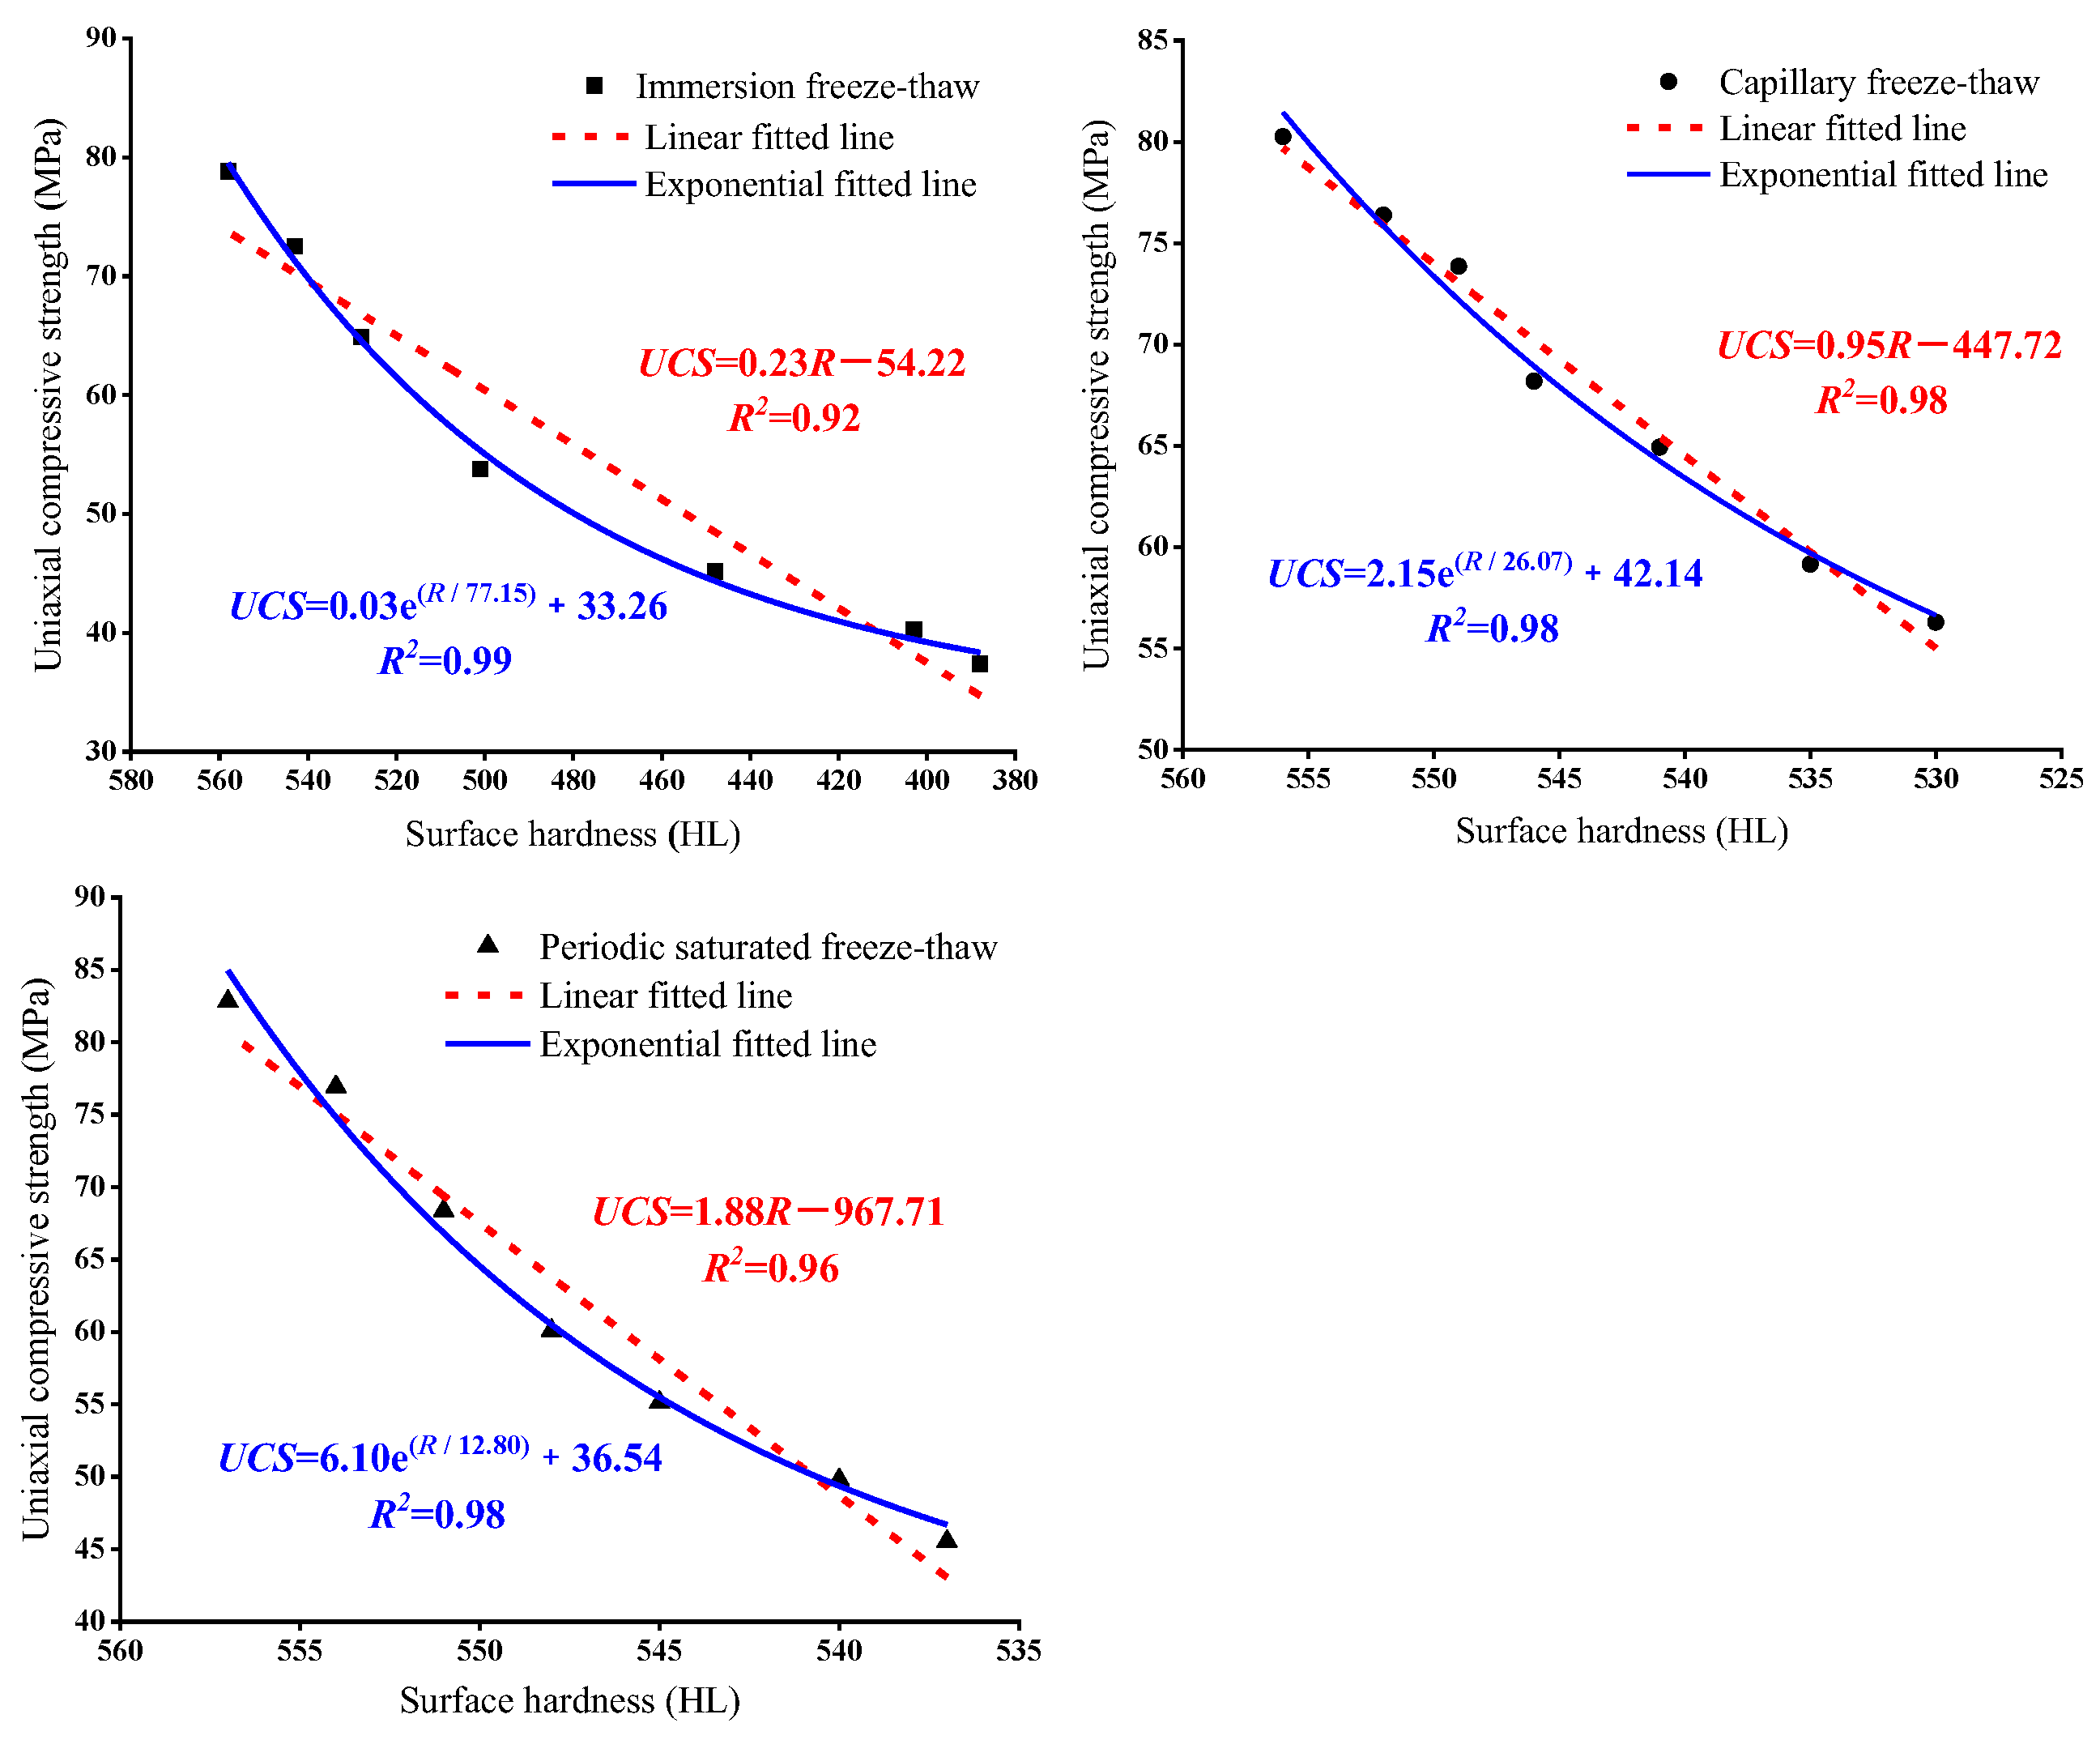
Due to the advantages of a wide measuring range, arbitrary direction, and ease of carrying and operating, surface hardness is widely used in in situ testing [18,23]. The relationships between surface hardness and compressive strength of rock samples were fitted, as shown in Figure 17. Linear and exponential fitting can be carried out between surface hardness and compressive strength of yellow sandstone, as shown in Equations (4) and (5).
UCS = a × R + b
UCS = a e ( R / b ) + c
where a, b, and c are constants, and R is the value of surface hardness.
The correlation coefficients between the two indexes are both high, whether linear or exponential. This experimental result is similar to the research results of other scholars. According to the correlation coefficient, the surface hardness and UCS of yellow sandstone under the effect of freeze–thaw are more inclined to meet the exponential function relationship [23]. Similar to the fitting results of other indexes and UCS, parameters of the fitting function are different under different freeze–thaw modes, which on the one hand indicates that the weathering intensity of rock is different under freeze–thaw modes and also indicates that the deterioration rate of rock is significantly different.

4. Evaluation of Damage Degree

The different indexes analyzed above indicate different degrees of rock damage. Damage variable assessment is an important analysis to measure the irreversible deterioration degree of rock materials, which can quantitatively evaluate the degree of rock damage. The choice of expression method should be combined with the difference and complexity of the physical properties of materials. At present, scholars mainly quantitatively evaluate the deterioration degree of stone heritage from the non-destructive and micro-level, such as physical properties, mechanical properties, and mineral chemical composition [24,25]. For example, Wilhelm et al. [26] and Waraga et al. [27] evaluate the weathering of tombstones and stupas according to surface hardness. Reng et al. [28] and Sun et al. [29] used wave velocity to analyze the internal deterioration of the Yungang Grottoes and the Beijing Xihuang Temple to provide a theoretical basis for formulating appropriate protection measures. Compared with the non-dimensional evaluation, the comparison between indicators tends to be a qualitative evaluation. Wang et al. [30] and Liu et al. [31] studied several advances in the theoretical study of rock damage mechanics and believed that rock damage degree could be defined by wave velocity variation. Liu H et al. [32] and Wang et al. [33] proposed evaluating the grade of rock deterioration through strength change and proposed a decay prediction model for sandstone mechanical indexes under freeze–thaw action. This study refers to the above research to define the damage factors and evaluate the degree of weathering of samples. In addition, Khan N et al. [34] developed three models for predicting the degree of flint thermal response damage based on density, wave velocity and porosity. The results showed that the prediction model similar to the neural network was more accurate than MLR and ANFIS, and the damage factor based on porosity was more effective than that based on elastic modulus.
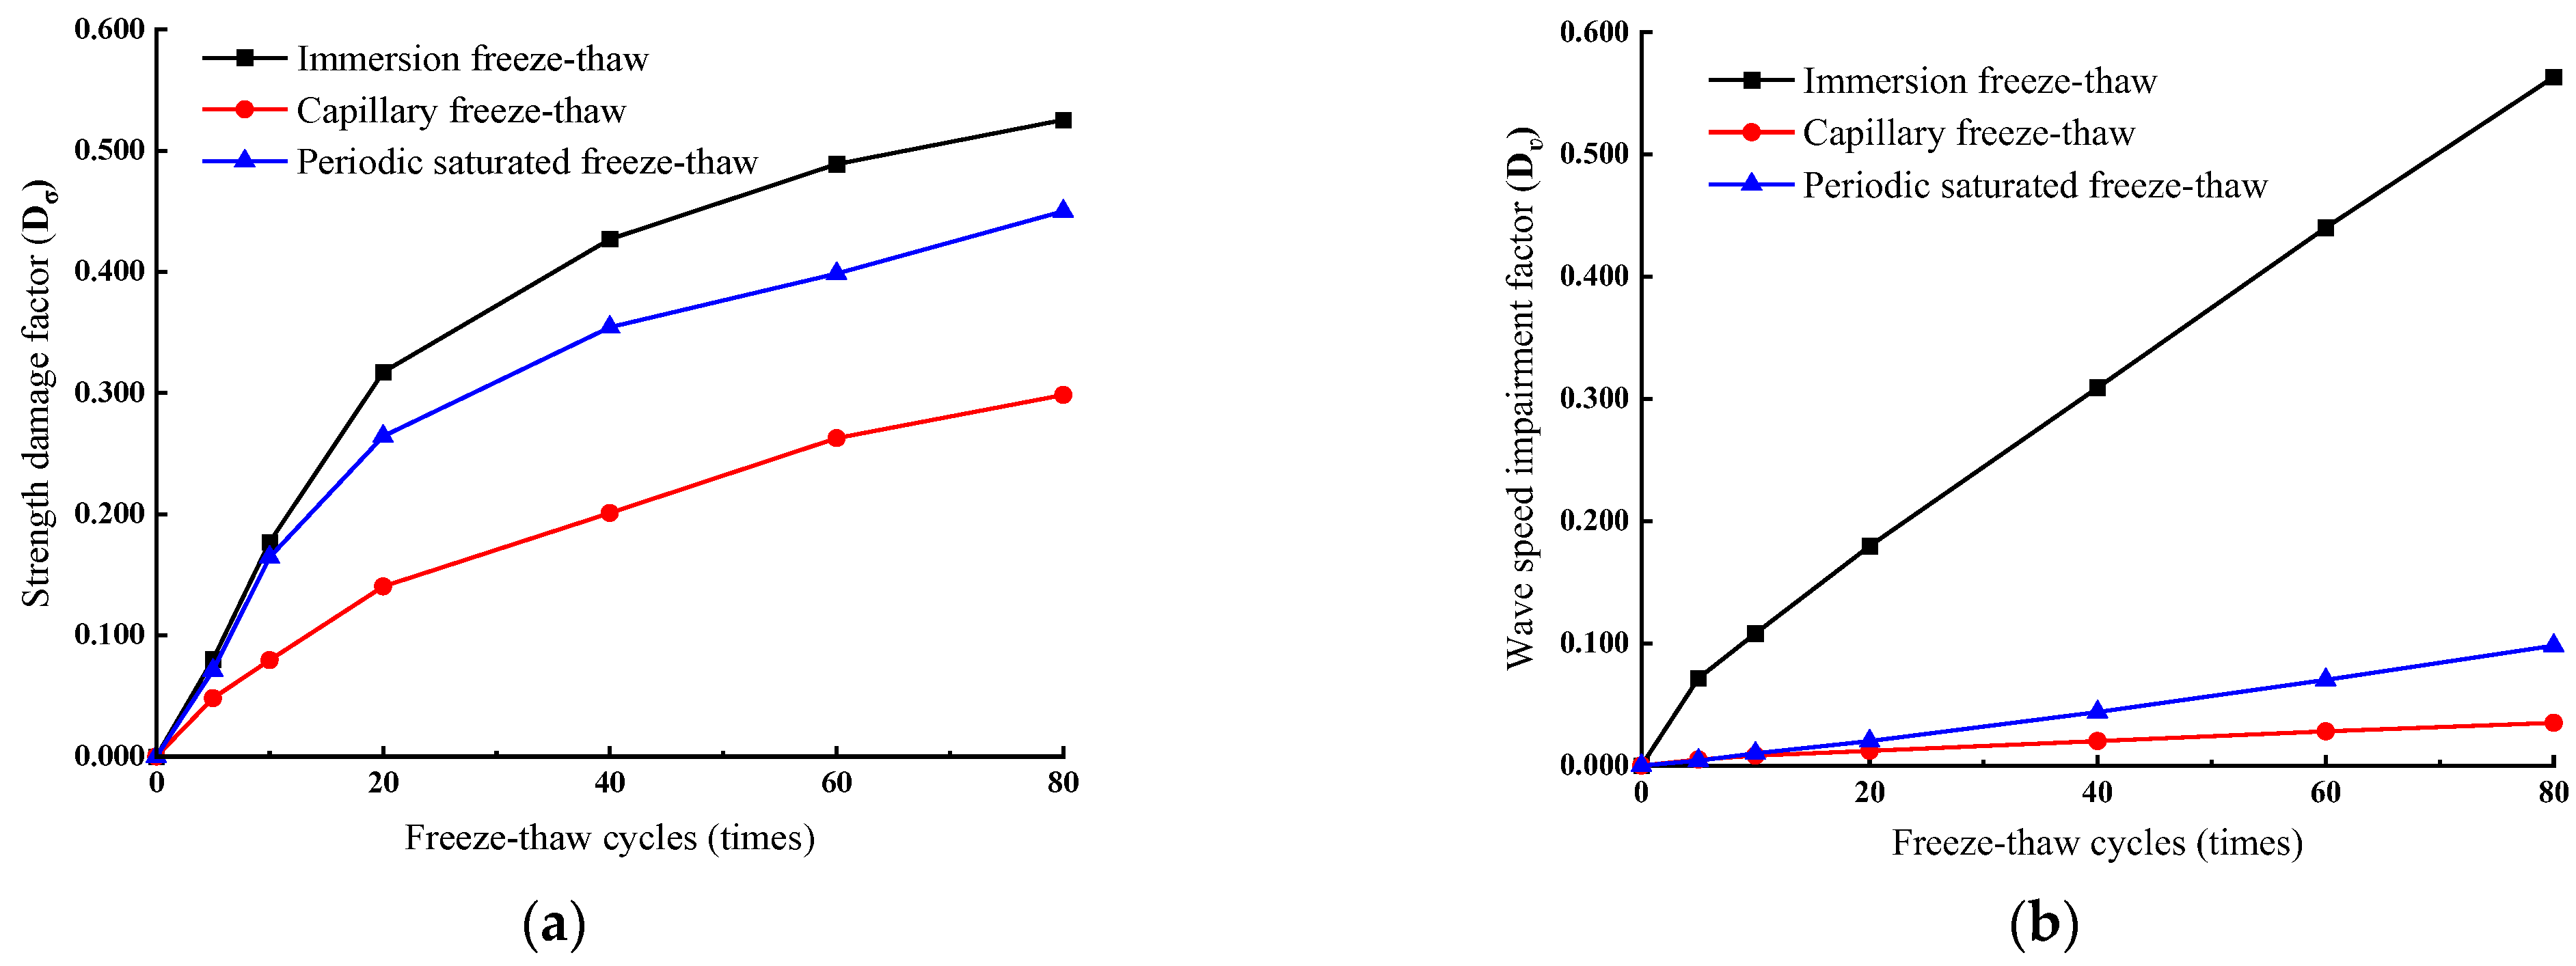
To explore the degree of damage to sandstone caused by different freeze–thaw modes, two damage factors, strength damage factor Dσ and wave velocity damage factor Dv, were introduced to quantitatively analyze the damage degree of rock. The calculation methods are shown in Equations (6) and (7), and the results are shown in Table 3.
D σ = 1 σ 1 σ 0
D v = 1 ( v 1 v 0 ) 2
The change in damage factors of rock samples under different freeze–thaw modes is shown in Figure 18. It can be seen that under the effect of different freeze–thaw modes, the strength damage factors of rock samples show a trend of rapid growth at first and then slow growth. Among them, the damaging effect of submerged freeze–thaw is the strongest, followed by periodic saturated freeze–thaw, and capillary freeze–thaw is relatively small. The strength decline of rock samples is the most significant in the first 20 freeze–thaw cycles, and the damage factor accounts for about 60% of the total damage degree, which reflects the deep damage to rock in the initial freeze–thaw stage. At the 80th of freeze–thaw cycle, the damage factor of the submerged freeze–thaw rock sample is as high as 0.526, and that of capillary freeze–thaw and periodic saturated rock sample is 0.299 and 0.451, respectively. Wave velocity damage factor also relatively accurately reflects the degree of rock damage. Compared with immersion freeze–thaw, the wave velocity damage factors of rock under capillary freeze–thaw and periodic saturation freeze–thaw are low, mainly in the process of the experimental sample immersed in water entering the inside rock, and are more likely to cause greater damage to the rock. The moisture content of the rock itself and its microenvironment cannot be ignored.
Obviously, with different freeze–thaw modes, all the indexes of rock samples changed to different degrees with the increase in the number of cycles. For submerged freeze–thaw deterioration and dispersion, the worst result is mainly in the process of freezing and thawing frost heave and hydrolysis of rock damage, frozen within the different mineral composition, and dispersed shrinkage when the non-uniformity produced leads to internal damage and phase transition of the water form a frost heaving force; water melt release energy will also cause damage to the samples, as well as submerged rock caused by the pore water and surface water of double damage. In the rock affected by capillary water, the uneven water content causes some dissolved materials to block the pores of the rock and prevent water from entering the rock interior [35]. When the rock is in periodic saturation state, its water content will increase significantly, and the effect of freeze–thaw damage will be greatly enhanced, which will cause irreversible damage to the rock.
The freeze–thaw failure is not only closely related to the mineral composition, expansion coefficient, porosity, grain size, and uniformity of the rock. In immovable karst caves, the effect of freeze–thaw damage is also limited by complex external environments such as temperature, humidity, microorganisms, and salinity. Even in different parts of the same cave, the degree of weathering is different (Figure 19), and the test results are similar to the weathering characteristics of cultural relics. On this basis, the degree of rock metamorphism was carefully analyzed and the precise protection measures are formulated. Among existing studies, Li Z [36] divided the North Grottoes of Qingyang into four weathering levels according to the rock damage characteristics, but there is a lack of quantitative evaluation of the damage caused by a single freeze–thaw action to the cave. An in situ test (hardness, wave velocity and other non-destructive means) was used to accurately assess the deterioration degree of rocks, and then the weight of freeze–thaw damage cycles during weathering was analyzed, which provided a theoretical basis for the establishment of a systematic heritage protection evaluation system. In this study, only the influence of the freeze–thaw mode on sandstone samples was analyzed, but the types of stone relics are abundant. In addition to the deterioration of stone cultural relics caused by freeze–thaw cycles, weathering processes such as salt crystallization and alternating wetting and drying are also the main factors leading to the weathering of cultural relics. The influence of weathering and environment on the damage characteristics of cultural relics of different lithology should also be considered. In addition, more detection techniques can be used to assess the degree of deterioration of rocks through different weathering indicators.

5. Conclusions

By simulating the freeze–thaw weathering of yellow sandstone in different environments, the variation law of sandstone indexes was analyzed, the influence of freeze–thaw modes on the damaging effect of freeze–thaw was studied, and the quantitative relationship between physical property indexes and mechanical indexes was discussed. According to the rock samples and weathering conditions used in this experiment, the following conclusions were obtained:
(1)
The environment of rocks is an important prerequisite for weathering protection. The damage characteristics of rock samples caused by different freeze–thaw modes are quite different on the macro level. The damage to sandstone is the most serious under the action of immersion freeze–thaw, and the overall damage of some rock samples occurs within 80 cycles. The damage caused by periodic saturated freeze–thaw is the next most serious. Capillary freeze–thaw damage is the least significant, and it is significant only in the range of 2 mm at the bottom.
(2)
The change in the testing environment affects the water content of the rock, leading to a certain difference in the test results of wave velocity. As the curve change rates of wave velocity and the number of freeze–thaw cycles are different in different testing environments, attention should be paid to this difference in on-site nondestructive testing.
(3)
As the number of freeze–thaw cycles increased, the UCS of sandstone showed a decreasing trend of first fast and then slow, while the strength loss rate shows a rising trend of first fast and then slow, both of which show a good exponential relationship with the number of freeze–thaw cycles. In the early stage, the strength loss increases rapidly. After 20 cycles, the strength attenuation accounts for about 60% of the total attenuation value of 80 cycles, and then the strength loss gradually slows down.
(4)
There are different correlations between different non-destructive weathering indexes and UCS. Due to the differences in damage uniformity and severity, the fitting parameters are different in different freeze–thaw modes. Therefore, the range of fitting parameters should be determined according to the weathering environment of rock when the nondestructive testing indexes are used to judge or evaluate the mechanical parameters of rock.
(5)
Damage variable evaluation is an important analysis to measure the irreversible deterioration degree of rock materials. The weathering degree of rock samples undergoing the same cycle times is different, among which the damage degree of immersion freeze–thaw is the highest, followed by periodic saturated freeze–thaw, and the damaging effect of capillary freeze–thaw is the least. This is consistent with the overall results of the experiment.

Author Contributions

Conceptualization, N.P. and J.H. (Jizhong Huang); methodology, N.P. and J.H. (Jie Hong); software, Y.Z.; validation, Y.D.; formal analysis, J.H. (Jie Hong), Y.Z. and B.S.; investigation, B.S.; writing—original draft preparation, N.P. and J.H. (Jie Hong); writing—review and editing, Y.Z. and J.H. (Jizhong Huang); funding acquisition, J.H. (Jizhong Huang) and N.P. All authors have read and agreed to the published version of the manuscript.

Funding

This research was funded by the National Key Research and Development Program of China (No. 2019YFC1520500), and the National Natural Science Foundation of China (No. 51808246).

Institutional Review Board Statement

Not applicable.

Informed Consent Statement

Not applicable.

Data Availability Statement

The data used to support the findings of this study are available from the corresponding author upon request.

Conflicts of Interest

The authors declare no conflict of interest.

References

  1. Yi, Y.; Chen, Y. An Analysis of the Statistics on Major Historical and Cultural Sites Protected at the National Level. Southeast Cult. 2021, 4, 6–15. [Google Scholar]
  2. Wang, J.H.; Chen, J.Q.; Wang, L.L.; Wang, Y.; Gao, P.H. Deterioration Patterns of Grotto Temples in China. Southeast Cult. 2022, 4, 25–32. [Google Scholar]
  3. Park, J.; Hyun, C.; Park, H. Changes in microstructure and physical properties of rocks caused by artificial freeze-thaw action. Bull. Eng. Geol. Environ. 2015, 74, 555–565. [Google Scholar] [CrossRef]
  4. Xu, G.M.; Liu, Q.S. AnalysisS of mechanism of rock failure freeze-thaw cycling and menchanical testsing study on frozen-thawed rocks. Chin. J. Rock Mech. Eng. 2005, 24, 3076–3082. [Google Scholar]
  5. Huang, S.B.; Cai, Y.T.; Liu, Y.Z.; Liu, G.F. Experimental and Theoretical Study on Frost Deformation and Damage of Red Sandstones with Different Water Contents. Rock Mech. Rock Eng. 2021, 54, 1–19. [Google Scholar] [CrossRef]
  6. Zhang, H.; Meng, X.; Yang, G. A study on mechanical properties and damage model of rock subjected to freeze-thaw cycles and confining pressure. Cold Reg. Sci. Technol. 2020, 174, 103056. [Google Scholar] [CrossRef]
  7. Liu, C.Y.; Zheng, D.Z.; Zhang, X.X.; Chen, C.H.; Cao, Y.B. Influence of freeze-thaw temperature change rate on mechanics feature of rock during loading process. Rock Soil Mech. 2022, 43, 2071–2082. [Google Scholar]
  8. Yamabe, T.; Neaupane, K.M. Determination of some thermo-mechanical properties of Sirahama sandstone under subzero temperature condition. Int. J. Rock Mech. Min. Sci. 2001, 38, 1029–1034. [Google Scholar] [CrossRef]
  9. Gholamreza, K.; Reza, Z.; Yasin, A. The effect of freeze–thaw cycles on physical and mechanical properties of Upper Red Formation sandstones, central part of Iran. Arab. J. Geosci. 2015, 8, 5991–6001. [Google Scholar]
  10. Fang, Y.; Qiao, L.; Chen, X.; Yan, S.J.; Zhai, G.L.; Liang, Y.W. Experimental study of freezing thawing cycles on sandstone in Yungang grottoes. Rock Soil Mech. 2014, 35, 2433–2442. [Google Scholar]
  11. Kodama, J.; Goto, T.; Fujii, Y.; Hagan, P. The effects of water content, temperature and loading rate on strength and failure process of frozen rocks. Int. J. Rock Mech. Min. Sci. 2013, 62, 1–13. [Google Scholar] [CrossRef]
  12. Chen, T.; Yeung, M.; Mori, N. Effect of water saturation on deterioration of welded tuff due to freeze-thaw action. Cold Reg. Sci. Technol. 2004, 38, 127–136. [Google Scholar] [CrossRef]
  13. Sarici, D.; Ozdemir, E. Determining point load strength loss from porosity, Schmidt hardness, and weight of some sedimentary rocks under freeze-thaw conditions. Environ. Earth Sci. 2018, 77, 621–629. [Google Scholar] [CrossRef]
  14. Jia, H.L.; Ding, S.; Zi, F.; Shen, Y.J. Evolution in sandstone pore structures with freeze-thaw cycling and interpretation of damage mechanisms in saturated porous rocks. Catena 2020, 195, 1–9. [Google Scholar] [CrossRef]
  15. Zhang, J.K.; Liu, D.; Ma, Y.J.; Zhang, H. Water-Rock Mechanism of Weakly Consolidated Sandstone: A Case Study of Qingyang North Grottoes. J. Northeast. Univ. (Nat. Sci.) 2022, 43, 1019–1032. [Google Scholar]
  16. Moses, C.; Robinson, D.; Barlow, J. Methods for measuring rock surface weathering and erosion: A critical review. Earth-Sci. Rev. 2014, 135, 141–161. [Google Scholar] [CrossRef]
  17. Deng, H.F.; Yuan, X.F.; Li, J.L.; He, M.; Luo, Q.; Zhu, M. Experimental research on influence of saturationS degree on sandstone longitudinal wave velocity and strength. Chin. J. Rock Mech. Eng. 2013, 32, 1625–1631. [Google Scholar]
  18. Hebib, R.; Belhai, D.; Alloul, B. Estimation of uniaxial compressive strength of North Algeria sedimentary rocks using density, porosity, and Schmidt hardness. Arab. J. Geo. Sci. 2017, 10, 383–396. [Google Scholar] [CrossRef]
  19. Sarkar, K.; Vishal, V.; Singh, T. An Empirical Correlation of Index Geomechanical Parameters with the Compressional Wave Velocity. Geotech. Geol. Eng. 2012, 30, 469–479. [Google Scholar] [CrossRef]
  20. Tamrakar, N.; Yokota, S.; Shrestha, S. Relationships among mechanical, physical and petrographic properties of Siwalik sandstones, Central Nepal Sub-Himalayas. Eng. Geol. 2007, 90, 105–123. [Google Scholar] [CrossRef]
  21. Buyuksagis, I.; Goktan, R. The effect of Schmidt hammer type on uniaxial compressive strength prediction of rock. Int. J. Rock Mech. Min. Sci. 2007, 44, 299–307. [Google Scholar] [CrossRef]
  22. Fener, M.; Kahraman, S.; Bilgil, A.; Gunaydin, O. A Comparative Evaluation of Indirect Methods to Estimate the Compressive Strength of Rocks. Rock Mech. Rock Eng. 2005, 38, 329–343. [Google Scholar] [CrossRef]
  23. Kahraman, S. Evaluation of simple methods for assessing the uniaxial compressive strength of rock. Int. J. Rock Mech. Min. Sci. 2001, 38, 981–994. [Google Scholar] [CrossRef]
  24. Zhou, X.; Gao, F. Study and Non-destructive or Qudsi-nondestructive Testing Methods on Weathering Diseases of Stone Cultural Relics. China Cult. Herit. Sci. Res. 2015, 2, 68–75. [Google Scholar]
  25. Li, R.Y.; Wu, L.Q. Research on charactristic indexes of weathering intensity of mrocks. Chin. J. Rock Mech. Eng. 2004, 22, 3830–3833. [Google Scholar]
  26. Wilhelm, K.; Viles, H.; Burke, O.; Mayaud, J. Surface hardness as a proxy for weathering behaviour of limestone heritage: A case study on dated headstones on the Isle of Portland, UK. Environ. Earth Sci. 2016, 75, 1–16. [Google Scholar] [CrossRef]
  27. Waragai, T. The effect of rock strength on weathering rates of sandstone used for Angkor temples in Cambodia. Eng. Geol. 2016, 207, 24–35. [Google Scholar] [CrossRef]
  28. Ren, J.G.; Wang, S.; Meng, T.H.; Yang, J.; Hu, C.F. Application of ultrasonic nondestructive testing technique in the protection of Yungang Grottoes. Geotech. Investig. Surv. 2021, 49, 68–73. [Google Scholar]
  29. Sun, J.Z.; Chen, X.; Yuan, J.; Tian, X.F. Test Methods for Detecting Weathering Degrees of Stone Cultural Relics. Sci. Technol. Rev. 2006, 08, 19–24. [Google Scholar]
  30. Wang, G. SomeProgressin theStudy of Rock DamageMechanicsTheory. Friend Sci. Amat. 2013, 7, 104–105. [Google Scholar]
  31. Liu, Q.; Huang, S.; Kang, Y.; Liu, X.W. A prediction model for uniaxial compressive strength of deteriorated rocks due to freeze-thaw. Cold Reg. Sci. Technol. 2015, 125, 96–107. [Google Scholar] [CrossRef]
  32. Liu, H.; Wang, G.; Chen, F. Research Devlopment of Rock Damage Theory Characterized by Damage Variables. Blasting 2004, 1, 9–12. [Google Scholar]
  33. Wang, P.; Jin, Y.; Liu, S.; Liu, S.H.; Wang, Y. A prediction model for the dynamic mechanical degradation of sedimentary rock after a long-term freeze-thaw weathering: Considering the strain-rate effect. Cold Reg. Sci. Technol. 2016, 131, 16–23. [Google Scholar] [CrossRef] [Green Version]
  34. Khan, N.M.; Cao, K.W.; Emad, M.Z.; Hussain, S.; Rehman, H.; Shah, K.S.; Rehman, F.U.; Muhammad, A. Development of Predictive Models for Determination of the Extent of Damage in Granite Caused by Thermal Treatment and Cooling Conditions Using Artificial Intelligence. Mathematics 2022, 10, 2883–2905. [Google Scholar] [CrossRef]
  35. Eslami, A.; Walbert, C.; Beaucour, A.; Bourges, A.; Noumowe, A. Influence of physical and mechanical properties on the durability oflimestone subjected to freeze-thaw cycles. Constr. Build. Mater. 2018, 162, 420–429. [Google Scholar] [CrossRef]
  36. Li, Z. Bingling Temple, Maijishan and Qingyang Research on the weathering of the North Grottoes. Relics Mus. 1985, 3, 66–75. [Google Scholar]
Figure 1. Schematic diagram of different parts of stone cultural relics.
Applsci 12 12395 g001
Figure 2. Rock sampling site: Qingyang, Gansu, China. (a) Map of China; (b) map of Qingyang; (c) north Grottoes.
Applsci 12 12395 g002
Figure 3. Schematic diagram of three freeze–thaw methods test. (a) Immersion freeze–thaw; (b) capillary freeze–thaw; (c) capillary freeze–thaw.
Applsci 12 12395 g003
Figure 4. Rapid temperature to humidity test chamber.
Applsci 12 12395 g004
Figure 5. Schematic diagram of freeze–thaw cycle temperature variation.
Applsci 12 12395 g005
Figure 6. Schematic diagram of the weathering index test. (a) Schematic diagram of wave velocity test, the arrows indicate the three test directions; (b) hardness test points, the circles indicate the different test areas.
Applsci 12 12395 g006
Figure 7. Variation characteristics of macroscopic morphology of rock samples under different freeze–thaw modes. (a) Immersion freeze–thaw 60 cycles; (b) immersion freeze–thaw 60 cycles; (c) immersion freeze–thaw 60 cycles.
Applsci 12 12395 g007
Figure 8. Weathering characteristics of Qingyang North Grottoes under freeze–thaw action. (a) Significant fissures at the base and upper areas of the cave; (b) white crystal precipitation from the upper and middle surfaces of the cavity; (c) the blurred face of the Buddha.
Applsci 12 12395 g008
Figure 9. Microscopic morphology changes of rock samples with capillary freeze–thaw cycles: (a) 5 cycles; (b) 10 cycles; (c) 20 cycles; (d) 40 cycles; (e) 60 cycles; (f) 80 cycles.
Applsci 12 12395 g009
Figure 10. Open porosity changes in rock samples.
Applsci 12 12395 g010
Figure 11. Relationship between rock water absorption and open porosity.
Applsci 12 12395 g011
Figure 12. Wave velocity of rock samples under different test conditions.
Applsci 12 12395 g012
Figure 13. Surface hardness of rock samples under different test conditions.
Applsci 12 12395 g013
Figure 14. UCS and loss rate of rock under freeze–thaw action, the solid lines show the trend of strength value change, and the dotted lines reflect the variation characteristics of strength loss rate.
Applsci 12 12395 g014
Figure 15. Correlation curve between wave velocity and UCS of rock samples.
Applsci 12 12395 g015
Figure 16. Correlation curve between open porosity and UCS of rock samples.
Applsci 12 12395 g016
Figure 17. Correlation curve between surface hardness and UCS of rock sample.
Applsci 12 12395 g017
Figure 18. Rock damage factor variation curves under freeze–thaw action. (a) Strength damage factor variation curve; (b) wave velocity damage factor variation curve.
Applsci 12 12395 g018
Figure 19. Schematic diagram of weathering in part of Qingyang North Grottoes. (a) Moderate weathering; (b) heavy weathering; (c) strong weathering.
Applsci 12 12395 g019
Table 1. Grouping of rock samples with different freeze–thaw modes.
Freeze–Thaw Cycle/Times051020406080
Immersion freeze–thawJ0-1~J0-7J1-1~J1-7J2-1~J2-7J3-1~J3-7J4-1~J4-7J5-1~J5-7J6-1~J6-7
Capillary freeze–thawB0-1~B0-7B1-1~B1-7B2-1~B2-7B3-1~B3-7B4-1~B4-7B5-1~B5-7B6-1~B6-7
Periodic saturation freeze–thawR0-1~R0-7R1-1~R1-7R2-1~R2-7R3-1~R3-7R4-1~R4-7R5-1~R5-7R6-1~R6-7
Table 2. Average value list of some physical indexes of yellow sandstone.
ParameterWave Velocity
v (km/s)
Natural Water Absorption
Wa (%)
Dry Density
ρd (g/cm)
Open Porosity
φ (%)
Surface Hardness r (HL)UCS (MPa)
The numerical1.9864.3212.3119.14555882.83
Table 3. Rock damage factors under different freeze–thaw modes.
Number of Freeze–Thaw Cycles/TimesIntensity Damage Factor/DσWave Velocity Damage Factor/Dv
Immersion Freeze–ThawCapillary Freeze–ThawPeriodic Saturated Freeze–ThawImmersion Freeze–ThawCapillary Freeze–ThawPeriodic Saturated Freeze–Thaw
0000000
50.0810.0490.1620.1620.0050.004
100.1770.0800.1750.1980.0080.010
200.3180.1510.2750.2710.0120.044
400.4270.1910.3350.3790.0210.044
600.4890.2630.3990.4710.0280.071
800.5260.2990.4510.5540.0350.099
Publisher’s Note: MDPI stays neutral with regard to jurisdictional claims in published maps and institutional affiliations.