Article

Influence of Activation Parameters on the Mechanical and Microstructure Properties of an Alkali-Activated BOF Steel Slag

by
Vitor A. Nunes
1,2,*,
Prannoy Suraneni
3,
Augusto C. S. Bezerra
1,
Carlos Thomas
2 and
Paulo H. R. Borges
1
1
Department of Civil Engineering, Nova Gameleira Campus II, Federal Centre for Technological Education of Minas Gerais (CEFET-MG), Av. Amazonas 7675, Belo Horizonte 30510-000, Brazil
2
LADICIM—Laboratory of Materials Science and Engineering, Escuela Técnica Superior de Ingenieros de Caminos, Canales y Puertos, University of Cantabria, 39005 Santander, Spain
3
Department of Civil and Architectural Engineering, University of Miami, Coral Gables, FL 33146, USA
*
Author to whom correspondence should be addressed.
Appl. Sci. 2022, 12(23), 12437; https://doi.org/10.3390/app122312437
Submission received: 4 October 2022 / Revised: 18 November 2022 / Accepted: 2 December 2022 / Published: 5 December 2022
(This article belongs to the Section Civil Engineering)

Abstract

:
Steel slag (SS) is a secondary material from steelmaking production with little commercial value. Its volumetric expansion and low reactivity limit the use of SS in Portland cement (PC)-based materials. This study investigated the potential use of basic oxygen furnace (BOF) slag as a single precursor in alkali-activated matrices (AAMs). Six AAM pastes were assessed by changing the silica modulus (0.75, 1.50 and 2.22) and the sodium concentration (4% or 6% Na2O—wt. SS). The early hydration was assessed using isothermal calorimetry (IC), followed by the assessment of the mechanical performance (compressive strength), apparent porosity, and structure and microstructure characterization (X-ray diffraction, thermogravimetric analysis and scanning electron microscopy). The results indicated that although the BOF slag may be considered a low-reactivity material, the alkaline environment effectively dissolved important crystalline phases to produce hydrates (reaction products). An optimized combination of activator sources was achieved with 4% Na2O and a silica modulus of 1.50–2.22, with a compressive strength up to 20 MPa, a significant amount of reaction products (C-S-H/C-A-S-H gels), and low initial and cumulative heat release. Those properties will help to promote SS recycling use in future engineering projects that do not require high-strength materials.

1. Introduction

The current world housing deficit is estimated to be 1.3 billion [1] and the infrastructure investment gap by 2040 is expected to be around 15 trillion (1012) dollars [2]. Both industries (construction and infrastructure) consume a large amount of Portland cement (PC), contributing to its elevated demand, with an average annual global production of 4.0–4.2 Gt [3]. As a downside of this large production, the PC industry is responsible for 8% of the global greenhouse gas emissions [4], which demands the development of alternative and cleaner binders that may replace PC in its applications.
Alkali-activated materials (AAMs) have been promoted as alternative greener building materials in recent decades. One of the main reasons for this is that AAMs can be designed to lower greenhouse gas emissions by employing industrial residues as raw materials during the production process [5]. The global warming potential impact of AAMs was estimated to be between 45% and 80% lower than PC depending on the raw materials used [6,7,8]. The main benefits of AAMs are a low CO2 footprint by valorizing industrial wastes, high mechanical performance, potentially high chemical resistance and the capacity to encapsulate hazardous wastes [9,10,11,12,13,14,15]. AAMs are derived from the reaction of aluminosilicate sources with an alkaline solution [16]. The conventional approach is to combine an alkali-activator solution (i.e., hydroxides or silicates of sodium or potassium) with an amorphous aluminosilicate powder, usually ground-granulated blast furnace slag (GGBFS); pulverized fly ash (PFA); calcined clays, such as metakaolin (MK); or glass waste. The alkaline activation results in either an alkali aluminosilicate gel or a calcium aluminosilicate hydrate gel or the coexistence of both [17,18]. However, the supply of those three main precursors is now challenging: GGBFS already has a well-defined route of utilization apart from AAMs (i.e., as supplementary cementitious material replacing PC); PFA availability was significantly reduced due to the continuous decommissioning of coal power plants worldwide [19] and MK is a natural resource. Consequently, there is a need for finding alternative binders to replace these and meet the future demands of AAMs.
Steel slag (SS) is the main solid waste (over 90% by weight) generated by the steelmaking industry. According to the World Steel Association, more than 270 million tons of SS were generated in 2019 [20]. Typically, this amount is stockpiled in open fields, causing environmental harm and financial liability [21]. Furthermore, China and Brazil, which are two important crude steel producers, reuse less than 30% of the SS generated [21,22]. The conversion of iron into steel in a basic oxygen furnace (BOF), also known as the Linz–Donawitz (LD) process, is a widespread process used by the steel industry, where molten iron is combined with steel scraps and fluxes to produce steel and generate BOF slag [23]. The former usually consists of CaO (30–60%), Fe2O3 (3–38%), SiO2 (7–20%), FeO (7–35%), Al2O3 (1–6%), MgO (1–15%), MnO (2–8%) and P2O5 (1–5%). The common mineral phases are dicalcium silicate (C2S), tricalcium silicate (C3S), tetra-calcium aluminoferrite (C4AF), olivine, merwinite, CaO-FeO-MnO-MgO solid solution and free CaO [24]. The volumetric expansion of the SS [25] and its low reactivity [26] are the most critical challenges to ensuring application in PC-based materials. Despite this, several studies continue to be published that evaluate SS’s potential as supplementary cementitious material even though low percentages of SS are employed [27,28,29,30].
Regarding the development of AAMs, most recent studies were carried out using SS as a partial replacement in blends with other precursors [31,32,33,34,35,36,37,38,39,40] or using SS as the sole precursor in the matrix [41,42,43,44,45,46,47,48]. The latter is gaining researchers’ attention due to the possibility of increasing the reuse of SS as an alternative, environmentally friendly application [11]. The number of publications is still scarce, and thus, it is difficult to establish concrete conclusions about the real influence of SS and activation parameters on the final properties of AAMs. However, some significant findings were reported, as follows. Liu et al. [45] found that the calcium silicates (C2S and C3S) present in the SS composition dissolve under alkaline conditions to form reaction products. Ozturk et al. [42], Sun et al. [43] and Morone et al. [44] concluded in their studies that significant amounts of C-S-H-type gel and CaCO3 are formed as hydration products, and the best SiO2/Na2O molar ratio in the activator was between 2.0–2.3. Sun et al. [43] only evaluated the effect of the silica modulus variation using the same Na2O concentration (only 4%) and Morone et al. [44] evaluated the carbon storage capacity of BOF slag using CO2 curing by assessing mortars and not pastes. They also used different activation parameters (molar ratio, activator type) and a different curing regime, and the focus was not on the influence of the activation parameters. Additionally, contradictory results were published, confirming the need for a more thorough investigation of the alkaline activation of SS [11].
This study aimed to tackle some of the issues stated in the last paragraphs, i.e., the need for alternative binders, the necessity for further reuse of steel slag and the scarce number of investigations on steel slag activation. It investigated the influence of activation parameters on the mechanical and microstructural properties to validate the use of BOF slag as a single precursor in AAM. Six different AAM pastes were produced by changing the silica modulus and the sodium concentration. The fresh properties were evaluated using the heat of hydration and the mechanical properties were evaluated using compressive strength. The pastes were also submitted to XRD, TGA and SEM to assess the microstructure changes, i.e., the mineral composition, crystalline and solid phase variation, pore structure and variation in the reaction products.

2. Materials and Methods

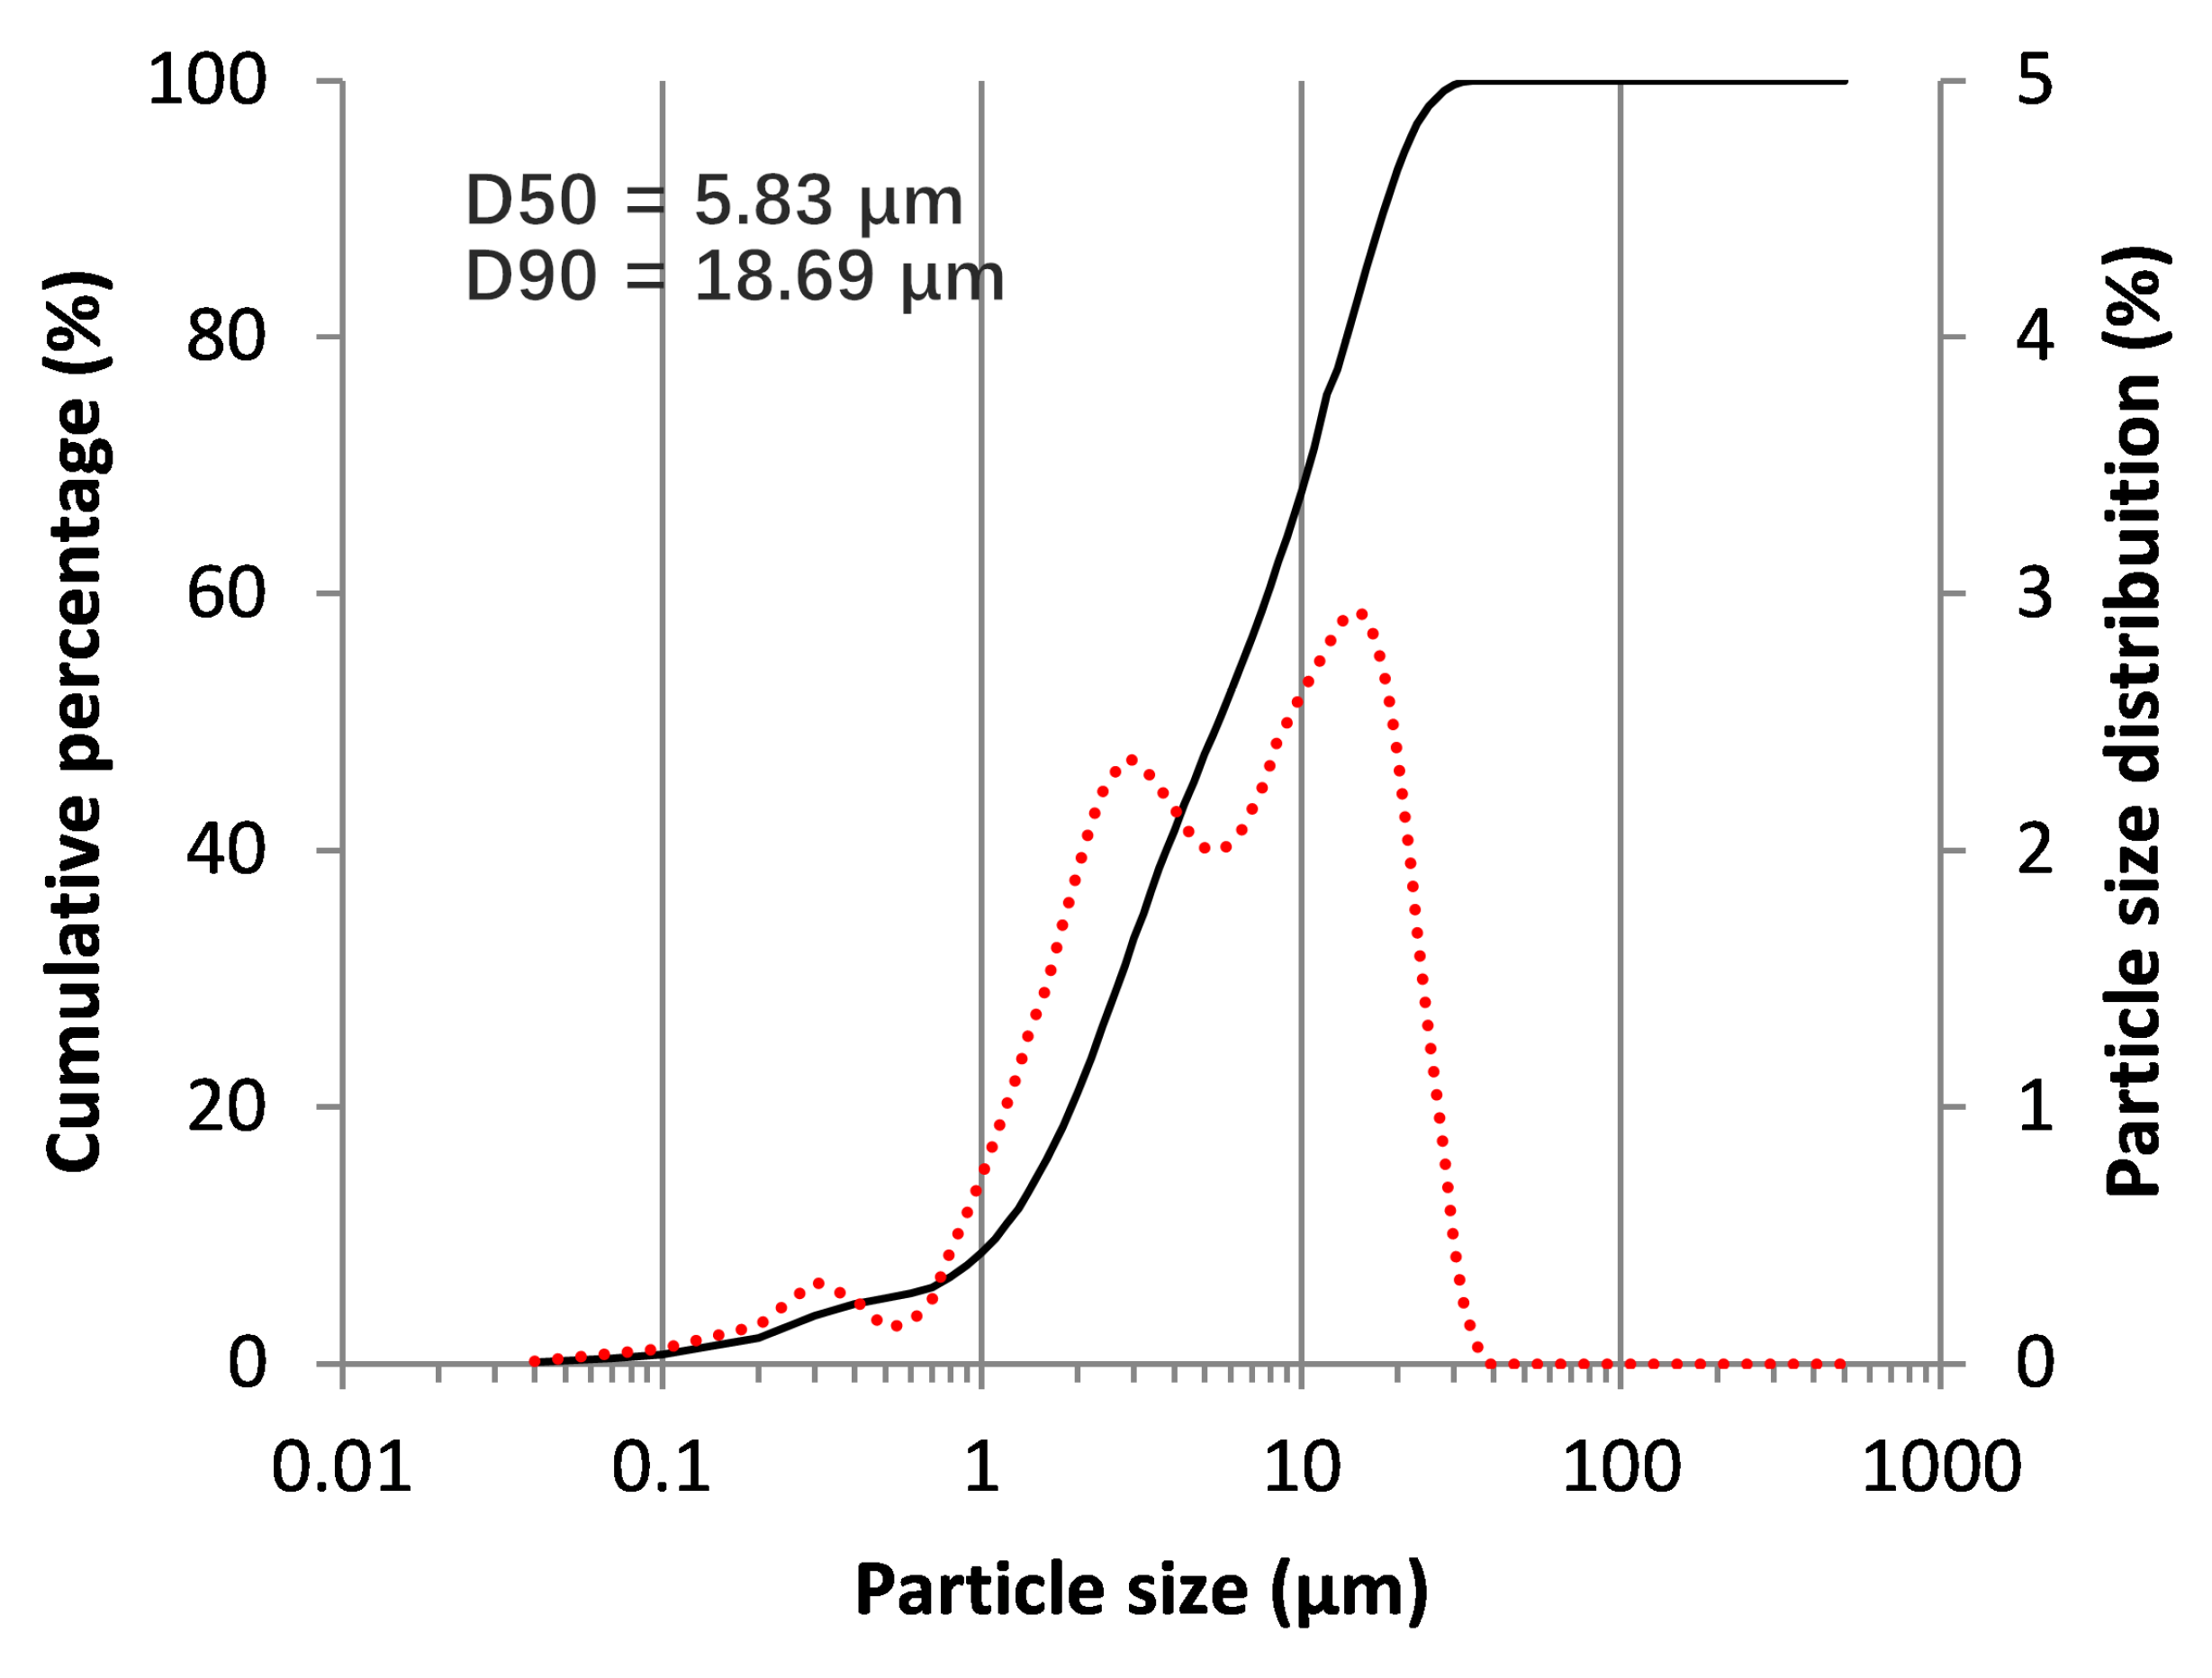
2.1. BOF Slag Characterization

The SS used in this work was a byproduct generated during the conversion of iron into steel in a basic oxygen furnace (BOF). The original BOF slag had a maximum particle size of 4.8 mm. The BOF slag was crushed and then ground in a ball mill to reduce it to a maximum particle size of 75 μm. The density of the BOF slag measured using helium pycnometry was 3.18 g/cm³.
The particle size distribution (PSD) of the ground precursor was obtained via laser granulometry (Cilas 1090 Laser) using the Fraunhofer diffraction theory. The analyses were made using the wet method (SS does not react with water) with a 60 s ultrasonic bath to increase particle dispersion. Triplicate samples were tested. The ground precursor presented 100% of particles as lower than 75 μm, with 8.11 μm as the mean diameter, as shown in Figure 1.
The chemical composition, which is presented in Table 1, was obtained via X-ray fluorescence (XRF) on a Bruker S2 Ranger X-ray spectrometer (Bruker, Billerica, MA, USA). The BOF slag mainly consisted of CaO (36.66%) and FeO (24.19%), followed by SiO2 (12.10%) and MgO (10.60%). Its alkalinity was 4.14, which favored its hydraulic activity [49], but not necessarily its cementitious behavior (the latter depends on the phases present within the chemical composition) [50].
The mineralogical phases were determined via X-ray diffraction (XRD) on a Shimadzu XRD 7000 diffractometer with Cu radiation at 40 kV and 30 mA. The scanning speed was 0.30 s/step, the length of each step was 0.02° and the scanning range was 5–80°. Rietveld refinement software (GSAS) was used for the quantitative analysis. The XRD pattern of the BOF slag shown in Figure 2 presents several mineral phases, including larnite (C2S), srebrodolskite (C2F), brownwillerite (C4AF), portlandite (Ca(OH)2), calcite (CaCO3), quartz (SiO2), wustite (FeO) and periclase (MgO). The quantification of each phase is also presented. A similar complex mineralogical composition of BOF slag was previously reported [51,52,53].
The TGA-DTA (thermogravimetric analysis coupled with differential thermal analysis) was conducted on Hitachi STA73000 equipment to identify and quantify the variation in the solid phases. The BOF slag was heated from 25 °C to 1000 °C at a heating rate of 10 °C/min in a high-purity nitrogen atmosphere. Figure 3 shows the TG and DTG diagrams, which are divided into two main mass loss regions: (i) portlandite dehydroxylation between 350 °C and 450 °C and (ii) calcite decomposition between 600 °C and 800 °C.
The standard pozzolanic activity index was determined according to the Brazilian Standard ABNT NBR 5752:2014 [54]. The pozzolanic index is the ratio between the compressive strength at 28 days of a mortar containing 25% wt. of the studied materials (herein the BOF slag) replacing the PC and the strength of the reference mortar containing 100% of PC. Composite PC type CP II-F-32 according to the Brazilian Standard NBR11578-1997 [55] and normalized sand [56] were used to produce the mortars.
The modified R3 reactivity test was performed to evaluate the pozzolanic activity of the supplementary cementitious materials [57]. It was performed on the BOF slag to determine its heat release and calcium hydroxide consumption in a calcium-rich simulated pore solution. Isothermal calorimetry was used to measure the heat released due to the reaction with calcium hydroxide at 50 °C and in a 0.5 M KOH solution. The final amount of calcium hydroxide was determined based on the mass loss between approximately 380 °C and 460 °C using the tangential method outlined in Kim and Olek [58]. Thermogravimetric analysis was performed on the resulting blends after 240 h to determine the calcium hydroxide consumption. The calcium hydroxide consumption was calculated as the difference between the initial and final calcium hydroxide contents and then divided by the mass of supplementary cementitious materials (SCM) in the systems [59]. Three replicates were tested.

2.2. Mix Proportions

The alkaline solutions were prepared using NaOH pellets (99% purity), Na2SiO3 (solid content of 47.10%, SiO2/Na2O of 2.16) and water. Six different pastes were studied by combining different silica modulus in the activator (0.75, 1.50 and 2.22) and the percentages of Na2O (4% and 6%), as presented in Table 2. The water-to-binder ratio (w/b) was varied to ensure the same workability between all the pastes. The pastes were mixed in a mortar mixer; the alkaline solution (previously mixed and cooled down) was added first, followed by the precursor at a lower mix speed. After approximately 5 min, the paste was mixed for 1 min at the higher mix speed. This mixing process was carried out according to the Brazilian Standard ABNT NBR 7215:2019 [60]. The cast specimens (for hardened characterization) were cured at ambient laboratory conditions (≅24 °C, 90 ± 5% RH); they remained in the mold for the first 24 h (placed inside sealed plastic bags) and, after demolding, were placed underwater until testing. The choice to use underwater curing was made to avoid the fast water loss that leads to potential shrinkage.

2.3. Early Hydration

The hydration kinetics of the fresh pastes was assessed via the heat of hydration tests using an isothermal calorimeter (Calmetrix I-Cal 2000 HPC isothermal calorimeter, Boston, MA, USA). The samples were made with 20 g of precursor and 8–11 g of alkaline solution. Measurements were carried out every 5 s in the first 8 h and every minute in the next 64 h.

2.4. Hardened Properties

The hardened pastes were subjected to apparent density and porosity tests (water saturation method) and mechanical evaluation (compressive strength). The apparent density and porosity were determined according to the Brazilian Standard ABNT NBR 9778:2009 [61] after 28 days of curing. Cylindrical samples 25 × 50 mm (diameter × height) were used for the mechanical tests. The compressive strength of each paste was measured after 1, 3, 7 and 28 days of curing using a universal press Emic D30000 with a 300 kN load cell and a 0.25 ± 0.05 MPa/s loading rate [60]. Six specimens were used and the average and standard deviation were calculated and reported.

2.5. Structural and Microstructural Assessment

XRD and TGA were used to assess the structural analysis of the hardened pastes. The changes in the mineralogical composition (crystalline phases on the XRD) and quantification of the hydrates via TGA-DTG were evaluated at 1, 3, 7 and 28 days. Microstructural analysis was carried out using scanning electron microscopy (SEM; Hitachi TM3000) with EDX analysis operating in the backscattering mode. The SEM/EDX test conditions were set in a low vacuum mode with an acceleration voltage of 15 kV and a working distance of 5.2 and 5.9 mm. Samples were polished for characterization.

3. Results and Discussions

3.1. BOF Slag Pozzolanic/Reactivity Behavior

The pozzolanic index (PI) of the BOF slag was 67.29%; therefore, this SS was considered a non-pozzolanic material accordingly to the Brazilian Standard ABNT NBR 12653:2014 [62]. Basic GGBFS, typically a pozzolanic material, has a much higher PI of approximately 95%. In contrast, acidic GGBFS has a lower PI, comparable to the BOF slag, between 65 and 85%. A low pozzolanic behavior of the BOF slag was expected based on the high content of crystalline phases, as highlighted by the XRD (Figure 2).
The modified R3 reactivity test results of the BOF slag are summarized in Table 3, where a comparison is made with typical results from other raw materials, i.e., another BOF slag, a ladle furnace steel slag (LFS), GGBFS and limestone [26,57]. It is possible to see a significant difference in the reactivity of SCMs and even between different samples of BOF slags. The studied BOF slag may be considered to have a low reactivity based on its amount of heat released and calcium hydroxide consumptions, which were 76 J/g SCM and 16 g/100 g SCM, respectively.
The difference in terms of heat release and calcium consumption of both BOF slags was related to the inherent variability of steel slags. Due to the processing and cooling effects on the chemical and mineralogical compositions, such as the amorphous phases, there was considerable variability in their behavior. The heat released from the LFS and GGBFS were similar and significantly greater than both BOF slags. This may have been due to the more significant amounts of amorphous phases in the formers compared with the present BOF slag [26], which was demonstrated by its crystalline nature (Figure 2). The calcium hydroxide consumption of the LFS and the limestone were negative, which meant that they generated calcium hydroxide possibly because of the reaction of the existing free lime in their composition. GGBFS had the highest calcium hydroxide consumption due to its higher amorphous content compared with the others.

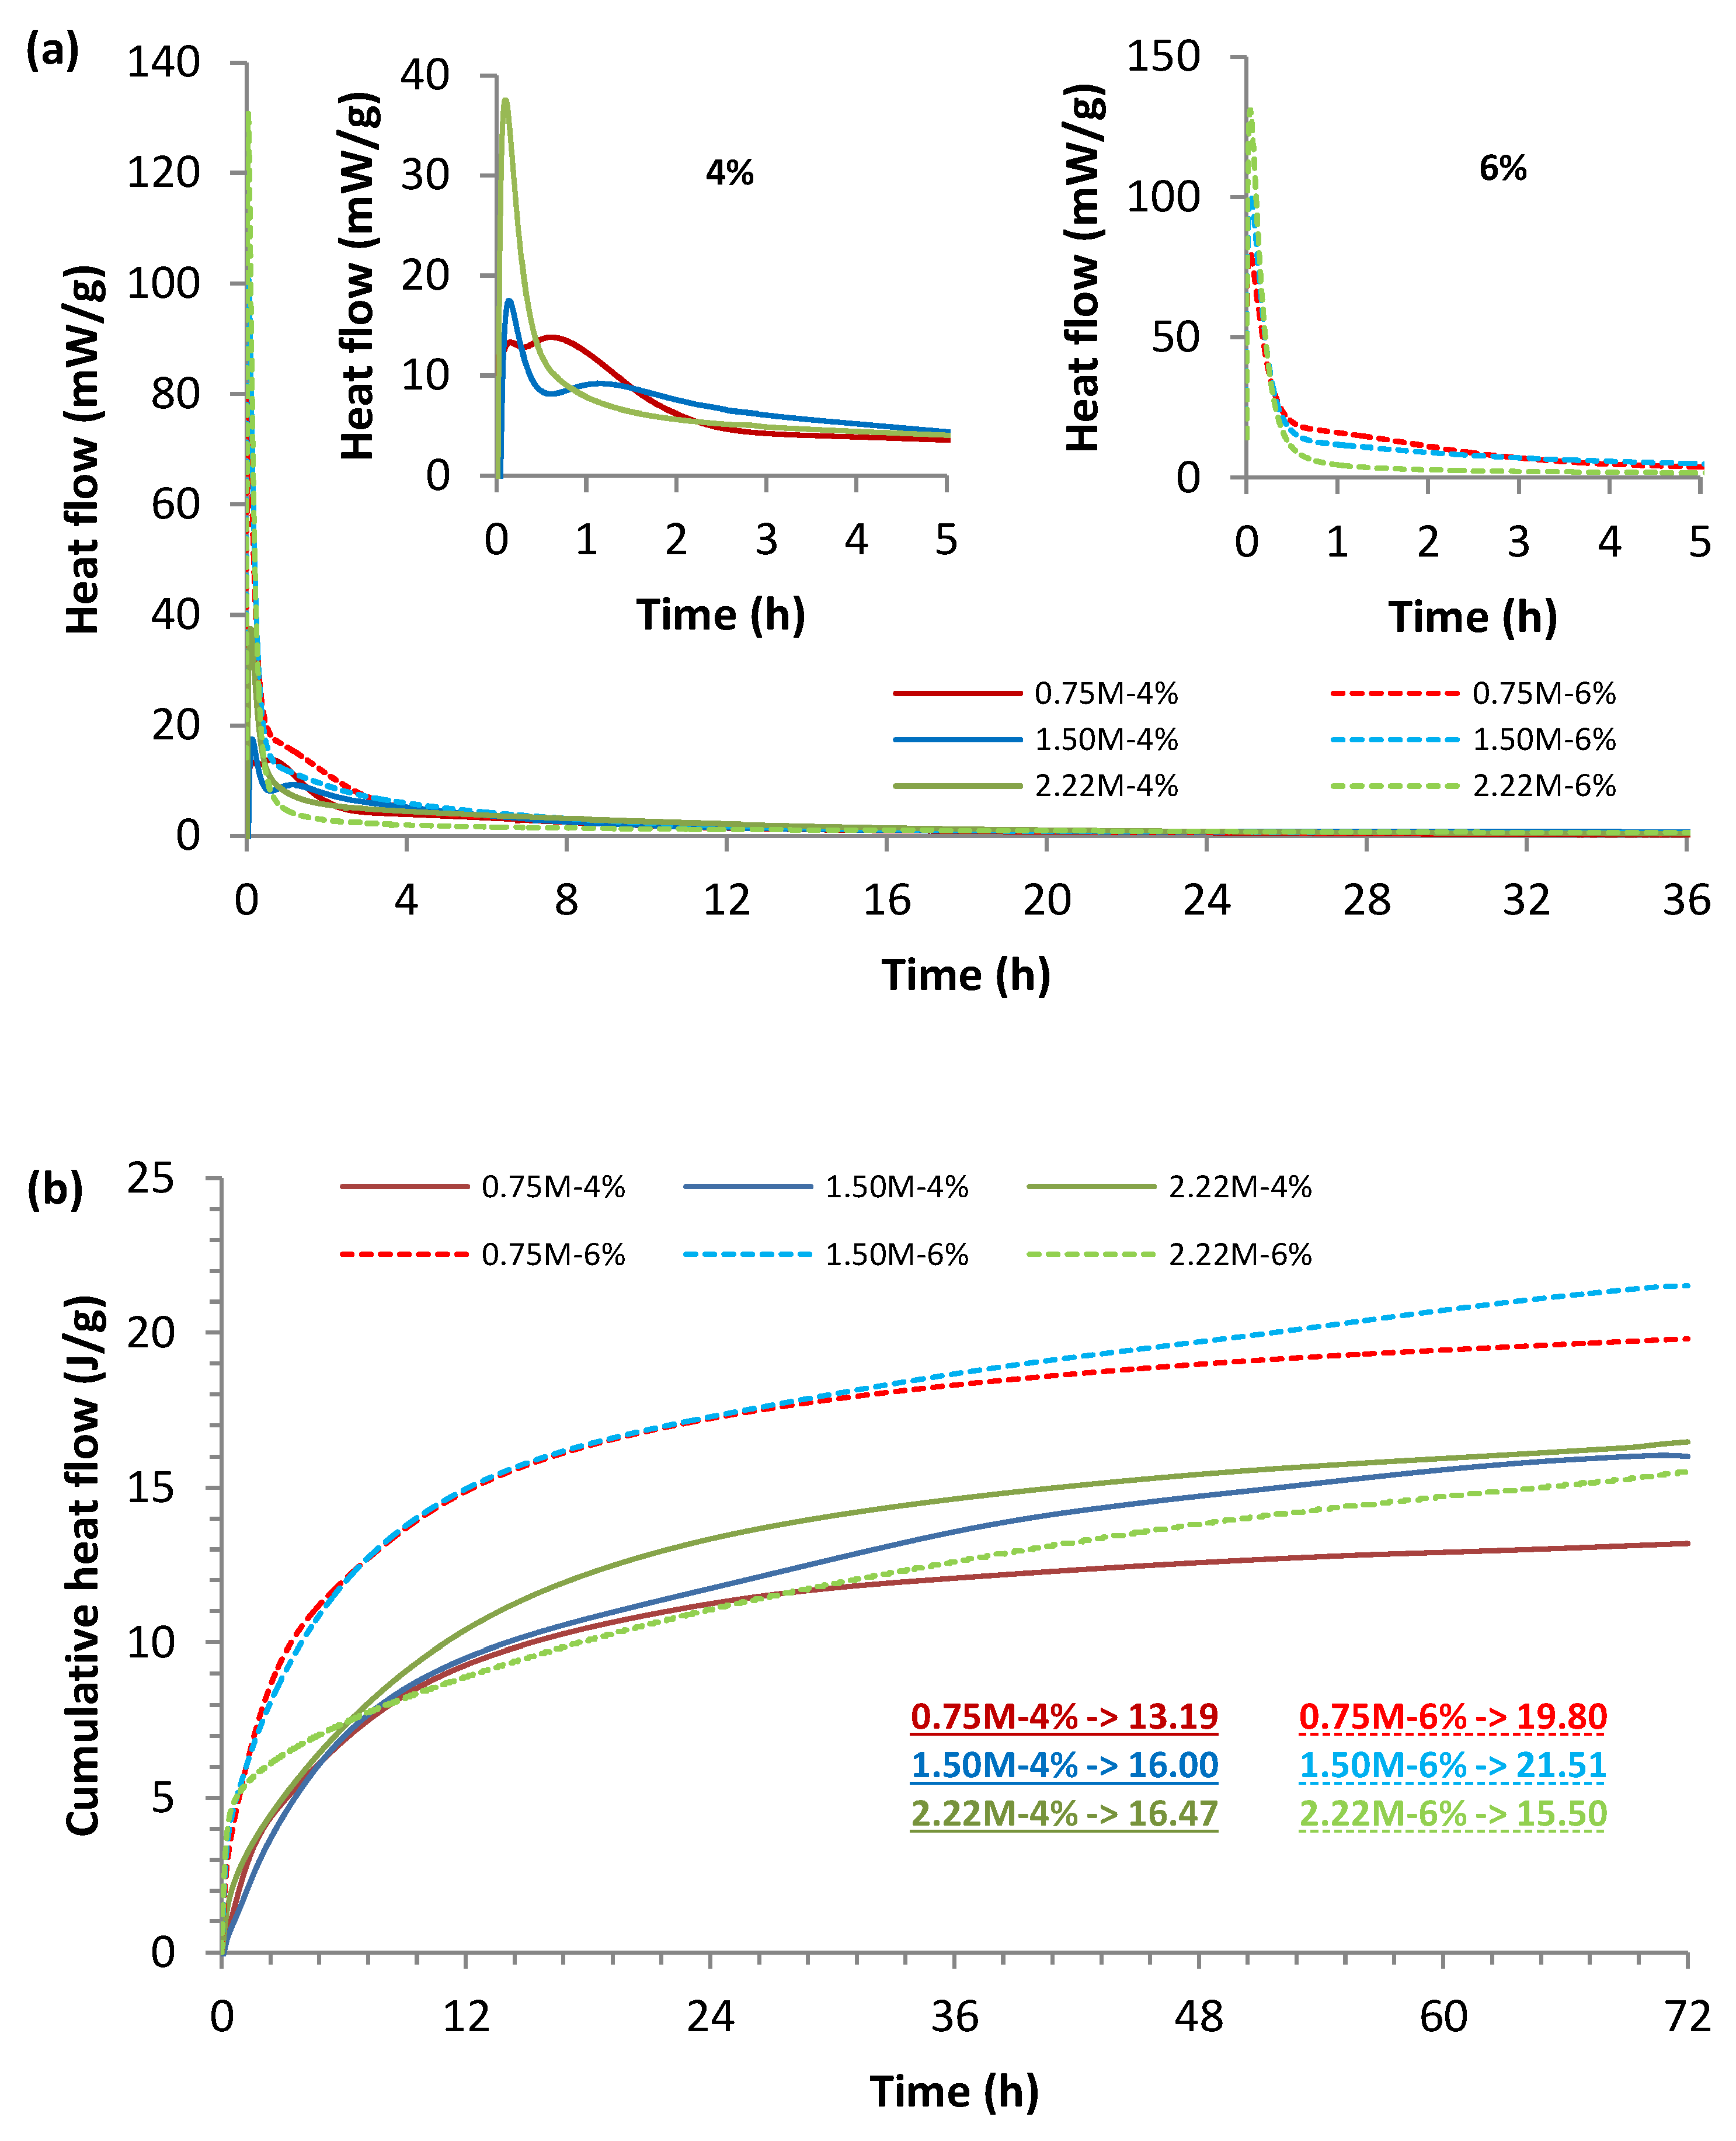
3.2. Early Hydration Results via Calorimetry

Figure 4a,b show, respectively, the heat flow rate and the cumulative heat release during the activation of the BOF slag. The alkali-activated BOF slag pastes present different behavior depending on the activation parameters. In general, the hydration process of alkali-activated SS may be divided into five stages similar to cement-based materials and GGBFS-based AAM: the rapid initial dissolution, induction/reorganization, acceleration, deceleration and stabilization periods [33,43,47]. However, the changes in both the silica modulus and Na2O concentration in the activator clearly modified the BOF slag activation kinetics.
The rapid dissolution of the slag particles (calcium silicate and calcium aluminate) led to the first exothermic peak observed in all mixtures despite differences in intensity, as shown in Figure 4a. This stage is characterized by the formation of the initial dissolved silicate and aluminate units [43]. The type and concentration of the alkali activator are known to influence the duration and intensity of each stage during the reaction [63]. Figure 4 shows that the intensity of the first peak varied between 13 and 38 mW/g when the Na2O concentration was 4%. Conversely, the values were much higher for the 6% concentration, varying between 80 and 130 mW/g. Those results indicated that the higher the alkalinity in the solution, the faster the initial dissolution and the higher the initial heat release rate [43]. The effect of the silica modulus on the first stage was also evident for a fixed Na2O percentage. The rise in the silica modulus from 0.75 to 2.22 also increased the intensity and speed of the heat release [44].
The induction period was characterized by low reactivity and shortened when NaOH + Na2SiO3 were used as activators. Moreover, these activators are thought to make a small contribution to the total heat [63]. Since the aluminum phase in the BOF slag does not form crystalline products, such as ettringite, no delayed reaction occurs and the induction period is short [47]. The induction period was only identified for the 0.75M-4% and 1.50M-4% curves. The acceleration and deceleration periods (second peak) are related to the formation of hydration products, including reaction gels and Ca(OH)2, that result from the hydration of the calcium silicate present in the slag [33]. Similarly, regarding the induction period, the second peak was only identified for 0.75M-4% and 1.50M-4%. These results do not necessarily indicate the absence of Ca(OH)2 or reaction gels in the other formulations. Actually, the acceleration start point was significantly delayed and the reaction rate was reduced as the silica modulus increased, which indicated that Na2SiO3 had a retarding effect on the early reaction of the BOF slag [64].
As shown in Figure 4b, the cumulative heat output of the formulations varied between 13.19 and 21.51 J/g, which was a slight difference between matrices. Those values are considered very small compared with other cementitious materials, such as GGBFS-based AAM (80–150 J/g) [65] and cement-based materials (250–350 J/g) [66]. These results from our study are in line with the findings of the R3 reactivity test; the lower heat generation of the studied SS was probably associated with the slight presence of active components on the BOF slag mineralogical composition (Figure 2).

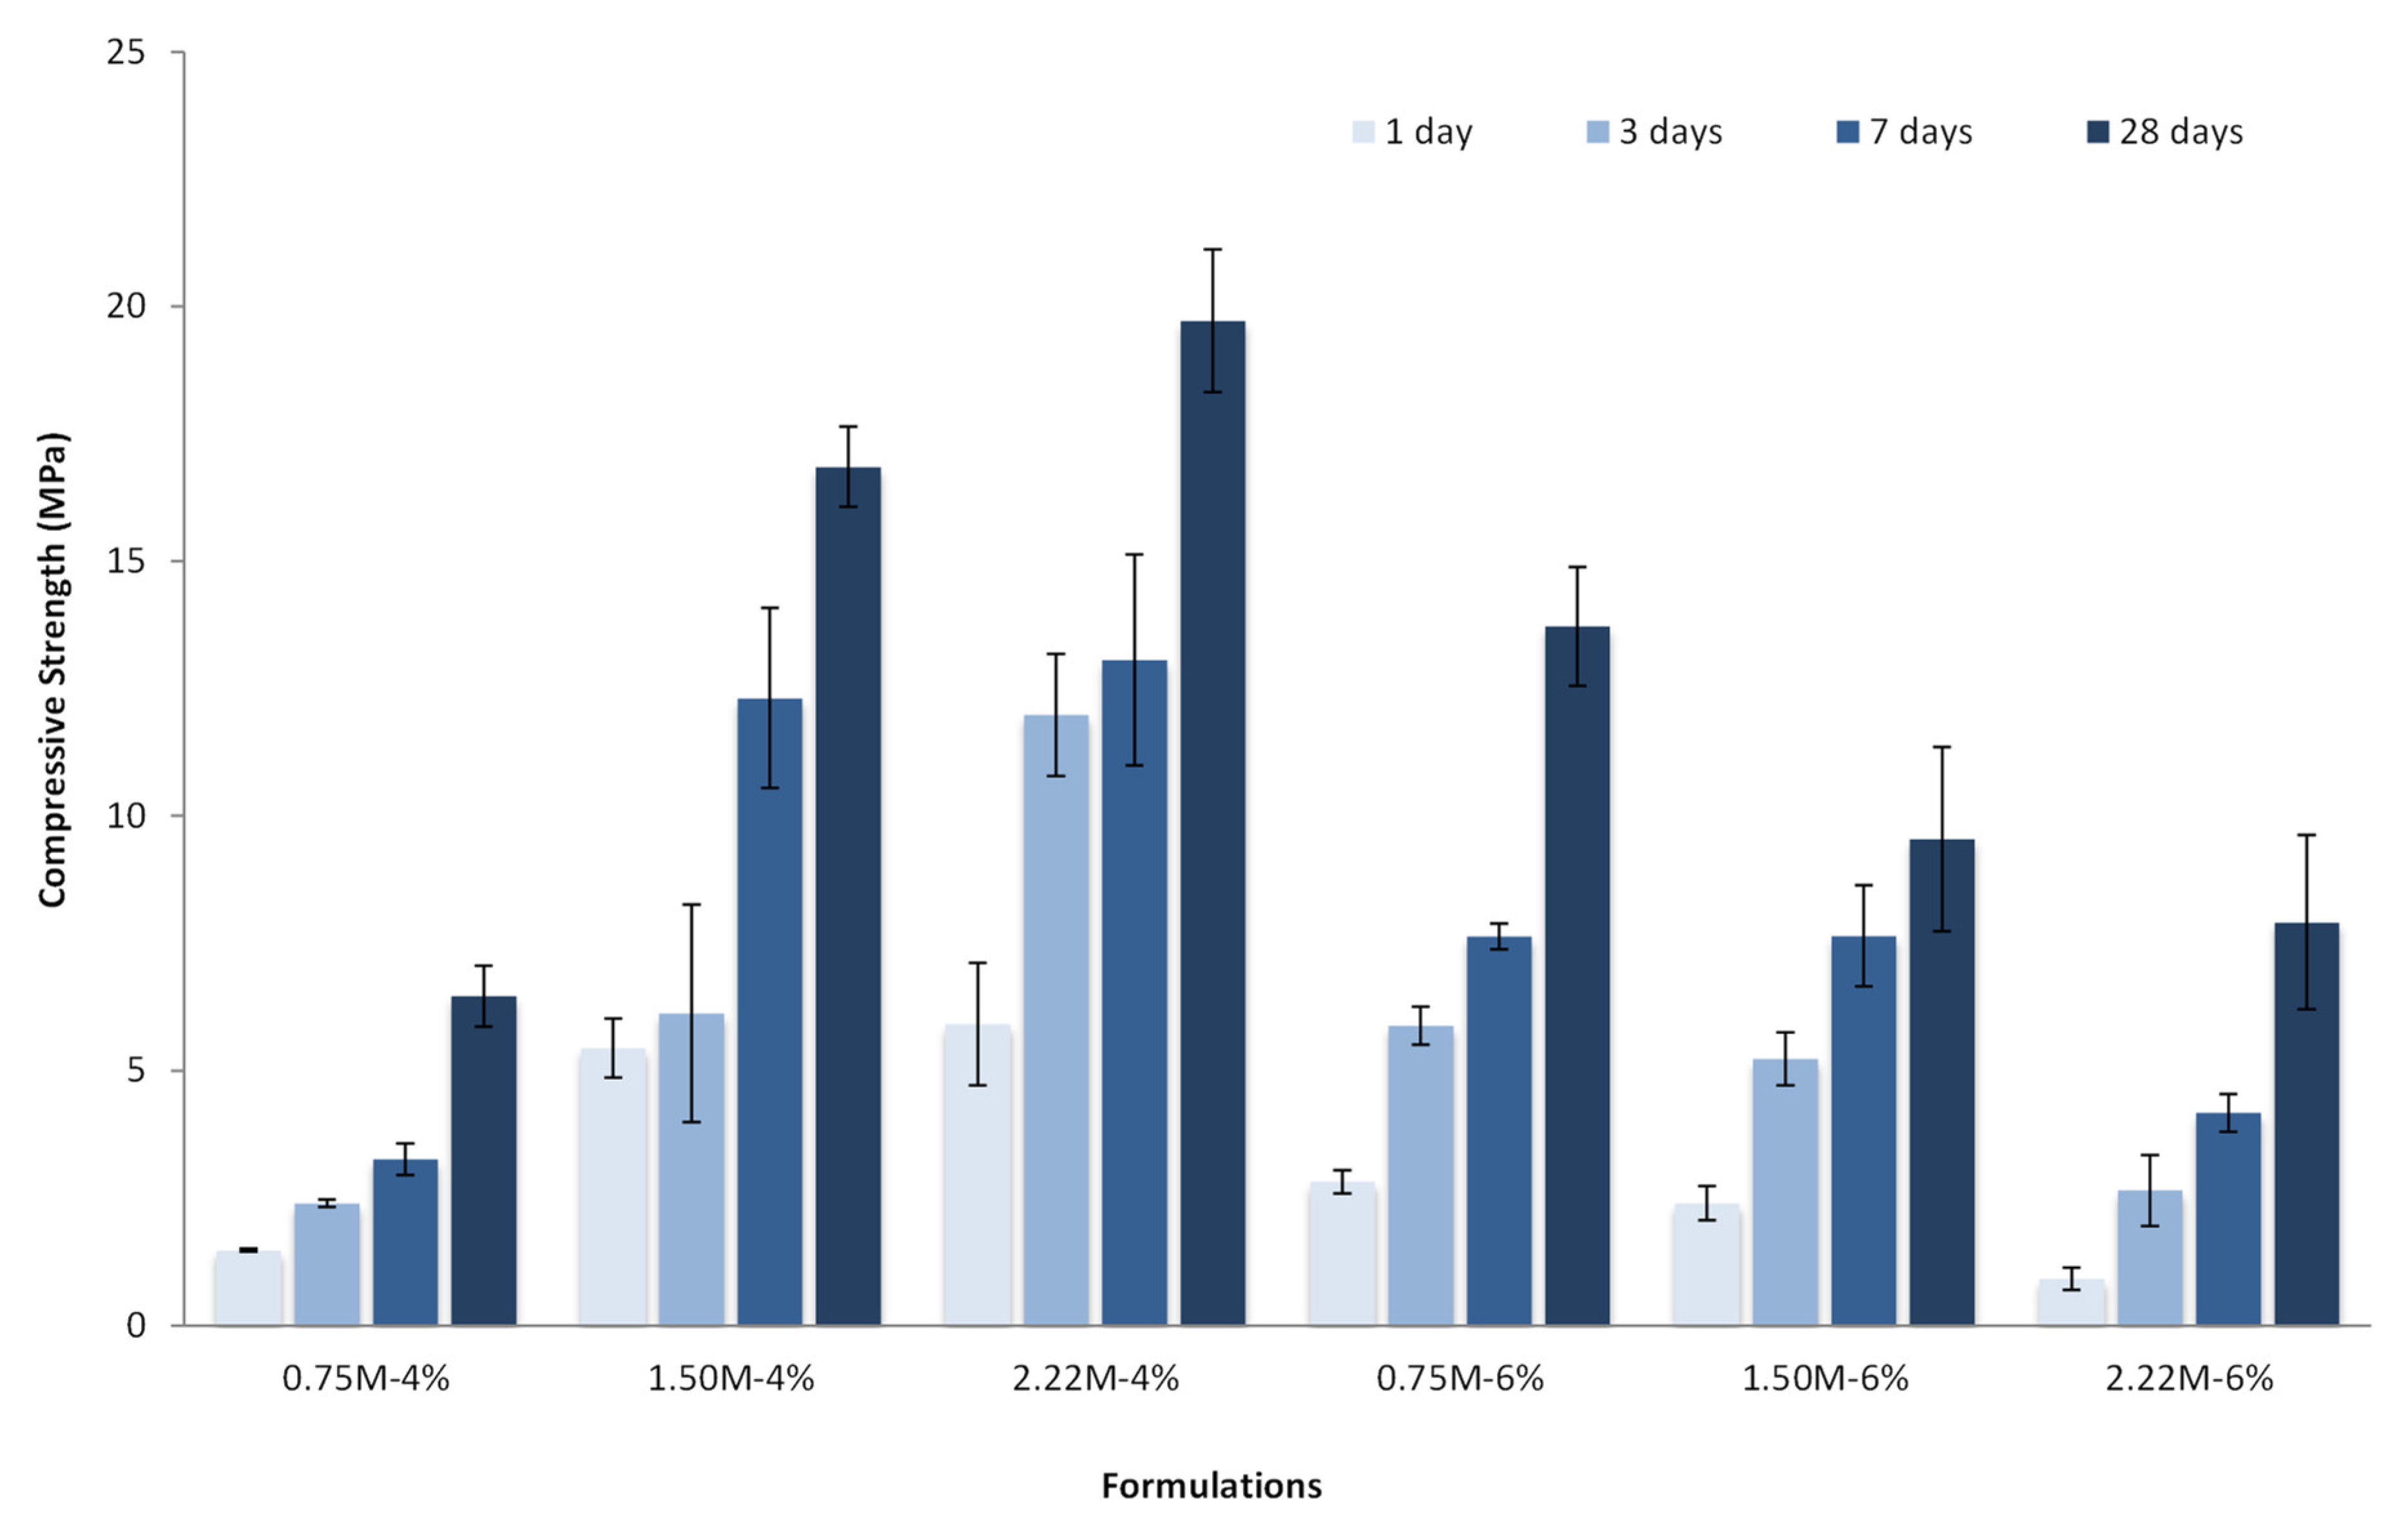
3.3. Hardened Properties

Figure 5 presents the average results for the compressive strength of the studied pastes at 1, 3, 7 and 28 days. The error bars represent the standard deviation. Considerable development in strength from 1 to 28 days was observed for all formulations. The increases in strength from 1 to 28 days for 0.75M-4%, 1.50M-4%, 2.22M-4%, 0.75M-4%, 1.50M-4% and 2.22M-4% were 336.49%, 209.74%, 233.67%, 386.52%, 297.50% and 759.78%, respectively. These results confirmed the alkali activation process of the BOF slag and the hardening of all pastes, such as those presented by Morone et al. and Sun et al. [43,44].
It is possible to notice that the increase in silica modulus within the same Na2O concentration had different impacts on the compressive strength for each case (4% or 6%). For 4% Na2O, the higher the silica modulus, the higher the strength of the pastes. A rise in the modulus provided more silicate (higher Si/Al molar ratio in the matrix), which promoted strength development [67]. However, the opposite behavior occurred when 6% Na2O was employed. In the latter situation, the strength of pastes decreased for a higher silica modulus. This will be further discussed in the following section (Section 3.4).
Similarly, the increase in Na2O concentration within the same modulus only enhanced the strength in the case of a low modulus (0.75M). In the other cases (1.50M and 2.22M), the increase in Na2O negatively affected the mechanical behavior. Wang et al. [68] observed a threshold above which the alkali concentration compromises the strength development. Shi et al. [69] also pointed out that a high silica modulus may decrease the liquid alkalinity provided by the high alkali concentration and consequently reduce the extent of activation and compressive strength.
The trend of the compressive strength results is presented in Figure 6, where all variables are gathered. The figure graphically shows that the lowest strength values were found for extremes in the activator’s content: a low alkali concentration combined with a low silica modulus or a high alkali concentration combined with a high silica modulus. Better strength performance could be achieved when an optimized combination of activator sources was considered. In this study, a low Na2O concentration (4%) with an intermediary silica modulus (1.50–2.22) presented the best mechanical results, increasing the compressive strength up to 20 MPa. The compressive strength of the pastes was lower than the conventional ones (based on the activation of GGBFS); however, it is essential to emphasize that BOF slag is an industrial waste that presents economic and environmental benefits. The compressive strength results are helpful for material design in future engineering projects that do not require high-strength materials.
Similar results were presented by Sun and Chen [43] in their study, where 4% Na2O was combined with an optimal silica modulus of 2.0 to develop an alkali-activated SS paste with compressive strengths of 15 MPa and 25 MPa at 28 and 180 days, respectively. On the other hand, Ozturk et al. [42] successfully developed an alkali-activated SS mortar with considerably high strength (22 MPa) by employing a higher Na2O concentration and an intermediate silica modulus of 6% and 2.0, respectively.
Figure 7 presents the mean compressive strength at 28 days and the initial heat release found using calorimetry (Section 3.2) plotted against the silica modulus and Na2O concentration (4% and 6%). The graphs do not have the same trend. A rise in the silica modulus increased the initial heat release irrespective of the Na2O concentration. However, a high silica modulus combined with a high concentration of Na2O (6%) was detrimental to the strength development. The first reason for this was the relatively fast loss of consistency observed for those pastes during the molding process (i.e., 1.50M-6% and 2.22M-6%), which was in line with the high initial heat release (orange curves in Figure 7). This may have compromised the casting and directly affected the strength. The second reason was an excess amount of silicate and OH in the mixture, which inhibited the activation reaction by limiting the diffusion of ions [70]. Thus, the reaction of Ca2+ with Si4+ was negatively affected, along with the strength development.
Figure 8 presents the average results for the apparent density and porosity of pastes at 28 days. The standard deviation is indicated by the error bars. The green triangles represent the apparent density. Regarding the porosity, the pastes made with 4% Na2O are represented with hatched bars, while the 6% Na2O pastes are represented with solid bars. The apparent density values lay between 1.38 and 1.61 g/cm3, and the porosity mean values were between 33.92 and 36.62%. Unlike the compressive strength, it is possible to observe that the activation parameters’ change did not significantly affect either the porosity or the apparent density. Regarding the formulations made with 4% Na2O, a rise in the silica modulus (higher silicate content) increased the apparent density and porosity. This result may have been due to the fact that sodium silicate has a higher density than sodium hydroxide, yet its high viscosity negatively affected the workability of the pastes [71] and consequently increased the incorporated air in the paste. In contrast, pastes activated with 6% Na2O presented a more coherent behavior: the increase in silica modulus increased the porosity (same as the 4% pastes) and slightly decreased the apparent density.
Overall, the paste porosity was highly related to the water-to-binder ratio (w/b), which played an important role in the consistency of the mixes [72]. It is important to state that the highest mean porosities were found for the 2.22M-4%, 1.50M-6% and 2.22M-6% pastes. They also had higher w/b values of 0.38, 0.40 and 0.40, respectively. You et al. [73] found that the use of SS as a binder increased the total porosity of GGBFS-based alkali-activated mortars. In contrast, Guo and Yang [40] found that an increase in the SS percentage of a PFA-based alkali-activated paste increases the apparent density. To the author’s knowledge, no previous comprehensive study presented conclusive results on the influence of the activation parameters on the apparent density and/or porosity of alkali-activated SS paste.

3.4. Structural and Microstructural Properties
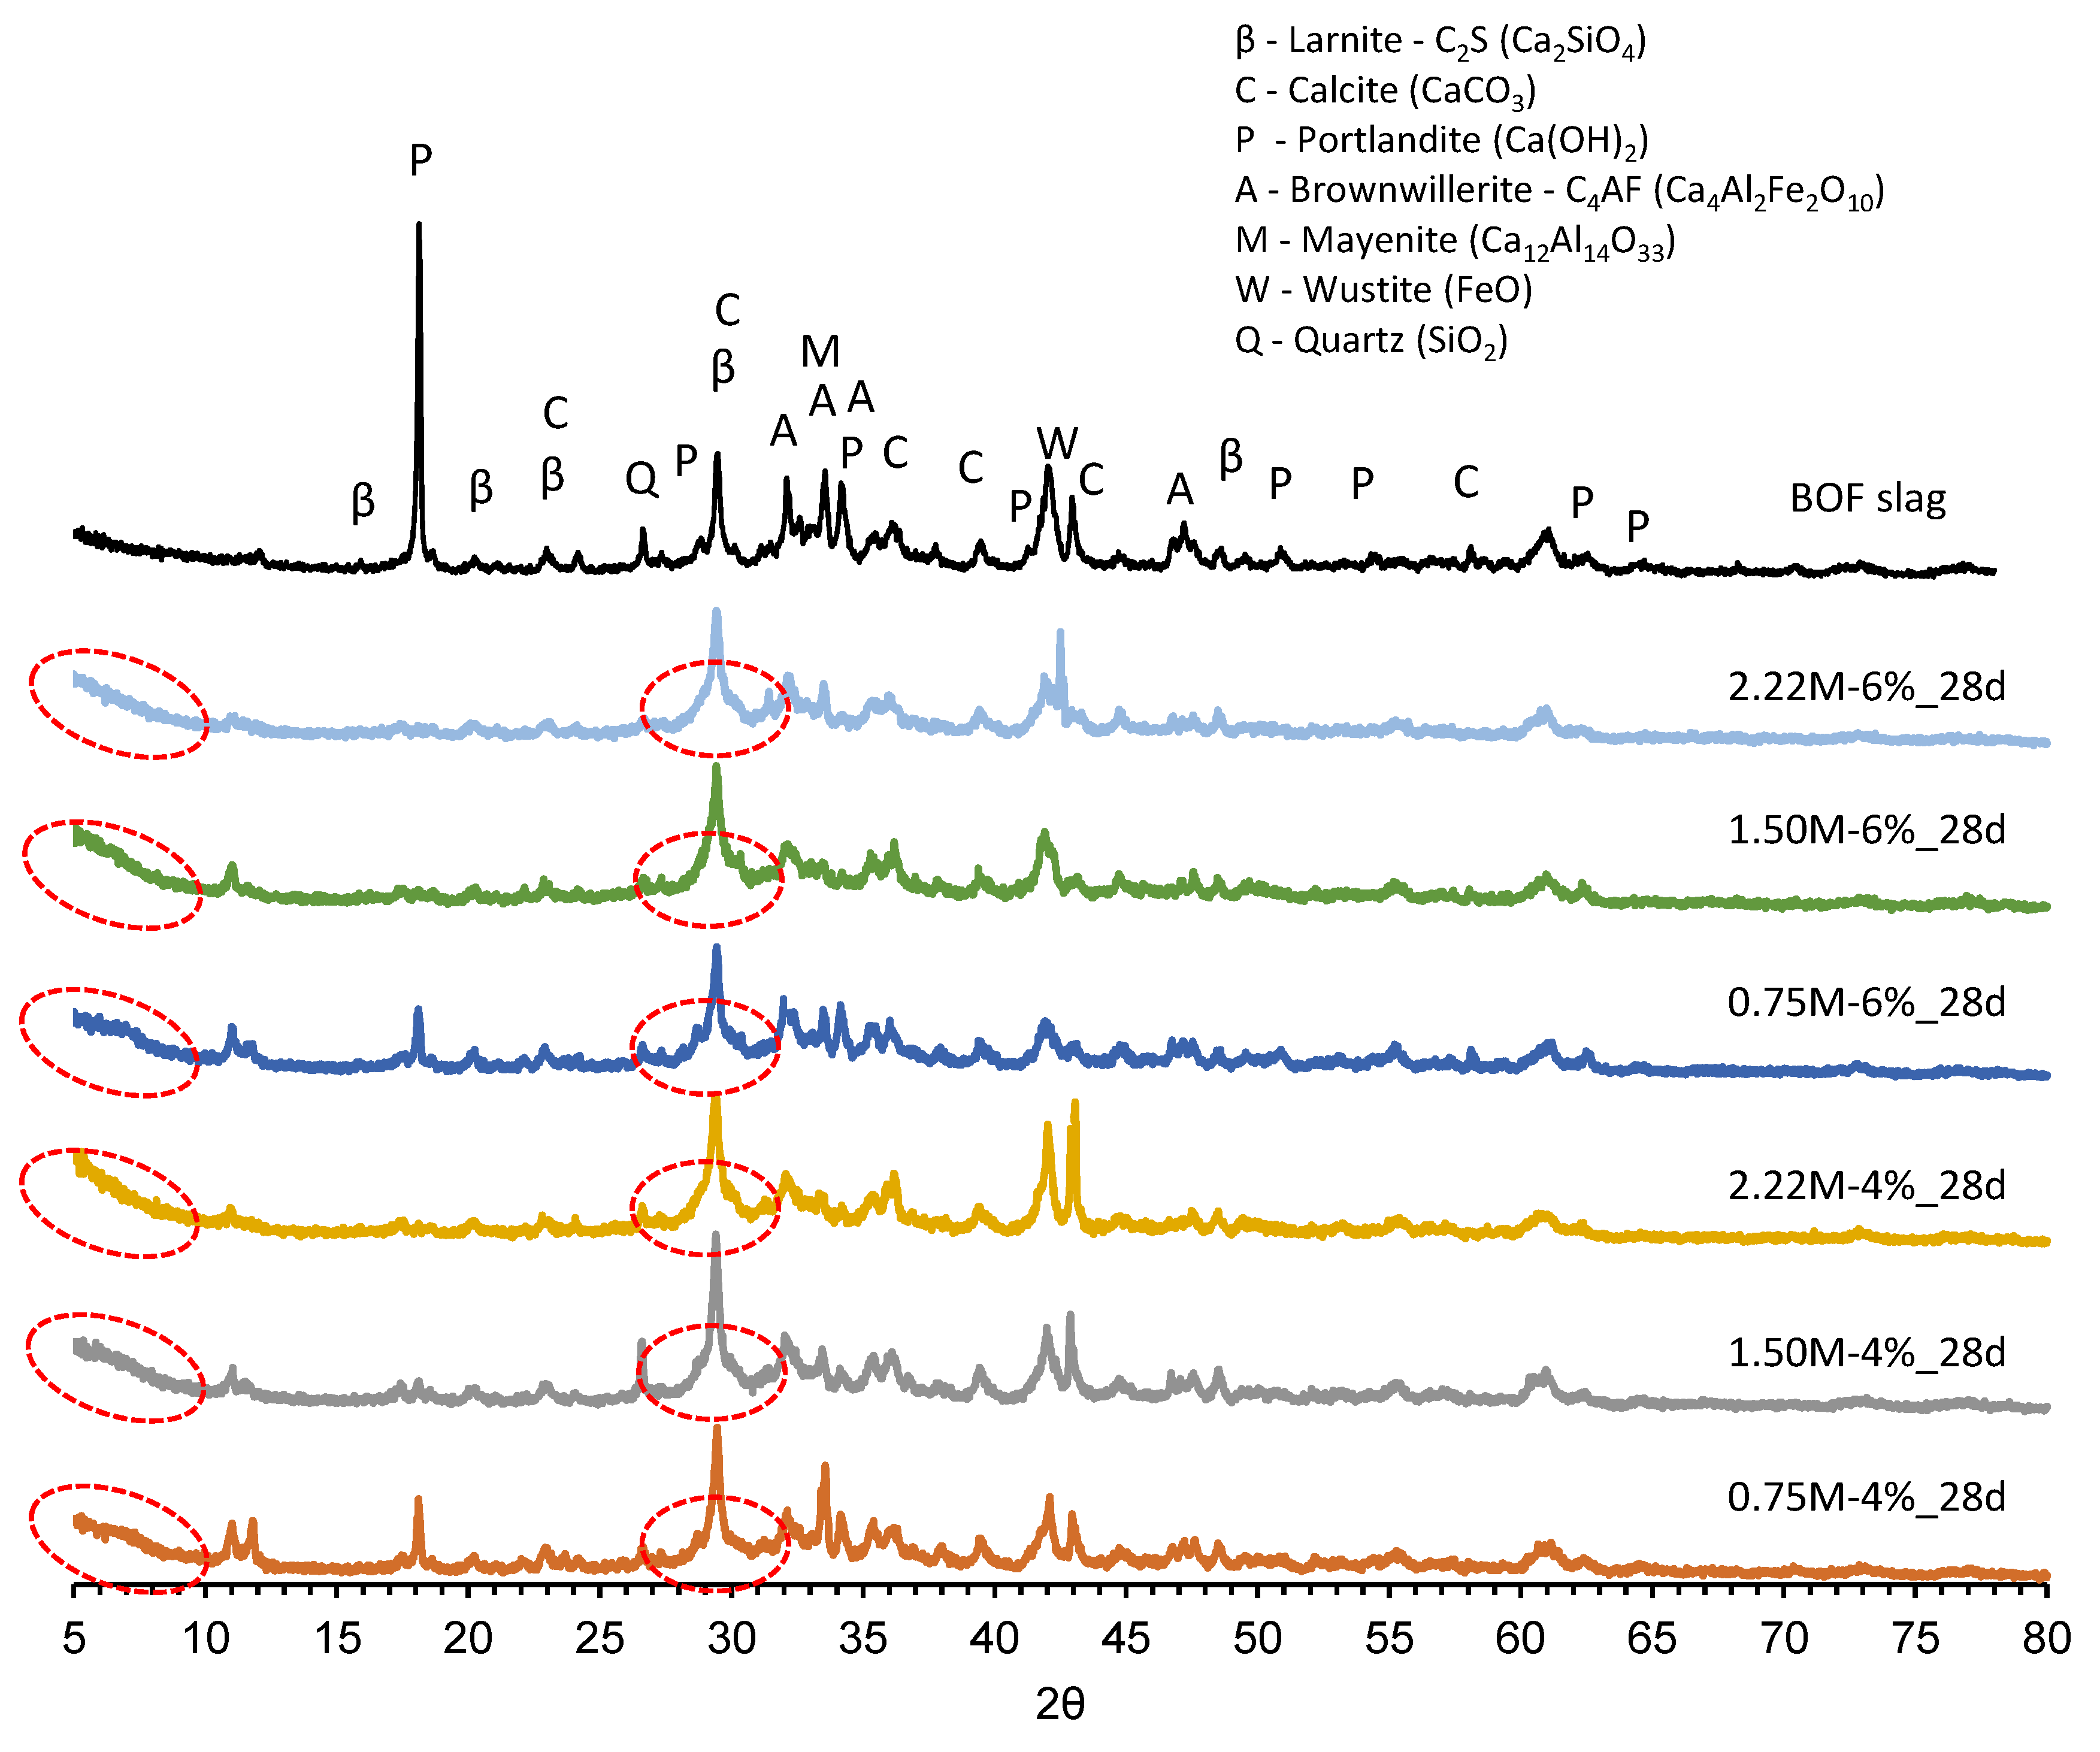
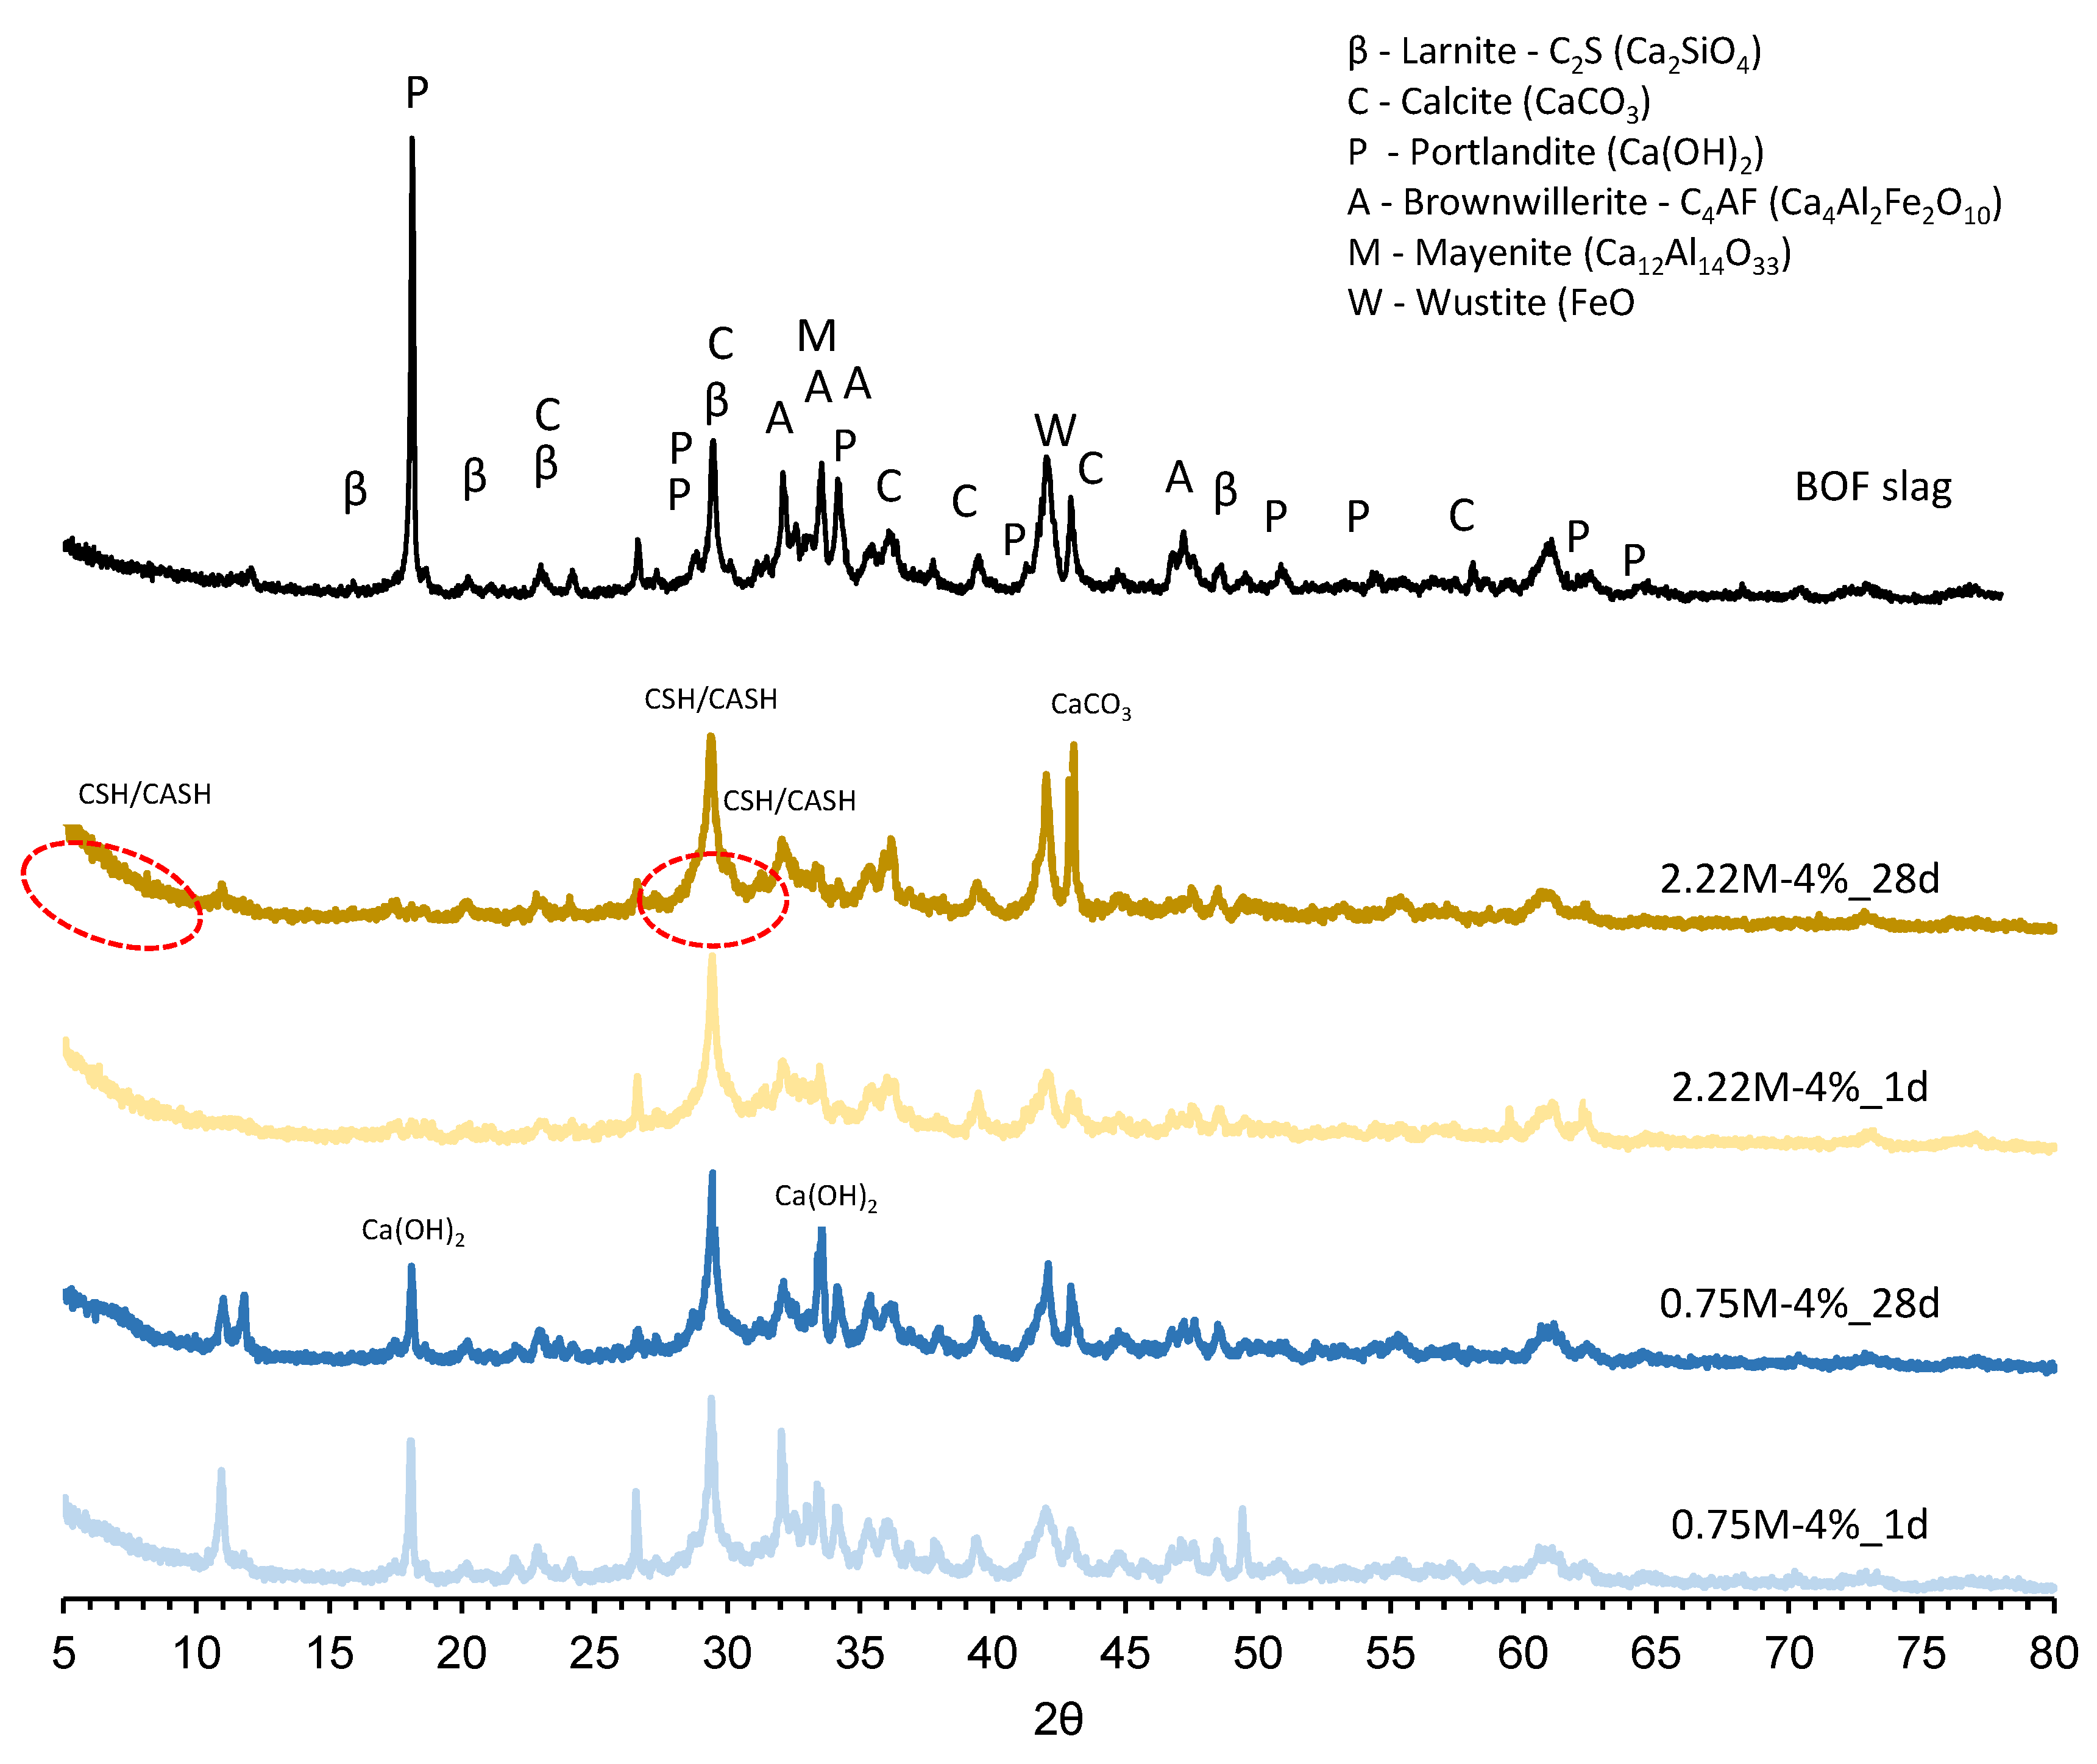
3.4.1. XRD Analysis

The XRD patterns of all pastes at 28 days are shown in Figure 9. Compared with the BOF slag pattern, the intensities of some diffraction peaks remarkably decreased and some peaks disappeared. The appearance of a broad hump below 10° 2θ and around 29° 2θ (dotted red circle) became clear, indicating that an amorphous phase structure, such as C-S-H/C-A-S-H gels, was formed [74,75,76]. The crystalline diffraction peaks of the calcium silicates and aluminates also decreased, suggesting that they dissolved (partially, at least) and reacted with an alkaline solution to produce the hydrated products in all pastes [43]. There was also calcium carbonate that resulted from the consumption of calcium hydroxide. No apparent changes were observed in the peaks of wustite (FeO) or quartz (SiO2), suggesting that these phases did not participate in the alkali activation reaction [31].
Figure 10 presents the comparison of the mineralogical composition for two different pastes (0.75M-4% and 2.22M-4%) for the early (1 day) and later hydration (28 days). As can be seen, the main differences between both formulations were the peaks of Ca(OH)2 at around 18° and 33° 2θ for the 0.75M-4% paste and the broader humps of C-S-H/C-A-S-H gels at about 10° and 29° 2θ for the 2.22M-4% paste. These findings were in accordance with the compressive strength results (Figure 5), showing that the hydrate gels were responsible for the strength development. Additionally, the presence of Ca(OH)2 is known to promote the formation of reaction products in the system by increasing the Ca/Si ratio, which is beneficial for the formation of calcium silicate gels [34]. Thus, the crystalline phase in the 0.75M-4% pastes strongly suggested that the alkali reaction was weaker and fewer hydrates were formed.

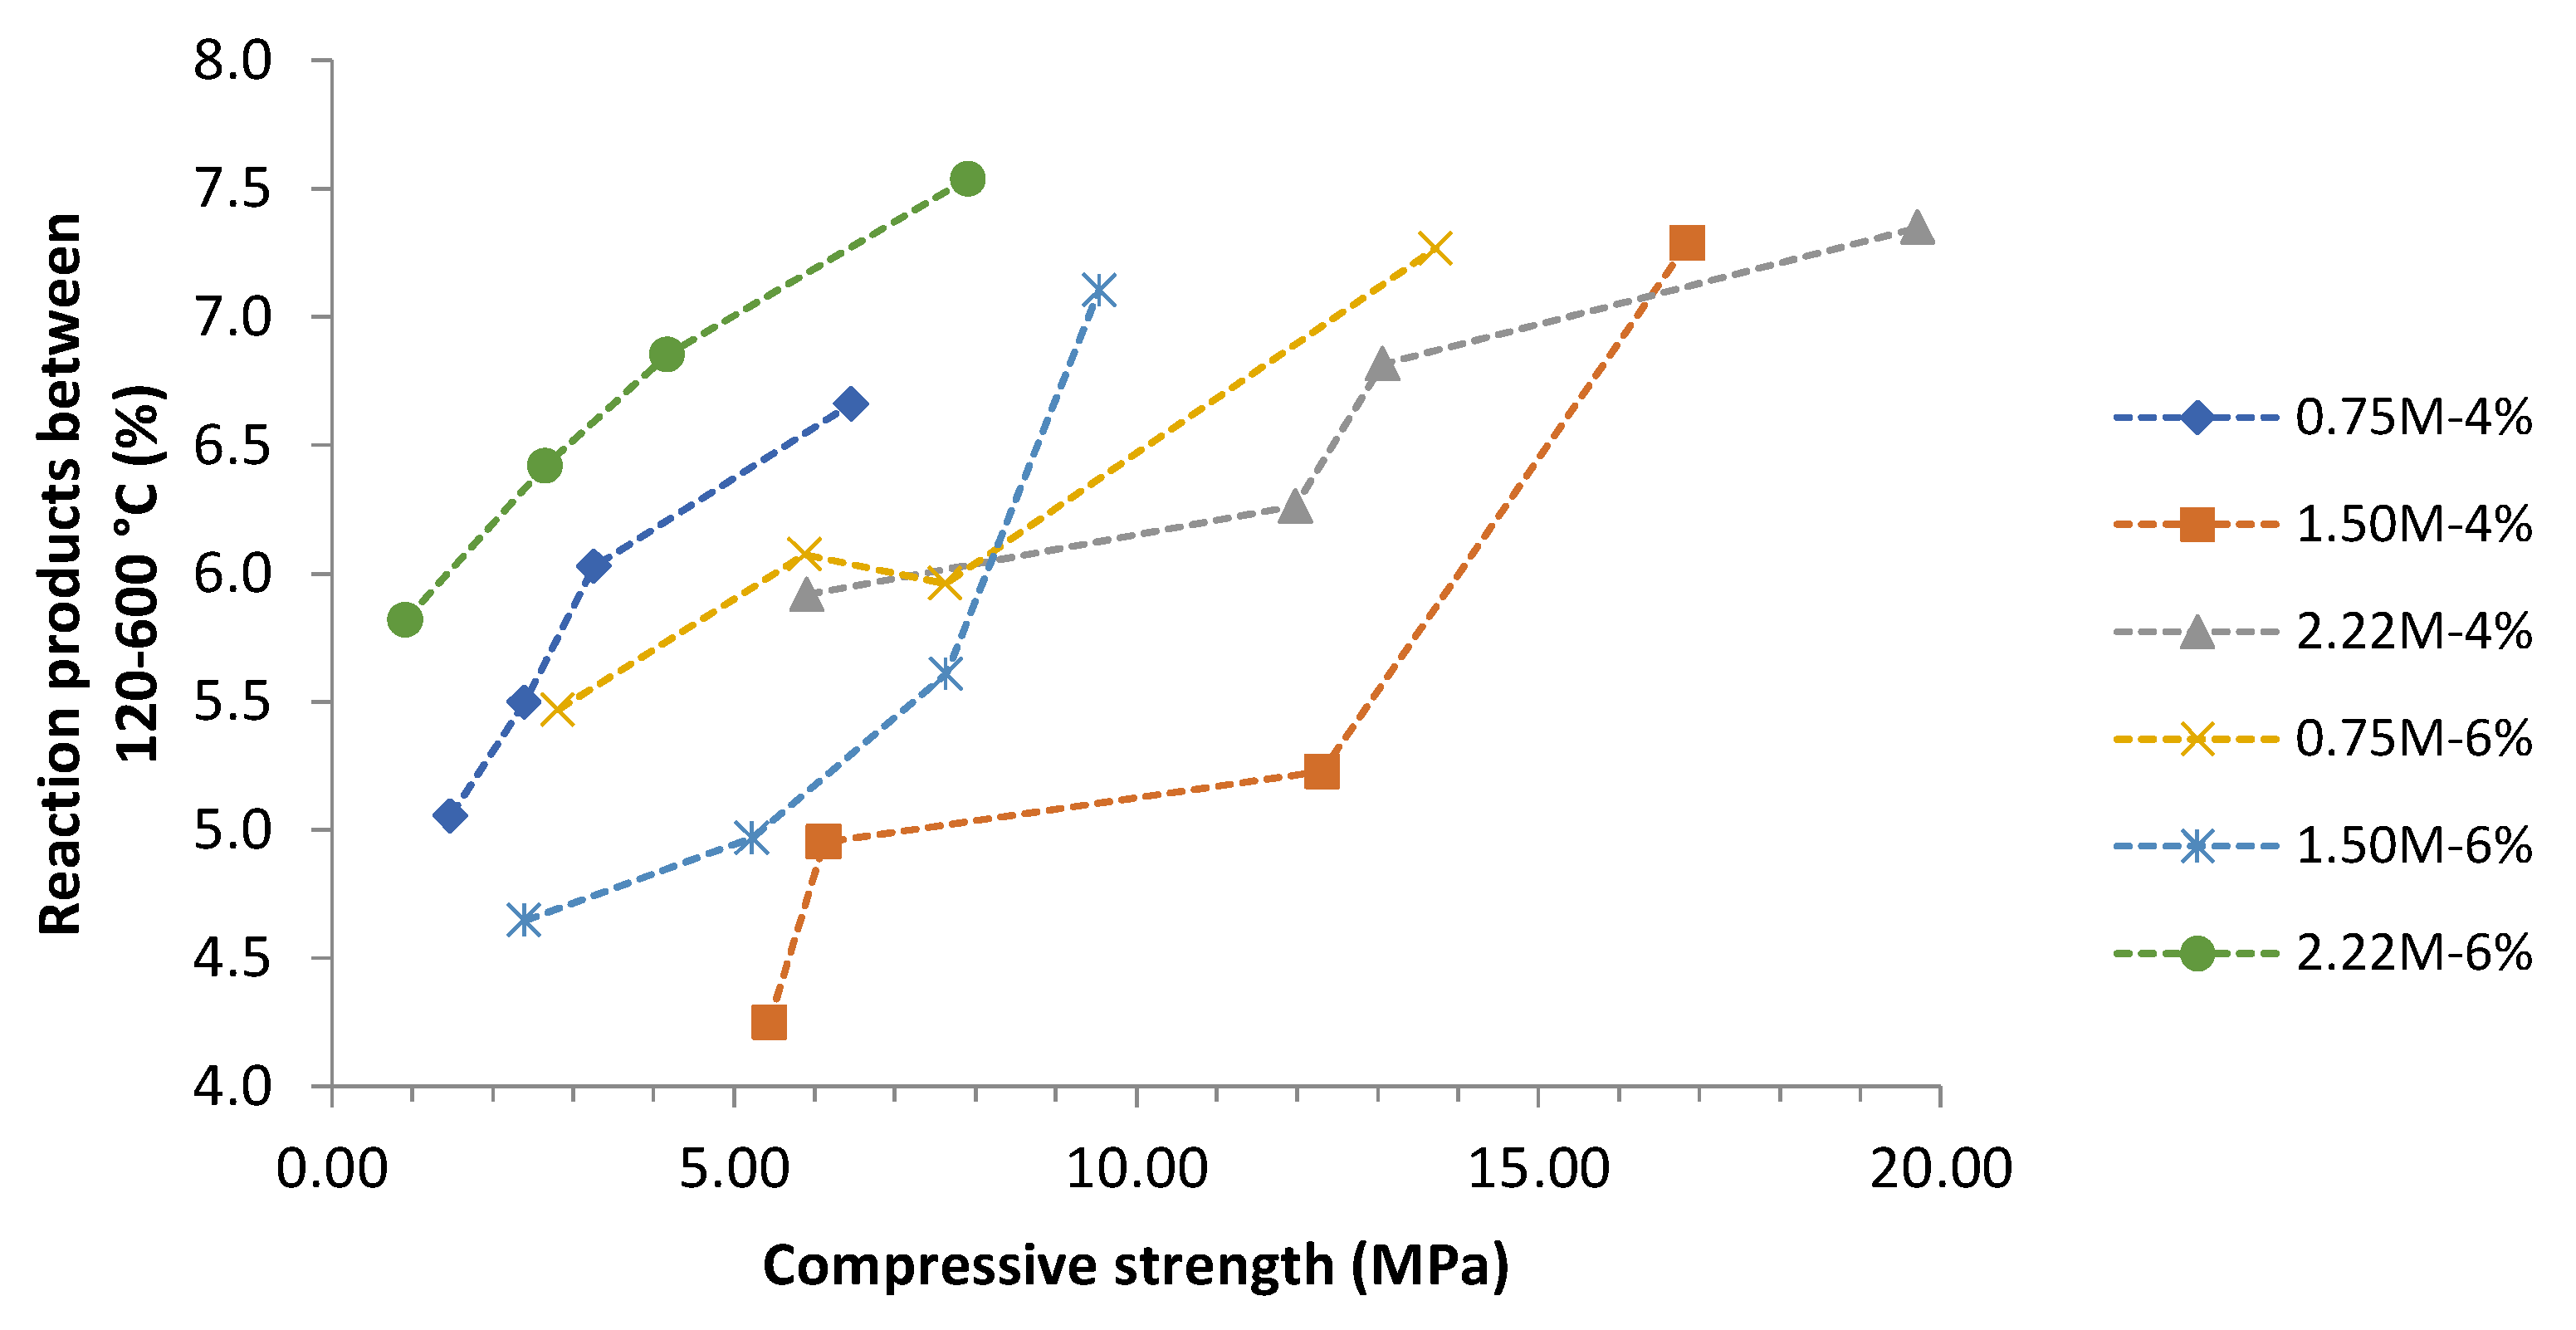
3.4.2. TG/DTG Analysis

Thermogravimetric analysis is widely used to monitor the hydration process and identify and determine the content of reaction products, such as silicates, gels, other hydrates and carbonates. The TG/DTG of two different pastes (0.75M-4% and 2.22M-4%) as a function of the curing time are presented in Figure 11. The high mass loss below 120 °C was assigned to the complete release of physically bound water within the gel structure [77]. All pastes presented a shift toward high temperatures in the DTG peaks in this region as the curing progressed from 1 to 28 days (as represented in Figure 11). This suggested the formation of gels with more tightly bonded water as the reaction products developed [76]. The continuous mass loss after 120 °C until 600 °C was attributed to the decomposition of hydrated gels, such as C-S-H and C-(A)-S-H [78], and the dehydroxylation of residual Ca(OH)2 [77]. Notably, further mass loss can be observed at 600–800 °C, which was caused by the decomposition of calcium carbonate CaCO3 [76,77]. No other abrupt mass loss was observed until 1000 °C; all formulations had a slight and continuous mass loss.
Figure 11a presents the TG/DTG curves of the 0.75M-4% sample, representing the same behavior as the 0.75M-6% sample. It is possible to identify a more defined mass loss around 400 °C, probably due to the residual Ca(OH)2 that was not totally consumed during the reaction. This was in line with the Ca(OH)2 that was also identified in the XRD analysis for those formulations, as discussed in the previous section (Section 3.4.1Figure 9). Alternatively, Figure 11b presents the TG/DTG curves of the 2.22M-4% sample as a representative curve for the remaining formulations. It is possible to observe the significant mass loss below 120 °C, the continuous mass loss above 120 °C, the calcite decomposition around 600 °C, and the constant and slight mass loss until 1000 °C.
Figure 12 presents the mass losses of all pastes as the curing progressed for two different temperature ranges (120–600 °C and 600–1000 °C). The curves showed an apparent increase in mass loss over the curing time for all formulations. Those two temperature ranges correspond to the decomposition of the main reaction products, namely, C-S-H/C-A-S-H gels and CaCO3, respectively. The results confirmed the findings of previous studies [42,43,44]. Moreover, the high content of reaction products primarily in the TGA 120–600 °C range correlated well with the strength development (Figure 13).
As the quantity and density of the gels increased, the mass loss also increased (Figure 12), which was revealed macroscopically as the enhancement in compressive strength [31]. Nevertheless, there was no correlation between mass loss and compressive strength. For instance, all formulations contained mass loss between 6.5–7.5% at 28 days but presented completely different mechanical behavior (Figure 13). It is essential to say that not all hydrates decomposed from 120–600 °C contributed to the strength development. In addition, other external factors are related to compressive strength, such as workability, casting/molding capacity, water content and internal porosity.
The variation in the activation parameters affected the hydration process. Figure 14 presents the TGA mass loss at 28 days and the initial heat release found via calorimetry (Section 3.2) against the silica modulus and Na2O concentration (4% and 6%). It is possible to see that the increase in the silica modulus (more soluble Si4+) was much more favorable at a low Na2O concentration (4%) when it came to forming more reaction products, and consequently, improving the compressive strength (Figure 7). Overall, for a constant silica modulus, a high Na2O concentration led to increased heat output and the formation of more hydrates (higher mass loss via TGA) due to the high alkali content [79].

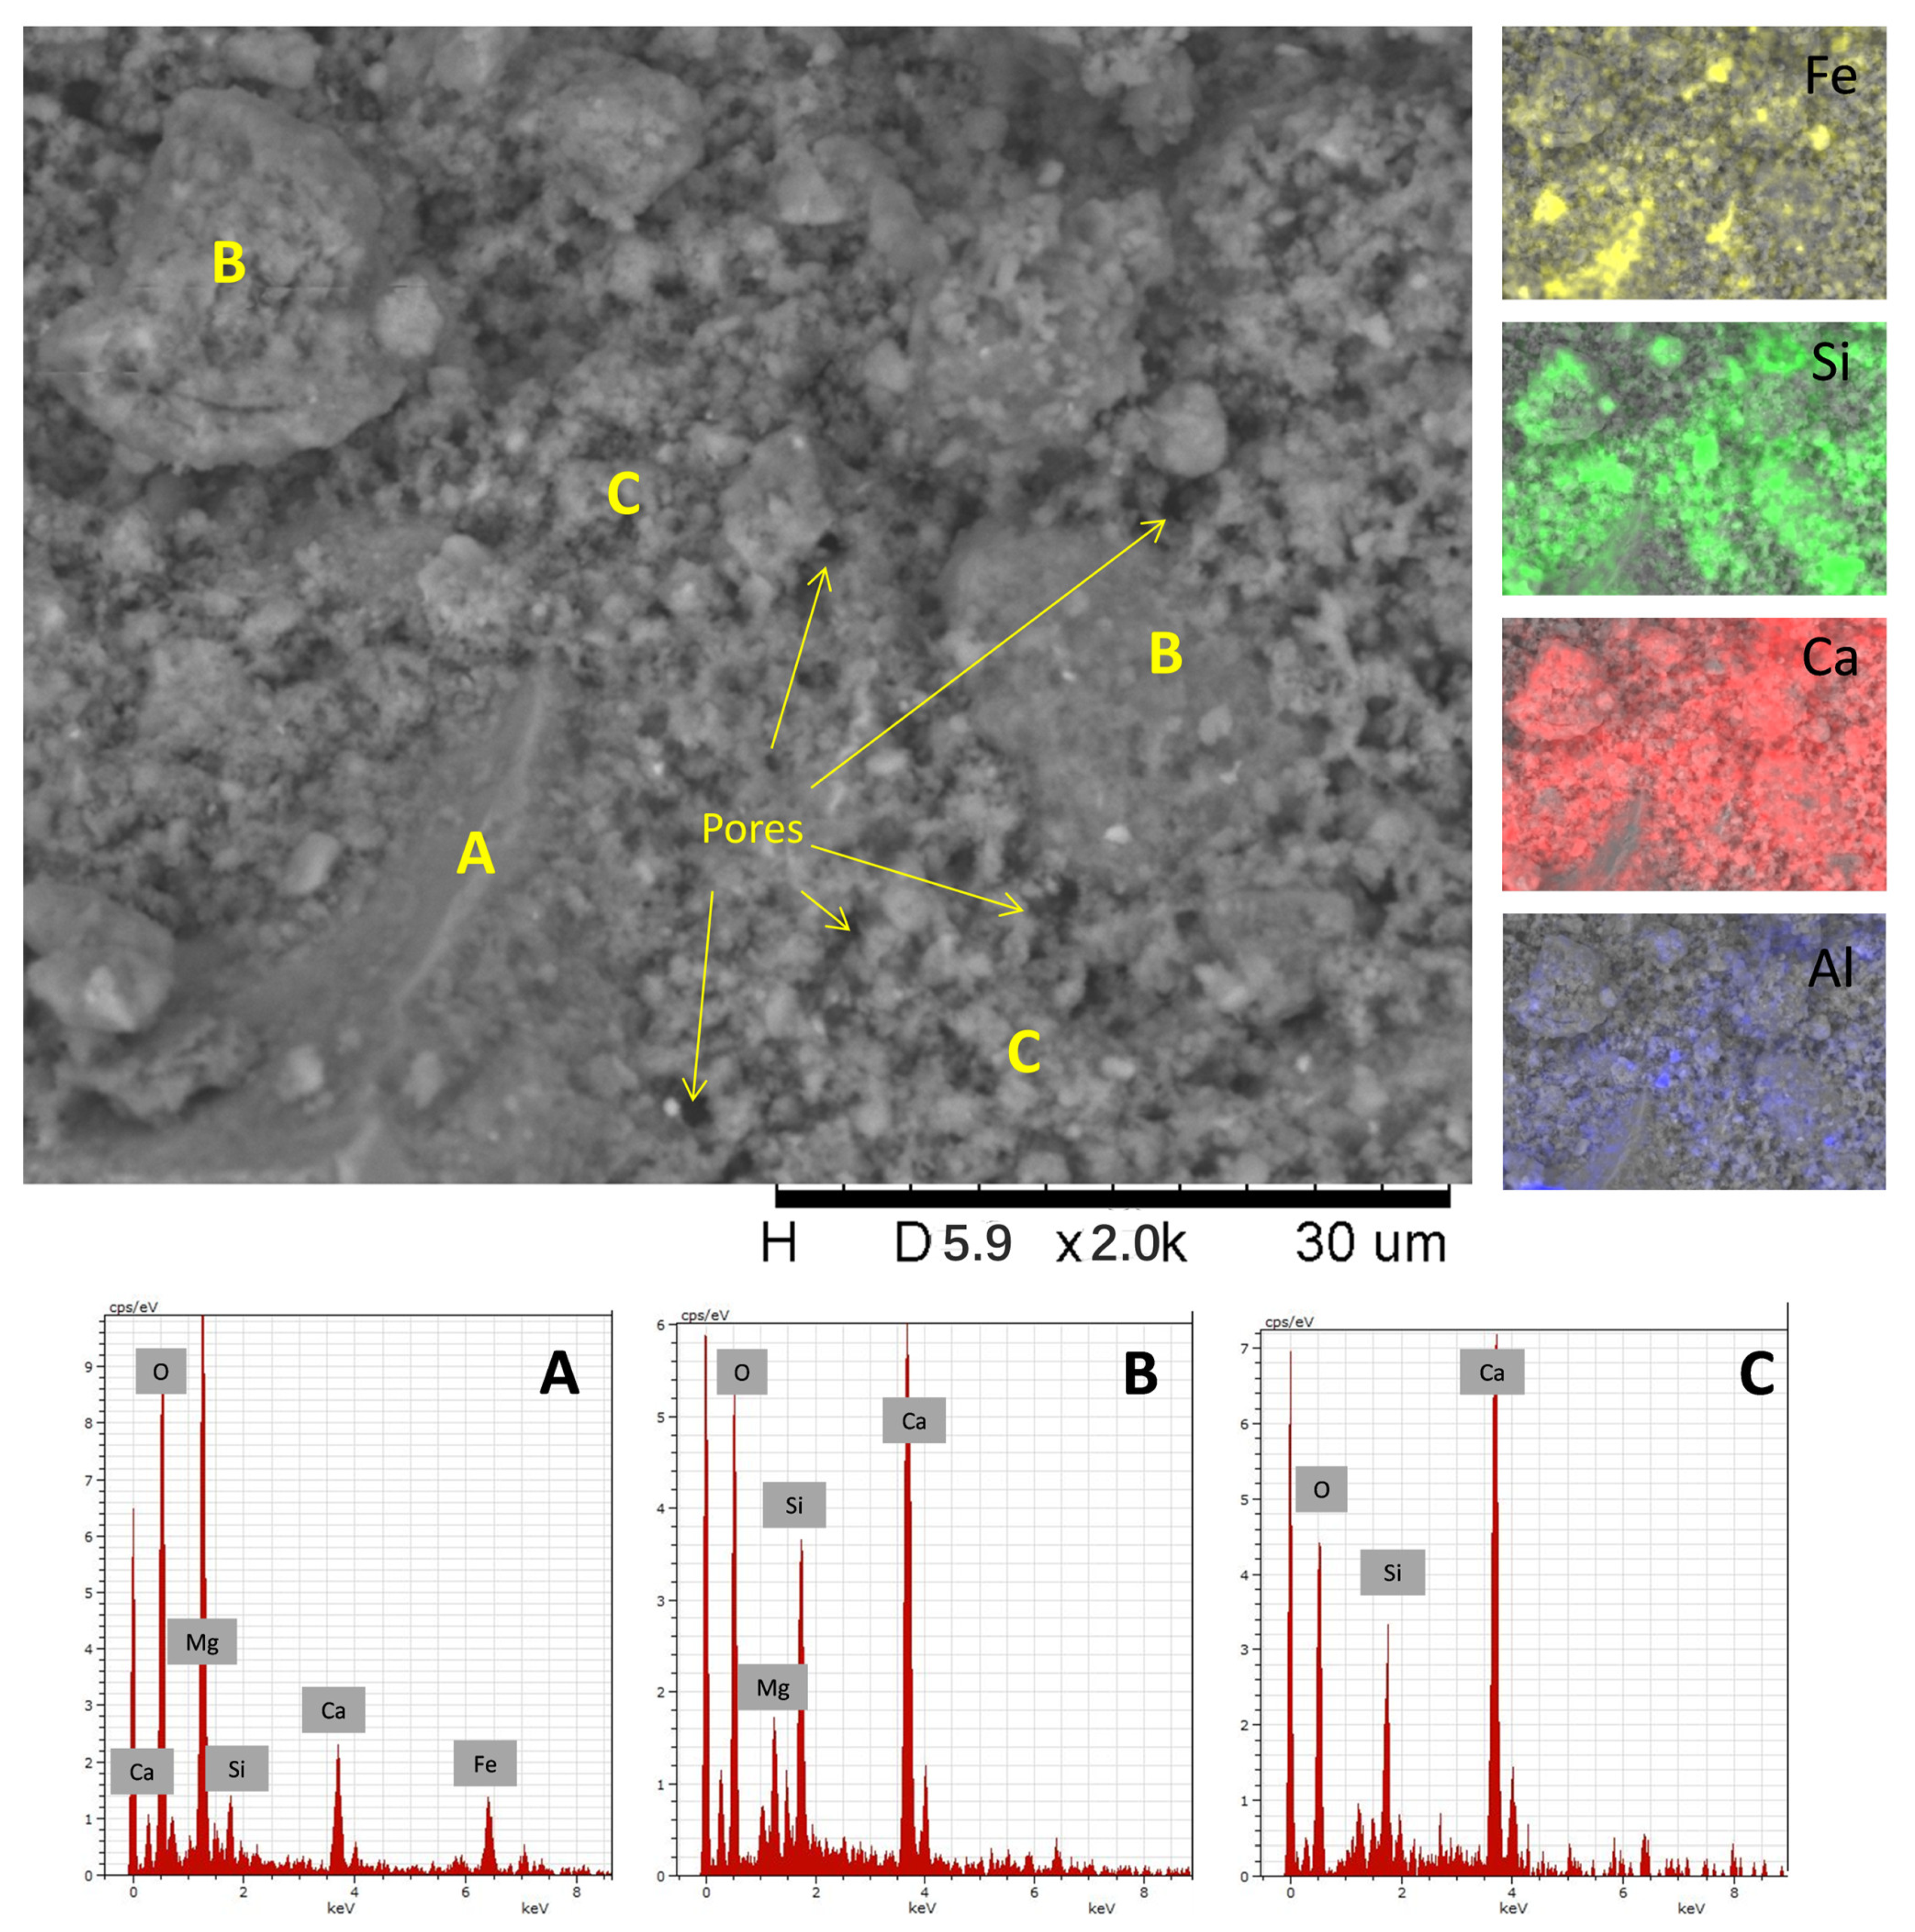
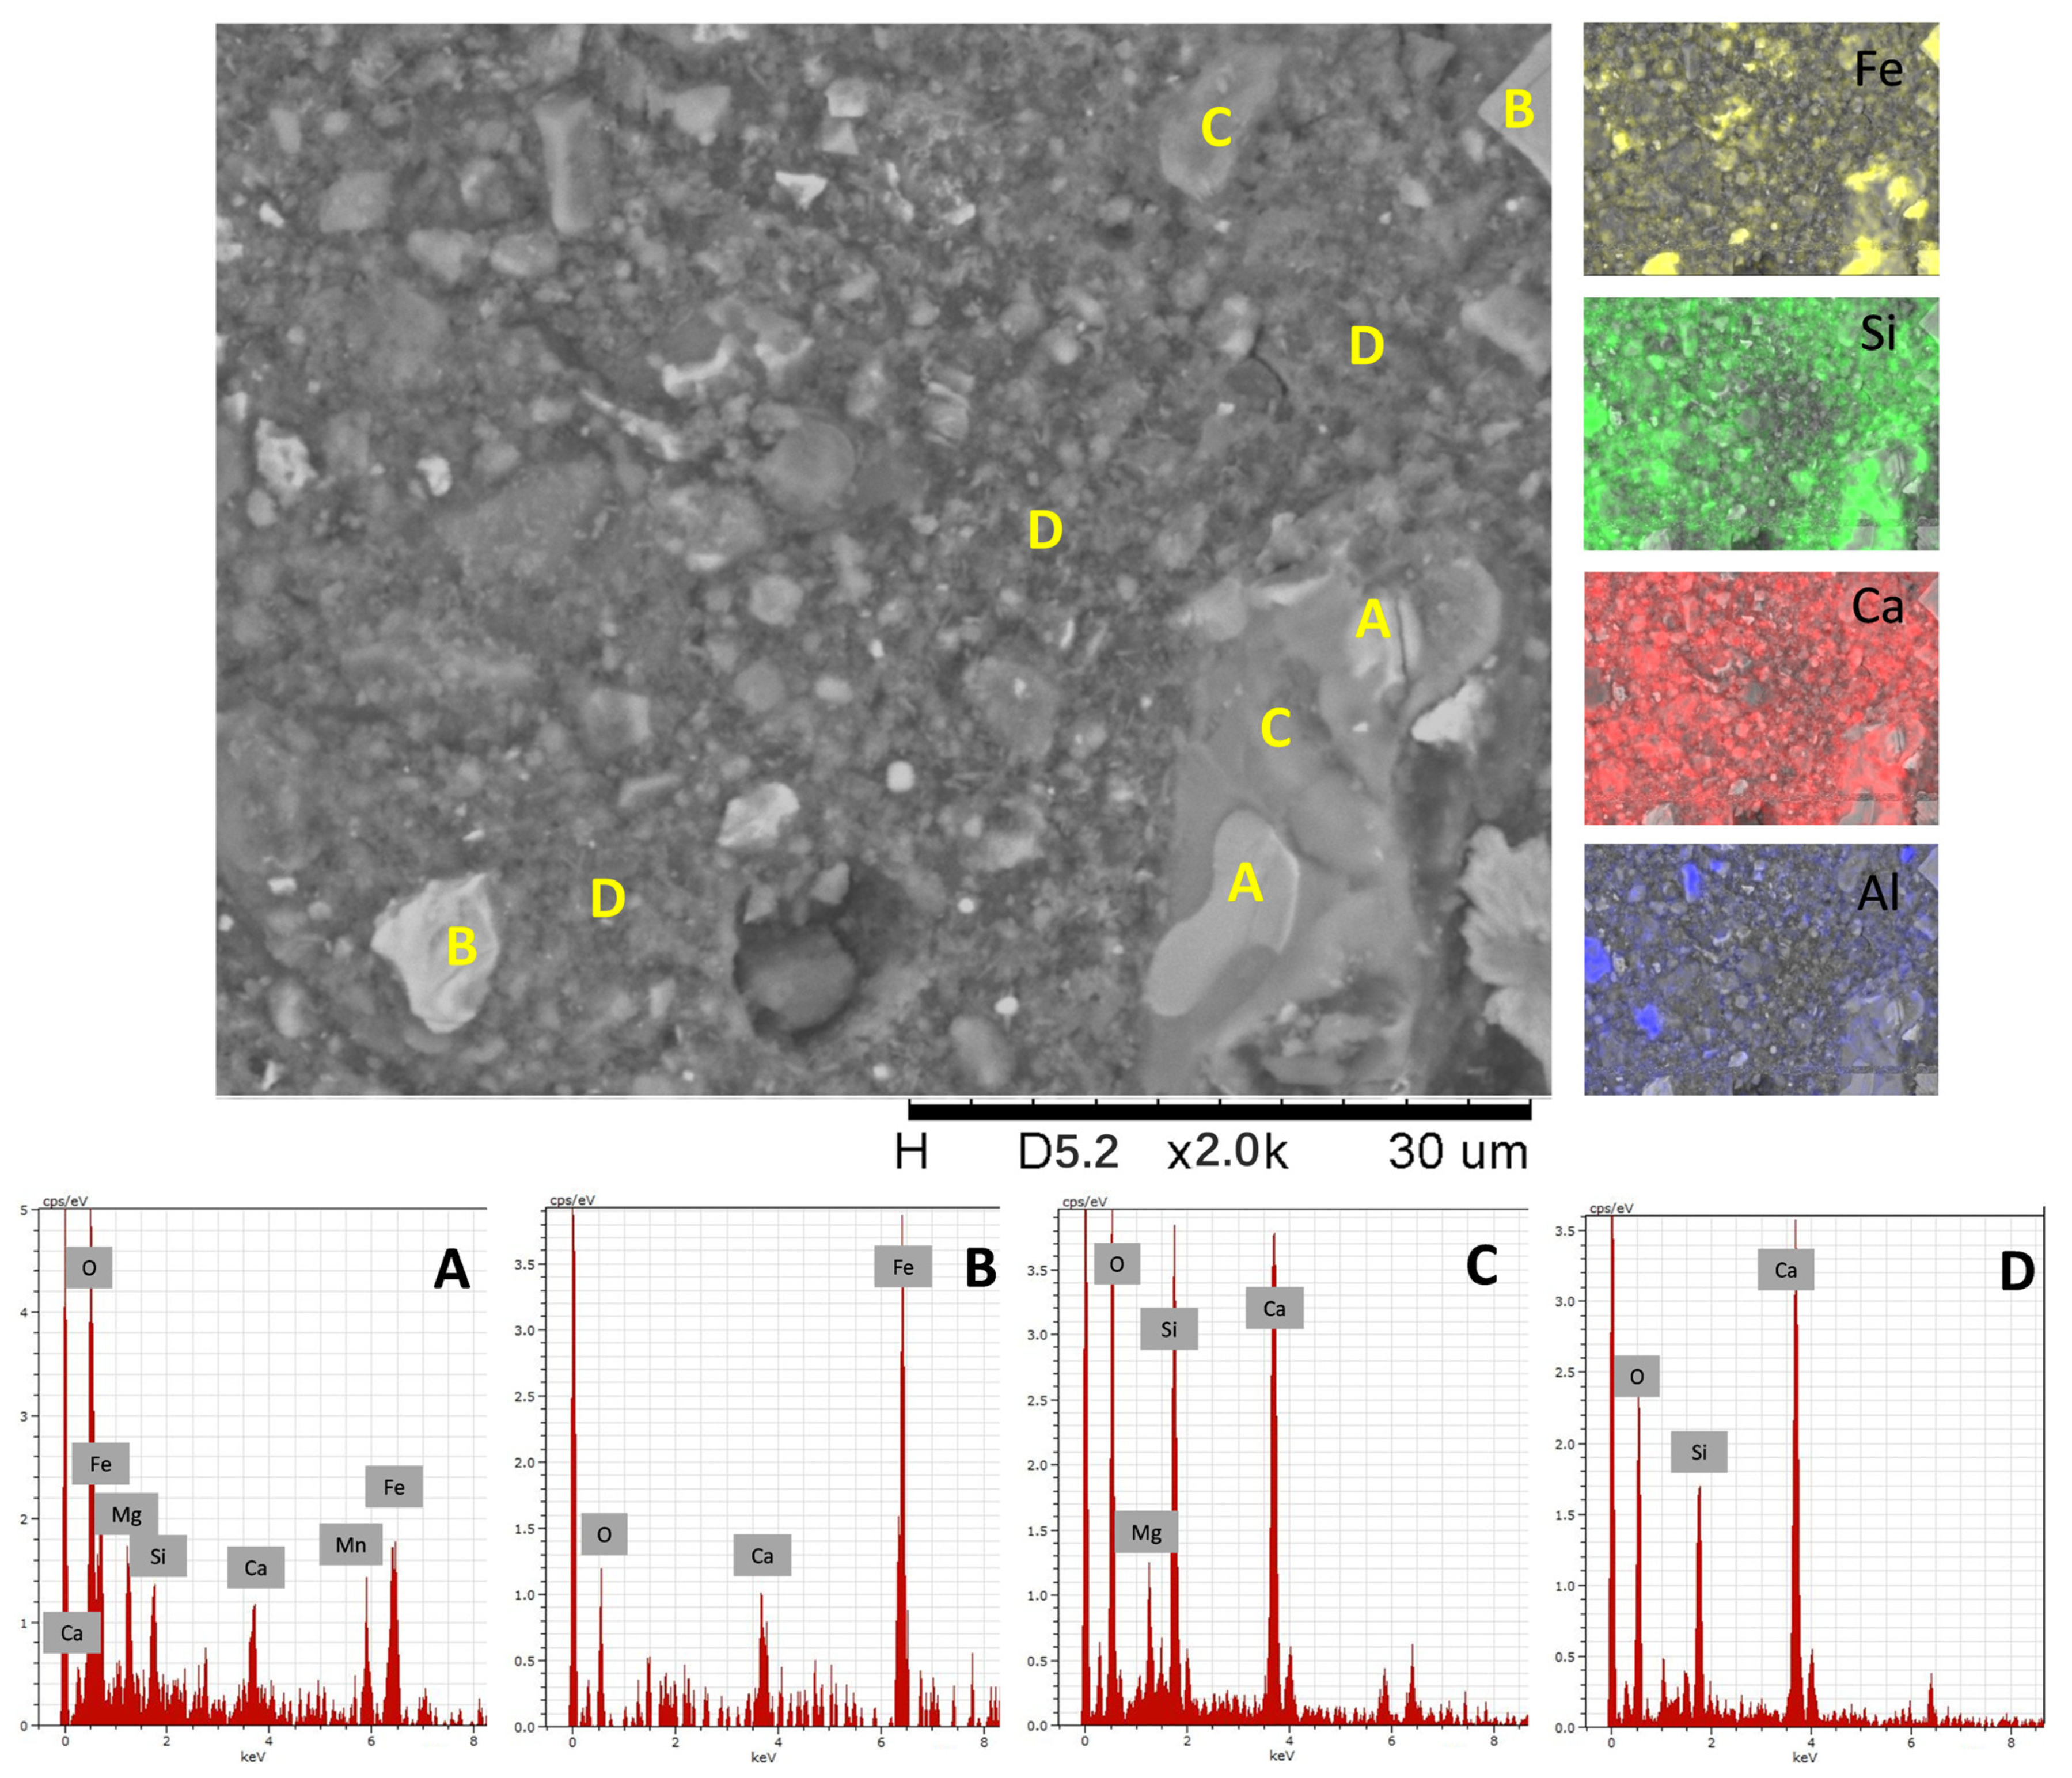
3.4.3. SEM-EDX Analysis

Figure 15 and Figure 16 show the SEM micrographs with elemental mapping and EDX spot analyses for the formulations 0.75M-4% and 2.22M-4%, respectively. The major elements from the elemental mapping of the 0.75M-4% sample (Figure 15) were Si (from the activator) and Ca (from the BOF slag). The phases labeled A, B and C were, respectively, the RO phase, calcium silicate (from unreacted BOF slag particle) and C-S-H gel. The RO phase is an undissolved crystal phase commonly found in BOF slags and will remain like that even if hydrated for many years [27]. Figure 15 presents more unreacted BOF slag particles, which is in accordance with the lowest amount of reaction products found via TGA (Figure 12a) and the lowest compressive strength (Figure 6). An open microstructure with porous regions all over the matrix resulted from a poor hydration/activation process, which compromised the compressive strength development.
Differently, Figure 16 presents the 2.22M-4% formulation with an entirely different microstructure. The elemental mapping showed an even greater predominance of Si and Ca in the matrix. Phases labeled A, B, C and D were, respectively, the RO phase embedded in the BOF slag particles, the remaining steel inclusion, calcium silicate (unreacted BOF slag) and C-S-H gel. In this case, the RO phase was embedded in the BOF slag particles, blocking these particles from dissolving and forming the reaction products (gel). A more homogeneous microstructure was observed, which was characterized by a smaller number of undissolved or partially dissolved BOF slag particles and lower porosity. More hydrates were formed (Figure 12a), which filled the existing pores (voids) and bonded the remaining solid particles together to form a continuous, dense and complete matrix [32]. Therefore, the denser microstructure resulted from a better hydration/activation process, and the high presence of hydrates reduced the microstructural porosity, resulting in higher compressive strength (Figure 6).

4. Concluding Remarks

This study explored the possibility of using SS as a single precursor in AAM. The effect of the variation of the activation parameters, namely, the Na2O concentration and silica modulus, on the fresh and hardened properties of BOF slag-based AAM was evaluated through a series of experiments. The focus was given to the structural and microstructural behavior of the AAM pastes. The main conclusions were as follows:
  • The BOF slag studied presented low pozzolanic behavior, low heat generation and may be considered a low-reactivity material. Nevertheless, the alkali activation process and hardening of pastes were confirmed in all studied cases.
  • Crystalline phases of the BOF slag dissolved under the alkaline environment to produce hydrates in all studied formulations, as presented by the TGA and XRD results.
  • The high initial heat release measured from the formulations with a high concentration of Na2O and a high silica modulus may have contributed to the rapid setting, thus compromising the casting process of those formulations.
  • All formulations presented the same behavior in terms of hydrate formation over the curing time. The TGA results showed the amount of hydrates by quantifying the mass loss, but no correlation with compressive strength development was determined. Other external factors are related to compressive strength, such as workability, molding process, water content and internal porosity.
  • A low silica modulus combined with a low Na2O concentration led to the identification of residual Ca(OH)2 in the TGA and XRD results. This strongly suggested that the alkali reaction was weaker, and thus, less reaction products were formed, which jeopardized the strength development.
  • A high silica modulus combined with a high Na2O concentration increased the alkalinity in the solution, thus increasing the intensity and speed of the heat release. Moreover, the excess of silicate and OH limited the diffusion of ions, and thus, the reaction of Ca2+ with Si4+. As a result, the casting process and the strength development were compromised.
  • Finally, better strength performance was achieved when an optimized combination of activator sources was considered. In this study, a low Na2O concentration (4%) with an intermediary silica modulus (1.50–2.22) presented the best mechanical results (compressive strength up to 20 MPa), a good amount of reaction products formed (C-S-H/C-A-S-H gel and CaCO3), and a low initial and cumulative amount of heat released. Although the compressive strength was lower than for the conventional ones, it is essential to highlight that BOF slag is an important industry waste that presents economic and environmental benefits and can be used in future engineering projects.

Author Contributions

Conceptualization, V.A.N. and P.H.R.B.; data curation, V.A.N.; methodology, V.A.N., P.H.R.B. and C.T.; validation, V.A.N. and P.H.R.B.; formal analysis, P.H.R.B.; investigation, V.A.N. and P.S.; resources, P.H.R.B. and A.C.S.B.; writing—original draft preparation, V.A.N.; writing—review and editing, V.A.N., P.H.R.B., C.T., A.C.S.B. and P.S.; visualization, V.A.N.; supervision, P.H.R.B. and C.T.; project administration, V.A.N.; funding acquisition, V.A.N. and P.H.R.B. All authors have read and agreed to the published version of the manuscript.

Funding

This study was financed in part by the Coordenação de Aperfeiçoamento de Pessoal de Nível Superior—Brasil (CAPES)—finance code 001, grant PPM-00709-18 (FAPEMIG) and grant 316882/2021-6 (CNPq).

Institutional Review Board Statement

Not applicable.

Informed Consent Statement

Not applicable.

Data Availability Statement

Not applicable.

Acknowledgments

The authors would like to thank Maurício Guimarães Bergeman and the Laboratory of Mineral Processing (LTM-USP) at the Department of Mining and Petroleum Engineering University of São Paulo for the support of the steel slag processing (milling) and Túlio Hallak Panzera from the Centre for Innovation and Technology in Composite Materials (CITeC) at the Federal University of São João del-Rei (UFSJ) for the support regarding the SEM/EDX analysis.

Conflicts of Interest

The authors declare no conflict of interest.

References

  1. King, R.; Orloff, M.; Virsilas, T.; Pande, T. Confronting the Urban Housing Crisis in the Global South: Adequate, Secure, and Affordable Housing; World Resources Institute Working Paper; World Resources Institute: Washington, DC, USA, 2017. [Google Scholar]
  2. George, A.; Kaldany, R.-R.; Losavio, J. The World Is Facing a $15 Trillion Infrastructure Gap by 2040. Here’s How to Bridge It; World Economic Forum: Cologny, Switzerland, 2019. [Google Scholar]
  3. IEA. Cement; IEA: Paris, France, 2020. [Google Scholar]
  4. Moumin, G.; Ryssel, M.; Zhao, L.; Markewitz, P.; Sattler, C.; Robinius, M.; Stolten, D. CO2 Emission Reduction in the Cement Industry by Using a Solar Calciner. Renew. Energy 2020, 145, 1578–1596. [Google Scholar] [CrossRef]
  5. Adesanya, E.; Perumal, P.; Luukkonen, T.; Yliniemi, J.; Ohenoja, K.; Kinnunen, P.; Illikainen, M. Opportunities to Improve Sustainability of Alkali Activated Materials: Review of Side-Stream Based Activators. J. Clean. Prod. 2020, 286, 125558. [Google Scholar] [CrossRef]
  6. Habert, G.; Ouellet-Plamondon, C. Recent Update on the Environmental Impact of Geopolymers. RILEM Tech. Lett. 2016, 1, 17–23. [Google Scholar] [CrossRef]
  7. Borges, P.H.R.; de Figueiredo Lourenço, T.M.; Foureaux, A.F.S.; Pacheco, L.S. Estudo Comparativo Da Análise de Ciclo de Vida de Concretos Geopoliméricos e de Concretos à Base de Cimento Portland Composto (CP II). Ambient. Construído 2014, 14, 153–168. [Google Scholar] [CrossRef] [Green Version]
  8. Turner, L.K.; Collins, F.G. Carbon Dioxide Equivalent (CO2-e) Emissions: A Comparison between Geopolymer and OPC Cement Concrete. Constr. Build. Mater. 2013, 43, 125–130. [Google Scholar] [CrossRef]
  9. Bernal, S.A.; Rodríguez, E.D.; de Gutierrez, R.M.; Gordillo, M.; Provis, J.L. Mechanical and Thermal Characterisation of Geopolymers Based on Silicate-Activated Metakaolin/Slag Blends. J. Mater. Sci. 2011, 46, 5477. [Google Scholar] [CrossRef]
  10. Pacheco-Torgal, F.; Castro-Gomes, J.; Jalali, S. Alkali-Activated Binders: A Review: Part 1. Historical Background, Terminology, Reaction Mechanisms and Hydration Products. Constr. Build. Mater. 2008, 22, 1305–1314. [Google Scholar] [CrossRef] [Green Version]
  11. Nunes, V.A.; Borges, P.H.R. Recent Advances in the Reuse of Steel Slags and Future Perspectives as Binder and Aggregate for Alkali-Activated Materials. Constr. Build. Mater. 2021, 281, 122605. [Google Scholar] [CrossRef]
  12. Bernal, S.A.; Provis, J.L.; Fernández-Jiménez, A.; Krivenko, P.V.; Kavalerova, E.; Palacios, M.; Shi, C. Binder Chemistry–High-Calcium Alkali-Activated Materials. In Alkali Activated Materials; Springer: Berlin/Heidelberg, Germany, 2014; pp. 59–91. ISBN 9400776713. [Google Scholar]
  13. Provis, J.L.; Bernal, S.A. Binder Chemistry–Blended Systems and Intermediate Ca Content. In Alkali Activated Materials; Springer: Berlin/Heidelberg, Germany, 2014; pp. 125–144. [Google Scholar]
  14. Shi, C.; Qu, B.; Provis, J.L. Recent Progress in Low-Carbon Binders. Cem. Concr. Res. 2019, 122, 227–250. [Google Scholar] [CrossRef]
  15. Provis, J.L.; Palomo, A.; Shi, C. Advances in Understanding Alkali-Activated Materials. Cem. Concr. Res. 2015, 78, 110–125. [Google Scholar] [CrossRef]
  16. Provis, J.L.; Bernal, S.A. Geopolymers and Related Alkali-Activated Materials. Annu. Rev. Mater. Res. 2014, 44, 299–327. [Google Scholar] [CrossRef]
  17. Provis, J.L.; van Deventer, J.S.J. 16—Geopolymers and Other Alkali-Activated Materials. In Lea’s Chemistry of Cement and Concrete, 5th ed; Hewlett, P., Liska, M., Eds.; Butterworth-Heinemann: Oxford, UK, 2019; pp. 779–805. ISBN 978-0-08-100773-0. [Google Scholar]
  18. Pacheco-Torgal, F.; Labrincha, J.; Leonelli, C.; Palomo, A.; Chindaprasit, P. Handbook of Alkali-Activated Cements, Mortars and Concretes. Woodhead Publishing: Amsterdam, The Netherlands, 2015; ISBN 1782422889. [Google Scholar]
  19. Cercel, J.; Adesina, A.; Das, S. Performance of Eco-Friendly Mortars Made with Alkali-Activated Slag and Glass Powder as a Binder. Constr. Build. Mater. 2021, 270, 121457. [Google Scholar] [CrossRef]
  20. WSA. World Steel Statistics. Available online: https://www.worldsteel.org/steel-by-topic/statistics/steel-data-viewer/MCSP_crude_steel_monthly/WORLD_ALL (accessed on 12 February 2022).
  21. Guo, J.; Bao, Y.; Wang, M. Steel Slag in China: Treatment, Recycling, and Management. Waste Manag. 2018, 78, 318–330. [Google Scholar] [CrossRef] [PubMed]
  22. IAB. Relatório de Sustentabilidade 2018. Available online: https://acobrasil.org.br/site/publicacao/relatorio-de-sustentabilidade-2018/ (accessed on 10 February 2022).
  23. Fisher, L.V.; Barron, A.R. The Recycling and Reuse of Steelmaking Slags—A Review. Resour. Conserv. Recycl. 2019, 146, 244–255. [Google Scholar] [CrossRef] [Green Version]
  24. Thomas, C.; Rosales, J.; Polanco, J.A.; Agrela, F. 7—Steel Slags. In Woodhead Publishing Series in Civil and Structural Engineering; de Brito, J., Agrela, F.B.T.-N.T., Eds.; Woodhead Publishing: Sawston, UK, 2019; pp. 169–190. ISBN 978-0-08-102480-5. [Google Scholar]
  25. Wang, G.C. 5—Slag Processing. In The Utilization of Slag in Civil Infrastructure Construction; Wang, G.C., Ed.; Woodhead Publishing: Sawston, UK, 2016; pp. 87–113. ISBN 978-0-08-100994-9. [Google Scholar]
  26. Wang, Y.; Suraneni, P. Experimental Methods to Determine the Feasibility of Steel Slags as Supplementary Cementitious Materials. Constr. Build. Mater. 2019, 204, 458–467. [Google Scholar] [CrossRef]
  27. Han, F.; Zhang, Z. Properties of 5-Year-Old Concrete Containing Steel Slag Powder. Powder Technol. 2018, 334, 27–35. [Google Scholar] [CrossRef]
  28. Pan, Z.; Zhou, J.; Jiang, X.; Xu, Y.; Jin, R.; Ma, J.; Zhuang, Y.; Diao, Z.; Zhang, S.; Si, Q.; et al. Investigating the Effects of Steel Slag Powder on the Properties of Self-Compacting Concrete with Recycled Aggregates. Constr. Build. Mater. 2019, 200, 570–577. [Google Scholar] [CrossRef]
  29. Mutuk, T.; Demirbaş, A.K.; Çevik, S.; Mesci Oktay, B. The Effects of Cast Industry Waste of Scale Instead of Cement on the Mechanical and Microstructural Properties. Int. J. Appl. Ceram. Technol. 2019, 17, 197–204. [Google Scholar] [CrossRef] [Green Version]
  30. Cao, L.; Shen, W.; Huang, J.; Yang, Y.; Zhang, D.; Huang, X.; Lv, Z.; Ji, X. Process to Utilize Crushed Steel Slag in Cement Industry Directly: Multi-Phased Clinker Sintering Technology. J. Clean. Prod. 2019, 217, 520–529. [Google Scholar] [CrossRef]
  31. Liu, J.; Yi, C.; Zhu, H.; Ma, H. Property Comparison of Alkali-Activated Carbon Steel Slag (CSS) and Stainless Steel Slag (SSS) and Role of Blast Furnace Slag (BFS) Chemical Composition. Materials 2019, 12, 3307. [Google Scholar] [CrossRef]
  32. Song, W.; Zhu, Z.; Pu, S.; Wan, Y.; Huo, W.; Song, S.; Zhang, J.; Yao, K.; Hu, L. Efficient Use of Steel Slag in Alkali-Activated Fly Ash-Steel Slag-Ground Granulated Blast Furnace Slag Ternary Blends. Constr. Build. Mater. 2020, 259, 119814. [Google Scholar] [CrossRef]
  33. Zhou, Y.; Sun, J.; Liao, Y. Influence of Ground Granulated Blast Furnace Slag on the Early Hydration and Microstructure of Alkali-Activated Converter Steel Slag Binder. J. Therm. Anal. Calorim. 2022, 147, 243–252. [Google Scholar] [CrossRef]
  34. Wang, M.; Qian, B.; Jiang, J.; Liu, H.; Cai, Q.; Ma, B.; Hu, Y.; Wang, L. The Reaction between Ca2+ from Steel Slag and Granulated Blast-Furnace Slag System: A Unique Perspective. Chem. Pap. 2020, 74, 4401–4410. [Google Scholar] [CrossRef]
  35. Zhao, Y.; Shi, T.; Cao, L.; Kan, L.; Wu, M. Influence of Steel Slag on the Properties of Alkali-Activated Fly Ash and Blast-Furnace Slag Based Fiber Reinforced Composites. Cem. Concr. Compos. 2021, 116, 103875. [Google Scholar] [CrossRef]
  36. Bai, T.; Song, Z.-G.; Wu, Y.-G.; Hu, X.-D.; Bai, H. Influence of Steel Slag on the Mechanical Properties and Curing Time of Metakaolin Geopolymer. Ceram. Int. 2018, 44, 15706–15713. [Google Scholar] [CrossRef]
  37. Furlani, E.; Maschio, S.; Magnan, M.; Aneggi, E.; Andreatta, F.; Lekka, M.; Lanzutti, A.; Fedrizzi, L. Synthesis and Characterization of Geopolymers Containing Blends of Unprocessed Steel Slag and Metakaolin: The Role of Slag Particle Size. Ceram. Int. 2018, 44, 5226–5232. [Google Scholar] [CrossRef]
  38. Song, W.; Zhu, Z.; Peng, Y.; Wan, Y.; Xu, X.; Pu, S.; Song, S.; Wei, Y. Effect of Steel Slag on Fresh, Hardened and Microstructural Properties of High-Calcium Fly Ash Based Geopolymers at Standard Curing Condition. Constr. Build. Mater. 2019, 229, 116933. [Google Scholar] [CrossRef]
  39. Chen, Y.; Zhou, X.; Wan, S.; Zheng, R.; Tong, J.; Hou, H.; Wang, T. Synthesis and Characterization of Geopolymer Composites Based on Gasification Coal Fly Ash and Steel Slag. Constr. Build. Mater. 2019, 211, 646–658. [Google Scholar] [CrossRef]
  40. Guo, X.; Yang, J. Intrinsic Properties and Micro-Crack Characteristics of Ultra-High Toughness Fly Ash/Steel Slag Based Geopolymer. Constr. Build. Mater. 2020, 230, 116965. [Google Scholar] [CrossRef]
  41. Adesanya, E.; Ohenoja, K.; Kinnunen, P.; Illikainen, M. Properties and Durability of Alkali-Activated Ladle Slag. Mater. Struct. 2017, 50, 255. [Google Scholar] [CrossRef] [Green Version]
  42. Ozturk, M.; Bankir, M.B.; Bolukbasi, O.S.; Sevim, U.K. Alkali Activation of Electric Arc Furnace Slag: Mechanical Properties and Micro Analyzes. J. Build. Eng. 2019, 21, 97–105. [Google Scholar] [CrossRef]
  43. Sun, J.; Chen, Z. Effect of Silicate Modulus of Water Glass on the Hydration of Alkali-Activated Converter Steel Slag. J. Therm. Anal. Calorim. 2019, 138, 47–56. [Google Scholar] [CrossRef]
  44. Morone, M.; Cizer, Ö.; Costa, G.; Baciocchi, R. Effects of Alkali Activation and CO2 Curing on the Hydraulic Reactivity and Carbon Storage Capacity of BOF Slag in View of Its Use in Concrete. Waste Biomass Valorization 2019. [Google Scholar] [CrossRef]
  45. Liu, Z.; Zhang, D.; LI, L.; Wang, J.; Shao, N.; Wang, D. Microstructure and Phase Evolution of Alkali-Activated Steel Slag during Early Age. Constr. Build. Mater. 2019, 204, 158–165. [Google Scholar] [CrossRef]
  46. Češnovar, M.; Traven, K.; Horvat, B.; Ducman, V. The Potential of Ladle Slag and Electric Arc Furnace Slag Use in Synthesizing Alkali Activated Materials; the Influence of Curing on Mechanical Properties. Materials 2019, 12, 1173. [Google Scholar] [CrossRef] [Green Version]
  47. Sun, J.; Zhang, Z.; Zhuang, S.; He, W. Hydration Properties and Microstructure Characteristics of Alkali–Activated Steel Slag. Constr. Build. Mater. 2020, 241, 118141. [Google Scholar] [CrossRef]
  48. Lancellotti, I.; Piccolo, F.; Traven, K.; Češnovar, M.; Ducman, V.; Leonelli, C. Alkali Activation of Metallurgical Slags: Reactivity, Chemical Behavior, and Environmental Assessment. Materials 2021, 14, 639. [Google Scholar] [CrossRef]
  49. Wang, G.C. 13—Slag Use in Cement Manufacture and Cementitious Applications. In The Utilization of Slag in Civil Infrastructure Construction; Wang, G.C., Ed.; Woodhead Publishing: Sawston, UK, 2016; pp. 305–337. ISBN 978-0-08-100994-9. [Google Scholar]
  50. Muhmood, L.; Vitta, S.; Venkateswaran, D. Cementitious and Pozzolanic Behavior of Electric Arc Furnace Steel Slags. Cem. Concr. Res. 2009, 39, 102–109. [Google Scholar] [CrossRef]
  51. Lu, T.-H.; Chen, Y.-L.; Shih, P.-H.; Chang, J.-E. Use of Basic Oxygen Furnace Slag Fines in the Production of Cementitious Mortars and the Effects on Mortar Expansion. Constr. Build. Mater. 2018, 167, 768–774. [Google Scholar] [CrossRef]
  52. Belhadj, E.; Diliberto, C.; Lecomte, A. Characterization and Activation of Basic Oxygen Furnace Slag. Cem. Concr. Compos. 2012, 34, 34–40. [Google Scholar] [CrossRef]
  53. Yildirim, I.Z.; Prezzi, M. Chemical, Mineralogical, and Morphological Properties of Steel Slag. Adv. Civ. Eng. 2011, 2011, 1687–8086. [Google Scholar] [CrossRef] [Green Version]
  54. N.B.R. 5752; Pozzolanic Materials–Determination of the Performance Index with Portland Cement at 28 Days. ABNT (Technical Standards Brazilian Association): Rio de Janeiro, Brazil, 2014.
  55. N.B.R. 11578; Portland Composite Cement-Specification. ABNT (Technical Standards Brazilian Association): Rio de Janeiro, Brazil, 1997.
  56. N.B.R. 7214; Areia Normal Para Ensaio de Cimento. ABNT (Technical Standards Brazilian Association): Rio de Janeiro, Brazil, 2015.
  57. Suraneni, P.; Weiss, J. Examining the Pozzolanicity of Supplementary Cementitious Materials Using Isothermal Calorimetry and Thermogravimetric Analysis. Cem. Concr. Compos. 2017, 83, 273–278. [Google Scholar] [CrossRef]
  58. Kim, T.; Olek, J. Effects of Sample Preparation and Interpretation of Thermogravimetric Curves on Calcium Hydroxide in Hydrated Pastes and Mortars. Transp. Res. Rec. 2012, 2290, 10–18. [Google Scholar] [CrossRef]
  59. Suraneni, P.; Hajibabaee, A.; Ramanathan, S.; Wang, Y.; Weiss, J. New Insights from Reactivity Testing of Supplementary Cementitious Materials. Cem. Concr. Compos. 2019, 103, 331–338. [Google Scholar] [CrossRef]
  60. N.B.R. 7215; Cimento Portland: Determinação Da Resistência à Compressão. ABNT (Technical Standards Brazilian Association): Rio de Janeiro, Brazil, 2019.
  61. N.B.R. 9778; Argamassa e Concreto Endurecidos–Determinação Da Absorção de Água, Índice de Vazios e Massa Específica. ABNT (Technical Standards Brazilian Association): Rio de Janeiro, Brazil, 2009.
  62. N.B.R. 12653Materiais Pozolânicos—Requisitos; ABNT (Technical Standards Brazilian Association): Rio de Janeiro, Brazil, 2014.
  63. Fernández-Jiménez, A.; Puertas, F.; Arteaga, A. Determination of Kinetic Equations of Alkaline Activation of Blast Furnace Slag by Means of Calorimetric Data. J. Therm. Anal. Calorim. 1998, 52, 945–955. [Google Scholar] [CrossRef]
  64. Gebregziabiher, B.S.; Thomas, R.J.; Peethamparan, S. Temperature and Activator Effect on Early-Age Reaction Kinetics of Alkali-Activated Slag Binders. Constr. Build. Mater. 2016, 113, 783–793. [Google Scholar] [CrossRef] [Green Version]
  65. Sun, Z.; Vollpracht, A. Isothermal Calorimetry and In-Situ XRD Study of the NaOH Activated Fly Ash, Metakaolin and Slag. Cem. Concr. Res. 2018, 103, 110–122. [Google Scholar] [CrossRef]
  66. Scrivener, K.; Ouzia, A.; Juilland, P.; Kunhi Mohamed, A. Advances in Understanding Cement Hydration Mechanisms. Cem. Concr. Res. 2019, 124, 105823. [Google Scholar] [CrossRef]
  67. San Nicolas, R.; Bernal, S.A.; Mejía de Gutiérrez, R.; van Deventer, J.S.J.; Provis, J.L. Distinctive Microstructural Features of Aged Sodium Silicate-Activated Slag Concretes. Cem. Concr. Res. 2014, 65, 41–51. [Google Scholar] [CrossRef]
  68. Wang, S.-D.; Scrivener, K.L.; Pratt, P.L. Factors Affecting the Strength of Alkali-Activated Slag. Cem. Concr. Res. 1994, 24, 1033–1043. [Google Scholar] [CrossRef]
  69. Shi, Z.; Shi, C.; Wan, S.; Li, N.; Zhang, Z. Effect of Alkali Dosage and Silicate Modulus on Carbonation of Alkali-Activated Slag Mortars. Cem. Concr. Res. 2018, 113, 55–64. [Google Scholar] [CrossRef]
  70. Bernal, S.A.; Provis, J.L.; Rose, V.; Mejía de Gutierrez, R. Evolution of Binder Structure in Sodium Silicate-Activated Slag-Metakaolin Blends. Cem. Concr. Compos. 2011, 33, 46–54. [Google Scholar] [CrossRef]
  71. Kashani, A.; Provis, J.L.; Qiao, G.G.; van Deventer, J.S.J. The Interrelationship between Surface Chemistry and Rheology in Alkali Activated Slag Paste. Constr. Build. Mater. 2014, 65, 583–591. [Google Scholar] [CrossRef]
  72. Borges, P.H.R.; Fonseca, L.F.; Nunes, V.A.; Panzera, T.H.; Martuscelli, C.C. Andreasen Particle Packing Method on the Development of Geopolymer Concrete for Civil Engineering. J. Mater. Civ. Eng. 2014, 26, 692–697. [Google Scholar] [CrossRef]
  73. You, N.; Li, B.; Cao, R.; Shi, J.; Chen, C.; Zhang, Y. The Influence of Steel Slag and Ferronickel Slag on the Properties of Alkali-Activated Slag Mortar. Constr. Build. Mater. 2019, 227, 116614. [Google Scholar] [CrossRef]
  74. Zhou, H.; Lv, W.; Jiao, J.; Lu, D.; Li, D. Effect of Li+ on the Composition and Morphology of CASH. Constr. Build. Mater. 2021, 301, 123982. [Google Scholar] [CrossRef]
  75. Kapeluszna, E.; Kotwica, Ł.; Różycka, A.; Gołek, Ł. Incorporation of Al in C-A-S-H Gels with Various Ca/Si and Al/Si Ratio: Microstructural and Structural Characteristics with DTA/TG, XRD, FTIR and TEM Analysis. Constr. Build. Mater. 2017, 155, 643–653. [Google Scholar] [CrossRef]
  76. Ismail, I.; Bernal, S.A.; Provis, J.L.; San Nicolas, R.; Hamdan, S.; van Deventer, J.S.J. Modification of Phase Evolution in Alkali-Activated Blast Furnace Slag by the Incorporation of Fly Ash. Cem. Concr. Compos. 2014, 45, 125–135. [Google Scholar] [CrossRef]
  77. Alarcon-Ruiz, L.; Platret, G.; Massieu, E.; Ehrlacher, A. The Use of Thermal Analysis in Assessing the Effect of Temperature on a Cement Paste. Cem. Concr. Res. 2005, 35, 609–613. [Google Scholar] [CrossRef]
  78. Gao, X.; Yu, Q.L.; Brouwers, H.J.H. Properties of Alkali Activated Slag–Fly Ash Blends with Limestone Addition. Cem. Concr. Compos. 2015, 59, 119–128. [Google Scholar] [CrossRef]
  79. Oh, J.E.; Monteiro, P.J.M.; Jun, S.S.; Choi, S.; Clark, S.M. The Evolution of Strength and Crystalline Phases for Alkali-Activated Ground Blast Furnace Slag and Fly Ash-Based Geopolymers. Cem. Concr. Res. 2010, 40, 189–196. [Google Scholar] [CrossRef]
Figure 1. Particle size distribution of the BOF slag.
Applsci 12 12437 g001
Figure 2. XRD pattern and Rietveld refinement.
Applsci 12 12437 g002
Figure 3. TG (dotted line) and DTG (solid line) diagrams of the BOF slag.
Applsci 12 12437 g003
Figure 4. Hydration kinetics of the pastes: (a) heat flow and (b) cumulative hydration heat.
Applsci 12 12437 g004
Figure 5. Compressive strengths of the pastes.
Applsci 12 12437 g005
Figure 6. Compressive strength distribution with respect to the formulation and curing age.
Applsci 12 12437 g006
Figure 7. Influence of the activator parameters on the relation between the initial heat release and compressive strength (blue: 4% of Na2O; orange: 6% of Na2O; squares: initial heat release; triangles: compressive strength).
Applsci 12 12437 g007
Figure 8. Apparent density and porosity of pastes.
Applsci 12 12437 g008
Figure 9. XRD patterns of pastes at 28 days (dotted red circle: broad hump indicating amorphous phase structure).
Applsci 12 12437 g009
Figure 10. Comparison of the XRD patterns of 0.75M-4% (blue) and 2.22M-4% (yellow) at 1 and 28 days (dotted red circle: broad hump indicating amorphous phase structure).
Applsci 12 12437 g010
Figure 11. TG/DTG of (a) 0.75M-4% and (b) 2.22M-4%.
Applsci 12 12437 g011
Figure 12. Mass losses (%) for all pastes after 1, 3, 7 and 28 days of curing in different temperature ranges: (a) 120–600 °C and (b) 600–1000 °C.
Applsci 12 12437 g012
Figure 13. Relationship between reaction product percentages and compressive strength for each paste. For each curve (formulation), each point is the value for each curing time (1, 3, 7 and 28 days).
Applsci 12 12437 g013
Figure 14. Influence of activator parameters on the relationship between the reaction products and the initial heat release (blue: 4% of Na2O; orange: 6% of Na2O; squares: reaction products; triangles: initial heat release).
Applsci 12 12437 g014
Figure 15. SEM image of 0.75M-4% (magnification of 2000×) with elemental mapping and EDX spectra of the scanning points: (A) RO phase, (B) calcium silicate (unreacted BOF slag particle) and (C) C-S-H (reaction product).
Applsci 12 12437 g015
Figure 16. SEM image of 2.22M-4% (magnification of 2000×) with elemental mapping and EDX spectra of the scanning points: (A) RO phase (embedded in BOF particle), (B) steel particle, (C) calcium silicate (unreacted BOF slag particle) and (D) C-S-H (reaction product).
Applsci 12 12437 g016
Table 1. Chemical composition of BOF slag.
Chemical Composition of Oxides (%)
CaOFeOSiO2MgOAl2O3Cr2O3MnOP2O5SO3
BOF slag36.6624.1912.1010.603.840.104.531.110.71
Table 2. Mix proportions.
FormulationModulusNa2O/Binder (%)Water/BinderSteel Slag (g)Water (g)Na2SiO3 (g)NaOH (g)
0.75M-4%0.7540.35540159.0348.7818.68
1.50M-4%1.500.35540135.3497.579.19
2.22M-4%2.220.38540128.59144.40-
0.75M-6%0.7560.35540144.0473.1828.02
1.50M-6%1.500.40540135.50146.3513.79
2.22M-6%2.220.40540101.39216.60-
Table 3. Results of modified R3 reactivity test.
Heat Release (J/g SCM)Calcium Hydroxide Consumption (J/g SCM)
BOF slag7616
Another BOF slag [26]2109
LFS [26]490−11.5
GGBFS [26,57]50032
Limestone [57]20−5
Publisher’s Note: MDPI stays neutral with regard to jurisdictional claims in published maps and institutional affiliations.

