Abstract
A body composition analysis has been used to investigate alterations on body tissues in children and adolescents diagnosed with human immunodeficiency virus (HIV) infection, such as low bone mineral content (BMC). The study aimed to developed equations to estimate the BMC in children and adolescents diagnosed with HIV based on a bioelectrical impedance analysis (BIA) using dual energy X-ray absorptiometry (DXA) as a reference method. This is a cross-sectional study conducted with children and adolescents diagnosed with HIV infection. Their body composition was evaluated by BIA and DXA. Linear multiple regression models were constructed to estimate the BMC. Sixty-four children and adolescents aged 8–15 years (12.22 ± 2.13) who were diagnosed with HIV infection participated in the study. The models were substantially correlated with the BMC values, and they explained 82–91% of the BMC, with no differences between DXA and values as estimated by the models. The model with the highest estimate of the BMC (91% of explanation) and the lowest error (SEE of 0.011 kg) included the following variables: body mass, fat mass, total 50 kHz reactance, TCD4 lymphocytes, antiretroviral therapy type, and %TCD4 lymphocytes. The models had a clinically acceptable correlation and low SEE values. The BIA was suitable to estimate the BMC in children and adolescents diagnosed with HIV.
1. Introduction
Body composition analyses, in children and adolescents diagnosed with human immunodeficiency virus (HIV), have been used to investigate complications related to HIV infection or to the alterations on body tissues associated with HIV treatment [1,2,3]. Regarding bone loss, it has been reported that children and adolescents diagnosed with HIV have a low bone mineral content (BMC) and bone mineral density (BMD) caused by an altered bone metabolism [4,5,6]. Despite the knowledge of the occurrence of low BMC and BMD in this population, the consequences and pathogenesis of these body tissue alterations are still unclear [5].
Dual energy X-ray absorptiometry (DXA), the most commonly used method to evaluate the BMC and BMD, is considered to be a precise technique to evaluate the body composition in children and adolescents, providing whole-body and regional estimates of the BMC, fat-free mass (FFM), and fat mass through the X-ray attenuation of the body tissues [7,8,9,10]. In spite of its usability, the body composition evaluation using DXA equipment are costly and not widely available or accessible in underdeveloped countries such as Brazil, this limiting the use of this method in clinical practice [10,11]. Therefore, reliable, easy-to-use, and non-invasive techniques, such as bioelectrical impedance analysis (BIA), have been developed and validated to investigate the body composition in children and adolescents due to their greater accessibility to clinical practice [7,9,12].
The BIA is based on the values of resistance and reactance that allow us to make an estimate the total body water (TBW) and FFM [7,12,13]. Those estimations are based on the assumption that 73% of the FFM is composed by water [7,12,13]. The BIA has been commonly used to evaluate the TBW, intracellular and extracellular body water, FFM, and fat mass using tetrapolar single-frequency equipment [9,13]. Recently, the BIA has also been used to estimate lean soft tissue mass (LSTM) and BMC by the division of the values of the FFM [9,12]. Despite the knowledge regarding the BIA usability to estimate the FFM, there is not any substantial information on the use of the BIA to access the BMC [9]. In a non-systematic review developed within this study, only two studies that investigated the BIA’s usability to estimate the BMC in children and adolescents were found [14,15].
Considering the need for BMC research in children and adolescents diagnosed with HIV and the lack of studies regarding the BIA’s usability to estimate the BMC, the present study aimed to develop equations to estimate the BMC by BIA using DXA as a reference method.
2. Materials and Methods
2.1. Study Design
The cross-sectional study was part of the ‘Saúde PositHIVa Study’, which was developed in the city of Florianópolis, Brazil. The study had the approval of the Ethics Committee in Research with Human Beings of the Universidade Federal de Santa Catarina (protocol No. 49691815.0.0000.0121).
2.2. Population and Sample
Children and adolescents aged 8–15 years, who were diagnosed with HIV by vertical transmission, who were in a clinical follow-up study at the Joana de Gusmão Children’s Hospital were recruited for the study.
The ideal sample size was calculated based on previous studies that evaluated the validity and reproducibility of the BIA [9], where the correlation coefficient (CC) was 0.59–0.98. For the present study, a CC of 0.59 was used. The ideal sample size was calculated using the software G*POWER, version 3.1.9.2 (Universität Düsseldorf, Düsseldorf, Germany) with the parameters of the effect size (5%), α (5%) and β (95%) [16]. To make up for the potential losses and refusals (subjects that did not attend data collection or that refused invitation, respectively), 30% extra of the recommended sample size was added, which added up to a total of 41 subjects (130% of the ideal sample size).
Eligibility Criteria
The subjects that met the following requirements were included in this study: (i) had these data presented in their medical record, a confirmation of HIV infection by vertical transmission, and the composition and duration of use of antiretroviral therapy (ART), viral load (HIV RNA), CD4+ lymphocytes cell count (TCD4); (ii) were currently taking part in a clinical follow-up study at the Joana de Gusmão Children’s Hospital, regardless of the therapy regimens.
The subjects that presented the following conditions during the data collection were excluded from this study: (i) the inability to stand or move; (ii) a full-speech and/or hearing impairment; (iii) the presence of diseases, unrelated to HIV, that changed their body composition, such as, paralysis, renal or hepatic insufficiency, hyper or hypothyroidism; (iv) an altered motor pattern or contraindication for physical activity, such as, advanced immunodeficiency in the presence of opportunistic infection, systemic arterial hypertension, type II diabetes mellitus, and high cardiovascular risk; (v) made continuous use of diuretic medication.
2.3. Study Variables
2.3.1. Body Composition Assessment
The BMC, FFM, LSTM, fat mass, and body fat percentage (%BF) were evaluated by the BIA and DXA. The following BIA preliminary measurements were also collected: total and right-side impedance and reactance at 50 kHz (measured frequency for most BIA equipment), TBW, and intra and extracellular body water estimates. The total impedance and reactance at 50 kHz were calculated using the sum of the values provided by the BIA equipment of the right and left limbs and trunk values. Additionally, the right-side impedance and reactance (50 kHz Impedance or Reactance) were calculated using the sum of the values provided by the BIA equipment of right leg (impedance or reactance), right arm (impedance or reactance) and trunk (impedance or reactance) [17].
The BIA procedures were conducted using BIA octapolar multi-frequency equipment (BIA8MF) InBody 720 (Biospace, Los Angeles, CA, United States), and daily Warm Up and internal calibrations were made to ensure quality control following manufacturer instructions [17]. The BIA procedure recommendations were: (i) do not eat or drink 3 h before the procedure; (ii) do not participate in moderate or vigorous physical activity within 12 h before the procedure; (iii) urinate less than 30 min before the procedure; (iv) do not consume alcohol within 48 h before the procedure; (v) do not take diuretic medications within 7 days before the procedure; (vi) wear light clothes for the procedure; (vii) be barefoot; (viii) do not wear any kind of metal adornments (earrings, rings, and belts) [12].
The DXA procedures were performed using GE Lunar Prodigy Advance equipment and encore 2004, version 8.10.027 (GE Lunar Corporation, Madison, WI, USA). To guarantee the internal quality control, daily calibrations were made with a standard block provided by the manufacturer [15]. The DXA procedures recommendations were: (i) wear light clothes; (ii) be barefoot; (iii) do not wear any kind of metal adornments [15].
2.3.2. Anthropometric Measurements
The body mass was measured using the digital scale of the BIA equipment. The height was measured using an stadiometer (AlturaExata, Belo Horizonte, Brazil). The body mass index (BMI) was calculated using the BMI = body mass/height2 equation.
2.3.3. Confounding Variables
Information about their age, sex, and skin color were obtained with interview questionnaire. Their skin color was self-determined and categorized based whether they were on White or Brown/Black. Their sexual maturation was determined by a self-assessment of the secondary sexual characteristics as defined by Tanner [18] after the participants were instructed by a researcher of the same sex about each stage. Their viral load (log), use and type of ART (with or without protease inhibitor), and TCD4 (cell mm−3) were obtained from the medical records. The TCD4 percentage (%TCD4) was calculated based upon the cell count as follows: >25% (>500 cell mm−3), 14–25% (200–499 cell mm−3), and <14% (<200 cell mm−3). The immunosuppression categories based on %TCD4 followed the Center for Disease Control parameters: category 0 (Stage 1), non-immunosuppressed—>25% CD4+; category 1 (Stage 2), moderate immunosuppression—15–25% CD4+; category 2 (Stage 3), severe immunosuppression—<15% CD4+ [19].
The Impedance Index was calculated using the following equations: Impedance Index = height²/impedance at 50 kHz (Impedance Index 50 kHz) and Impedance Index = height²/right-side impedance at 50 kHz (Right-side Impedance Index 50 kHz) [20].
2.4. Statistical Analysis
For the continuous variables, the subjects’ physical and biological characteristics were presented as the mean and standard deviation. For the categorical variables, the characteristics were presented as number of occurrences per group and percentage of the total occurrences.
The data distribution was evaluated by histograms and dot plots comparing the data from this study to a theoretical normal distribution, as recommended by Zuur et al. [21].
To investigate the differences between the males and females, t-tests for independent samples were conducted for each of the variables measured. Pearson and Spearman correlation tests were performed to investigate the independent variables with the potential to estimate the DXA BMC. The linearity of these correlations were assessed through graphical analyses.
To estimate the DXA BMC, linear regression models were constructed through a backward selection procedure, and the variables with p ≥ 0.05 were removed in decreasing order until the final model (higher adjusted R² value and/or lower root mean square error of the estimate) was achieved. To investigate whether the adjustments at different stages of the BIA estimates resulted in better BMC estimates, three sets of models were constructed: (1) based on the BIA BMC estimate (to provide an adjustment to the BIA equipment); (2) based on the assessment of the total body composition (to investigate the appropriate equation for BIA8MF); (3) based on body composition assessment by a half-body evaluation (to investigate the equation suitable for BIA8MF and tetrapolar equipment).
The final models were evaluated for their standard error of estimate (SEE), residual analysis, multicollinearity, Akaike’s Inflation Criteria, Bayesian Information Criterion, tolerance, and Variance Inflation Factor. The Bland–Altman method was used to assess the dispersion of residuals, and the Breusch–Pagan/Cook–Weisberg test was used to evaluate heteroscedasticity of the residuals. To examine the internal validity of the proposed models, bootstrap validations (5000 bootstrap samples) were performed.
To confirm the correlation between the models of this study and the DXA BMC values, the CC proposed by Lin (Rho) was calculated. The clinical acceptability of the models was evaluated by considering Rho values ≥ 0.90 as clinically acceptable, and values < 0.90 were considered to be clinically unacceptable [15]. To further investigate the average differences between the BMC as estimated by models and DXA values, paired t-tests were used. All of the statistical analyses were performed using the STATA 11.0 (Stata Corporation, College Station, TX, USA) software package.
3. Results
A total of 64 children and adolescents, aged from eight to fifteen years (12.22 ± 2.13) who were diagnosed with HIV participated of the study (35 females and 29 males). Of these, 28 of them were White, and 36 of them were Brown/Black, with a prevalence of Brown/Black subjects among the females (24 females and 12 males). Fifteen subjects were in stage one of sexual maturation, nineteen subjects in stage two, nineteen subjects were in stage three, eight subjects were in stage four, and three subjects were in stage five. Comparatively, the females presented higher FM and BF% values than the males did (8.46 kg/5.03 kg; 19.86%/12.95%, respectively) (Table 1).

Table 1.
Study subjects physical and biological characteristics.
Regarding the clinical characteristics, 38 subjects received ART with protease inhibitors, 15 received ART without protease inhibitors, and 11 did not receive ART. The majority of the subjects (n = 44) had an undetectable viral load. Based on TCD4+ percentage, forty-eight subjects had no virus suppression (>25% TCD4+), twelve of them presented moderate virus suppression (15–24% TCD4+), and four of them had severe virus suppression (<15% TCD4+).
Due to the absence of significant differences between the sexes regarding the BMC, the females and males were pooled for a subsequent correlation and linear multiple regression. Their body mass, BIA BMC, BIA FFM, BIA LSTM, TBW, intracellular body water, and extracellular body water were the most correlated variables with the DXA BMC (CC: 0.892–0.935) (Table 2). To avoid collinearity, highly correlated (r ≥ 0.75) variables were not included in the same model (the correlation matrix for study variables can be found at Table 3a,b).
Table 2.
Subjects characteristics and dual energy X-ray absorptiometry (DXA) bone mass content (BMC) correlation.
Table 3.
Correlation matrix for study variables (Spearman correlation test).
Table 4 and Table 5 describe the best three sets of linear multiple regressions developed to estimate the DXA BMC. Model 1, representative of the first set of models, was constructed based on the BIA BMC estimates. and it explained 82% of the DXA BMC (SEE of 0.023 kg). The construction of the second set of models, which included Models 2, 3A and 4A, was based on the total body BIA evaluation (adequate to data from BIA8MF) as well as the subjects’ physical and clinical characteristics. Model 2 explained 89% of the DXA BMC (SEE of 0.013 kg), and it comprised the following variables: BIA BMC, BMI, Total 50 kHz, TCD4 lymphocytes, ART type, and %TCD4 lymphocytes. Model 3A explained 90% of the DXA BMC (SEE of 0.012 kg), and it included: extracellular body water, BMI, Total 50 kHz Reactance, %BF BIA, TCD4 lymphocytes, ART type, and %TCD4 lymphocytes. Model 4A explained 91% of the DXA BMC (SEE of 0.011 kg), and it included the following variables: BIA Body mass, BIA FM, Total 50 kHz Reactance, TCD4 lymphocytes, ART type, and %TCD4 lymphocytes. For the third set of models, which included Models 3B and 4B, the half-body BIA evaluation (adequate to data from both BIA8MF and tetrapolar equipment) as well as the subjects’ physical and clinical characteristics were used. Model 3B explained 90% of the DXA BMC (SEE of 0.012 kg), and it was based on: extracellular body water, BMI, Right-side 50 kHz Reactance, %BF BIA, TCD4 lymphocytes, ART type, and %TCD4 lymphocytes. Model 4B explained 90% of the DXA BMC (SEE of 0.012 kg), and it included: BIA Body mass, BIA Fat mass, Right-side 50 kHz Reactance, TCD4 lymphocytes, Categorized TCD4 lymphocytes, ART type, and Sex.
Table 4.
Three sets of linear multiple regression to predicted BMC in children and adolescents diagnosed with human immunodeficiency virus (HIV).
Table 5.
Correlation analysis of bone mass content (BMC) dual energy X-ray absorptiometry (DXA) and predictive models in children and adolescents diagnosed with human immunodeficiency virus.
The six models were substantially correlated with the DXA BMC values (Rho: 0.90 to 0.96), and there was no difference between the DXA BMC and the BMC values as estimated by the models (p > 0.5) (Table 5). Figure 1 shows the linearity of the DXA BMC and the values estimated with the models. A random residual distribution was found in all of the models (model 1: x2 = 1.66, p = 0.19815; model 2: x2 = 0.84, p = 0.43502; model 3A: x2 = 0.76, p = 0.46982; model 3B: x2 = 0.78, p = 0.46452; model 4A: x2 = 0.71, p = 0.49637; model 4B: x2 = 0.79, p = 0.45952) (Figure 2). The internal validation of all of the selected models through bootstrap sampling (n = 5000) resulted in the following R2 values: Model 1—0.82; model 2—0.89; model 3A—0.90; model 3B—0.90; model 4A—0.91; model 4B—0.90. Additional models were built based on FFM, TBW, and ICBW estimates to investigate whether the adjustments in the different stages of the BIA estimates resulted in better parameters. These models did not provided values for Rho, as well SEE and others parameters, and they were superior to the previously described models (Rho: 0.95, SSE: 0.012).
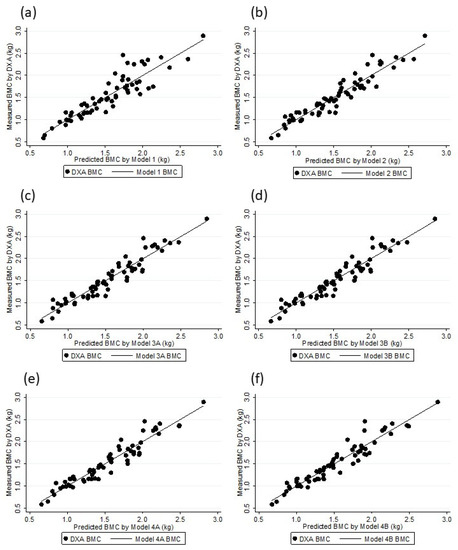
Figure 1.
DXA BMC and Models BMC association: Model 1 (a), Model 2 (b), Model 3A (c), Model 3B (d), Model 4A (e), and Model 4B (f).
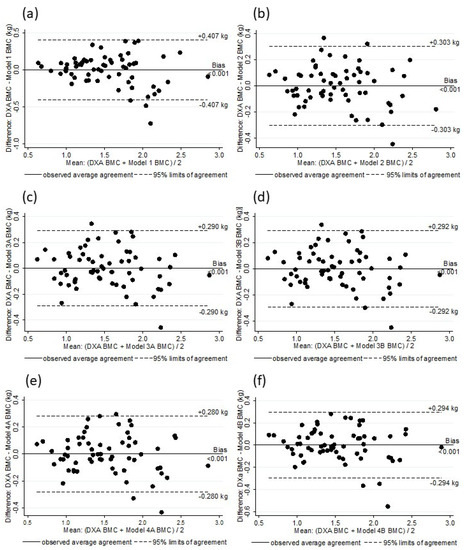
Figure 2.
Analysis of residual scores of DXA BMC and BMC estimated by Model 1 (a), Model 2 (b), Model 3A (c), Model 3B (d), Model 4A (e), and Model 4B (f).
4. Discussion
The main finding of this study was the usability of BIA8MF to estimate the BMC with 82.1% to 90.7% of the DXA BMC explanation (with adjustments on the BIA BMC measurement or by using BIA parameters and/or subjects physical and biological characteristics). The previous studies that investigated the BIA’s usability to estimate the BMC in adults had inconsistent conclusions, showing agreement [11] and disagreement [22,23,24,25,26] between the BIA estimates and values measured by DXA or inconclusive results [27]. That inconsistency between the studies that investigated the BIA’s usability to estimate the body composition was previously shown at systematic reviews, and it was attributed to the use of different types of BIA (BIA8MF or tetrapolar (single or multi frequency)) and an intention to simultaneously validate the method and develop equations and the quality of the research [9,13].
Regarding the BIA’s usability to evaluate the BMC in children and adolescents, only two articles that investigated this association were found (non-systematic review data) [14,15]. The results from de Castro et al. [15] were obtained from the same sample of the present study, and they showed that the BIA equipment internal equation was not suitable to estimate the DXA BMC (estimating 77.5% and 74.4% of DXA BMC with a standard error of 0.035 and 0.038 kg for females and males, respectively). The BIA BMC estimation is obtained by the division of the BIA FFM in the LSTM and the BMC, and while FFM and LSTM values were in agreement with those measured by DXA, the equipment internal equation showed in inability to accurately estimate the BMC [15,17]. Lee et al. [14] developed equations to estimate the BMC in children and adolescents without an HIV infection diagnosis using BIA parameters and/or the subjects’ physical and biological characteristics which were able to estimate 88.6% to 93.2% of the DXA BMC (data regarding SEE were not showed). Those results agreed with the present study that found that the BIA was useful to estimate the DXA BMC also with adjustments to the BIA parameters and/or the inclusion of the subjects’ physical and biological characteristics, showing that the equations were able to estimate 82.1% to 90.7% of the DXA BMC (SEE from 0.023 to 0.011 kg, respectively). However, the assumption of the BIA’s usability to estimate the BMC in children and adolescents, based solely on the results discussed above, should be made cautiously, considering the limited number of studies on the matter, and the fact that Lee et al. [14] did not show information regarding the SEE and internal or external validation of the developed equations.
The BIA body composition estimates starts with the measurements of the resistance and reactance, which are followed by impedance, to estimate the TBW and then, the FFM values [7,12,13]. Based on those results, the FM is obtained by the subtraction of the FFM values from the total body mass, and the LSTM and BMC are obtained by the division of the FFM based on an equipment internal equation [12,13,17]. The different sets of models of this study considered the estimation process of the BIA, described above, and they were made with the purpose to investigate whether the adjustments in different moments of the BIA estimation process can result in a better BMC estimate.
The results showed the improvement of the BMC estimate by the BIA with distinct adjustments: 82.1% of the DXA BMC was explained with an adjustment in the internal equation, but this was 89.9% when the model was based on the body water estimate and the subjects’ physical and biological characteristics, and it was 90.7% when the model was based on the body mass and the subjects’ physical and biological characteristics. Those results confirm the hypothesis that adjustments using the BIA measurements (resistance, reactance and/or impedance) and/or the initial BIA estimates (as TBW) can produce better results than using the BMC estimate provided by the equipment internal equation. At the same time, the results contradicted the findings of Lee et al. [14], where the authors concluded that the BIA parameters were not able to produce better BMC estimates than the simple indices could (body mass and height, or age and height). However, such conclusions were drawn based on models generated with potentially highly correlated variables such as body mass, height, and age without presenting the correlation values, thus hindering further analysis to avoid the risk of overfitting in those models. The improvement on the BIA BMC estimates using the BIA measurements and the subjects’ physical and biological characteristics (as HIV infection parameters) found in this study can be related to the variation of the FFM hydration over the years, decreasing from birth (when approximately 80.6% of the FFM is composed of water), reaching 75.1% and 76.9% at 10 years of age (for boys and for girls, respectively) [28]. Additionally, specific to the population that was studied, the chronic exposure to HIV ART may result in tissue dehydration [7,12].
Previous studies that investigated the BIA’s usability, suggested that multi frequency equipment can produce better BMC estimates when compared to a half-body analysis with single frequency (50 kHz) equipment [7,9,12]. Based on that, the third set of models was generated with the purpose of investigating whether the BIA total body analysis using multi frequency equipment was able to produce a better BMC estimate than the half body analysis using single frequency (50 kHz) equipment could. The similar results obtained by models 3B and 4B compared to those of models 2, 3A and 4A did not support this hypothesis. However, based on the assumption that a total body analysis using multi frequency equipment does not produce better results than a half analysis does using single frequency (50 kHz) equipment, we need to consider that the results from this study were obtained from a simulation and not directly from single frequency equipment. Models 3B and 4B were generated as options to the researchers who wanted to investigate the BMC estimate by the BIA with a half-body analysis using single frequency (50 kHz) equipment.
The interpretation and applicability of the results from this study should consider the following limitations: (a) the use of only one reference method, (b) the construction of half-body equations using BIA8MF, and (c) the lack of access to the equipment equations to the measure the mineral content and estimate the BMC. The use of multiple reference methods can be an useful strategy, considering that the methods have distinct accuracy and limitations to evaluate the body composition components [9,12,29]. The selection of DXA as a reference method was based on the credibility of the technic as the standard reference method to evaluate the BMC [7,8,12] and its frequent usage in BIA validation studies [9]. In addition, BIA BIA8MF and tetrapolar equipment produce total and half-body estimates, respectively [12]. For this study, BIA8MF was used to provide results simulating single-frequency tetrapolar equipment. This simulation can result in future interpretation errors, and these should be investigated in future studies. BIA multifrequency equipment estimates the mineral content, and it usually provide this value as the BMC, however, the manufacture did not provide access to the equipment equations to researchers, limiting the knowledge about which independents variables already were used to estimate the mineral and BMC, and consequently, this could have resulted in the overfitting of the models. Despite its limitations, the study greatly contributes to the knowledge regarding the BIA’s usability to investigate the BMC in the pediatric population diagnosed with HIV, presenting models with a high coefficient correlation value and low standard errors.
5. Conclusions
In conclusion, the three sets of models constructed to estimate the DXA BMC using BIA estimates, as well as the subjects’ physical and clinical characteristics, showed acceptable clinical correlation and low SEE values. Models 1 and 2 present adjustments for the BMC investigation using the BIA equipment that provided the estimated BMC values. Model 1 presents a simple adjustment for the investigation of the BMC only using the BMC value estimated by the BIA equipment, which is more suitable for the studies that only aim at monitoring the BMC in children and adolescents diagnosed with HIV infection. However, Model 2’s adjustments resulted in better parameters. Thus, this model was the most suitable one for the studies that aim to investigate the healthy levels of BMC using BIA equipment which provide estimated BMC values. Models 3B and 4A present adjustments for investigating the BMC using BIA equipment that does not provide estimated BMC values, as well as tetrapolar equipment. Model 3B presents adjustments for the investigation of the BMC through half-body estimates (right-side), which is more suitable for the studies that aim to investigate the BMC in children and adolescents diagnosed with HIV infection using tetrapolar equipment. Model 4A showed the highest correlation result and the lowest SEE value compared to the other models, providing the best adjustment to estimate the BMC by BIA. Thus, among all of the models, this was the most appropriate model for investigating the BMC in children and adolescents diagnosed with HIV infection. Through these findings, the present study demonstrated a new approach and the suitability of an easy-to-use technique to estimate the BMC in children and adolescents diagnosed with HIV.
Author Contributions
Conceptualization, J.A.C.d.C., L.R.A.d.L. and D.A.S.S.; methodology, J.A.C.d.C., L.R.A.d.L. and D.A.S.S.; formal analysis, J.A.C.d.C., L.R.A.d.L. and D.A.S.S.; investigation, J.A.C.d.C., L.R.A.d.L. and D.A.S.S.; resources, J.A.C.d.C., L.R.A.d.L. and D.A.S.S.; data curation, J.A.C.d.C., L.R.A.d.L. and D.A.S.S.; writing—original draft preparation, J.A.C.d.C., L.R.A.d.L. and D.A.S.S.; writing—review and editing, J.A.C.d.C., L.R.A.d.L. and D.A.S.S.; visualization, J.A.C.d.C., L.R.A.d.L. and D.A.S.S.; supervision, D.A.S.S.; project administration, L.R.A.d.L. and D.A.S.S. All authors have read and agreed to the published version of the manuscript.
Funding
D.A.S.S. was fnanced in part by the Coordenação de Aperfeiçoamento de Pessoal de Nível Superior (CAPES)—Brazil—Finance Code 001, and D.A.S.S. is supported in part by Conselho Nacional de Desenvolvimento Científico e Tecnológico (CNPq)—Brazil—nº 309589/2021-5.
Institutional Review Board Statement
The study had the approval of the local Ethics Committee in Research with Human Beings of the Federal University of Santa Catarina (protocol No. 49691815.0.0000.0121).
Informed Consent Statement
Informed consent was obtained from all subjects involved in the study.
Data Availability Statement
Not applicable.
Conflicts of Interest
The authors declare no conflict of interest.
Abbreviations
ART: antiretroviral therapy; BIA: bioelectrical impedance analysis; BIA8MF: BIA octapolar multi-frequency equipment; BMC: bone mineral content; BMD: bone mineral density; BMI: Body mass index (BMI = body mass/height2); CC: correlation coefficient; DXA: dual energy X-ray absorptiometry; FFM: fat-free mas; HIV: human immunodeficiency virus; LSTM: lean soft tissue mass; Rho: CC proposed by Lin; SEE: standard error of estimate; TCD4: CD4+ lymphocytes cell count; TWB: total body water; %BF: body fat percentage; %TCD4: TCD4 percentage (>25% [>500 cell mm−3], 14–25% [200–499 cell mm−3], <14% [<200 cell mm−3]; 50 kHz Impedance: right-side impedance (50 kHz Impedance = right leg impedance + right arm impedance + trunk impedance); 50 kHz Reactance: right-side reactance (50 kHz Reactance = right leg reactance + right arm reactance + trunk reactance).
References
- Sudjaritruk, T.; Bunupuradah, T.; Aurpibul, L.; Kanjanavanit, S.; Chotecharoentanan, T.; Sricharoen, N.; Ounchanum, P.; Suntarattiwong, P.; Pornpaisalsakul, K.; Puthanakit, T.; et al. Impact of Vitamin D and Calcium Supplementation on Bone Mineral Density and Bone Metabolism Among Thai Adolescents With Perinatally Acquired Human Immunodeficiency Virus (HIV) Infection: A Randomized Clinical Trial. Clin. Infect. Dis. Off. Publ. Infect. Dis. Soc. Am. 2021, 73, 1555–1564. [Google Scholar] [CrossRef] [PubMed]
- Pornpaisalsakul, K.; Songtaweesin, W.N.; Tepmongkol, S.; Wongharn, P.; Kawichai, S.; Suponsilchai, V.; Anugulruengkitt, S.; Puthanakit, T. Effects of Vitamin D and Calcium Supplementation on Bone Mineral Density among Thai Youth Using Daily HIV Pre-Exposure Prophylaxis. J. Int. AIDS Soc. 2020, 23, e25624. [Google Scholar] [CrossRef] [PubMed]
- Mahtab, S.; Scott, C.; Asafu-Agyei, N.A.A.; Machemedze, T.; Frigati, L.; Myer, L.; Zar, H.J. Prevalence and Predictors of Bone Health among Perinatally HIV-Infected Adolescents. AIDS Lond. Engl. 2020, 34, 2061–2070. [Google Scholar] [CrossRef]
- DiMeglio, L.A.; Wang, J.; Siberry, G.K.; Miller, T.L.; Geffner, M.E.; Hazra, R.; Borkowsky, W.; Chen, J.S.; Dooley, L.; Patel, K.; et al. Bone Mineral Density in Children and Adolescents with Perinatal HIV Infection. AIDS 2013, 27, 211–220. [Google Scholar] [CrossRef]
- Hazra, R.; Siberry, G.K.; Mofenson, L.M. Growing up with HIV: Children, Adolescents, and Young Adults with Perinatally Acquired HIV Infection. Annu. Rev. Med. 2010, 61, 169–185. [Google Scholar] [CrossRef]
- de Lima, L.R.A.; da Silva, R.C.R.; Giuliano, I.d.C.B.; Sakuno, T.; Brincas, S.M.; de Carvalho, A.P. Bone mass in children and adolescents infected with human immunodeficiency virus Massa óssea em crianças e adolescentes que vivem com vírus da imunodeficiência humana. J. Pediatr. (Rio J.) 2013, 89, 91–99. [Google Scholar] [CrossRef] [PubMed][Green Version]
- Lohman, T.G.; Hingle, M.; Going, S.B. Body Composition in Children. Pediatr. Exerc. Sci. 2013, 25, 573–590. [Google Scholar] [CrossRef] [PubMed]
- Lee, S.Y.; Gallagher, D. Assessment Methods in Human Body Composition. Curr. Opin. Clin. Nutr. Metab. Care 2008, 11, 566–572. [Google Scholar] [CrossRef]
- de Castro, J.A.C.; Lima, T.R.; Silva, D.A.S. Body Composition Estimation in Children and Adolescents by Bioelectrical Impedance Analysis: A Systematic Review. J. Bodyw. Mov. Ther. 2018, 22, 134–146. [Google Scholar] [CrossRef]
- Wells, J.C.K. Validity of Methods Used for the Assessment of Body Components in Children: Pros and Cons of Modern versus Old Technology. Horm. Res. 2006, 66, 58–64. [Google Scholar] [CrossRef]
- Patil, B.R.; Patkar, D.P.; Mandlik, S.A.; Kuswarkar, M.M.; Jindal, G.D. Estimation of Bone Mineral Content from Bioelectrical Impedance Analysis in Indian Adults Aged 23–81 Years: A Comparison with Dual Energy X-Ray Absorptiometry. Int. J. Biomed. Eng. Technol. 2012, 8, 99–114. [Google Scholar] [CrossRef]
- Kyle, U.G.; Earthman, C.P.; Pichard, C.; Coss-Bu, J.A. Body Composition during Growth in Children: Limitations and Perspectives of Bioelectrical Impedance Analysis. Eur. J. Clin. Nutr. 2015, 69, 1298–1305. [Google Scholar] [CrossRef] [PubMed]
- Talma, H.; Chinapaw, M.J.; Bakker, B.; HiraSing, R.A.; Terwee, C.B.; Altenburg, T.M. Bioelectrical Impedance Analysis to Estimate Body Composition in Children and Adolescents: A Systematic Review and Evidence Appraisal of Validity, Responsiveness, Reliability and Measurement Error. Obes. Rev. 2013, 14, 895–905. [Google Scholar] [CrossRef] [PubMed]
- Lee, L.W.; Liao, Y.S.; Lu, H.K.; Hsieh, K.C.; Chi, C.C. Performance of Bioelectrical Impedance Analysis in the Estimation of Bone Mineral Content in Healthy Children Aged 6–12 Years. J. Clin. Densitom. 2019, 3, 411–417. [Google Scholar] [CrossRef]
- de Castro, J.A.C.; de Lima, L.R.A.; Silva, D.A.S. Accuracy of Octa-Polar Bioelectrical Impedance Analysis for the Assessment of Total and Appendicular Body Composition in Children and Adolescents with HIV: Comparison with Dual Energy X-Ray Absorptiometry and Air Displacement Plethysmography. J. Hum. Nutr. Diet. 2018, 31, 276–285. [Google Scholar] [CrossRef]
- Faul, F.; Erdfelder, E.; Lang, A.G.; Buchner, A. G*Power 3: A flexible statistical power analysis program for the social, behavioral, and biomedical sciences. Behav. Res. Methods 2007, 39, 175–191. [Google Scholar] [CrossRef] [PubMed]
- Biospace, B.C.L. Inbody 720 the Precision Body Composition Analyser; Biospace: Seoul, Republic of Korea, 2004. [Google Scholar]
- Tanner, J.M. Growth at Adolescence, 2nd ed.; Blackwell Scientific Publications: Oxford, UK, 1962. [Google Scholar]
- Selik, R.M.; Mokotoff, E.D.; Branson, B.; Owen, S.M.; Whitmore, S.; Hall, H.I. Revised Surveillance Case Definition for HIV Infection—United States, 2014. Morb. Mortal. Wkly. Rep. Recomm. Rep. 2014, 63, 1–10. [Google Scholar]
- Kushner, R.; Schoeller, D.A.; Fjeld, C.R.; Danford, L. Is the Impedance Index (Ht2/R) Significant in Predicting Total Body Water? Am. J. Clin. Nutr. 1992, 56, 835–839. [Google Scholar] [CrossRef]
- Zuur, A.F.; Ieno, E.N.; Elphick, C.S. A Protocol for Data Exploration to Avoid Common Statistical Problems. Methods Ecol. Evol. 2010, 1, 3–14. [Google Scholar] [CrossRef]
- Cvetko, E.D.; Drenjančević, I.; Nešić, N.; Ahić, J.M. Possibilities of Use Bioelectrical Impedance Analysis as Measuring Technique in Prevention of Osteoporosis. Period. Biol. 2014, 116, 65–70. [Google Scholar]
- LaForgia, J.; Gunn, S.; Withers, R.T. Body Composition: Validity of Segmental Bioelectrical Impedance Analysis. Asia Pac. J. Clin. Nutr. 2008, 17, 586–591. [Google Scholar] [PubMed]
- Liao, Y.S.; Li, H.C.; Lu, H.K.; Lai, C.L.; Wang, Y.S.; Hsieh, K.C. Comparison of Bioelectrical Impedance Analysis and Dual Energy X-Ray Absorptiometry for Total and Segmental Bone Mineral Content with a Three-Compartment Model. Int. J. Environ. Res. Public Health 2020, 17, 2595. [Google Scholar] [CrossRef] [PubMed]
- Miyatake, N.; Tanakai, A.; Eguchi, M.; Miyachi, M.; Tabata, I.; Numata, T. Reference Data of Multi Frequencies Bioelectric Impedance Method in Japanese. Anti-Aging Med. 2009, 6, 10–14. [Google Scholar] [CrossRef][Green Version]
- Stone, T.M.; Wingo, J.E.; Nickerson, B.S.; Esco, M.R. Comparison of Bioelectrical Impedance Analysis and Dual-Energy X-Ray Absorptiometry for Estimating Bone Mineral Content. Int. J. Sport Nutr. Exerc. Metab. 2018, 28, 542–546. [Google Scholar] [CrossRef]
- Macfarlane, D.J.; Chan, N.T.; Tse, M.A.; Joe, G.M. Agreement between Bioelectrical Impedance and Dual Energy X-Ray Absorptiometry in Assessing Fat, Lean and Bone Mass Changes in Adults after a Lifestyle Intervention. J. Sports Sci. 2016, 34, 1176–1181. [Google Scholar] [CrossRef][Green Version]
- Fomon, S.J.; Haschke, F.; Ziegler, E.E.; Nelson, S.E. Body Composition of Reference Children from Birth to Age 10 Years. Am. J. Clin. Nutr. 1982, 35, 1169–1175. [Google Scholar] [CrossRef] [PubMed]
- Fields, D.A.; Goran, M.I. Body Composition Techniques and the Four-Compartment Model in Children. J. Appl. Physiol. 1985 2000, 89, 613–620. [Google Scholar] [CrossRef] [PubMed]


Publisher’s Note: MDPI stays neutral with regard to jurisdictional claims in published maps and institutional affiliations. |
© 2022 by the authors. Licensee MDPI, Basel, Switzerland. This article is an open access article distributed under the terms and conditions of the Creative Commons Attribution (CC BY) license (https://creativecommons.org/licenses/by/4.0/).