Article

Effects of Cement Treatment on Mechanical Properties and Microstructure of a Granite Residual Soil

1
MOE Key Laboratory for Resilient Infrastructures of Coastal Cities, College of Civil and Transportation Engineering, Shenzhen University, Shenzhen 518060, China
2
School of Civil Engineering and Architecture, East China Jiao Tong University, Nanchang 330013, China
*
Author to whom correspondence should be addressed.
Appl. Sci. 2022, 12(24), 12549; https://doi.org/10.3390/app122412549
Submission received: 11 November 2022 / Revised: 5 December 2022 / Accepted: 6 December 2022 / Published: 7 December 2022
(This article belongs to the Special Issue Mechanical Properties and Engineering Applications of Special Soils)

Abstract

:
A proper treatment of granite residual soil (GRS) in geotechnical practices requires both macro and microscopic evaluations. In this study, uniaxial and oedometric compression tests were conducted to investigate the mechanical properties of the saturated untreated and cement-treated GRS. Meanwhile, XRD, SEM, and MIP tests were conducted to identify the presence and types of C–S–H and the changes in the pore structure after cement treatment. The effects of cement treatment on the uniaxial compressive strength, secant modulus, compressibility, and vertical yielding pressure were revealed and the mechanisms of the soil structure to be modified through cement treatment were clarified based on the test results. A threshold volumetric cement content of 2–3% was determined based on the mechanical properties and microstructural characteristics of the saturated cement-treated GRS. Cement contents below this threshold would produce inadequate cementation between the soil particles. In contrast, cement contents above this threshold are considered inefficient because the transformation of the soil structure from single-porosity to dual-porosity increases the total porosity and retards the strength and stiffness gains.

1. Introduction

Granite residual soil (GRS), one of the most commonly encountered soils in the tropics and subtropics, is often gap-graded and characterized by bimodal grain-size distribution curves from clay to gravel. For example, the GRS widely distributed in Shenzhen, China, is usually dominated by clay and coarse-sand particles whereas the fine- and medium-sand particles are found in very small amounts [1]. Due to its poorly graded nature, the GRS is difficult to compact similar to a clayey soil and disintegrate quickly after being soaked under free conditions similar to a sandy soil. Considering the distinct heterogeneity in its soil structure, GRS is treated as special soil in geotechnical engineering that needs to be dealt with carefully.
Cement treatment can improve the geotechnical performance of soil materials with small dosages of cement and allows for an immediate strength gain compared to lime and fly-ash treatment [2]. Therefore, it has been widely used in geotechnical practices such as embankment construction and ground improvement [3,4,5]. The mechanisms of cement treatment to improve soil properties include the occupation of large pores and a binding of the soil particles by the hydration products (i.e., C–(A)–S–H gel) of the cement component to form a denser and/or cemented soil structure [2,6]. The efficiency of cement treatment depends on the soil and cement types, cement content, and the treating technology [7,8,9]. In general, to achieve the same engineering indices, higher cement contents are required for clayey soils than for sandy soils. For a given geotechnical context and soil type, a proper cement dosage is important to meet the engineering requirements.
The effectiveness of cement treatment is judged primarily by the physicochemical and mechanical properties of the soil–cement mixtures. A review of past investigations showed that cement contents higher than 10% (on a dry-weight basis) are usually required for clayey soils to achieve satisfying engineering indices; in this case, higher cement contents produced lower consistency limits and a higher strength and stiffness of the treated soils [3,10,11]. For sandy soils, cement contents lower than 10% (on a dry-weight basis) are often adopted; in this case, higher cement contents yielded lower optimum water contents and maximum dry densities but higher strengths and stiffnesses of the treated soils [12,13,14]. As GRS is usually classified as silty sand or clayey sand (which is between sand and clay), the dosages for cement treatment and the physicomechanical properties of the treated soil are expected to vary with the mineralogy and grain compositions of the original soil. Nevertheless, the cement-treated GRS exhibits a higher compaction efficiency and durability than the original soil [15,16], and cement contents of around 5% (on a dry-weight basis) are preferred or suggested in the context of highway and high-speed railway embankment construction [17,18].
Apart from the mechanical characteristics, attention was paid to the alterations in the mineralogy and microstructure of soils following cement treatment. These efforts were mainly performed based on X-ray diffraction (XRD), scanning electron microscope (SEM), and mercury-intrusion porosimetry (MIP) tests. The presence of C–(A)–S–H can be identified from XRD patterns, Raman spectra, and thermogravimetry (TG) curves, and its morphology can be observed from SEM images. The C–(A)–S–H was observed to be fibrous at a very low cement content [19,20]. As the cement content increased, the C–(A)–S–H fibers became shorter and eventually reticular [21,22,23]. In addition to the cementation from C–(A)–S–H, changes in the pore structure (especially the pore size distribution, PSD) affect the mechanical properties of the treated soils and a few investigations were performed based on MIP tests. For sandy soils with single-porosity, an overall reduction in the pore size was revealed as the water–cement ratio increased [24,25]. For clayey soils with dual-porosity, a reduction in the intra-aggregate pores and an increase in the inter-aggregate pores were revealed as the cement content increased [23,26]. It can be inferred that changes in the pore structure with the cement content depend on the clay content of the origin soil. In the case of high clay content, an increase in the cement content may not produce an increase in the strength and stiffness of the treated soil because of the increase in the large pores [23]. Hence, a proper treatment of soils requires both macro- and micro-scopic evaluations.
This study investigates the mechanical properties and microstructure of a GRS treated with Portland fly-ash cement. The effects of cement treatment on the strength and stiffness of the treated soil are discussed based on the results of uniaxial and oedometric compression tests. Prediction formulas for the uniaxial compressive strength and secant modulus incorporating the porosity after curing, cement content, and curing time are also established. The presence and types of C–S–H and the changes in the pore structure following cement treatment are identified using XRD, SEM, and MIP tests. The effects of the pore structure change on the mechanical properties of the treated soil are discussed, and an appropriate cement dosage for treating the GRS is suggested based on mechanical and microstructural characteristics of the treated soil.

2. Experimental Procedures

2.1. Materials

The GRS used in this study is obtained from Shenzhen, Guangdong Province, China. The bulk GRS is air-dried and pulverized carefully using a rubber hammer to avoid breakage of the sand particles. The grain size distribution (GSD) of the air-dried GRS is measured by dry-sieving (after washing) in combination with the Hydrometer method [27]. The overall GSD curve of the GRS is shown in Figure 1; it is observed to be a gap-graded soil dominated by 40% fine particles (d < 0.075 mm) and 25% coarse particles (d > 2 mm) on a dry-weight basis. Sand particles coarser than 5 mm account for no more than 1%; for convenience, they are eliminated from the original soil in the following test procedures. The specific gravity of the fractions finer than 5 mm is measured using the Pycnometric method [28]. The consistency limits of the fractions finer than 0.5 mm are determined using a liquid-plastic limit combined tester [29]. A bimodal compaction curve is revealed by the standard Proctor test [30] (see Figure 2); this may be due to the GRS’s gap-graded nature. The optimum water content and maximum dry density are identified at the second peak of the compaction curve. The basic physical properties of the GRS are summarized in Table 1. According to the Unified Soil Classification System [31], the GRS is classified as silty sand.
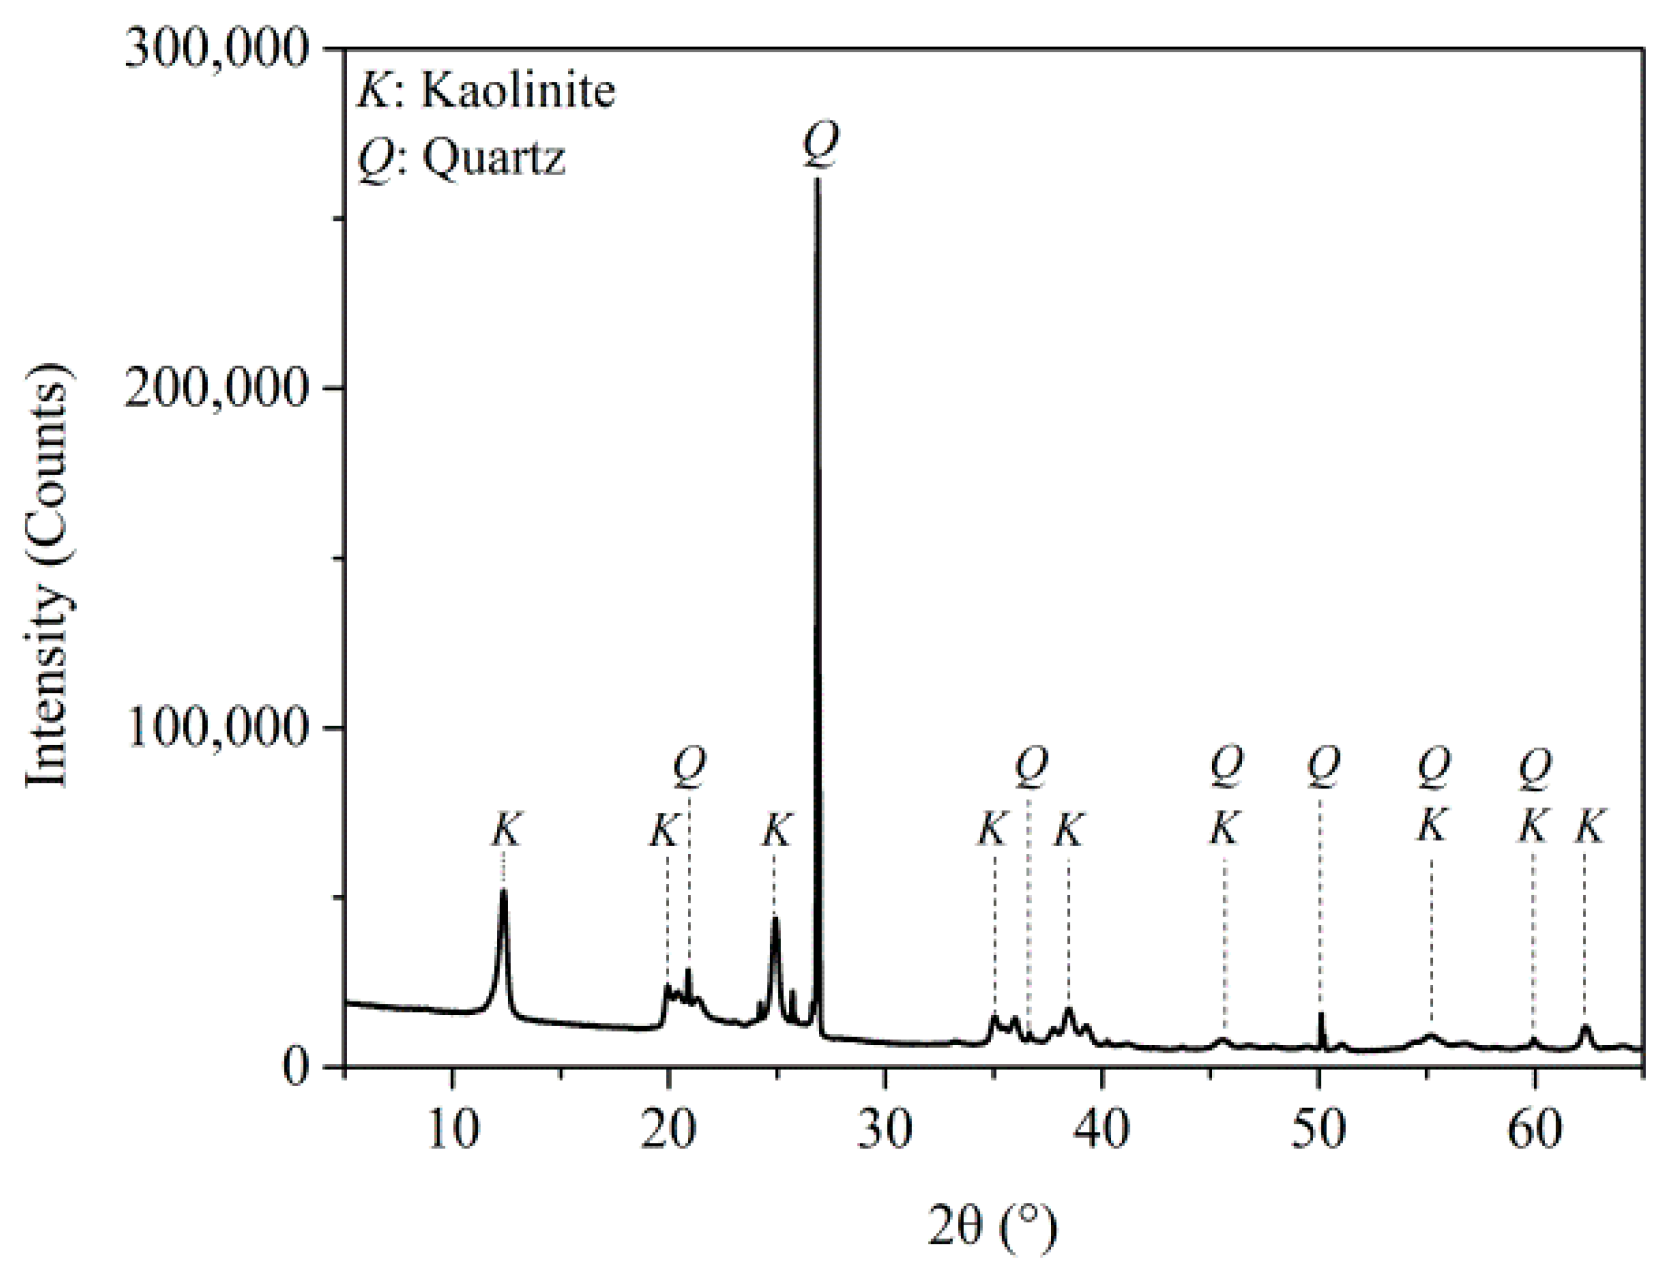
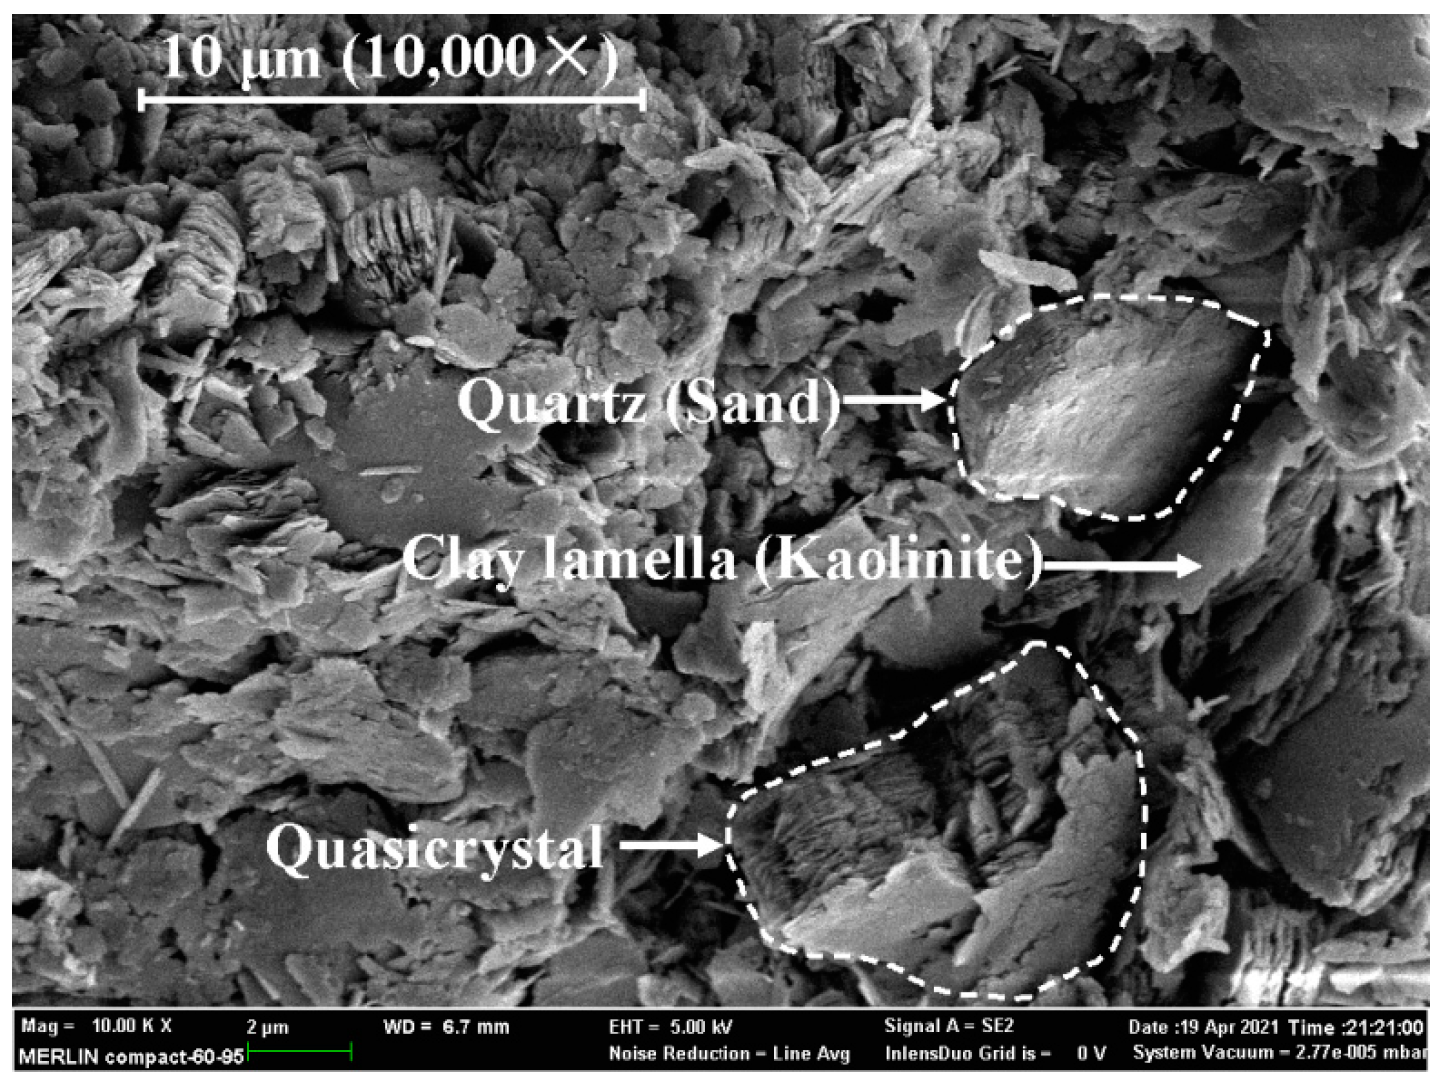
The XRD profile of the GRS with a grain size finer than 0.5 mm is shown in Figure 3, and the basic minerals are identified as Kaolinite (90%) and Quartz (10%) on a dry-weight basis. A SEM image of the GRS with a grain size finer than 0.5 mm is shown in Figure 4. The clay lamella of Kaolinite and its stacks (i.e., quasicrystal) are vivid in the SEM image, and the irregular quartz is wrapped in the clay lamellae. Despite the high clay content, clay aggregates (i.e., stacks of quasicrystals) are not recognized from SEM image, indicating a single-porosity structure of GRS compared to the dual-porosity structure of clays [32,33].
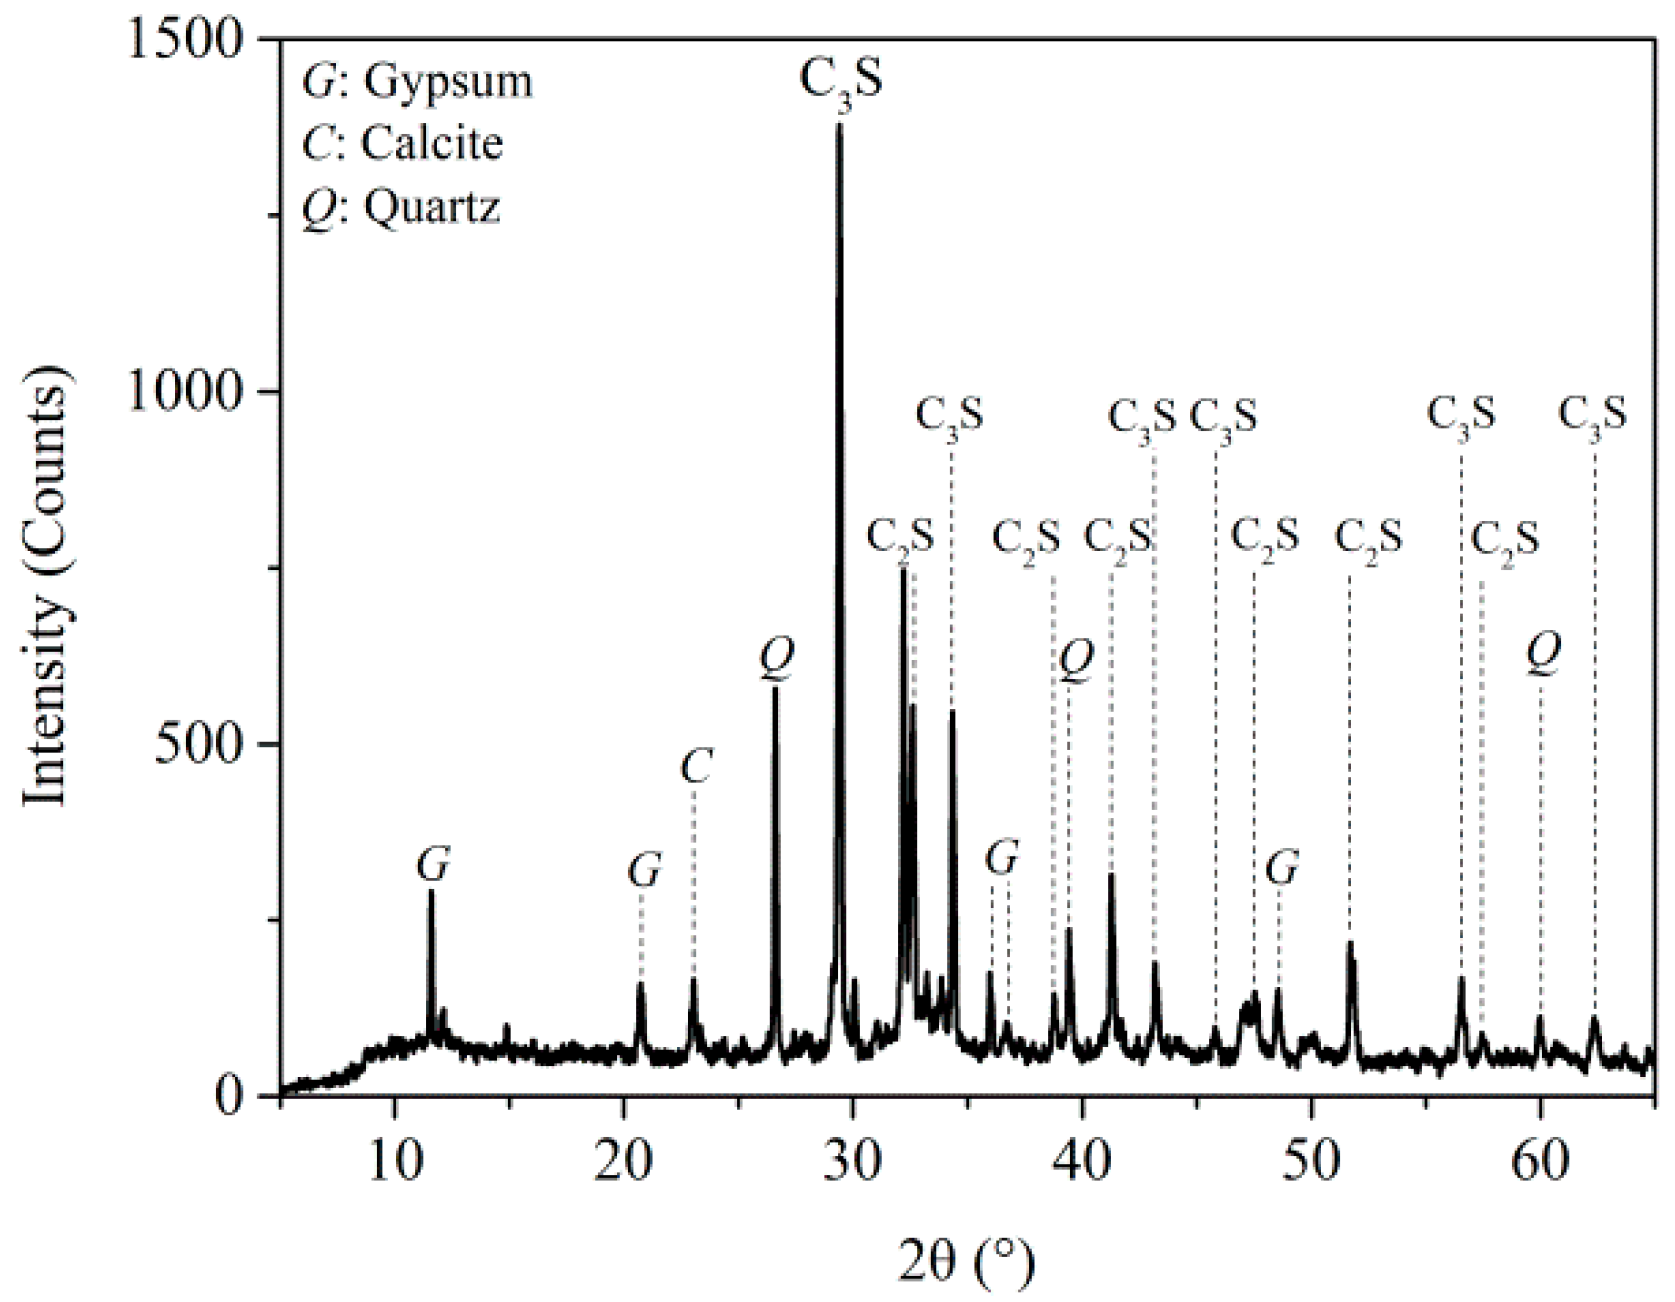
The Portland fly-ash cement used in this study is of a commercial type (PF32.5 [34]) containing 25% of active fly-ash on a dry-weight basis; this cement type is preferred in the context of embankment construction due to its economy and low hydration heat. The grain-size distribution of the powder cement is obtained by laser particle-size analysis with dry dispersion and the result is added to Figure 1. The specific gravity of the powder cement is estimated to be 3.10 via the Pycnometric method [28] with Kerosene (instead of water) used as the dispersion medium. The XRD profile of the oven-dried powder cement is shown in Figure 5, and the basic mineral compositions are identified as Tricalcium silicate (C3S, 71%), Quartz (12%), Gypsum (8%), Calcite (6%), and Dicalcium silicate (C2S, 2%) on a dry-weight basis. The XRD results do not reveal the presence of Tricalcium aluminate (C3A) and Tetra-calcium aluminoferrite (C4AF), possibly because of their low fractions.

2.2. Sample Preparation

To begin, the air-dried powder GRS is adjusted to a water content of 18.8% (i.e., ωopt) and sealed in a plastic bag. This maturation lasts for 24 h to achieve a better homogenization of the moist condition. Following this, the powder cement is mixed with the maturated GRS and the specimen is compacted in three layers of equal thickness in a stainless steel mold or sample ring. The top surface of the lower layer is scarified prior to the compaction of the next layer to allow for better interlocking between the adjacent layers. The whole procedure is done in 30 min to avoid a hardening of the soil–cement mixture. Finally, the specimens are sealed with preservative film and placed into a curing chamber at a temperature of 20 °C and a relative humidity of 95%.
In all test types, the portion of GRS in a specimen is controlled to an identical dry density of 1.58 Mg/m3 (i.e., ρdmax). The masses of the cement and maturated GRS required for preparing a specimen are calculated based on the dimensions of the specimen, target dry density of GRS (1.58 Mg/m3), specific gravity of the cement, and cement content. The volumetric cement content (the ratio of the volume of cement particles to the volume of all solid particles, Cvi) is scheduled as 0% (untreated), 1%, 2%, 3%, 4%, and 5%, corresponding to a mass cement content (the ratio of the mass of cement particles to mass of all solid particles, Cmi) of 0% (untreated), 1.9%, 3.9%, 5.7%, 7.6%, and 9.4%, respectively. This yields an overall dry density of the specimens ranging from 1.580 Mg/m3 (untreated) to 1.656 Mg/m3 (Cvi = 5%). Detailed information on the as-compacted specimens, such as the initial moist condition, initial porosity, and equivalent grain density (ratio of the mass of all solids to volume of all solids), is listed in Table 2.

2.3. Uniaxial Compression Tests

Uniaxial compression tests are conducted to determine the uniaxial compressive strength (UCS) and secant modulus (E50) of the untreated and cement-treated GRSs following water saturation. The specimens for the uniaxial compression test are 50 mm in diameter and 100 mm in height. Four series of specimens with volumetric cement contents of 0% (untreated), 1%, 2%, 3%, 4%, and 5% in each series are cured to 1 d, 7 d, 14 d, and 28 d, respectively. A duplicate specimen is prepared for each cement content and curing time. Prior to uniaxial compression, the cured specimen is vacuum-saturated under confined conditions to ensure an identical saturation state (i.e., full saturation) and the surfaces of the saturated specimens are coated with a thin film of Vaseline to avoid air-drying. An electronic universal testing machine is utilized for the uniaxial compression tests. A loading speed of 0.1 mm/min is employed, as was suggested by ISRM [35]. Each test is ended after a peak state is achieved or when the axial strain exceeds 20%.

2.4. Oedometric Compression Tests

Oedometric compression tests are conducted to determine the compressibility and vertical yielding pressure of the untreated and cement-treated GRSs following water saturation. The specimens for the oedometric compression tests are 61.8 mm in diameter and 20 mm in height. Two series of specimens with volumetric cement contents of 0% (untreated), 1%, 2%, 3%, 4%, and 5% in each series are cured to 7 d and 28 d, respectively. Prior to the oedometer compression, the cured specimen is vacuum-saturated under confined conditions. A conventional oedometer with a loading capacity of 1600 kPa is employed. A loading–unloading–reloading cycle up to a vertical pressure of 1200 kPa is accomplished for each cement content and curing time. The loading cell is filled with water to maintain saturation of the specimen, and each loading and unloading stage lasts for 24 h. The reading deformation is calibrated based on the systematic deformation of the oedometer.

2.5. Microscopic Tests

XRD, SEM, and MIP tests are conducted to investigate the mineral compositions, soil fabric, and pore size distribution of the untreated and cement-treated GRSs following water saturation, respectively. The specimens for preparing the samples used in the microscopic tests are 61.8 mm in diameter and 20 mm in height. A series of specimens with volumetric cement contents of 0% (untreated), 1%, 2%, 3%, 4%, and 5% are cured to 28 d and subsequently vacuum-saturated under confined conditions. For each cement content, cube samples with a side length of approximately 2 cm are taken from the saturated specimen and immediately freeze-dried using liquid nitrogen and a vacuum-freezing dryer. The freeze-dried bulk samples are directly used for the SEM and MIP tests, and one of the freeze-dried bulk samples is ground into powder for use in the XRD tests. The equipment used for the XRD tests is the Bruker D8 Advance. XRD patterns in a range of 2θ = 5–80° are obtained using a Cu- (λ = 1.515 Å) X-ray tube and a continuous scan rate of 2°/min. SEM tests are conducted using a FEI Quanta 250; SEM images are captured from fresh fractures sprayed with gold. MIP tests are carried out using the Micromeritics AutoPore IV 9510 and each sample has accomplished an intrusion–extrusion cycle. The arrangements for the mechanical and microscopic tests are summarized in Table 3.

3. Results and Analysis

3.1. UCS and Secant Modulus

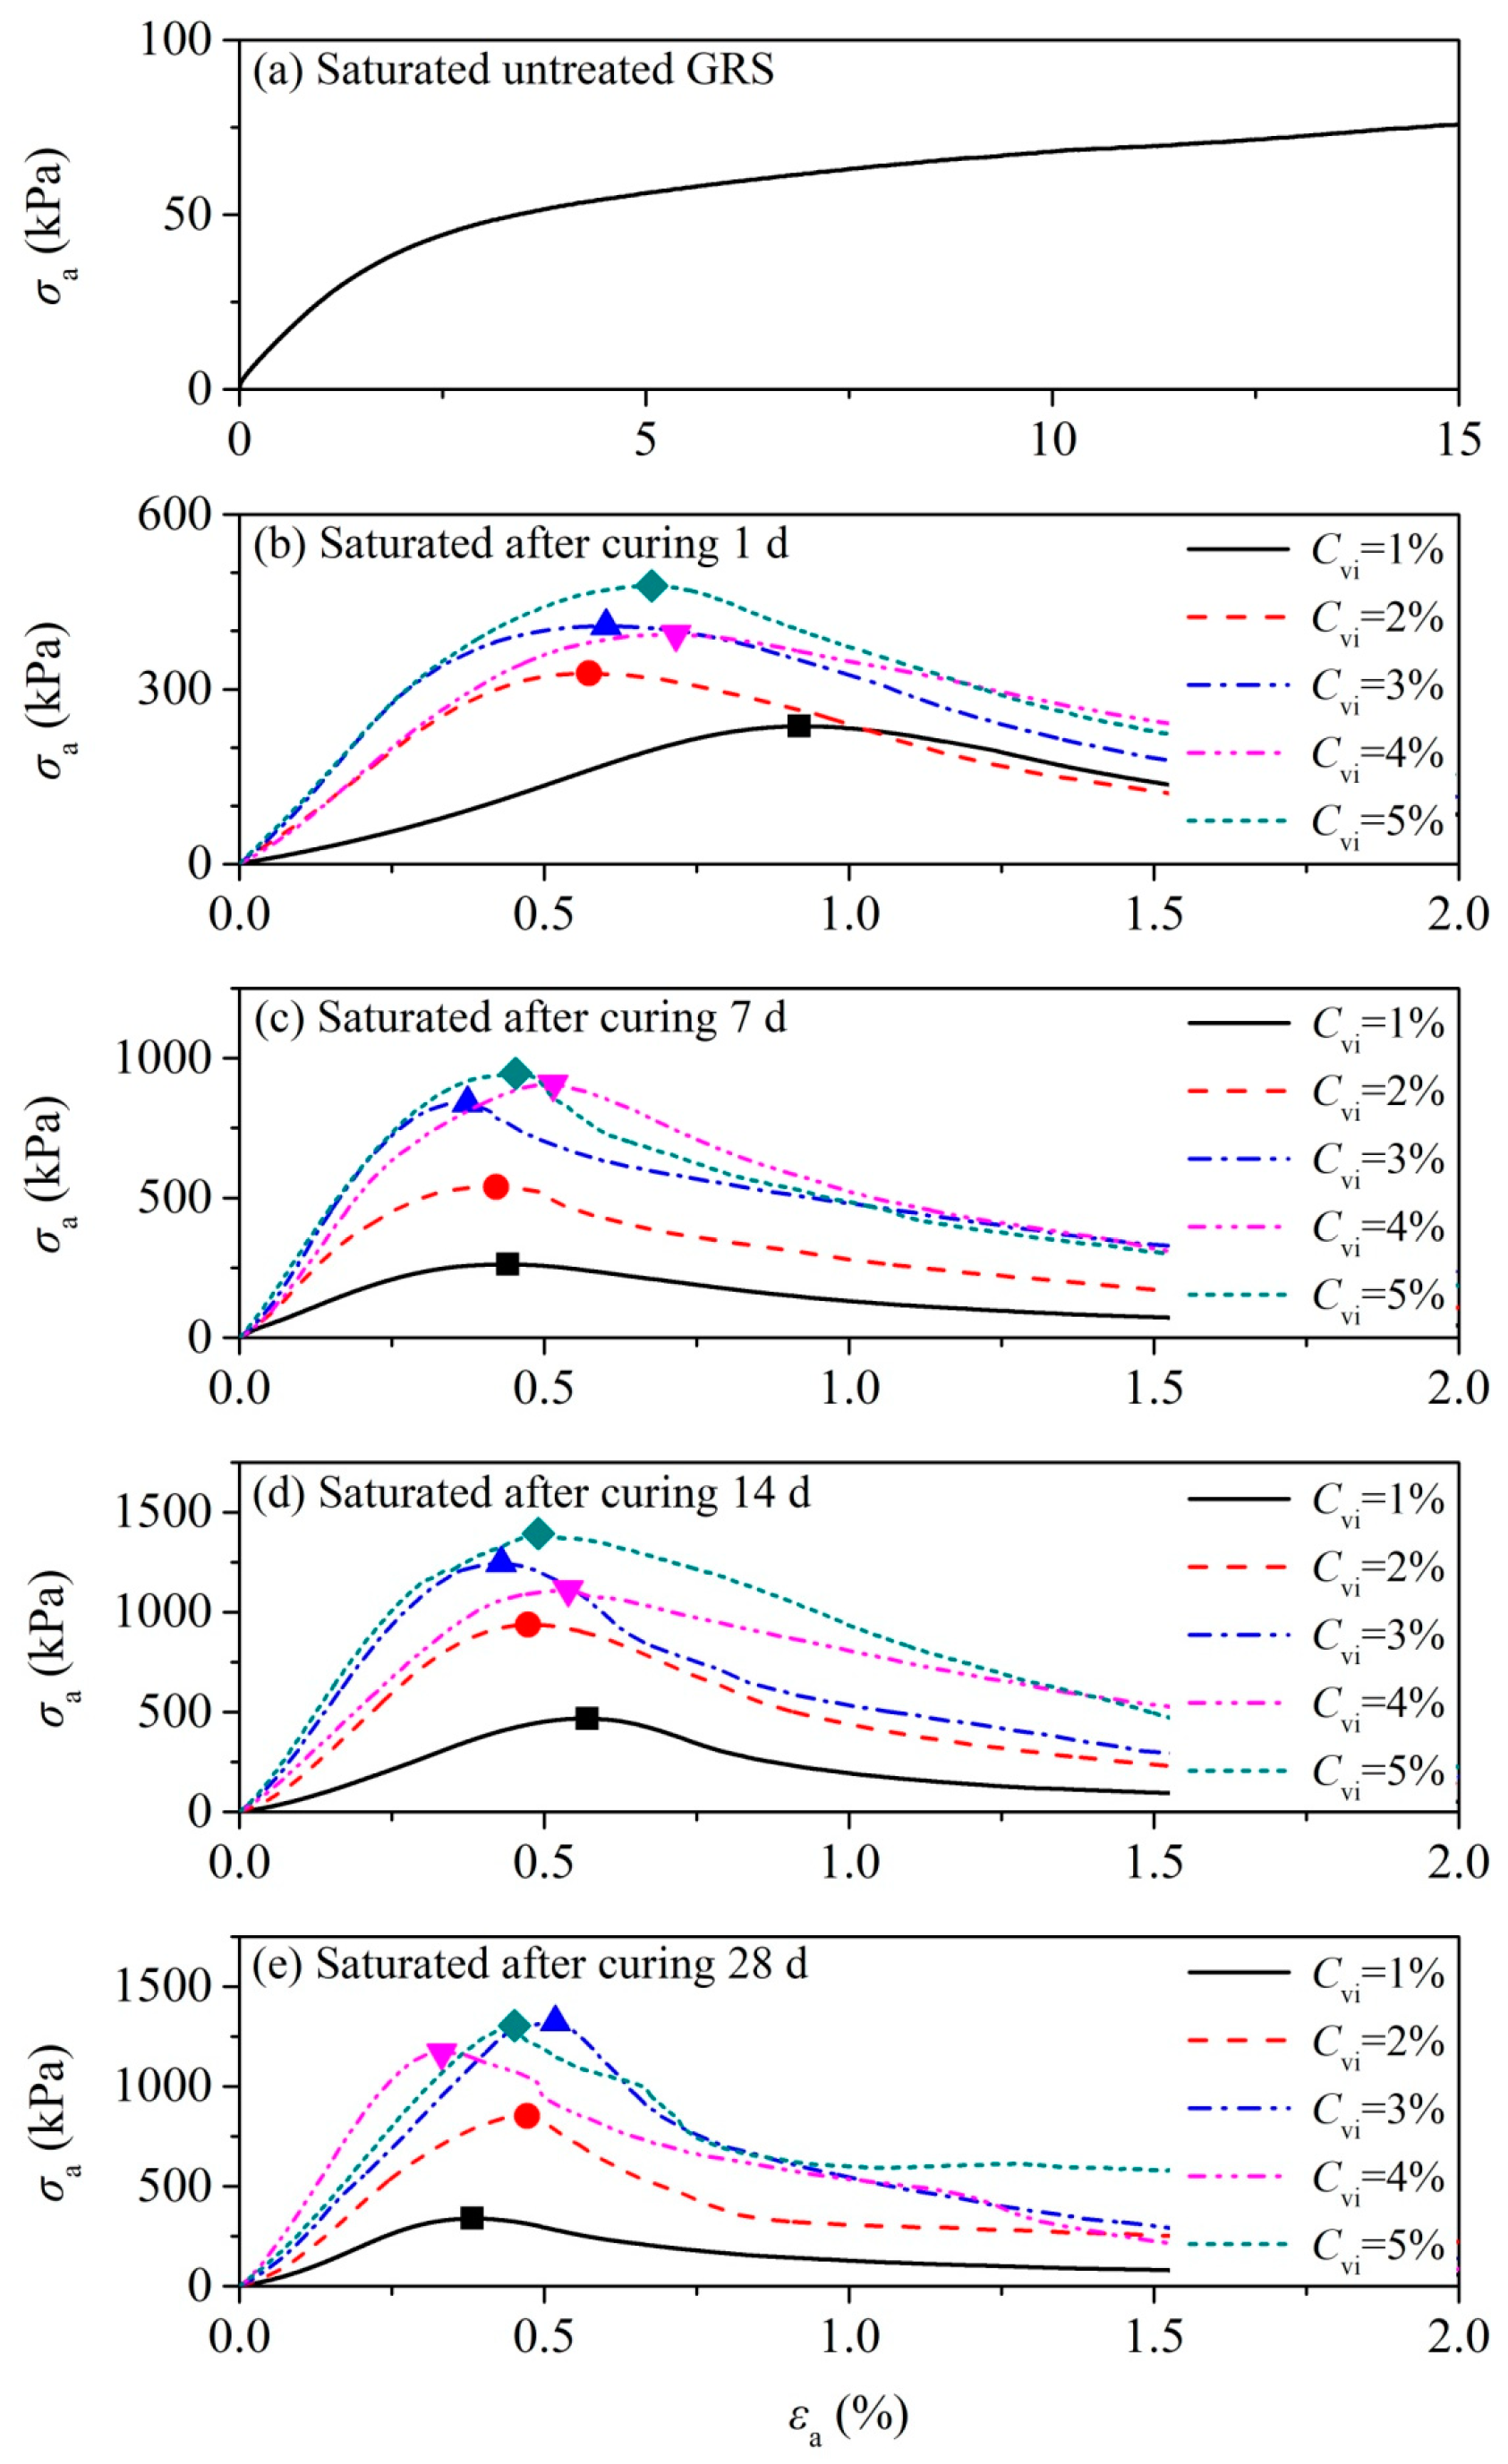
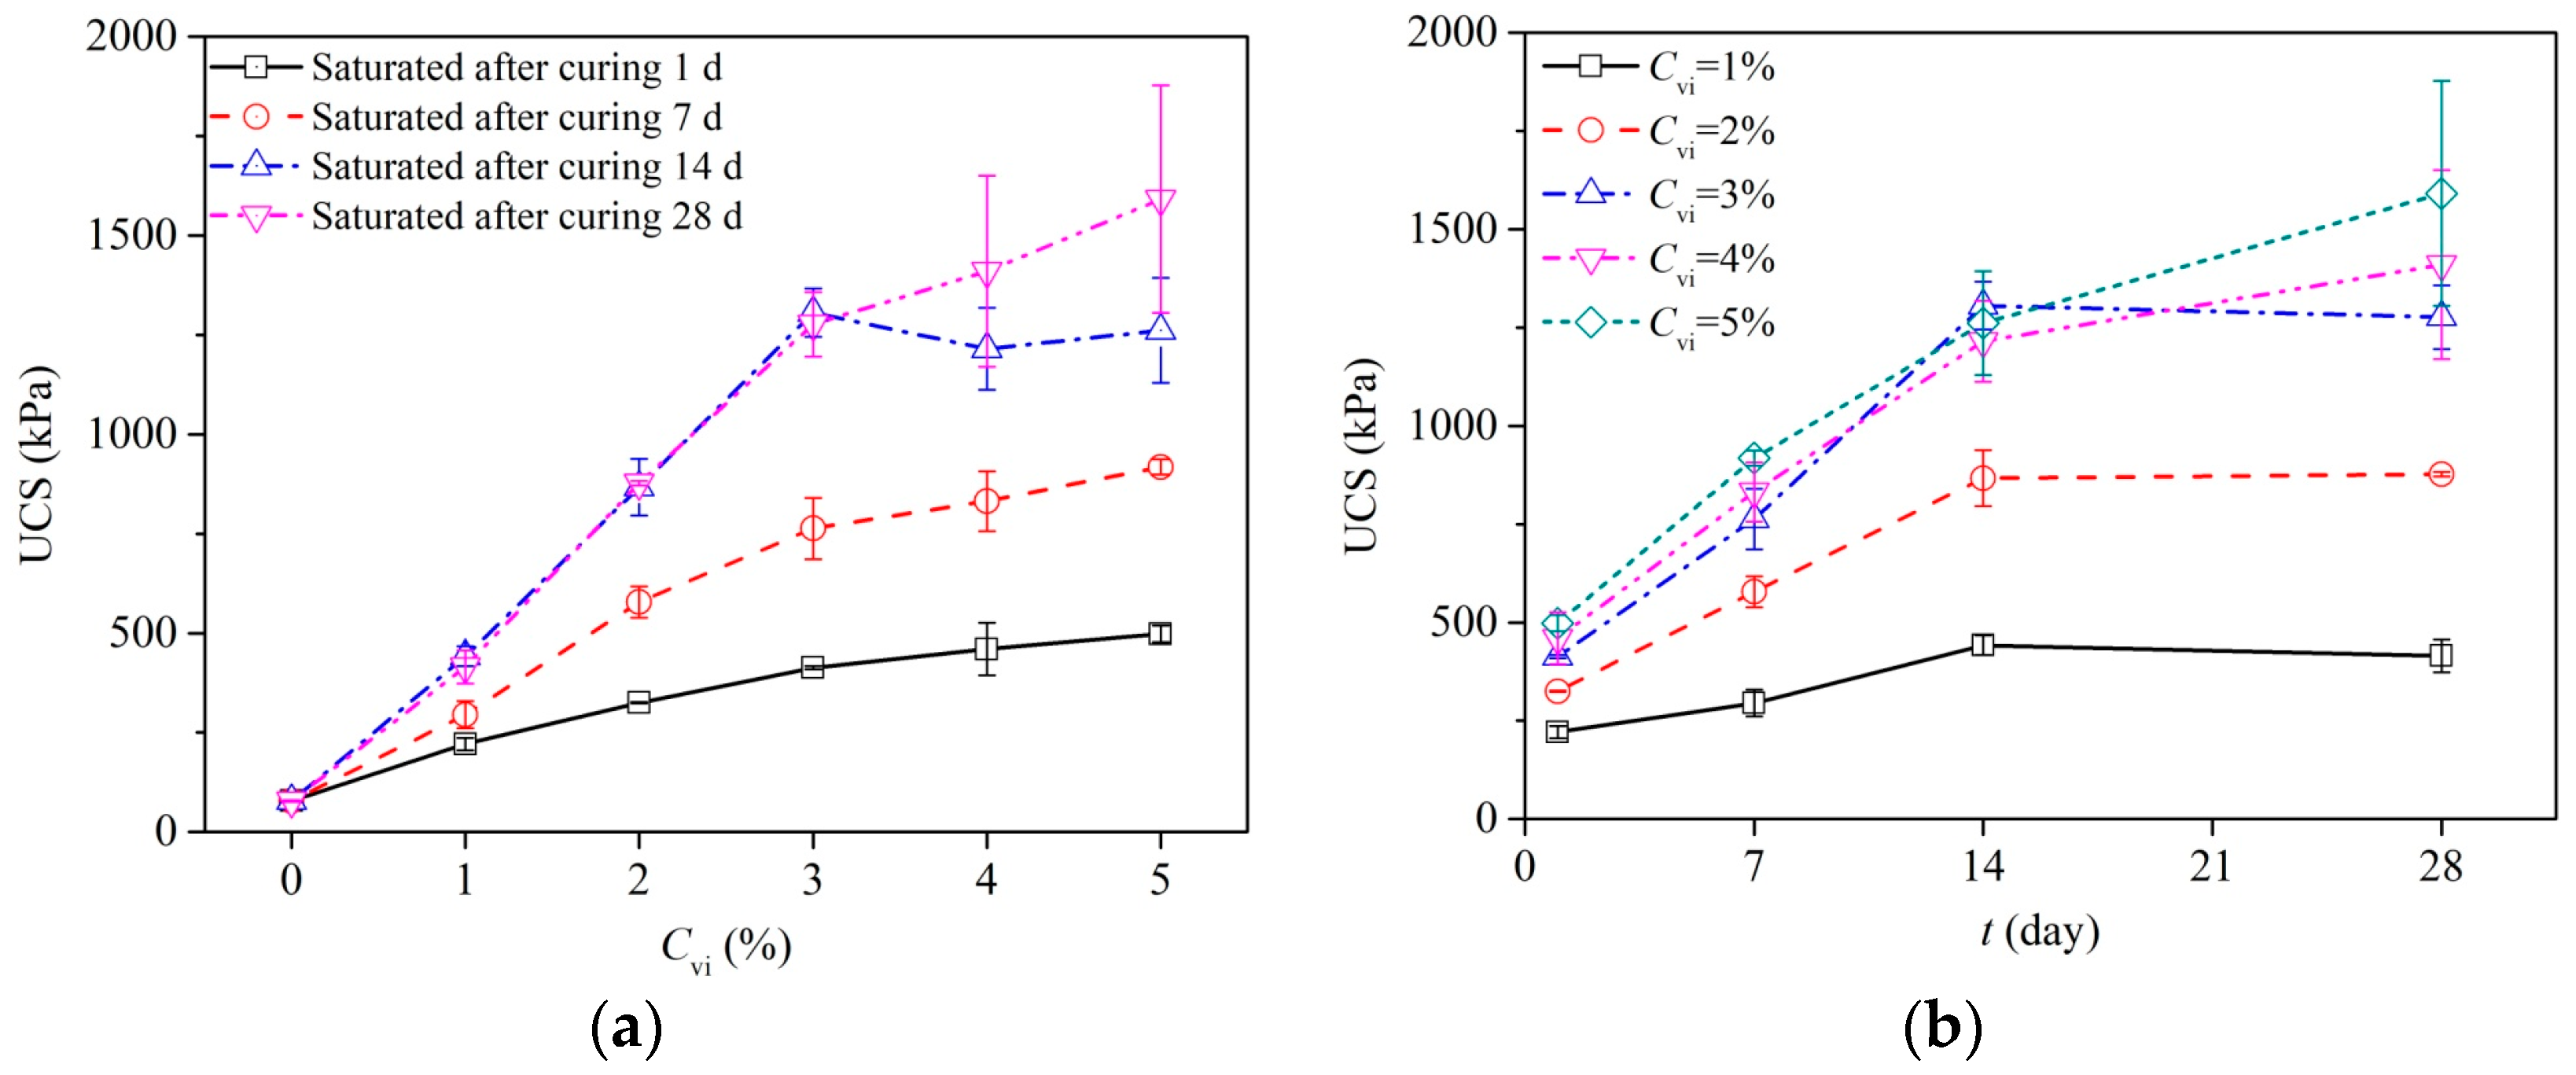
One set of the uniaxial compression curves of the saturated untreated and cement-treated GRSs is shown in Figure 6. For the untreated specimen, the stress–strain relationship is of strain-hardening type (see Figure 6a). In this case, the axial stress at an axial strain of 15% is adopted as the UCS of the specimen. For the treated specimens cured to 1–28 d, the stress–strain relationship is of strain-softening type (see Figure 6b–e). In this case, the UCS of the specimen is identified at the peak state. The relationship between the UCS and the cement content at four curing times is shown in Figure 7a. As the volumetric cement content increased from 0% to 3%, UCS increased linearly from 78 kPa to 413 kPa, 763 kPa, 1306 kPa, and 1277 kPa at curing times of 1 d, 7 d, 14 d, and 28 d, respectively. As the volumetric cement content exceeded 3%, the increase of the UCS with the cement content diminished. The relationship between the UCS and the curing time at five cement contents is shown in Figure 7b. For a given cement content, UCS increased linearly in the first 14 d and the increase of UCS with the curing time was then diminished (most notably in the case of Cvi = 1–3%). In detail, the UCS of the specimens cured to 1 d, 7 d, and 14 d reached 31–53%, 59–71%, and 79–107%, respectively, of those cured to 28 d, and these ratios decreased as the cement content increased. In the case of Cvi ≥ 4%, the UCS developed successively within 28 d; in the case of Cvi ≤ 3%, the development of the UCS ended at an early age of 14 d.
In all the cases, the uniaxial compression curves are nonlinear before the peak state (see Figure 6). In this study, the secant modulus is determined to describe the stiffness of the specimen. The dependence of the secant modulus on the cement content and curing time is shown in Figure 8. The experimental trends are similar to that of the UCS. As the volumetric cement content increased from 0% to 3%, the secant modulus increased almost linearly from 2.8 MPa to 116 MPa, 240 MPa, 319 MPa, and 292 MPa at a curing time of 1 d, 7 d, 14 d, and 28 d, respectively (see Figure 8a). As the volumetric cement content exceeded 3%, the increase of the secant modulus with the cement content diminished. For a given cement content, the secant modulus of the specimens increased rapidly in the first 7–14 days, after which the increase of the secant modulus with the curing time diminished (see Figure 8b). Specifically, the secant modulus of the specimen cured to 1 d, 7 d, and 14 d reached 28–43%, 67–109%, and 84–109%, respectively, of those cured to 28 d. A similar conclusion can be drawn that the secant modulus of the specimens developed successively in 28 d in the case of Cvi ≥ 4% and may have ended in 7–14 d in the case of Cvi ≤ 3%.

3.2. Compressibility and Vertical Yielding Pressure

Oedometric compression curves of the saturated untreated and cement-treated GRSs cured to 7 d and 28 d are shown in Figure 9 and Figure 10, respectively. The e−logσv relationship is nonlinear in all the cases, indicating initial over-consolidation states of the specimens due to compaction. The untreated specimen entered the normal consolidation state as the vertical pressure exceeded 400 kPa (see Figure 9). However, the states of the treated specimen cannot be confirmed due to the moderate stress level (see Figure 10). Nevertheless, the compression index (Cc) of the specimens was determined via linear fitting of the e−logσv relationship in the range of σv > 400 kPa (for Cvi = 0–4%) or σv > 800 kPa (for Cvi = 5%). The unloading–reloading cycle yielded a hysteresis loop of the e−logσv relationship; its diagonal slope (absolute value) was accepted as the rebound index (Cr) of the specimen. Given the subjectivity of Casagrande method [36], an alternate approach was employed to determine the vertical yielding pressure (σy) of the specimen [37]. As all the compression curves are horizontal in the case of σv < 12.5–25 kPa, the vertical pressure at which the intrinsic compression line (ICL) intersects the initial void ratio was deemed to be the vertical yielding pressure of the specimen (see Figure 9 and Figure 10).
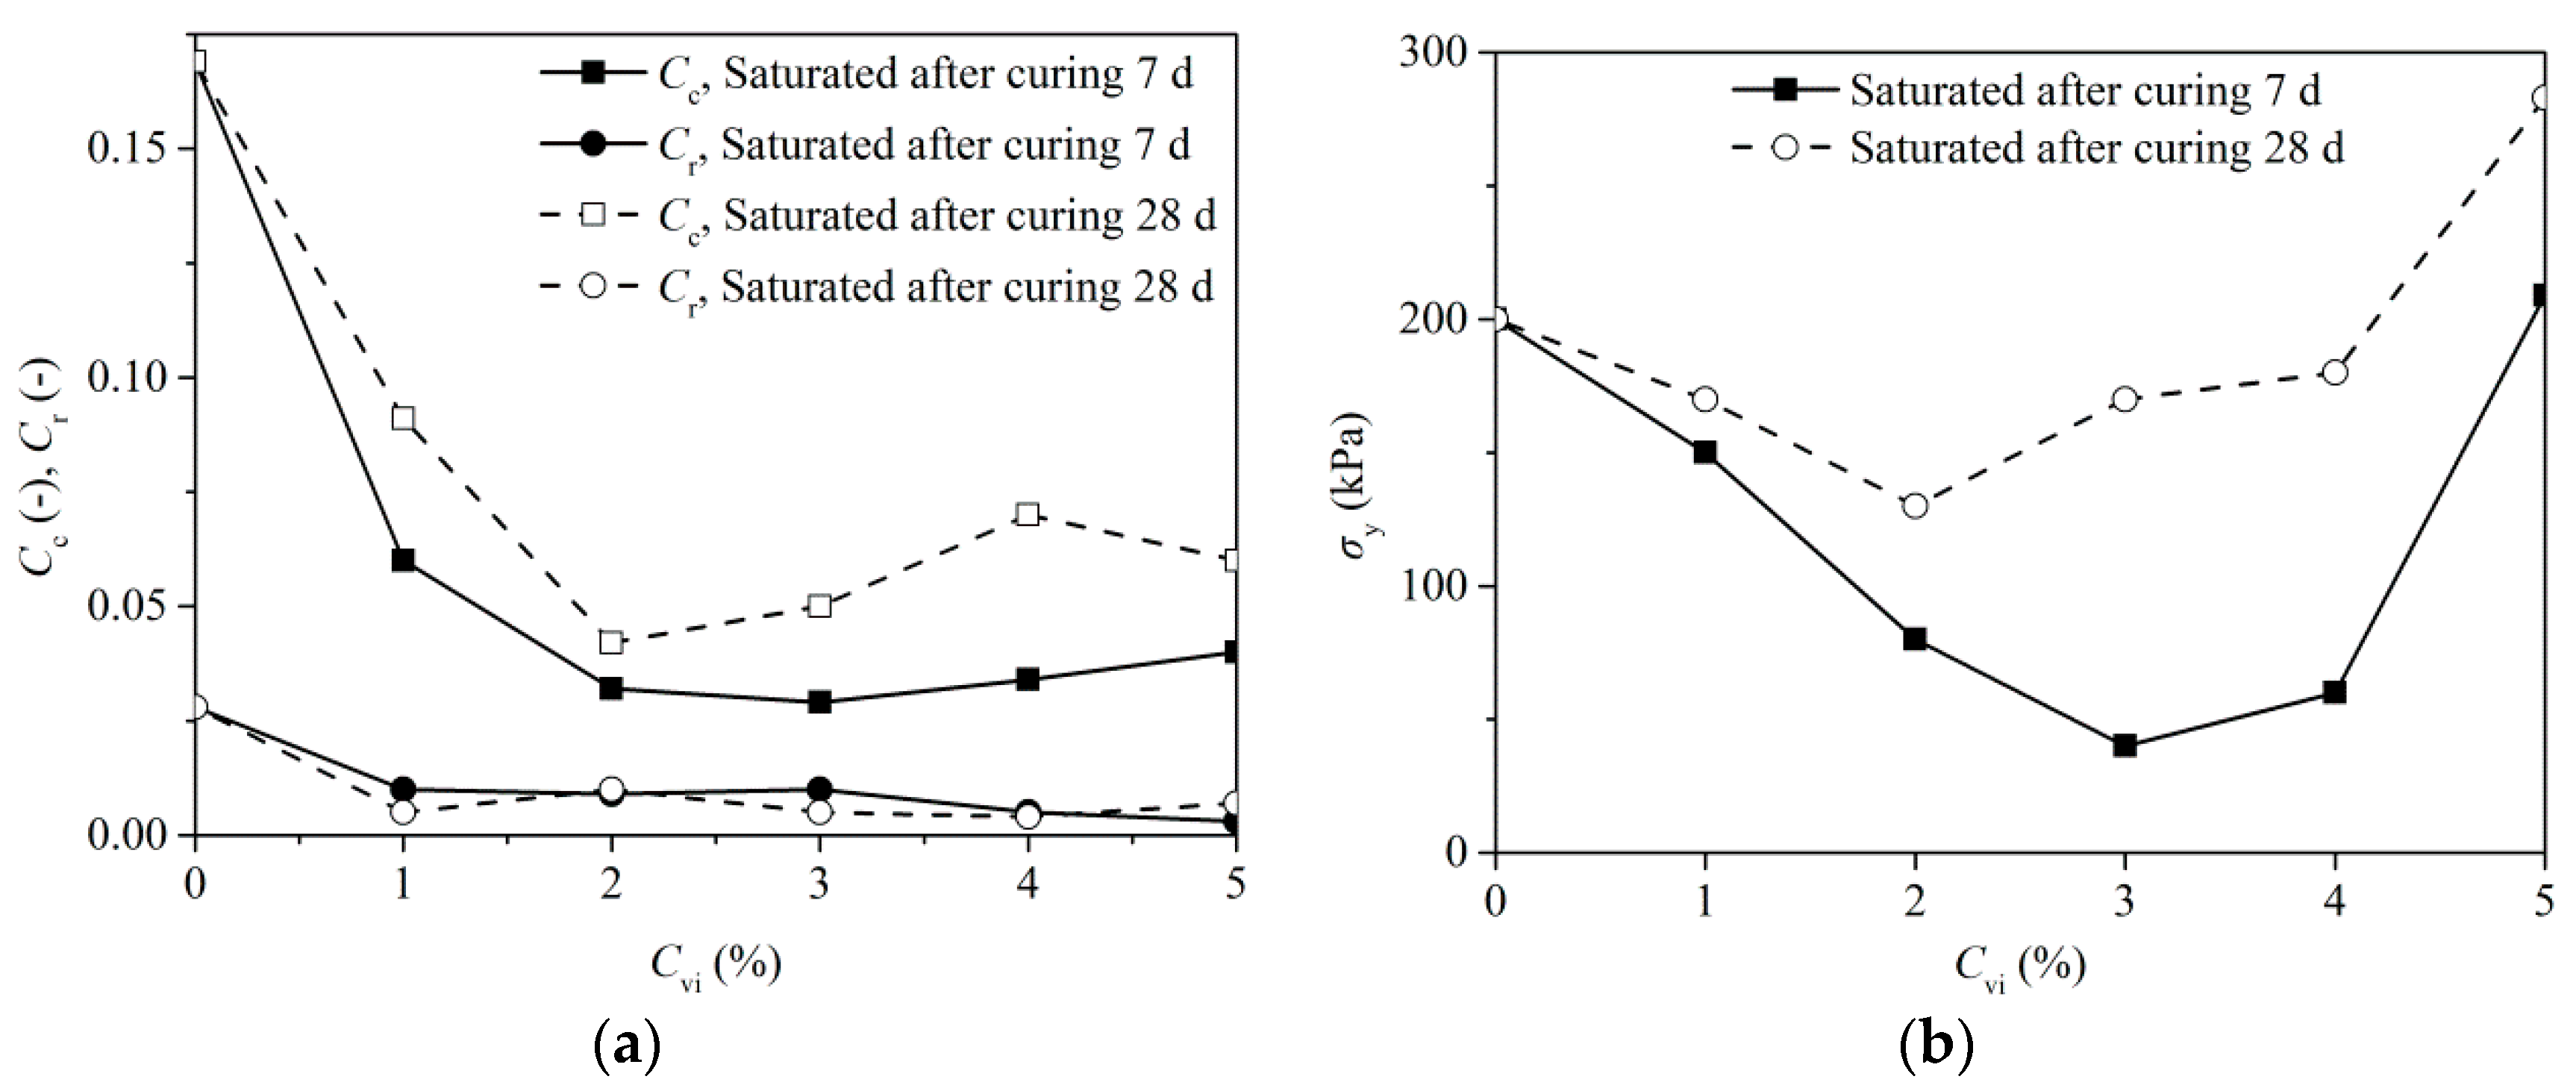
The dependence of the compression index, rebound index, and vertical yielding pressure on the cement content and curing time is shown in Figure 11. It is observed that, for a given cement content, the specimen cured to 28 d has a slightly larger compression index compared with the case of 7 d (see Figure 11a). As the volumetric cement content increased to 2%, the compression index of the specimens cured to 7 d and 28 d dropped sharply from 0.17 to 0.03 and 0.04, respectively. As the volumetric cement content exceeded 2%, the variation of the compression index with the cement content became less significant. The rebound index of the treated specimens is much smaller than that of the untreated one (0.003–0.01 versus 0.028) and changes in the rebound index with the cement content and curing time are less significant (see Figure 11a). For a given cement content, the vertical yielding pressure of the specimens cured to 28 d is much higher than that of those cured to 7 d (see Figure 11b). For a given curing time, the vertical yielding pressure of the specimens decreased successively and was followed by a continuous increase as the volumetric cement content increased. The volumetric cement content at which the tendency reversed is 2–3%.

3.3. Mineralogy and Microstructure

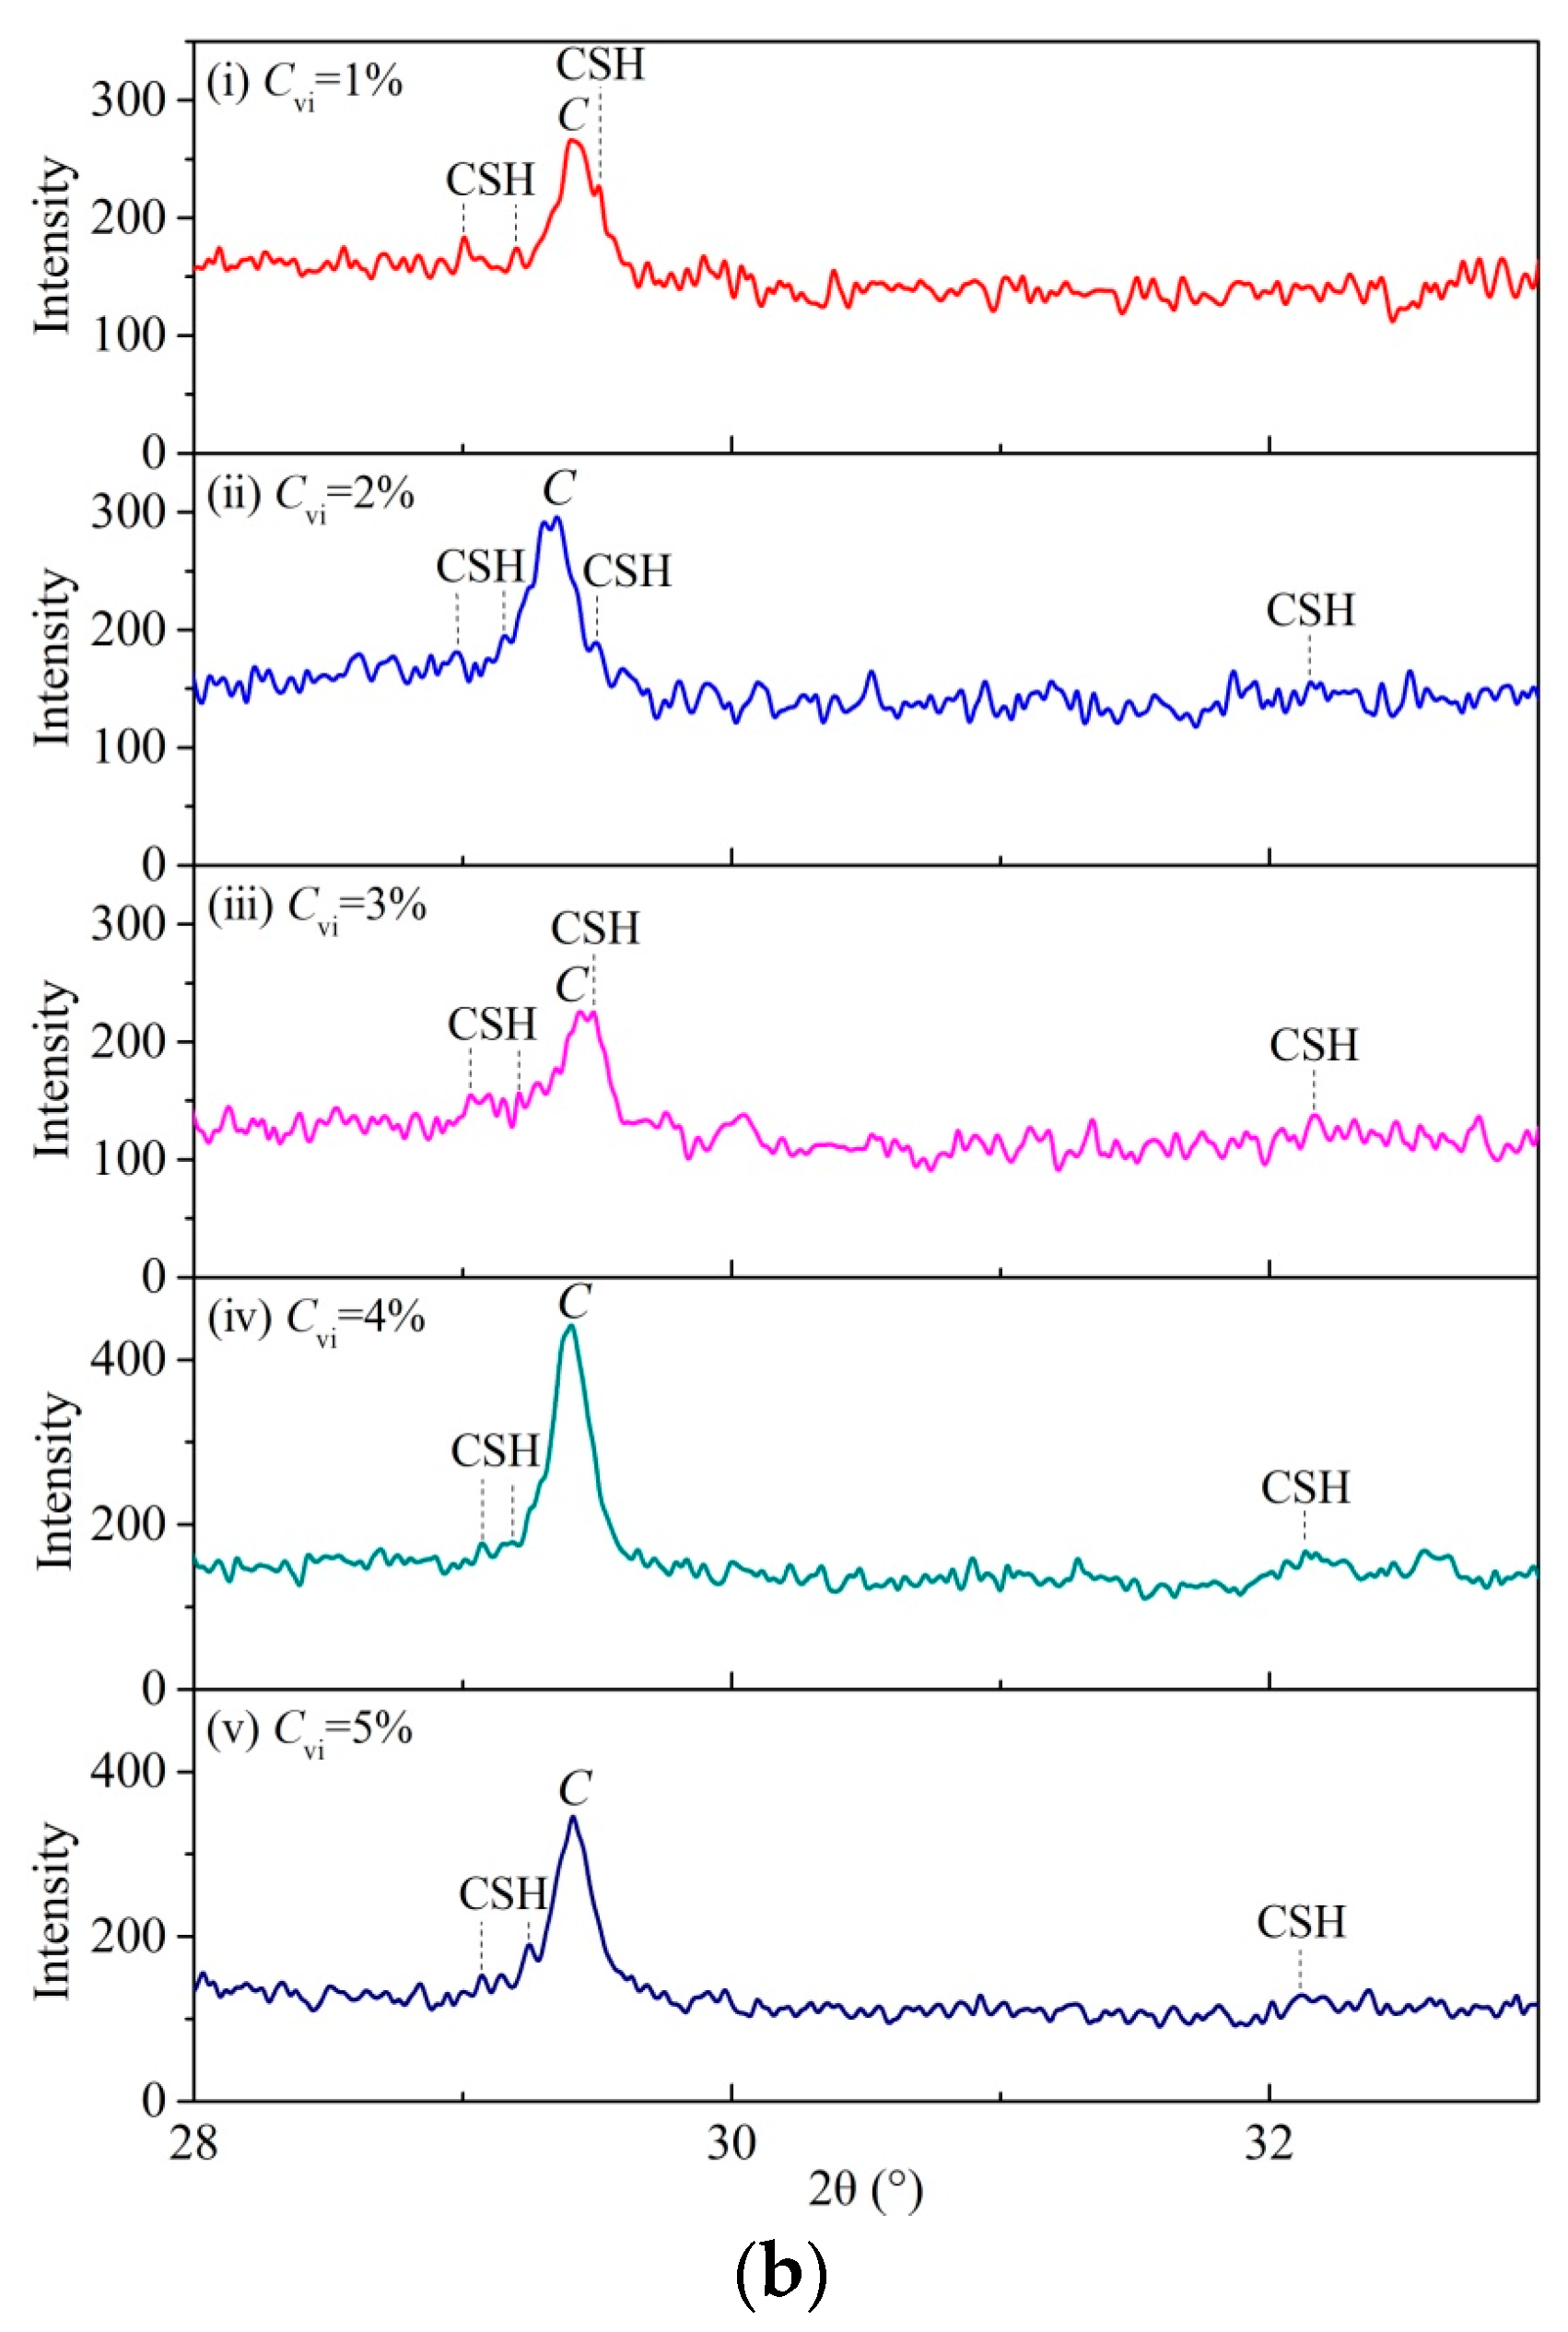
Cementitious products include the C–(A)–S–H and CH (calcium hydroxide). The C–A–S–H and C–A–H are unidentifiable due to the negligible C3A in the cement used in this study. XRD patterns of the saturated untreated and cement-treated GRSs cured to 28 d are shown in Figure 12. The crystalline minerals include the Kaolinite and Quartz from the original soil and the non-hydratable Calcite from the cement (see Figure 12a). For the treated specimens cured to 28 d, C–S–H was identified at 2θ = 29.0°, 29.2°, 29.5°, and 32.1° (see Figure 12b) [38,39,40].
SEM images of the saturated untreated and cement-treated GRSs are shown in Figure 13. The untreated specimen consists of clay lamella and quasicrystals (see Figure 13a). By convention, the pores within the quasicrystals are deemed to be micro-pores, and those between the quasicrystals are referred to as macro-pores. For the treated specimens, their microscopic morphology and the types of C–S–H [41] were observed to depend on the cement content. The C–S–H is fibrous (C–S–H of type Ⅰ) in the case of Cvi = 1–2% (see Figure 13b,c); the long C–S–H fibers were observed to fill the macro-pores (see Figure 13b), whereas the short ones attached to the surfaces of the clay lamellae (see Figure 13c). The C–S–H became reticular (C–S–H of type Ⅱ) in the case of Cvi = 3–5%; the quasicrystals were assembled by the C–S–H and aggregates (stacks of quasicrystals) of larger size and more rounded geometry were observed to form (see Figure 13d–f). CH of a hexagonal tabular shape can be observed in the inter-aggregate pores as the volumetric cement content increased to 5% (see Figure 13f).
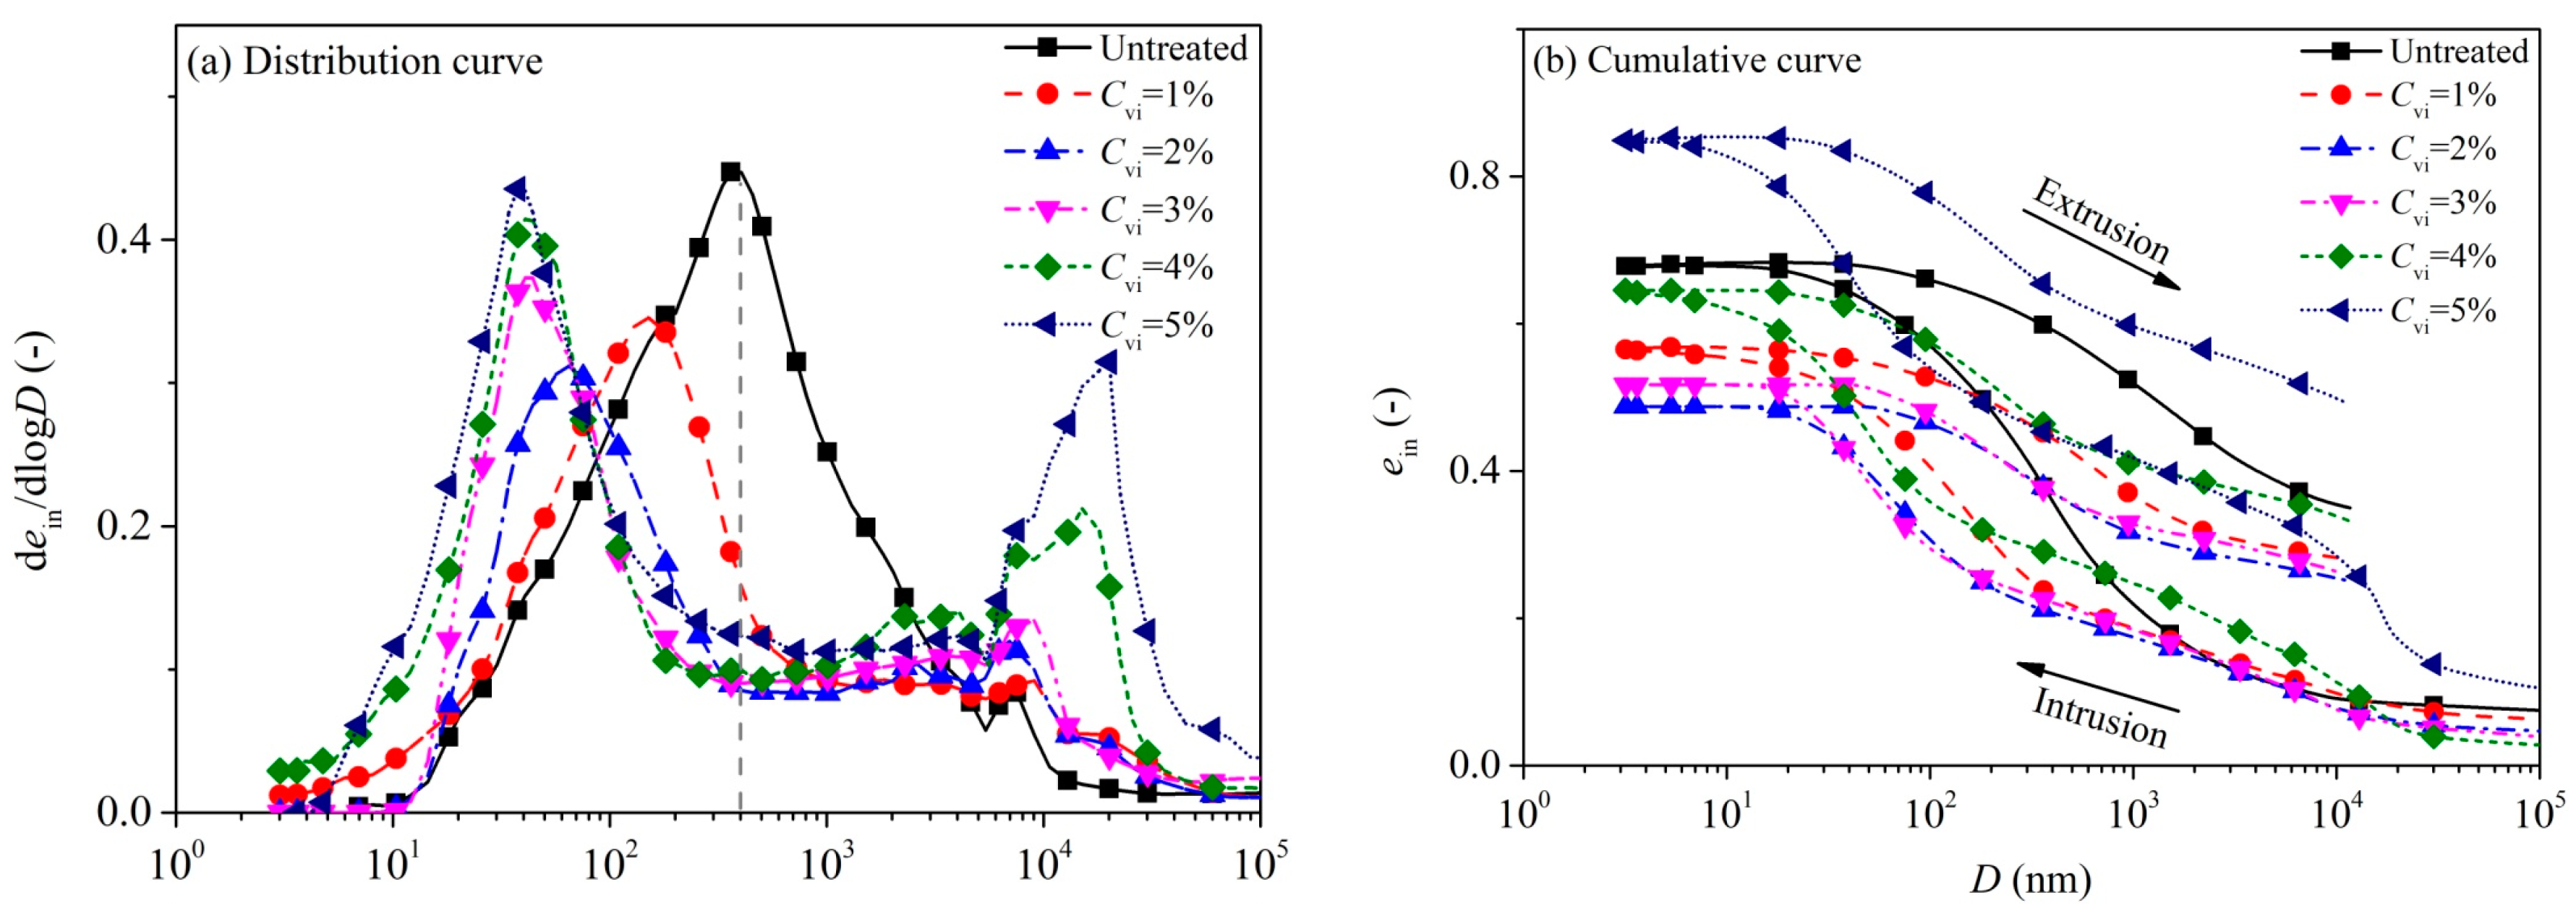
The changes in the pore structure due to cement treatment can be assessed based on the MIP results. The pore size distribution and cumulative curves of the saturated untreated and cement-treated GRSs cured to 28 d are shown in Figure 14. The PSD curves were derived from the differential intrusion volume of the mercury (per unit mass, Vin) multiplied by the equivalent grain density (i.e., dein/dlogD = dVin/dlogD × ρs) (see Figure 14a). The sudden increase of intrusion at a pore size of 5.4 μm is an artifact due to the transfer of the samples from the low-pressure chamber to the high-pressure chamber during MIP tests. The untreated specimen is of single-porosity, characterized by a single peak at a pore diameter of about 0.4 μm in the PSD curve; this single pore family represents both the pores within and between the quasicrystals. The treated specimens are of dual-porosity with two peaks in the PSD curve representing two distinguishable pore families; the first pore family represents the pores within the aggregates, whereas the second represents the pores between the aggregates. The first peak was observed to decrease with the cement content in the case of Cvi ≤ 2%, and this tendency reversed as the cement content further increased. The pore diameter corresponding to the first peak decreased successively as the cement content increased. The second peak is not distinct in the case of Cvi ≤ 2% and becomes notable as the cement content further increases. Contrary to the first peak, the second peak and its corresponding pore diameter increased sequentially as the cement content increased.
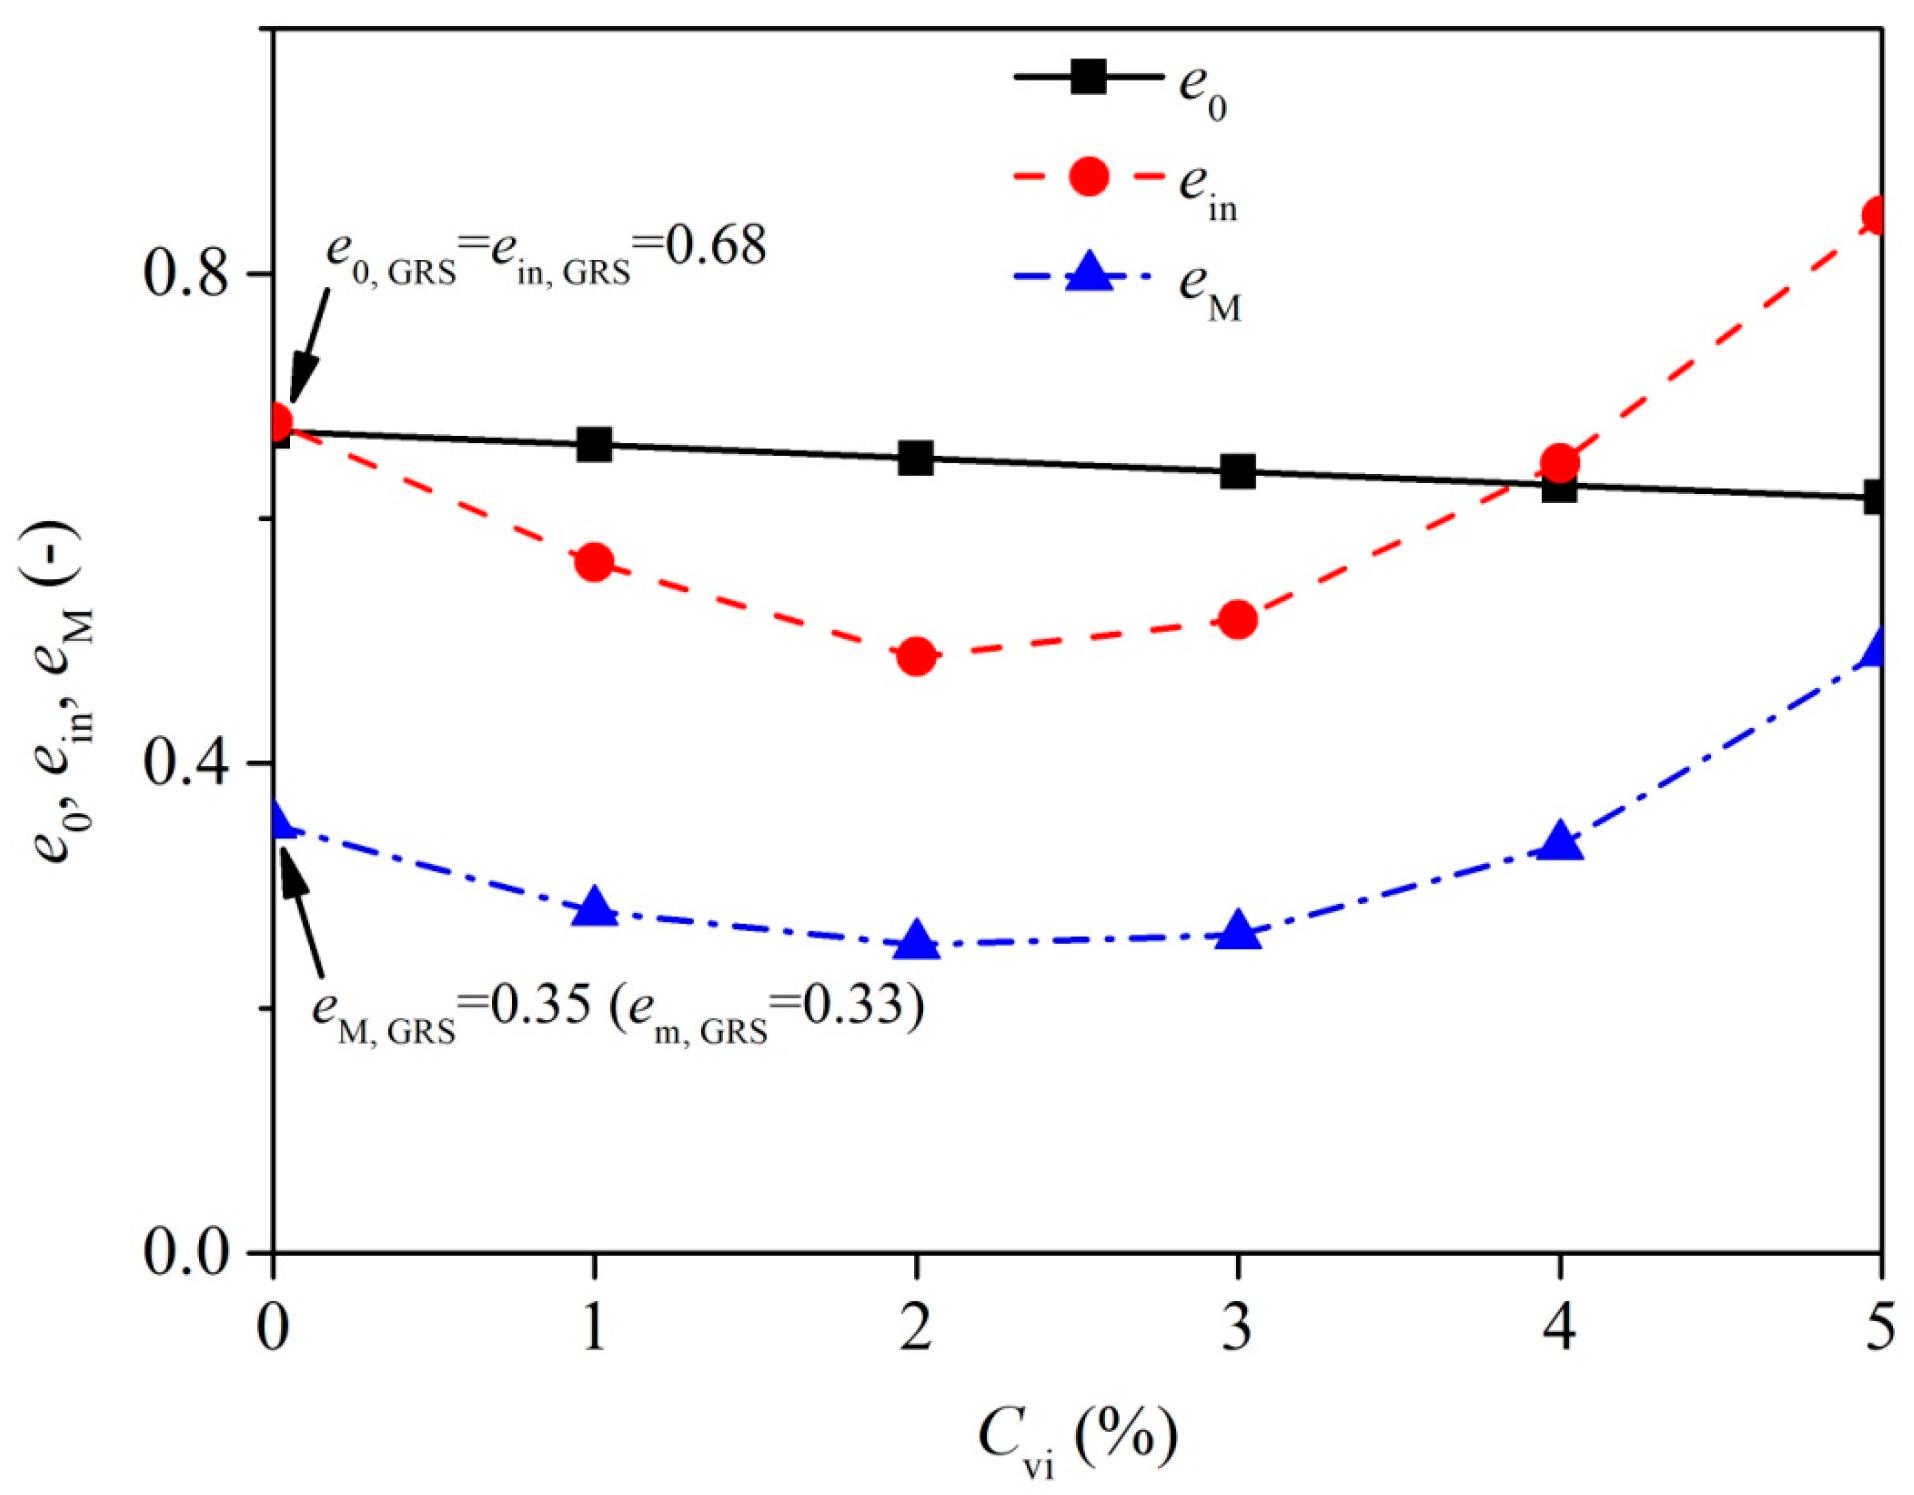
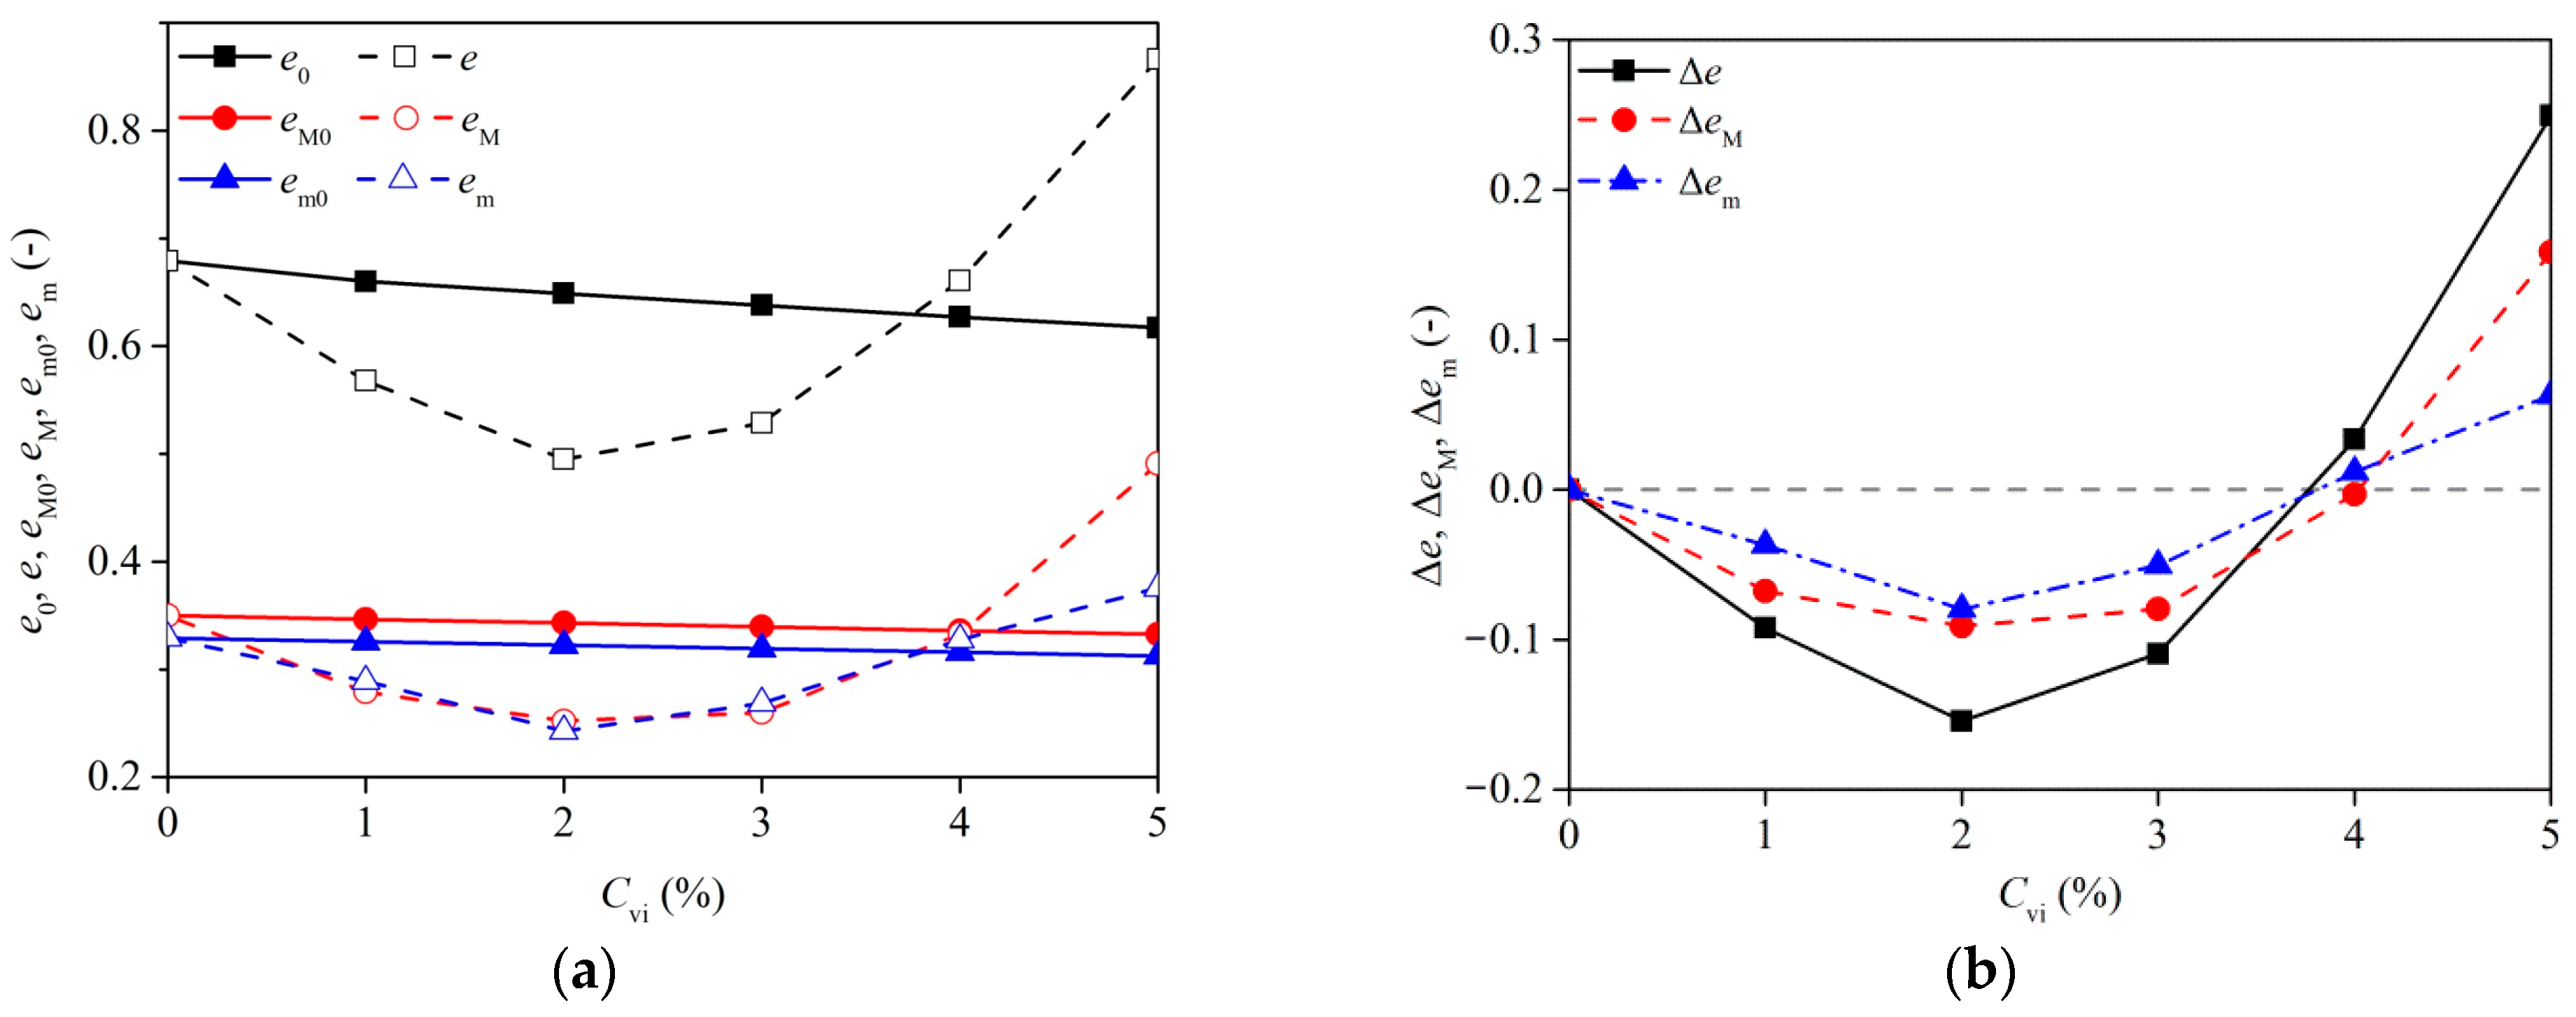
The cumulative curves came from the cumulated intrusion volume of the mercury in an intrusion–extrusion cycle multiplied by the equivalent grain density (i.e., ein = Vin × ρs) (see Figure 14b). It was assumed that the mercury was retained in the macro-pores after the intrusion pressure was removed [32,33]. Therefore, the macro-void ratio (ratio of the volume of macro-pores to the volume of all solid particles, eM) equals the intruded void ratio after an intrusion–extrusion cycle. In addition, the maximum ein was identified and adopted as the intruded void ratio of the specimen (ein). The micro-void ratio (ratio of the volume of micro-pores to the volume of all solid particles, em) is the difference between the void ratio (e) of the specimen and the macro-void ratio (i.e., em = eeM). As the void ratio of the specimen may change during curing, the exact micro-void ratio cannot be determined based on the initial void ratio (e0). Figure 15 illustrates the delimitation of the macro- and micro-pores for the saturated untreated specimens as an example. The ein and eM of the specimens were determined based on this criterion, and the dependences of e0, ein, and eM on the cement content are shown in Figure 16. The ein and eM were observed to decrease with the cement content in the range of Cvi ≤ 2%, and these tendencies reversed as the cement content further increased. For the untreated specimen, the ein equals the e0, indicating no changes in the void ratio during confined wetting; this allows the eM and em of the untreated specimen to be determined (giving eM = 0.35 and em = 0.33). For the treated specimens, the differences between the ein and e0 are the combined effects of the formation of C–S–H and aggregates. The detailed mechanisms are discussed and the void ratios of the cured specimens are estimated in Section 4.3.

4. Discussion

4.1. Prediction of UCS and Secant Modulus

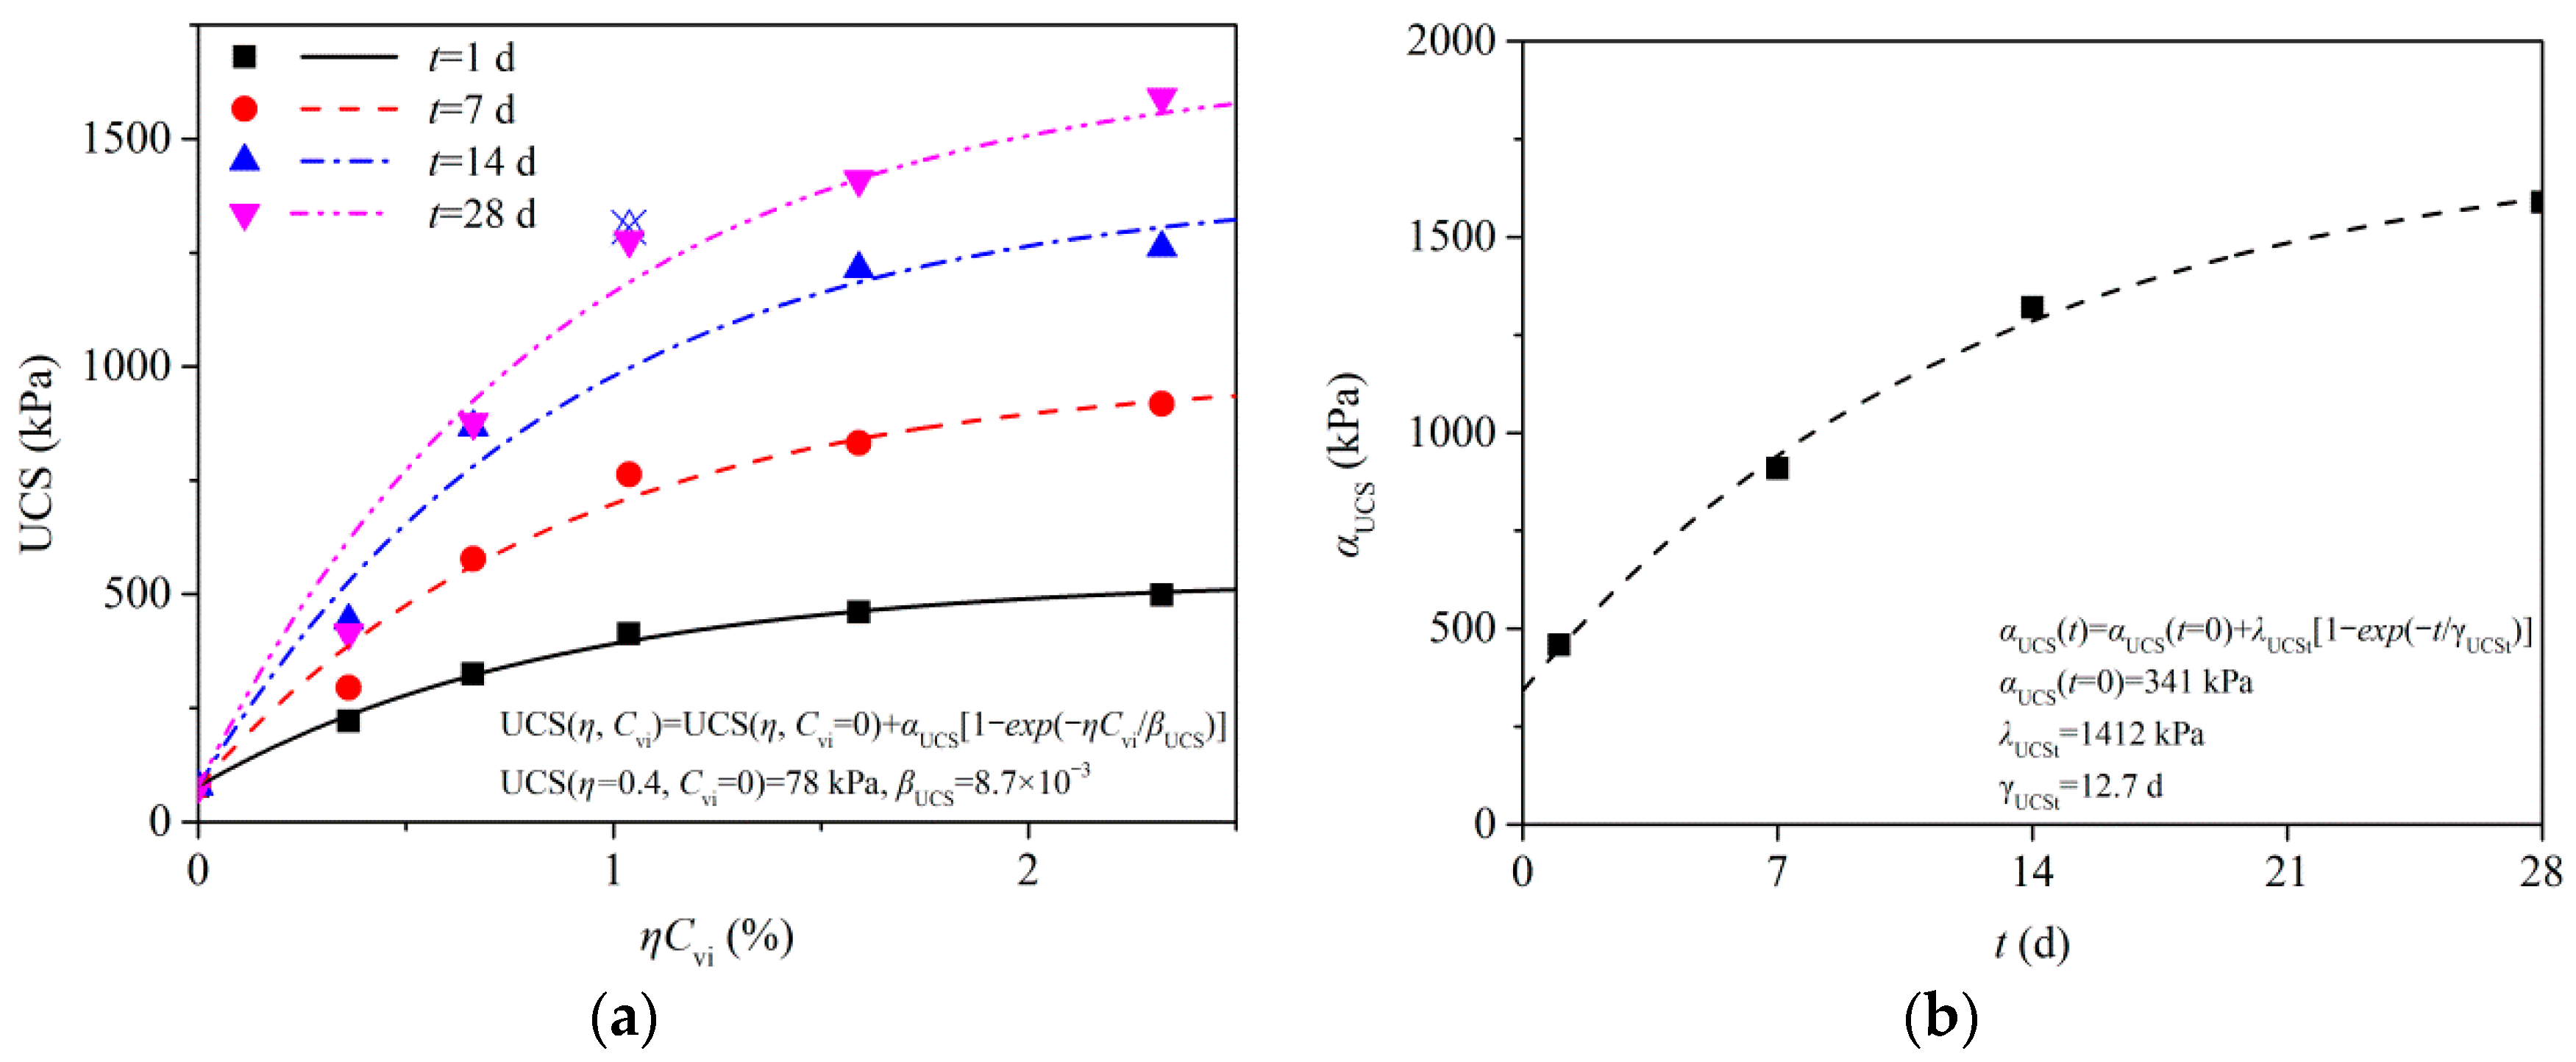
Various methods have been proposed to predict the mechanical properties of cement-treated soils, among which the unconfined compressive strength, triaxial shear strength, and tensile strength were well-linked to an adjusted porosity/cement ratio, η/(Cvi)ξ [42,43,44]. The exponent ξ was found to be a positive value smaller than unity, meaning that, for a given soil type, various strengths of the treated soil cannot be predicted based on those of the untreated one (Cvi = 0). According to the literature review, the strength and stiffness of soils increases with the increasing cement content and the decreasing porosity (and the decreasing η/(Cvi)ξ as a result). Hence, in this study, an alternative approach using a parameter η(Cvi)ξ (ξ > 0) was employed to merge the gap between the treated and untreated states, allowing for a prediction of the strength and stiffness of the treated soil based on its untreated state. The term η(Cvi)ξ can describe the net effects of the porosity (η) and cement content (Cvi), and the exponent ξ adjusts the weights of the two contradictory factors. Figure 17a presents the UCS–η(Cvi)ξ relationship of the saturated untreated and treated specimens in the case of ξ = 1. For a given curing time, the UCS of the specimens exhibited a diminished increase with the increasing ηCvi and an exponential correlation can be established; these exponential tendencies do not change in the case of ξ > 1 but become irregular in the case of ξ < 1. Therefore, the ηCvi (i.e., ξ = 1) was adopted for simplicity and an exponential function was formulated to fit the testing data at each curing time:
UCS ( η ,   C vi )   =   UCS ( η ,   C vi = 0   )   +   α UCS [ 1 exp ( η C vi / β UCS ) ]
where UCS(η, Cvi = 0) is the UCS of the untreated specimen and depends on the porosity. The αUCS and βUCS describe the diminished increase of the UCS with the ηCvi; they depend on the curing time and take into account the effects of curing on the porosity.
The UCS(η = 0.4, Cvi = 0) was fixed at 78 kPa for the untreated specimen based on the test results and a direct fitting of the four data sets gave βUCS = (8.7 ± 0.5) × 10−3. Given its small variation, βUCS was fixed at 8.7 × 10⁻³, independent of the curing time. The adjusted fitting is presented in Figure 17a, and the dependence of αUCS on the curing time is shown in Figure 17b. The αUCS also presents a diminished increase with the curing time and an exponential function can be formulated:
α UCS ( t )   =   α UCS ( t   =   0 )   +   λ UCSt [ 1 exp ( t / γ UCSt ) ]
where, αUCS(t = 0) is the αUCS for the non-cured specimen. The λUCSt and γUCSt describe the diminished increase of αUCS with the curing time. The αUCS(t = 0), λUCSt, and γUCSt were fitted to be 341 kPa, 1412 kPa, and 12.7 d, respectively (see Figure 17b).
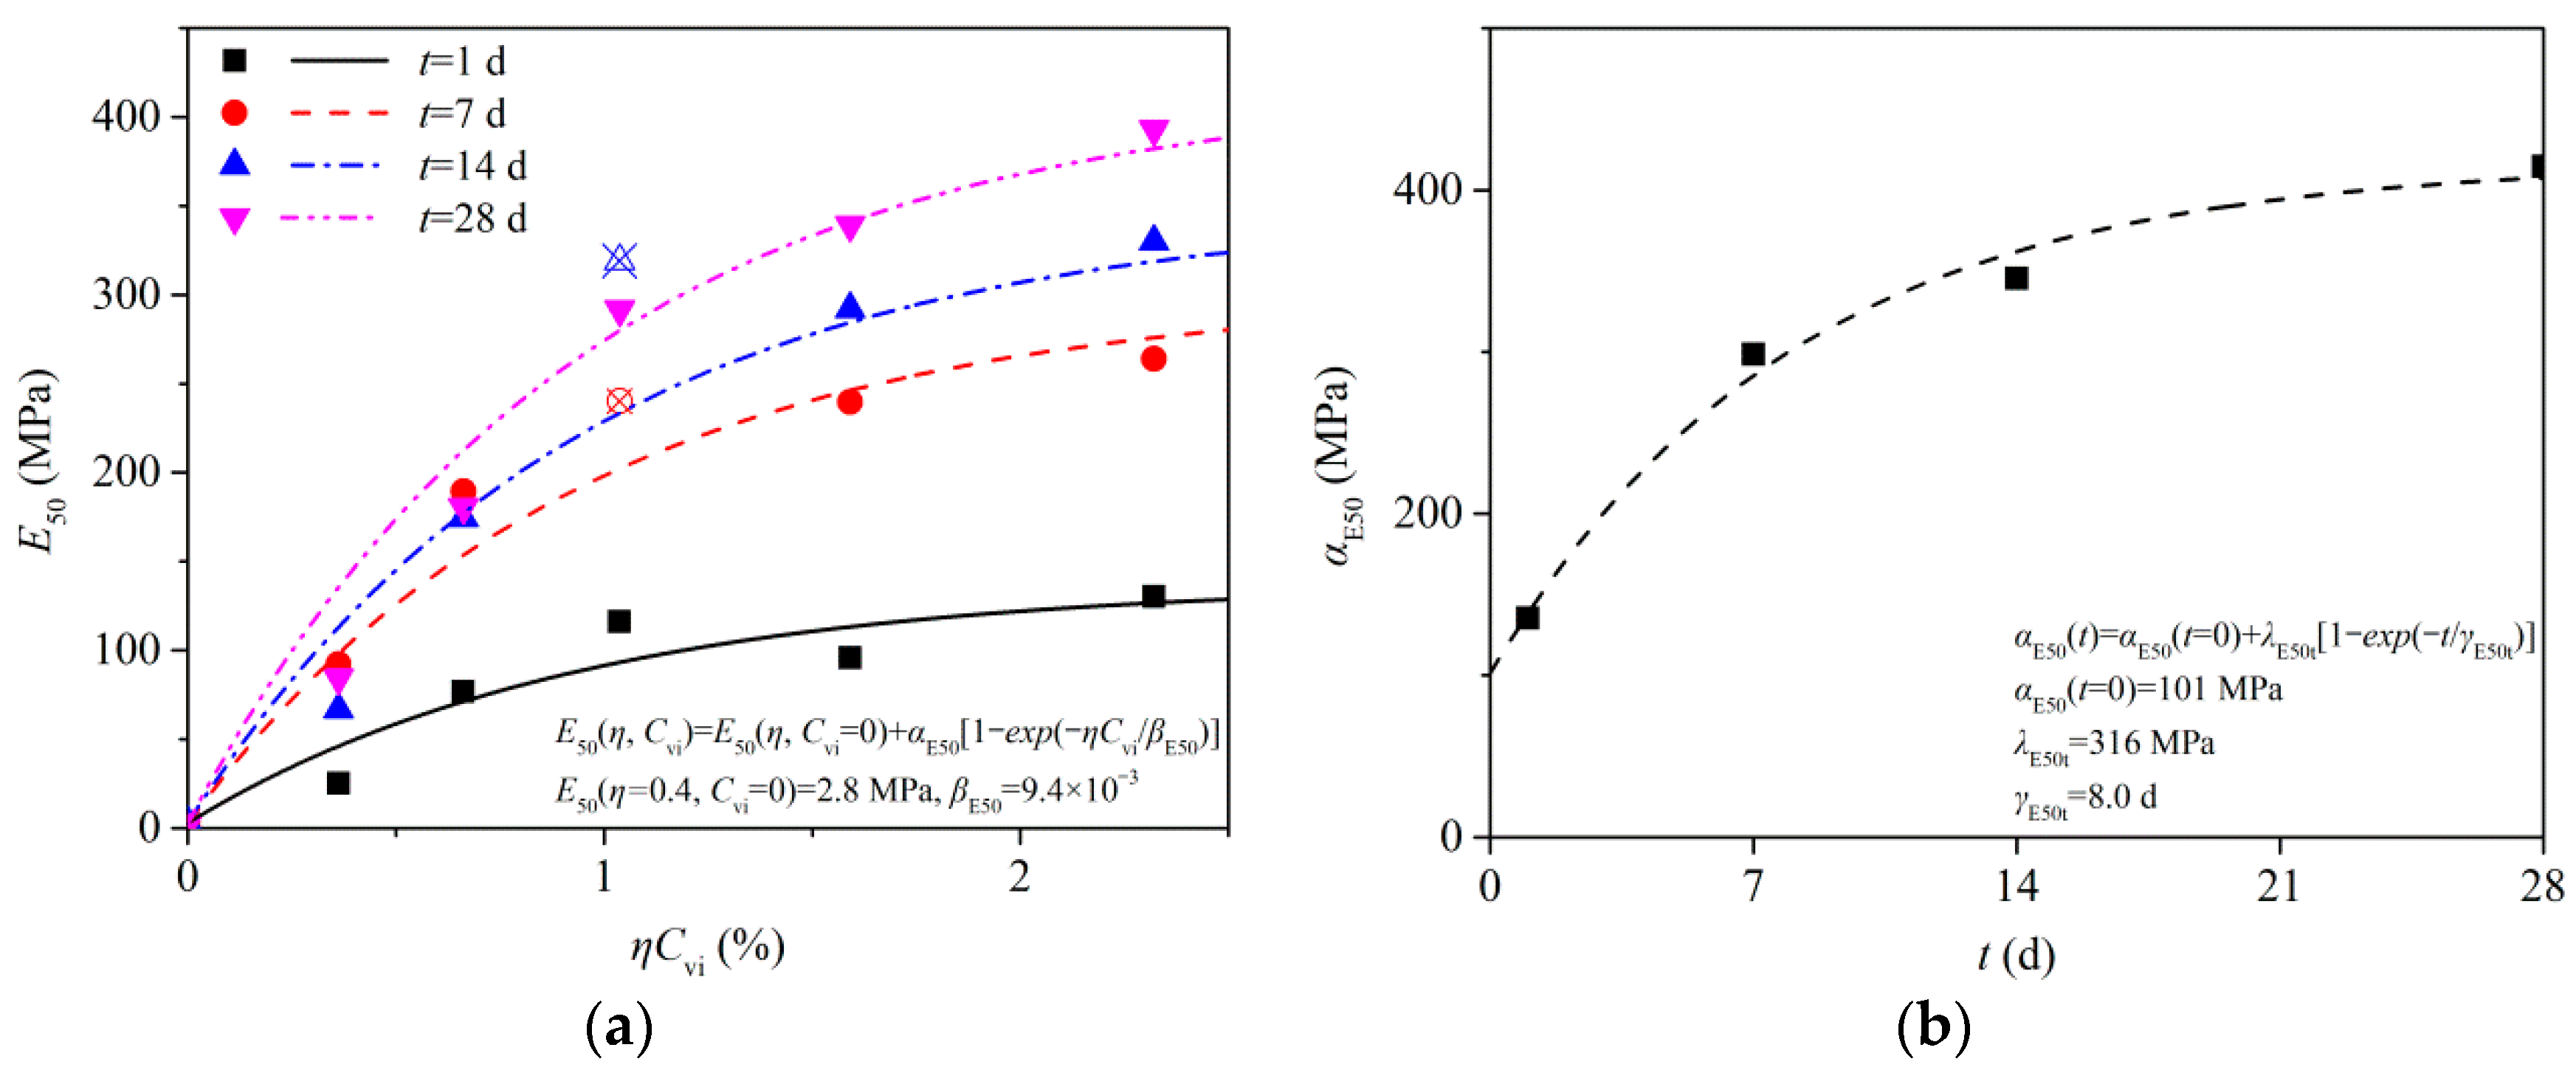
Given the same experimental trends as that of UCS, the secant modulus of the saturated treated specimens was predicted based on the E50ηCvi relationship in Figure 18a:
E 50 ( η ,   C vi )   =   E 50 ( η ,   C vi =   0 )   +   α E 50 [ 1 exp ( η C vi / β E 50 ) ] .
Similarly, E50(η = 0.4, Cvi = 0) was fixed at 2.8 MPa for the saturated untreated specimen, and a direct fitting of the four data sets gave βE50 = (9.4 ± 1.8) × 10−3. Despite its slightly larger variation than that of the βUCS, βE50 was fixed at 9.4 × 10⁻³ for the four curing times. The adjusted fitting is plotted in Figure 18a, and the dependence of αE50 on the curing time is shown in Figure 18b. The αE50 demonstrates a diminished increase with the curing time and an exponential function was established:
α E 50 ( t )   =   α E 50 ( t   =   0 )   +   λ E 50 t [ 1 exp ( t / γ E 50 t ) ]
where αE50(t = 0) is the αE50 for the non-cured specimen. The λE50t and γE50t describe the diminished increase of αE50 with the curing time. The αE50(t = 0), λE50t, and γE50t were fitted to be 101 MPa, 316 MPa, and 8.0 d, respectively (see Figure 18b).
It is noted that the βUCS and βE50 are of comparable values. Hence, an approximate value of β = 0.009 can be adopted for the βUCS and βE50. An integrated formula can be established to predict the strength and stiffness of the saturated cement-treated GRS:
Φ ( η ,   C vi )   = Φ   (   η ,   C vi =   0 )   +   α ( t ) [ 1 exp ( η C vi / β ) ]
α ( t )   =   α ( t   =   0 )   +   λ t [ 1 exp ( t / γ t ) ]
where Φ(η, Cvi = 0) is the strength and stiffness of the saturated untreated specimen. The parameter α describes the increase of the strength and stiffness with the ηCvi, and β adjusts its diminished trends. However, α still depends on the curing time and needs to be determined via Equations (2) and (4).

4.2. Effect of Cement Treatment on Oedometric Compression Behaviour

The cementation induced by C–S–H would deteriorate to varying degrees during the loading of a cured specimen. The complete destruction of the cementation at high stress was supposed to yield a consistent intrinsic compression line (ICL) or paralleled ICLs for weakly cemented soils [45,46,47], however, this may not be the case for strongly cemented soils. Figure 19 shows the integrated plots of the e−logσv relationship during successive loading of the saturated untreated and cement-treated specimens. The ICL of the saturated untreated specimen was presented as a reference, and the oedometric compression curves of the saturated treated specimens were extrapolated to judge the potential convergence or parallelism of ICLs at high stress. The oedometric compression curve of the untreated specimen intersects those of the treated specimens due to its highest initial void ratio and compressibility. This is also the case at Cvi = 1% due to its secondary initial void ratio and much higher compressibility when compared to the cases of Cvi = 2–5% (see Figure 11a). In the case of Cvi = 1%, the ICL of the specimen cured to 28 d is likely to parallel with that of the untreated specimen at high stress. In the case of Cvi = 2–5%, the ICLs of the specimens cured to 7 d and 28 d tend to parallel each other at high stress despite the initial void ratio decreasing with the cement content. This resulted in an overall increase of the vertical yielding pressure with the cement content in the range of Cvi = 2–5% (see Figure 11c).
The deterioration of the soil cementation can also be judged via the evolution of the compression index upon compression. The compression index (Cc) at a vertical pressure of σv is calculated by:
C c ( σ vi )   = ( e i + 1 e i ) / ( log σ v , i + 1 log σ v , i )
where ei is the void ratio of the specimen after being loaded to σv,i.
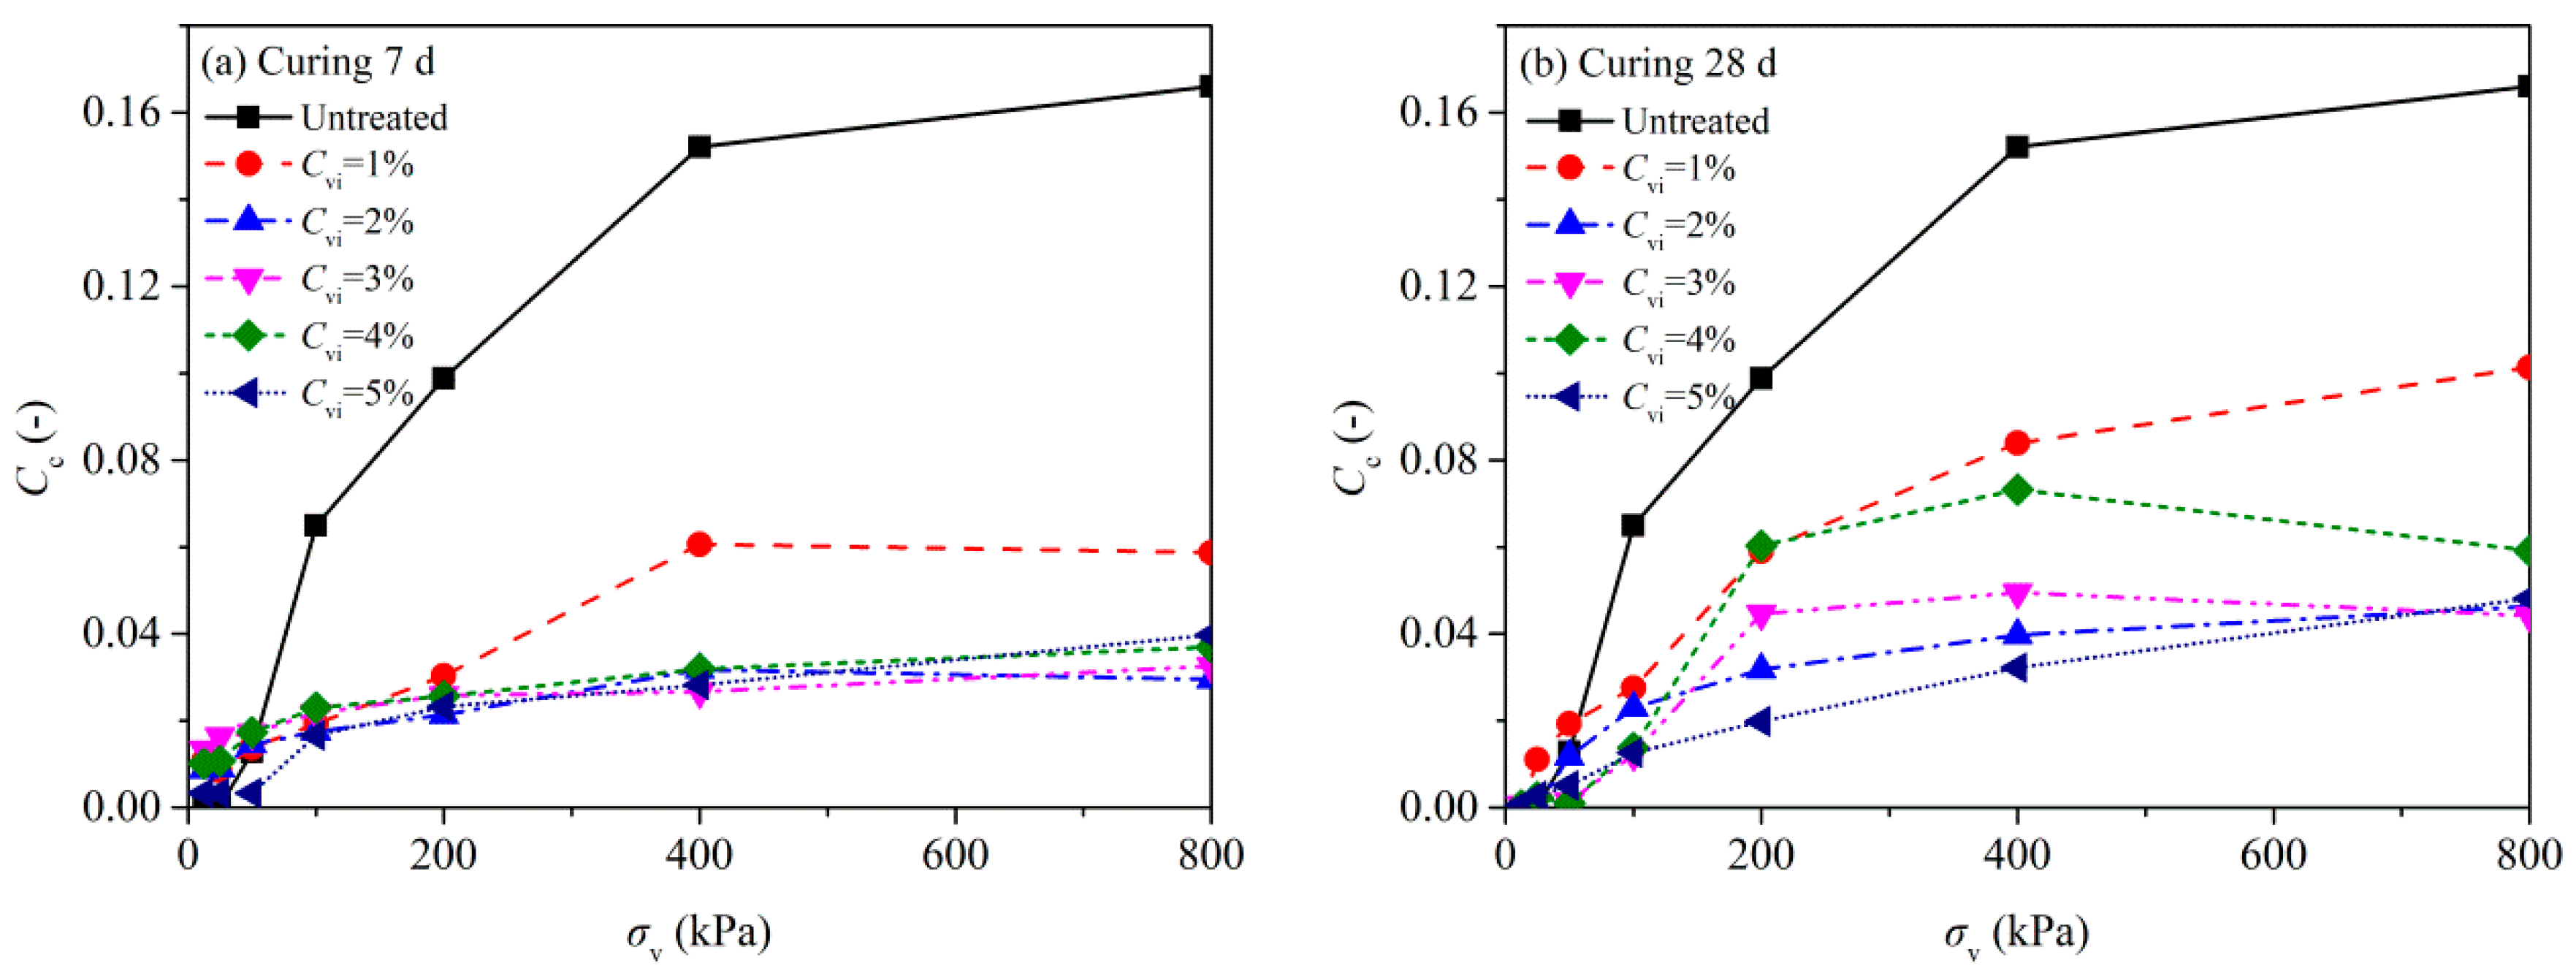
The evolution of the compression index during successive loading of the specimens is shown in Figure 20. In all the cases, a diminishing increase of the compression index with the vertical pressure was revealed, indicating a gradual approach of the specimens into the normal consolidation state; this is a consequence of the breakage of the interparticle cementation and rearrangement of the discrete soil particles upon compression. In addition, for the specimens cured to 7 d, the difference in the compression index is not distinct in the case of Cvi ≥ 2% compared to the case of Cvi ≤ 1%; this may be because the interparticle cementation was not fully established after curing to 7 d and the differences in the compressibility depend mainly on the presence and types of C–S–H (see Figure 13). The interparticle cementation may have been fully established after the specimens were cured to 28 d and, in this case, the compression index at a given vertical pressure depends largely on the cement content. Nevertheless, the compression index tends to converge at high vertical pressures in the case of Cvi ≥ 2%.

4.3. Effect of Cement Treatment on Pore Structure

To further quantify the effects of cement treatment on pore structure, a detailed analysis must be performed based on the MIP results. The volumetric constitutions of the as-compacted untreated and cement-treated specimens are illustrated in Figure 21. For a given cement content, various void ratios of the as-compacted specimen are defined as:
e Mi 0 = V vMi 0 / ( V si 0 + V s 0 , GRS )
e mi 0 = V vmi 0 / ( V si 0 + V s 0 , GRS )
e i 0 = e Mi 0 + e mi 0
where VvMi0 and Vvmi0 are the volumes of the macro- and micro-pores in an as-compacted specimen, respectively. Vsi0 and Vs0,GRS are the volumes of the solid particles constituting the cement and GRS components in an as-compacted specimen, respectively.
Additionally, the volumetric cement content was previously defined as:
C vi = V si 0 / ( V si 0 + V s 0 , GRS ) .
For the untreated specimen, the macro- and micro-void ratios that followed confined wetting were determined based on the MIP results (see Figure 15). Given the non-swelling nature of Kaolinite, it is likely that the pore structure of the GRS altered slightly upon confined wetting; this is evidenced by MIP results that the intruded void ratio of the saturated untreated specimen is close to its initial void ratio (see Figure 16). Hence, the macro- and micro-void ratios of the as-compacted untreated specimen are adopted as:
e M 0 , GRS = V vM 0 , GRS / V s 0 , GRS = 0.35
e m 0 , GRS = V vm 0 , GRS / V s 0 , GRS = 0.32
where VvM0,GRS and Vvm0,GRS are the volumes of the macro- and micro-pores in an as-compacted untreated specimen, respectively.
Moreover, the GRS components in all the as-compacted specimens were scheduled to an identical dry density of 1.58 Mg/m3 (which gives e0,GRS = 0.67); therefore, the following correlations can be established according to Figure 21:
V vMi 0 , GRS / V si 0 , GRS =   V vM 0 , GRS / V s 0 , GRS = e M 0 , GRS
V vmi 0 , GRS / V si 0 , GRS =   V vm 0 , GRS / V s 0 , GRS = e m 0 , GRS
where VvMi0,GRS and Vvmi0,GRS are the volumes of the macro- and micro-pores of the GRS component in an as-compacted treated specimen, respectively. The Vsi0,GRS is the volume of the solid particles of the GRS component in an as-compacted treated specimen.
Finally, the macro- and micro-void ratios of the as-compacted treated specimens are derived as:
e Mi 0 =   V vMi 0 / ( V si 0 + V si 0 , GRS )   =   ( 1 C vi ) e M 0 , GRS
e mi 0 =   V vmi 0 / ( V si 0 + V si 0 , GRS )   =   ( 1 C vi ) e m 0 , GRS
During the curing of a treated specimen, the hydration of its cement component modifies the pore structure in three possible ways: (i) the formation of C–S–H and the micro-pores within the C–S–H; (ii) the intrusion of C–S–H into the macro- and micro-pores between the quasicrystals and clay lamellae (see Figure 13b,c); and (iii) a wrapping of the quasicrystals by the C–S–H to form aggregates and the emergence of the macro-pores (between the aggregates) and micro-pores (within the aggregates) (see Figure 13d–f). The C–S–H was regarded as a porous medium with nano-scale pores of 0.5–2.5 nm [48]. The minimum pore size that the MIP test can detect is 3 nm; hence, the formation of C–S–H produced non-detectable pores (sorted into the micro-pores) within the C–S–H. In addition, it was concluded that the porosity of C–S–H (ηCSH = Vv,CSH/VCSH, where VCSH and Vv,CSH are the volumes of C–S–H and the pores within the C–S–H, respectively) in Portland cement paste had a fixed value of 0.28 [48]. Given the small cement dosage, changes in the volume of the solid particles (particularly the cement particles) upon hydration are ignored, and the void ratio of the non-detectable micro-pores in a cured specimen is estimated by:
e m , CSH   =   V v , CSH / ( V si 0 +   V s 0 , GRS )   =   η CSH / ( 1 η CSH ) C vi .
As almost all the pores in the GRS component can be detected via MIP tests (as was revealed in Figure 15), the first mechanism is responsible for the difference between the intruded void ratio and (total) void ratio of the treated specimens after curing. Hence, the void ratios and micro-void ratios of the saturated treated specimens can be calculated by:
e   =   e in +   e m , CSH
e m =   e e M .
The macro- and micro-void ratios and (total) void ratios of the as-compacted and saturated specimens cured to 28 d are presented in Figure 22a. In the case of Cvi ≤ 2%, the macro- and micro-void ratios decreased successively as the cement content increased; this may be because the occupation of the macro- and micro-pores by the C–S–H (i.e., the second mechanism) surpassed the formation of the micro-pores within the C–S–H (i.e., the first mechanism) and the emergence of the aggregates (i.e., the third mechanism) is invalid in this case (as was revealed in Figure 13b,c). As the volumetric cement content increased from 2% to 4%, aggregates gradually formed (see Figure 13d,e), and the macro- and micro-void ratios started to increase; as long as the second mechanism dominated, the macro- and micro-void ratios would be lower than their initial values. As the volumetric cement content exceeded 4%, the dual-porosity characteristic of the cured specimens became remarkable (see Figure 13f). In this case, the third mechanism is believed to dominate and the macro- and micro-void ratios of the cured specimens exceed their initial values.
The changes in the macro-, micro-, and total void ratios after the curing and confined wetting of the treated specimens are shown in Figure 22b. As the cement content increases, the macro-, micro-, and total void ratios of the specimens decreased to 73–76% of their initial values at Cvi = 2% and recovered to their initial states at Cvi = 4%. The macro-, micro-, and total void ratios of the specimens would exceed their initial values in the case of Cvi > 4%. Hence, in a microscopic view, volumetric cement contents of 2–3% are suggested for treating the GRS due to producing the densest pore structure after curing.

5. Conclusions

Mechanical and microscopic tests were conducted on the GRS treated with Portland fly-ash cement, and the effects of cement treatment on the uniaxial and oedometer compression behaviors and the soil structure were analyzed. The following conclusions were drawn based on the findings of this study:
(1) The UCS and secant modulus increased linearly with the volumetric cement content in the range of Cvi ≤ 3% and with the curing time in t ≤ 7–14 d. As the volumetric cement content exceeded 3% or the curing time exceeded 14 d, the increase of the UCS and secant modulus with the cement content and curing time diminished. A unified formula using ηCvi as the key parameter can estimate the UCS and secant modulus of the cement-treated specimens based on the untreated states.
(2) Compressibility decreased markedly as the volumetric cement content increased to 2% and then varied slightly as the cement content further increased. Vertical yielding pressure decreased with the cement content in the range of Cvi < 2–3%, followed by a continuous increase as the cement content further increased. The diminished increase of the compressibility with the vertical pressure indicated the breakage of the interparticle cementation and rearrangement of the soil particles upon compression.
(3) The C–S–H is fibrous (C–S–H of Type Ⅰ) in the case of Cvi = 1–2% and becomes reticular (C–S–H of Type Ⅱ) in the case of Cvi = 3–5%. The soil structure remained of single-porosity in the case of Cvi < 2% and a dual-porosity structure formed as the volumetric cement content exceeded 3%.
(4) The mechanisms of soil structure to be modified through cement treatment were supposed in three aspects: (i) the formation of C–S–H and non-detective micro-pores within C–S–H; (ii) the intrusion of C–S–H into macro- and micro-pores; and (iii) the emergence of aggregates along with inter- and intra-aggregate pores. The macro- and micro-void ratios decreased with the cement content in the case of Cvi ≤ 2%, indicating that the role of the second aspect surpassed that of the first aspect (the third aspect is invalid) in this case. The macro- and micro-void ratios started to increase due to the third aspect in the case of Cvi ≥ 3% and exceeded their initial values as the third aspect began to dominate in the case of Cvi > 4%. However, the coupling effects of the second and third aspects on the macro- and micro-void ratios need to be quantified in future investigations.
(5) A volumetric cement content of 2–3% is suggested for treating the GRS (a silty sand) based on mechanical and microstructural characteristics of the saturated treated specimens. Volumetric cement contents lower than 2% provide inadequate interparticle cementation, whereas volumetric cement contents higher than 3% are inefficient as the inter-aggregate pores emerge along with the aggregates. In view of economic efficiency and environmental protection, combined treatment of cement and green binders is needed to reduce the cement content to its lower level and obtain more favorable physicomechanical properties in a given geotechnical context.

Author Contributions

Writing—original draft: X.D.; Writing—review & editing: X.B.; Validation: H.C.; Supervision: C.X.; Conceptualization: X.C. All authors have read and agreed to the published version of the manuscript.

Funding

This research was supported by the National Natural Science Foundation of China (Grant Nos. 52022060, 42202298), Postdoctoral Science Foundation of China (Grant No. 2021M702234), and Joint Fund of National Natural Science Foundation of China-Railway Corporation for basic research of high-speed railway (Grant No. U1934208).

Institutional Review Board Statement

Not applicable.

Informed Consent Statement

Not applicable.

Data Availability Statement

Not applicable.

Conflicts of Interest

The authors declare no conflict of interest.

References

  1. Zhao, Y.; Sun, X.; Wen, T.; Chen, R.; Huang, L. Micro-structural evolution of granite residual soil under external loading based on X-ray micro-computed tomography. KSCE J. Civ. Eng. 2021, 25, 2836–2846. [Google Scholar] [CrossRef]
  2. Firoozi, A.A.; Olgun, C.G.; Firoozi, A.A.; Baghini, M.S. Fundamentals of soil stabilization. INT J. Geomech. 2017, 8, 26. [Google Scholar] [CrossRef] [Green Version]
  3. Smaida, A.; Mekerta, B.; Gueddouda, M.K. Physico-mechanical stabilization of a high swelling clay. Constr. Build. Mater. 2021, 289, 123197. [Google Scholar] [CrossRef]
  4. Feng, R.; Wu, L.; Liu, D.; Wang, Y.; Peng, B. Lime- and cement-treated sandy lean clay for highway subgrade in China. J. Mater. Civil Eng. 2020, 32, 4019335. [Google Scholar] [CrossRef]
  5. Khalid, U.; Liao, C.C.; Ye, G.; Yadav, S.K. Sustainable improvement of soft marine clay using low cement content: A multi-scale experimental investigation. Constr. Build. Mater. 2018, 191, 469–480. [Google Scholar] [CrossRef]
  6. Wu, J.; Liu, L.; Deng, Y.; Zhang, G.; Zhou, A.; Wang, Q. Distinguishing the effects of cementation versus density on the mechanical behavior of cement-based stabilized clays. Constr. Build. Mater. 2021, 271, 121571. [Google Scholar] [CrossRef]
  7. Croft, J.B. The influence of soil mineralogical composition on cement stabilization. Geotechnique 1967, 17, 119–135. [Google Scholar] [CrossRef]
  8. Williamson, S.; Cortes, D.D. Dimensional analysis of soil–cement mixture performance. Geotech. Lett. 2014, 4, 33–38. [Google Scholar] [CrossRef]
  9. Sasanian, S.; Newson, T.A. Basic parameters governing the behaviour of cement-treated clays. Soils Found. 2014, 54, 209–224. [Google Scholar] [CrossRef] [Green Version]
  10. Ho, T.; Chen, W.; Yin, J.; Wu, P.; Tsang, D.C.W. Stress-strain behaviour of cement-stabilized Hong Kong marine deposits. Constr. Build. Mater. 2021, 274, 122103. [Google Scholar] [CrossRef]
  11. Yao, K.; Xiao, H.; Chen, D.; Liu, Y. A direct assessment for the stiffness development of artificially cemented clay. Geotechnique 2019, 69, 741–747. [Google Scholar] [CrossRef]
  12. Nazari, Z.; Tabarsa, A.; Latifi, N. Effect of compaction delay on the strength and consolidation properties of cement-stabilized subgrade soil. Transp. Geotech. 2021, 27, 100495. [Google Scholar] [CrossRef]
  13. Wei, X.; Ku, T. New design chart for geotechnical ground improvement: Characterizing cement-stabilized sand. Acta Geotech. 2020, 15, 999–1011. [Google Scholar] [CrossRef]
  14. Choo, H.; Nam, H.; Lee, W. A practical method for estimating maximum shear modulus of cemented sands using unconfined compressive strength. J. Appl. Geophys. 2017, 147, 102–108. [Google Scholar] [CrossRef]
  15. Ling, J.; Lin, S.; Qian, J.; Zhang, J.; Han, B.; Liu, M. Continuous compaction control technology for granite residual subgrade compaction. J. Mater. Civil Eng. 2018, 30, 04018316. [Google Scholar] [CrossRef]
  16. Zhou, Y.H.; Wang, Y.H.; Qing, Q.X.; He, Q. Experimental study of long-term stability of improved granitic residual soil subgrade for high-speed railway. Rock Soil Mech. 2011, 32, 596–602. (In Chinese) [Google Scholar]
  17. Yi, W.; Wang, Y. An experimental study on engineering characteristics of improved weathered granite soil for a high-speed railway subgrade in south China. J. Test. Eval. 2017, 45, 20140358. [Google Scholar] [CrossRef]
  18. Zhou, Y.H.; Wang, Y.H.; Qing, Q.X.; He, Q. Experimental study of appropriateness of improved granitic residual soil for high-speed railway subgrade. Chin. J. Rock Mech. Eng. 2011, 30, 625–634. (In Chinese) [Google Scholar]
  19. Chamling, P.K.; Biswal, D.R.; Sahoo, U.C. Effect of moulding water content on strength characteristics of a cement-stabilized granular lateritic soil. Innov. Infrastruct. Solut. 2021, 6, 82. [Google Scholar] [CrossRef]
  20. MolaAbasi, H.; Naderi Semsani, S.; Saberian, M.; Khajeh, A.; Li, J.; Harandi, M. Evaluation of the long-term performance of stabilized sandy soil using binary mixtures: A micro- and macro-level approach. J. Clean. Prod. 2020, 267, 122209. [Google Scholar] [CrossRef]
  21. He, X.; Chen, Y.; Tan, X.; Wang, S.; Liu, L. Determining the water content and void ratio of cement-treated dredged soil from the hydration degree of cement. Eng. Geol. 2020, 279, 105892. [Google Scholar] [CrossRef]
  22. Pu, S.; Zhu, Z.; Song, W.; Wan, Y.; Wang, H.; Song, S.; Zhang, J. Mechanical and microscopic properties of cement stabilized silt. KSCE J. Civ. Eng. 2020, 24, 2333–2344. [Google Scholar] [CrossRef]
  23. Horpibulsuk, S.; Rachan, R.; Chinkulkijniwat, A.; Raksachon, Y.; Suddeepong, A. Analysis of strength development in cement-stabilized silty clay from microstructural considerations. Constr. Build. Mater. 2010, 24, 2011–2021. [Google Scholar] [CrossRef]
  24. Cardoso, R.; Ribeiro, D.; Néri, R. Bonding effect on the evolution with curing time of compressive and tensile strength of sand-cement mixtures. Soils Found. 2017, 57, 655–668. [Google Scholar] [CrossRef]
  25. Cardoso, R. Porosity and tortuosity influence on geophysical properties of an artificially cemented sand. Eng. Geol. 2016, 211, 198–207. [Google Scholar] [CrossRef]
  26. Ural, N. Effects of additives on the microstructure of clay. Road Mater. Pavement. 2015, 17, 104–119. [Google Scholar] [CrossRef]
  27. ASTM D422-63(2007)e2; Standard Test Method for Particle-Size Analysis of Soils. ASTM International: West Conchhocken, PA, USA, 2007.
  28. ASTM D854-14; Standard Test Methods for Specific Gravity of Soil Solids by Water Pycnometer. ASTM International: West Conchhocken, PA, USA, 2014.
  29. GB/T 50123-2019Standard for Geotechnical Testing Method; Ministry of Housing and Urban-Rural Development of the People’s Republic of China: Beijing, China, 2019.
  30. ASTM D698-12(2021); Standard Test Methods for Laboratory Compaction Characteristics of Soil Using Standard Effort. ASTM International: West Conchhocken, PA, USA, 2021.
  31. ASTM D2487-17e1; Standard Practice for Classification of Soils for Engineering Purposes (Unified Soil Classification System). ASTM International: West Conchhocken, PA, USA, 2017.
  32. Alonso, E.E.; Pinyol, N.M.; Gens, A. Compacted soil behaviour: Initial state, structure and constitutive modelling. Geotechnique 2013, 63, 463–478. [Google Scholar] [CrossRef] [Green Version]
  33. Romero, E. A microstructural insight into compacted clayey soils and their hydraulic properties. Eng. Geol. 2013, 165, 3–19. [Google Scholar] [CrossRef]
  34. GB 175-2007Common Portland Cement; China National Standardization Management Committee: Beijing, China, 2007.
  35. Ulusay, R.; Hudson, J.A. (Eds.) The Complete ISRM Suggested Methods for Rock Characterization, Testing and Monitoring: 1974–2006; International Society for Rock Mechanics: Ankara, Turkey, 2007. [Google Scholar]
  36. Casagrande, A. The determination of pre-consolidation load and its practical significance. In Proceedings of the 1st International Conference on Soil Mechanics and Foundation Engineering, Cambridge, MA, USA, 22–26 June 1936. [Google Scholar]
  37. Cui, Y.J.; Delage, P. Yielding and plastic behaviour of an unsaturated compacted silt. Geotechnique 1996, 46, 291–311. [Google Scholar] [CrossRef]
  38. Mutaz, E.; Dafalla, M.A. Chemical analysis and X-ray diffraction assessment of stabilized expansive soils. Bull. Eng. Geol. Environ. 2014, 73, 1063–1072. [Google Scholar] [CrossRef]
  39. Lemaire, K.; Deneele, D.; Bonnet, S.; Legret, M. Effects of lime and cement treatment on the physicochemical, microstructural and mechanical characteristics of a plastic silt. Eng. Geol. 2013, 166, 255–261. [Google Scholar] [CrossRef]
  40. Gates, W.P.; Bouazza, A. Bentonite transformations in strongly alkaline solutions. Geotext. Geomembr. 2010, 28, 219–225. [Google Scholar] [CrossRef]
  41. Diamond, S. Hydraulic Cement Pastes: Their Structure and Properties; Cement and Concrete Association: Slough, UK, 1976. [Google Scholar]
  42. Consoli, N.C.; Cruz, R.C.; Floss, M.F.; Festugato, L. Parameters controlling tensile and compressive strength of artificially cemented sand. J. Geotech. Geoenviron. 2010, 136, 759–763. [Google Scholar] [CrossRef]
  43. Consoli, N.C.; Dalla Rosa, A.; Corte, M.B.; Lopes, L.D.S.; Consoli, B.S. Porosity-cement ratio controlling strength of artificially cemented clays. J. Mater. Civil Eng. 2011, 23, 1249–1254. [Google Scholar] [CrossRef]
  44. Consoli, N.C.; Foppa, D. Porosity/cement ratio controlling initial bulk modulus and incremental yield stress of an artificially cemented soil cured under stress. Geotech Lett. 2014, 4, 22–26. [Google Scholar] [CrossRef]
  45. Horpibulsuk, S.; Rachan, R.; Suddeepong, A.; Liu, M.D.; Du, Y.J. Compressibility of lightweight cemented clays. Eng. Geol. 2013, 159, 59–66. [Google Scholar] [CrossRef]
  46. Rios, S.; Viana Da Fonseca, A.; Baudet, B.A. Effect of the porosity/cement ratio on the compression of cemented soil. J. Geotech. Geoenviron. 2012, 138, 1422–1426. [Google Scholar] [CrossRef] [Green Version]
  47. Kasama, K.; Zen, K.; Iwataki, K. Undrained shear strength of cement-treated soils. Soils Found. 2006, 46, 221–232. [Google Scholar] [CrossRef]
  48. Powers, T.C. Physical properties of cement paste. In Proceedings of the Fourth International Symposium on the Chemistry of Cement, Washington, DC, USA, 2–7 October 1960; pp. 577–609. [Google Scholar]
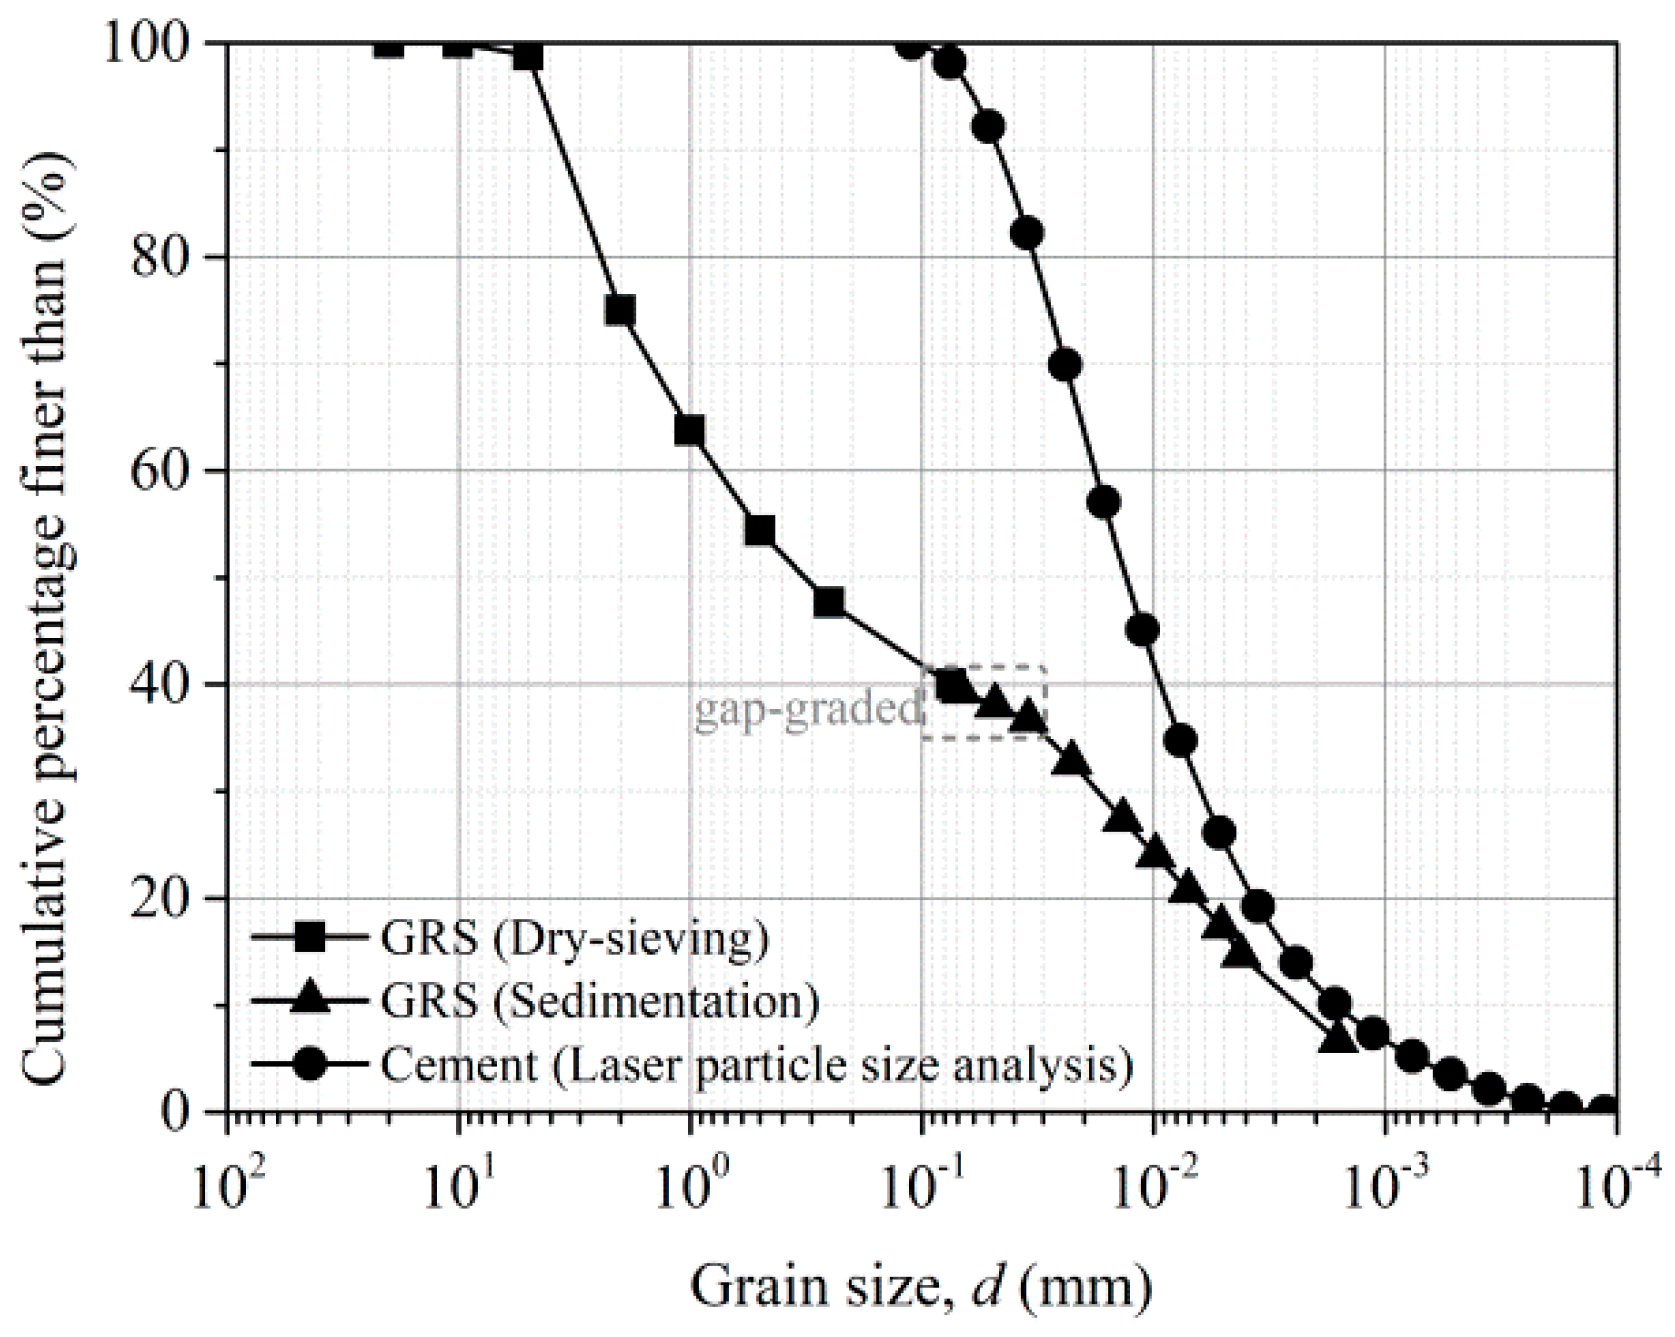
Figure 1. Grain-size distribution curves of GRS and Portland fly-ash cement.
Applsci 12 12549 g001
Figure 2. Compaction curve of GRS from standard Proctor test.
Applsci 12 12549 g002
Figure 3. The XRD profile of GRS finer than 0.5 mm and identification of basic mineral compositions.
Applsci 12 12549 g003
Figure 4. A SEM image of GRS finer than 0.5 mm and at a dry density of 1.44 Mg/m3.
Applsci 12 12549 g004
Figure 5. The XRD profile of Portland fly-ash cement and the identification of its basic mineral compositions.
Applsci 12 12549 g005
Figure 6. Stress–strain curves of saturated untreated and cement-treated GRSs at various cement contents and curing times.
Applsci 12 12549 g006
Figure 7. Uniaxial compressive strength (UCS) of saturated untreated and cement-treated GRSs at various cement contents and curing times. (a) Changes in UCS with cement content at various curing times; (b) Changes in UCS with curing time at various cement contents.
Applsci 12 12549 g007
Figure 8. Secant modulus (E50) of saturated untreated and cement-treated GRSs at various cement contents and curing times. (a) Changes in E50 with cement content at various curing times; (b) Changes in E50 with curing time at various cement contents.
Applsci 12 12549 g008
Figure 9. e−logσv relationship of saturated untreated GRS.
Applsci 12 12549 g009
Figure 10. e−logσv relationship of saturated cement-treated GRS. (a) Curing time = 7 d; (b) Curing time = 28 d.
Applsci 12 12549 g010
Figure 11. Compressibility and vertical yielding pressure of saturated untreated and cement-treated GRSs depending on cement content and curing time. (a) Compressibility; (b) Vertical yielding pressure.
Applsci 12 12549 g011
Figure 12. XRD profiles of saturated untreated and cement-treated GRSs cured to 28 d. (a) Identification of crystalline minerals; (b) Identification of C–S–H.
Applsci 12 12549 g012aApplsci 12 12549 g012b
Figure 13. SEM images of saturated untreated and cement-treated GRSs cured to 28 d.
Applsci 12 12549 g013
Figure 14. MIP results of saturated untreated and cement-treated GRSs cured to 28 d.
Applsci 12 12549 g014
Figure 15. Delimitation of macro- and micro-pores in saturated untreated GRS based on results of an intrusion–extrusion cycle.
Applsci 12 12549 g015
Figure 16. Initial void ratio, intruded void ratio, and macro-void ratio of saturated untreated and cement-treated GRSs cured to 28 d.
Applsci 12 12549 g016
Figure 17. Modeling of the UCS of saturated cement-treated GRS (Hollow symbol with cross indicates data excluded in the fitting). (a) Fitting of UCS at four curing times; (b) αUCS dependent on curing time.
Applsci 12 12549 g017
Figure 18. Modeling of E50 of saturated cement-treated GRS (Hollow symbol with cross indicates data excluded in the fitting). (a) Fitting of E50 at four curing times; (b) αE50 dependant on curing time.
Applsci 12 12549 g018
Figure 19. Integrated plot of the e−logσv relationship of saturated untreated and cement-treated GRSs. (a) Curing time = 7 d; (b) Curing time = 28 d.
Applsci 12 12549 g019
Figure 20. Compression index of saturated untreated and cement-treated GRSs depending on vertical pressure. (a) Curing time = 7 d; (b) Curing time = 28 d.
Applsci 12 12549 g020
Figure 21. Illustration of volumetric constitutions of an as-compacted specimen with different cement contents.
Applsci 12 12549 g021
Figure 22. Macro-, micro-, and total void ratios of as-compacted and cured cement-treated GRS depending on cement content (Hollow symbol indicates a curing time of 28 d). (a) Initial state and after curing to 28 d; (b) Difference between initial and cured states.
Applsci 12 12549 g022
Table 1. Basic physical properties of granite residual soil.
Gs (-)ωL (%)ωP (%)IP (-)ωopt (%)ρdmax (Mg/m3)
2.6453.530.722.818.81.58
Note: Gs = specific gravity; ωL = liquid limit; ωP = plastic limit; IP = plastic index; ωopt = optimum water content; and ρdmax = maximum dry density.
Table 2. Initial states of as-compacted untreated and cement-treated specimens.
Cvi (%)Cmi (%)ω0 (%)ρd0 (Mg/m3)e0 (-)η0 (-)ρs (-)Sr0 (%)
0018.81.5800.6710.4022.64074.0
11.9418.41.5950.6600.3982.64874.0
23.8518.11.6100.6490.3932.65574.0
35.7217.71.6260.6380.3892.66374.0
47.5617.41.6410.6270.3852.67074.0
59.3617.01.6560.6170.3812.67774.0
Note: Cvi = volume cement content; Cmi = mass cement content; ω0 = initial water content; ρd0 = initial dry density; e0 = inital void ratio; η0 = initial porosity; ρs =equivalent grain density; and Sr0 = initial degree of saturation.
Table 3. Arrangements for mechanical and microscopic tests.
Test TypesCvi (%)t (d)
UCT0, 1, 2, 3, 4, 51, 7, 14, 28
OCT0, 1, 2, 3, 4, 57, 28
XRD, SEM, MIP0, 1, 2, 3, 4, 528
Note: UCT= uniaxial compression test; OCT = oedometric compression test; Cvi = volume cement content; and t = curing time. All the cured specimens were saturated under confined conditions.
Publisher’s Note: MDPI stays neutral with regard to jurisdictional claims in published maps and institutional affiliations.