Article

CO2 Emission Analysis for Different Types of Electric Vehicles When Charged from Floating Solar Photovoltaic Systems

by
Abinands Ramshanker
1,
Suprava Chakraborty
2,*,
Devaraj Elangovan
2,
Hossam Kotb
3,*,
Kareem M. Aboras
3,
Nimay Chandra Giri
4,5 and
Ephraim Bonah Agyekum
6
1
School of Electrical Engineering, Vellore Institute of Technology (VIT), Vellore 632014, Tamil Nadu, India
2
TIFAC-CORE, Vellore Institute of Technology (VIT), Vellore 632014, Tamil Nadu, India
3
Department of Electrical Power and Machines, Faculty of Engineering, Alexandria University, Alexandria 21544, Egypt
4
Department of Electronics and Communication Engineering, Centurion University of Technology and Management, Jatni 752050, Odisha, India
5
Centre for Renewable Energy and Environment, Centurion University of Technology and Management, Jatni 752050, Odisha, India
6
Department of Nuclear and Renewable Energy, Ural Federal University Named after the First President of Russia Boris Yeltsin, 19 Mira Street, 620002 Ekaterinburg, Russia
*
Authors to whom correspondence should be addressed.
Appl. Sci. 2022, 12(24), 12552; https://doi.org/10.3390/app122412552
Submission received: 24 October 2022 / Revised: 28 November 2022 / Accepted: 28 November 2022 / Published: 7 December 2022
(This article belongs to the Special Issue Frontiers in Hybrid Vehicles Powertrain)

Abstract

:
Renewable energy and electric vehicle technology are the two pillars for achieving a sustainable future. Floating solar power plants use PV modules on water infrastructure to save the land and increase module efficiency. Furthermore, the reduction in evaporation saves water. Electric vehicles are one of the fastest-growing markets and the most successful technologies to combat the problem of energy and climate change. This research aims to construct a floating PV system on the lake of the Vellore Institute of Technology (VIT), to analyze electric vehicle performance and greenhouse gas (GHG) emissions when charged using the installed floating PV system. To address this, a 1.5 MWP floating PV system was simulated and analyzed using Helioscope software. When charged from the proposed floating PV plant, electric bikes, scooters, and cars saved CO2 emissions. When charged from a floating PV, E-bike, E-scooter, and E-car Net CO2 emissions became zero in 25.5, 12.1, and 7.7 months, respectively. After the aforementioned time periods, all three electric vehicle types were zero-emission vehicles. The required charge for all three types of vehicles (1,000,000 km) was analyzed using a floating PV system. E-bike, E-scooter, and E-car CO2 emission savings were −8,516,000 g/kWh, −328,000 g/kWh, and 525,600,000 g/kWh, respectively. All three types of electric vehicles can reduce CO2 emissions for nations that rely on renewable energy, but only electric cars save carbon emissions over fixed distances. Through this research, we finally conclude that electric cars reduce CO2 emissions the most compared to other electric vehicles.

1. Introduction

Climate change has led to habitable places turning into deserts as wildfires and heatwaves occur increasingly around the world [1]. The warming of the Arctic has resulted in the melting of permafrost, glacial retreat, and sea ice loss [2]. It has affected the environment in very extreme ways, from sea levels rising to species going extinct. Climate change has been referred to as one of the most dangerous threats to human health by the World Health Organization (WHO) [3]. One of the best ways to mitigate the negative effects of climate change is to reduce the use of internal combustion engine-based vehicles and by adopting electric vehicles (EVs). Along with that, another way to mitigate the effects of climate change is by adopting renewable energy sources. The world target regarding electricity generated per year should be wholly from renewables compared to 25% (7000 TWh/year) at present. Among the various renewable energy sources available, solar energy has been getting much attention. The total installed capacity of solar energy at present is 384 GW and by 2050, the installation target is 8519 GW [4].
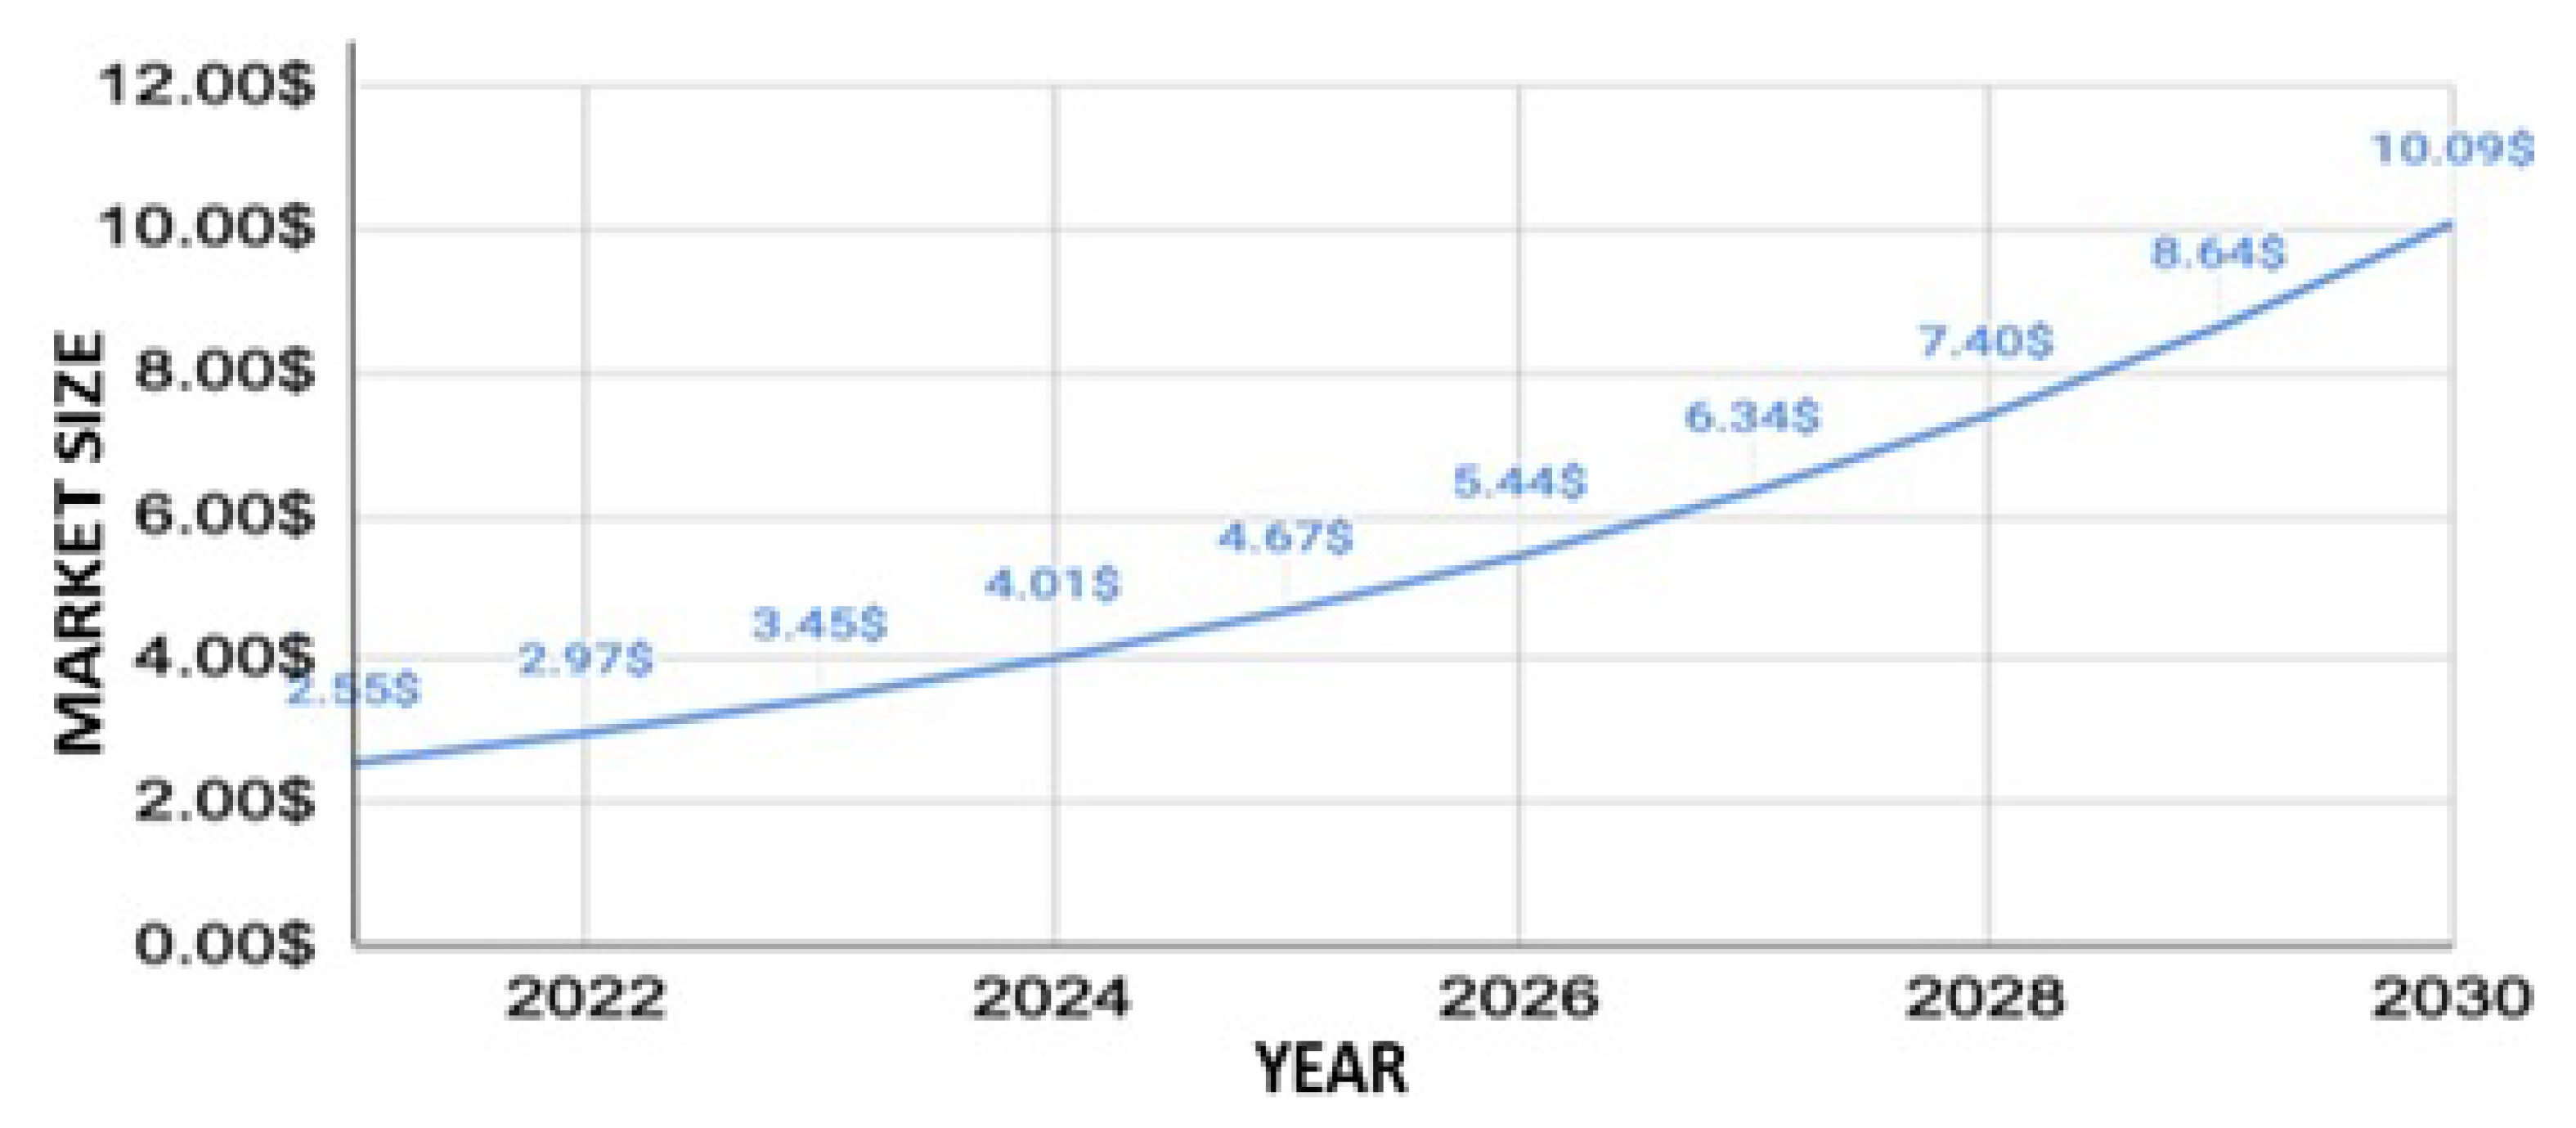
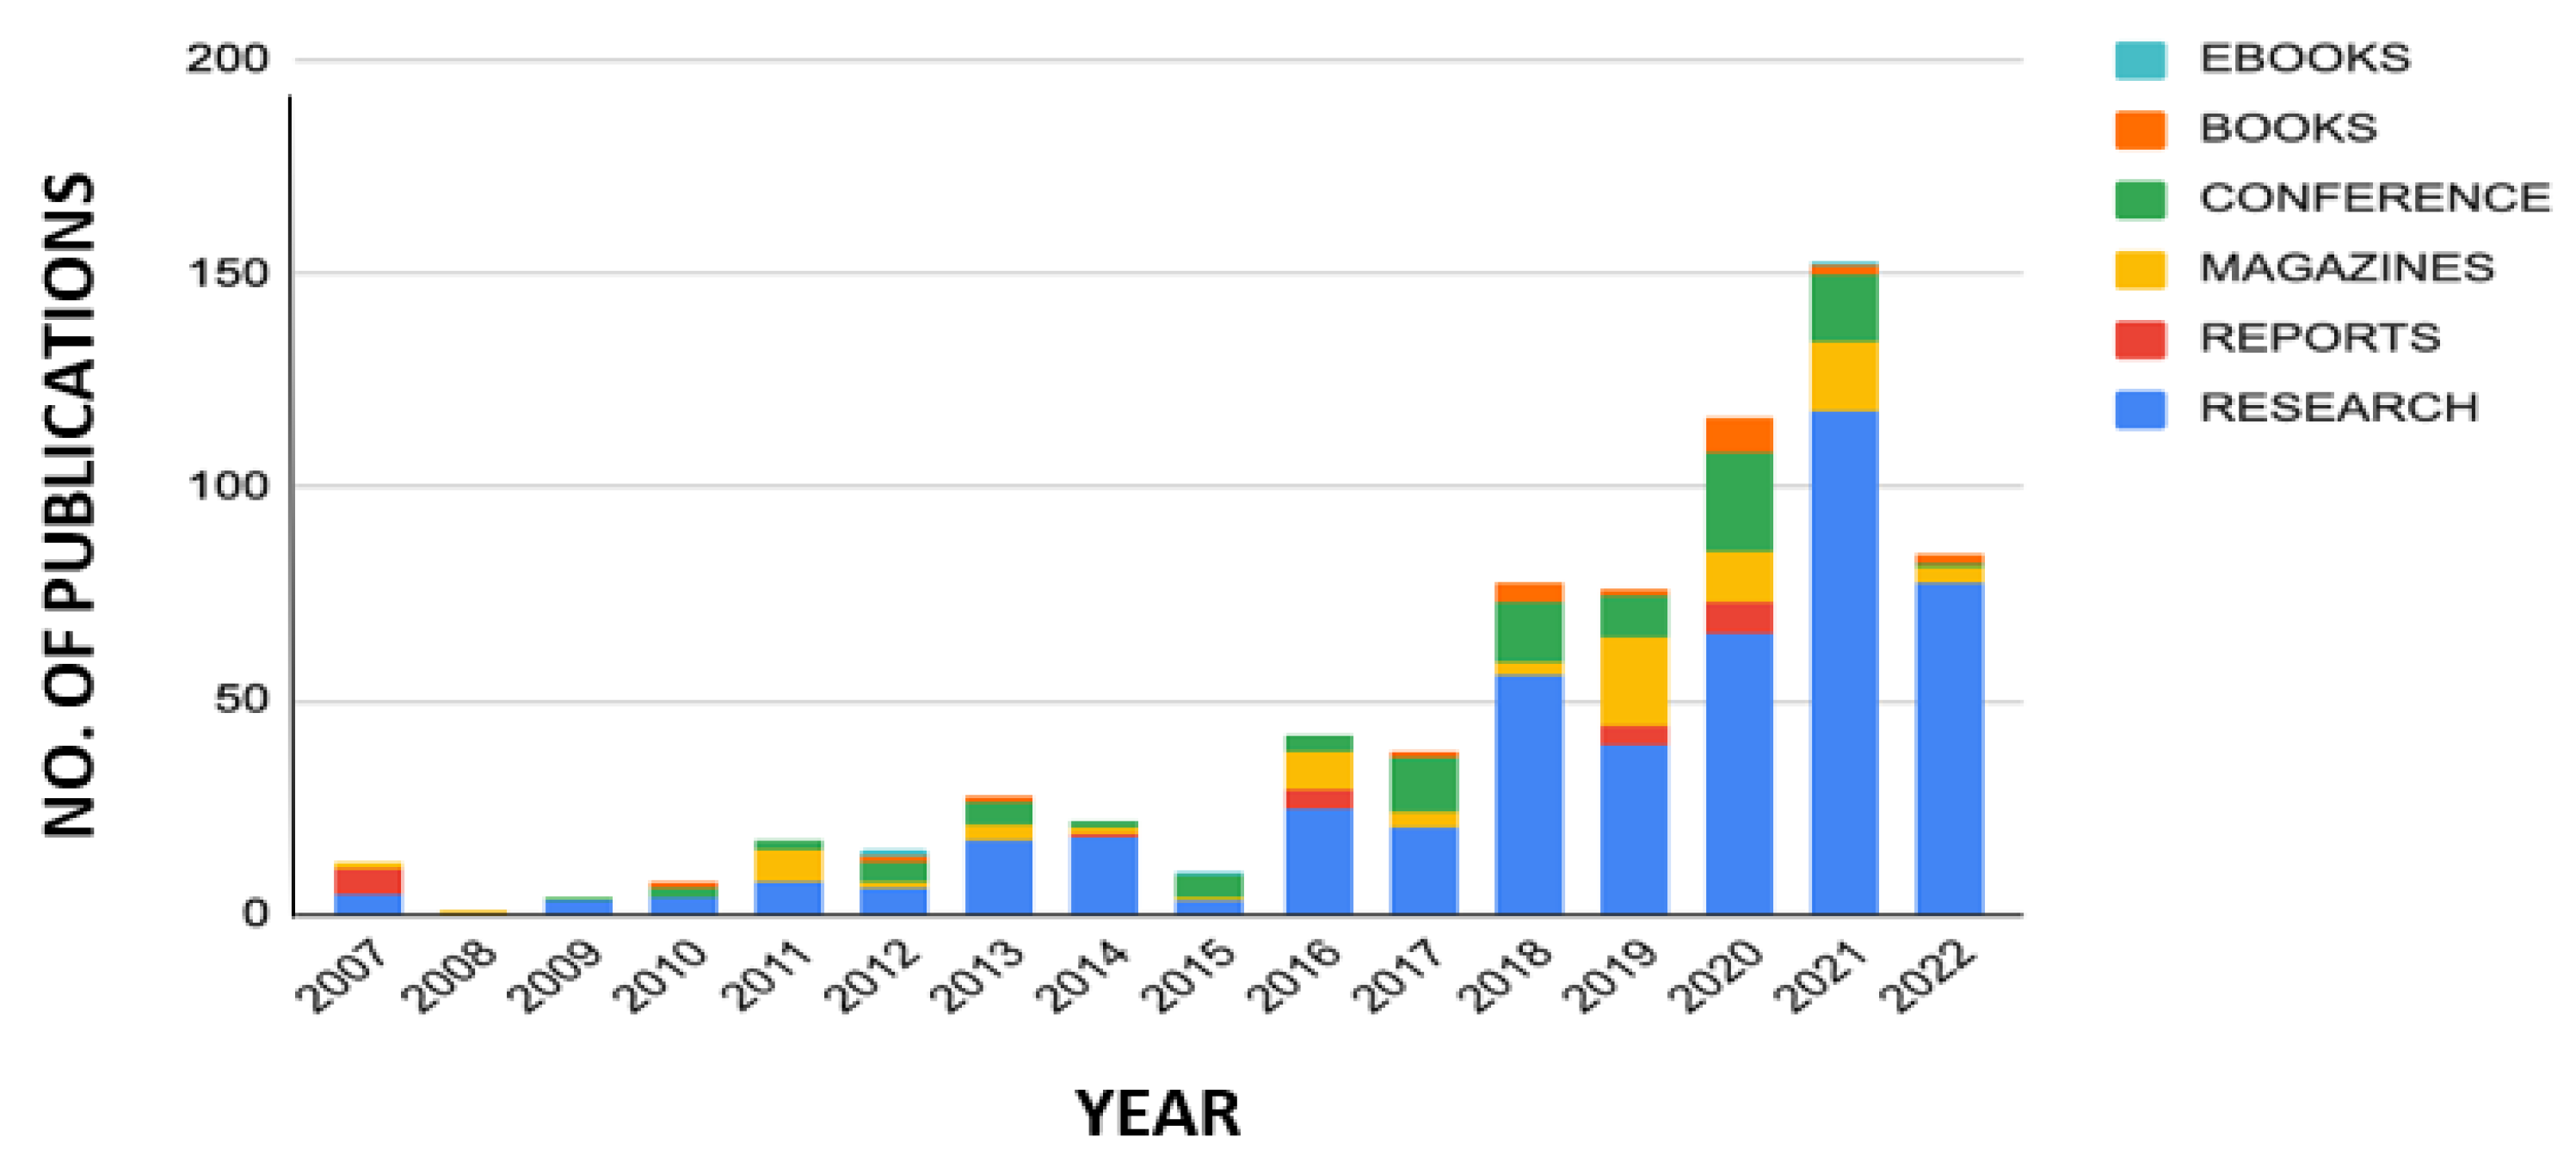
In recent years, a particular technology has been developed which involves fixing PV systems on canals, conduits, and channels. This technology is popularly called the floating solar PV system (FSPVS). The first proper FSPVS system was installed in 2007 in Aichi, Japan. It slowly began to increase with the yearly installed capacity reaching up to 1096 MWp per year. By the end of August 2020, the total global installed capacity of FSPVS would have reached 2.6 GWp. However, owing to COVID-19, installations were expected to decelerate in 2020, as seen in Figure 1 [5,6,7,8]. According to the report presented in [9], the worldwide floating solar market was valued at USD 2.55 billion in 2021 and is predicted to increase to USD 10.09 billion by 2030, with a compound annual growth rate (CAGR) of 16.5% between 2022 and 2030. This can be easily inferred from Figure 2. The number of research papers on floating PV systems in the last 15 years is shown in Figure 3. It is clear that FSPVS is an exponentially growing technology.
Due to favorable government laws and the benefits of zero land usage and reduced evaporation, the deployment of PV systems on water bodies is quickly rising. The FSPVS system consists of the floating system, the mooring system, the PV system, the wires, and the connections.
(a)
Floating system: The floating system is a combination of structure and floater. The PV system is mounted on top of the floating system.
(b)
Mooring system: A mooring system is any structure to which a vessel may be anchored using cables or anchors. Mooring prevents FSPVS components from spinning or floating away.
(c)
PV system: A PV system consists of PV modules and other power conditioning equipment for converting solar energy to electrical energy. In general, crystalline solar PV modules are utilized, although there is ongoing research into the type of PV modules installed in FSPVS. Sahu et al. [10] recently conducted an energy analysis of thin-film PV technology on land, water, and submerged systems, demonstrating the advantages of submerged installations.
Goswami et al. [11] conducted a thorough analysis of the various designs and architectures of floating FSPVS, as well as their economic implications. Theoretically, Sairam and Oliveria [12] have suggested numerous creative concepts for improving the performance of canal-top PV systems. The practical usefulness of these ideas, on the other hand, must be investigated. The influence of PV cover on water quality, water body ecology, and evaporation has been examined by Taye et al. [13]. Water bodies with excellent covering may have less of an influence on their environment. Figure 4 presents the structure and components of a PSPVS.
Many FPV projects have been researched in recent years. The most impactful ones have been the high-capacity projects. In [14], a study of a 10 MWp FPV plant in Bakreswar found that a floating solar PV plant has 10.2% more capacity than a land-based system. In [15], 13 Kwp, 45.1 MWp, and 163 MWp FPV were analyzed to show that they are cost-effective. In Mettur Dam, Tamil Nadu, a 150 MW FPV system with tracking on the dam of the hydro plant was analyzed and observed that it can reduce CO2 emissions by 135.92 ktonnes [16]. Recently, in [17], a 6513 MW FPV was installed in Uttar Pradesh’s Rajghat Dam to determine annual evaporation loss (or 0.9 L per kWh). The levelized cost of energy (LCOE) is USD 0.036/kWh (INR 2.61/kWh) with an IRR of 8.55%, which is encouraging for widespread FSPV deployment. This was the project with the highest installed capacity in 2022.
Along with advancements in renewable energy, EV has been the biggest change that is being made in the world to lead a sustainable and clean future. The global electric sales have gone up exponentially. It began with one million electric vehicles sold globally in 2015 and increased exponentially up to ten million in 2021 [18], China and Europe seem to be the leaders in the EV market followed by Europe. The first milestone we expect to reach is 20 million EVs by 2025. After that, low estimates mention 33 million EVs by 2030, whereas high estimates talk about 47 million EVs [19]. Figure 5 represents the EV market Size from 2010–2020 and the projected market size till 2030. The low indicates the case where sustainable development policies are not adopted while the high estimate of 47 million refers to the case when sustainable development is followed. This provides the motivation to explore the performance analysis of EVs when charged by a FSPVS.
A research study was conducted by the Department of Energy [20] in which the complete cradle-to-grave lifecycle GHG emissions of EVs were compared to the average gasoline vehicle, which reached the same results as in [19], that hybrid EVs (HEVs), PEVs, and shorter-range BEVs cut greenhouse gas emissions, whereas longer-range BEVs are equivalent to the typical gasoline vehicles. Michalek et al. [21] quantified the lifetime GHG emissions and criteria pollutants of electric cars as well as the benefits of oil substitution. They discovered that EVs with larger battery packs are more costly, heavier, and emit more emissions than HEVs and PEVs with smaller battery packs, and that they give less emission gains. In both the basic and optimistic cases, all EVs cut emissions when compared to the average gasoline car. Shen [22] discovered that the manufacture of the EV accounts for 18.5% of the energy and 17% of the greenhouse gas emissions, while consumption accounted for 81.5% and 83%, respectively. Each study that analyzes the whole cradle-to-grave energy and greenhouse gas (GHG) emissions of electric vehicles concludes that emissions from vehicle usage surpass emissions from vehicle production.
The literature highlights the need to drive towards a more sustainable future by reducing the CO2 emissions in EVs. This led to the motivation to utilize FSPVS to perform CO2 analysis of EVs. This has not yet been explored in the literature.

1.1. Contribution

At present, the literature on Floating PV systems focuses mostly on installation and design approaches, but there has been nothing in the literature examining the system’s benefits when charging electric vehicles. The implementation of EVs cannot help greatly towards the reduction in CO2 emissions until or unless they are charged from a green grid instead of a conventional thermal grid. In this paper, a FSPVS of 1.5 MWp capacity has been designed and simulated at the natural lake of VIT, Vellore. The generated power has been analyzed and used to charge the E-bicycle, E-scooter and E-car to calculate the zero CO2 emission periods of the said vehicles when life cycle CO2 emission from each vehicle has been considered. The CO2 emission profile of the said vehicles considering the fixed distance covered and charged from the FSPVS also has been analyzed. The FSPVS is further used to quantify the reduction in the rate of evaporation for a 1-year period. The objective of the present study is to:
  • Design a floating system for VIT Lake, VIT, Tiruvalam Road, Katpadi, Vellore, Tamil Nadu, India;
  • To analyze the annual energy generated from the FSPVS;
  • Analyze the savings in water due to the prevention of evaporation by the FSPVS;
  • Analyze and compare the performance and impacts on the environment while charging different electric vehicles by taking factors such as CO2 emissions into consideration.

1.2. Structure of the Paper

The current paper has been organized as follows: after the Introduction, the Material and Methods behind this work is explained, in Section 2. Section 3 focuses on the results obtained and discussions related to them. The Results section focuses on the results obtained with the floating plant analysis and charging of EV using a floating solar PV system. Lastly, the work concludes in Section 4.

2. Materials and Methods

A simulation was made using Helioscope software to analyze the power generated when a floating PV system was employed at the suggested site location and the greenhouse gases emitted by different types of electric vehicles were compared. The data obtained from the simulation of the floating PV system were obtained and filtered. These data were then used as a reference for the case when different electric vehicles are charged. The setup was further used to quantify the reduction in the rate of evaporation for a 1-year period. We used a pre-existing analytical model to do this.

2.1. Case Study Area

The FSPVS of 1.5 MWp was proposed at the VIT Lake. The VIT Lake is the lake which is located inside the Vellore Institute of Technology University at Vellore in India. The VIT Lake is the largest lake at the Tiruvalam Road Area, located at 12.9723° N latitude and 79.1596° E longitude, respectively. The climatic parameters served as the input to our research.

2.2. Resource Assessment

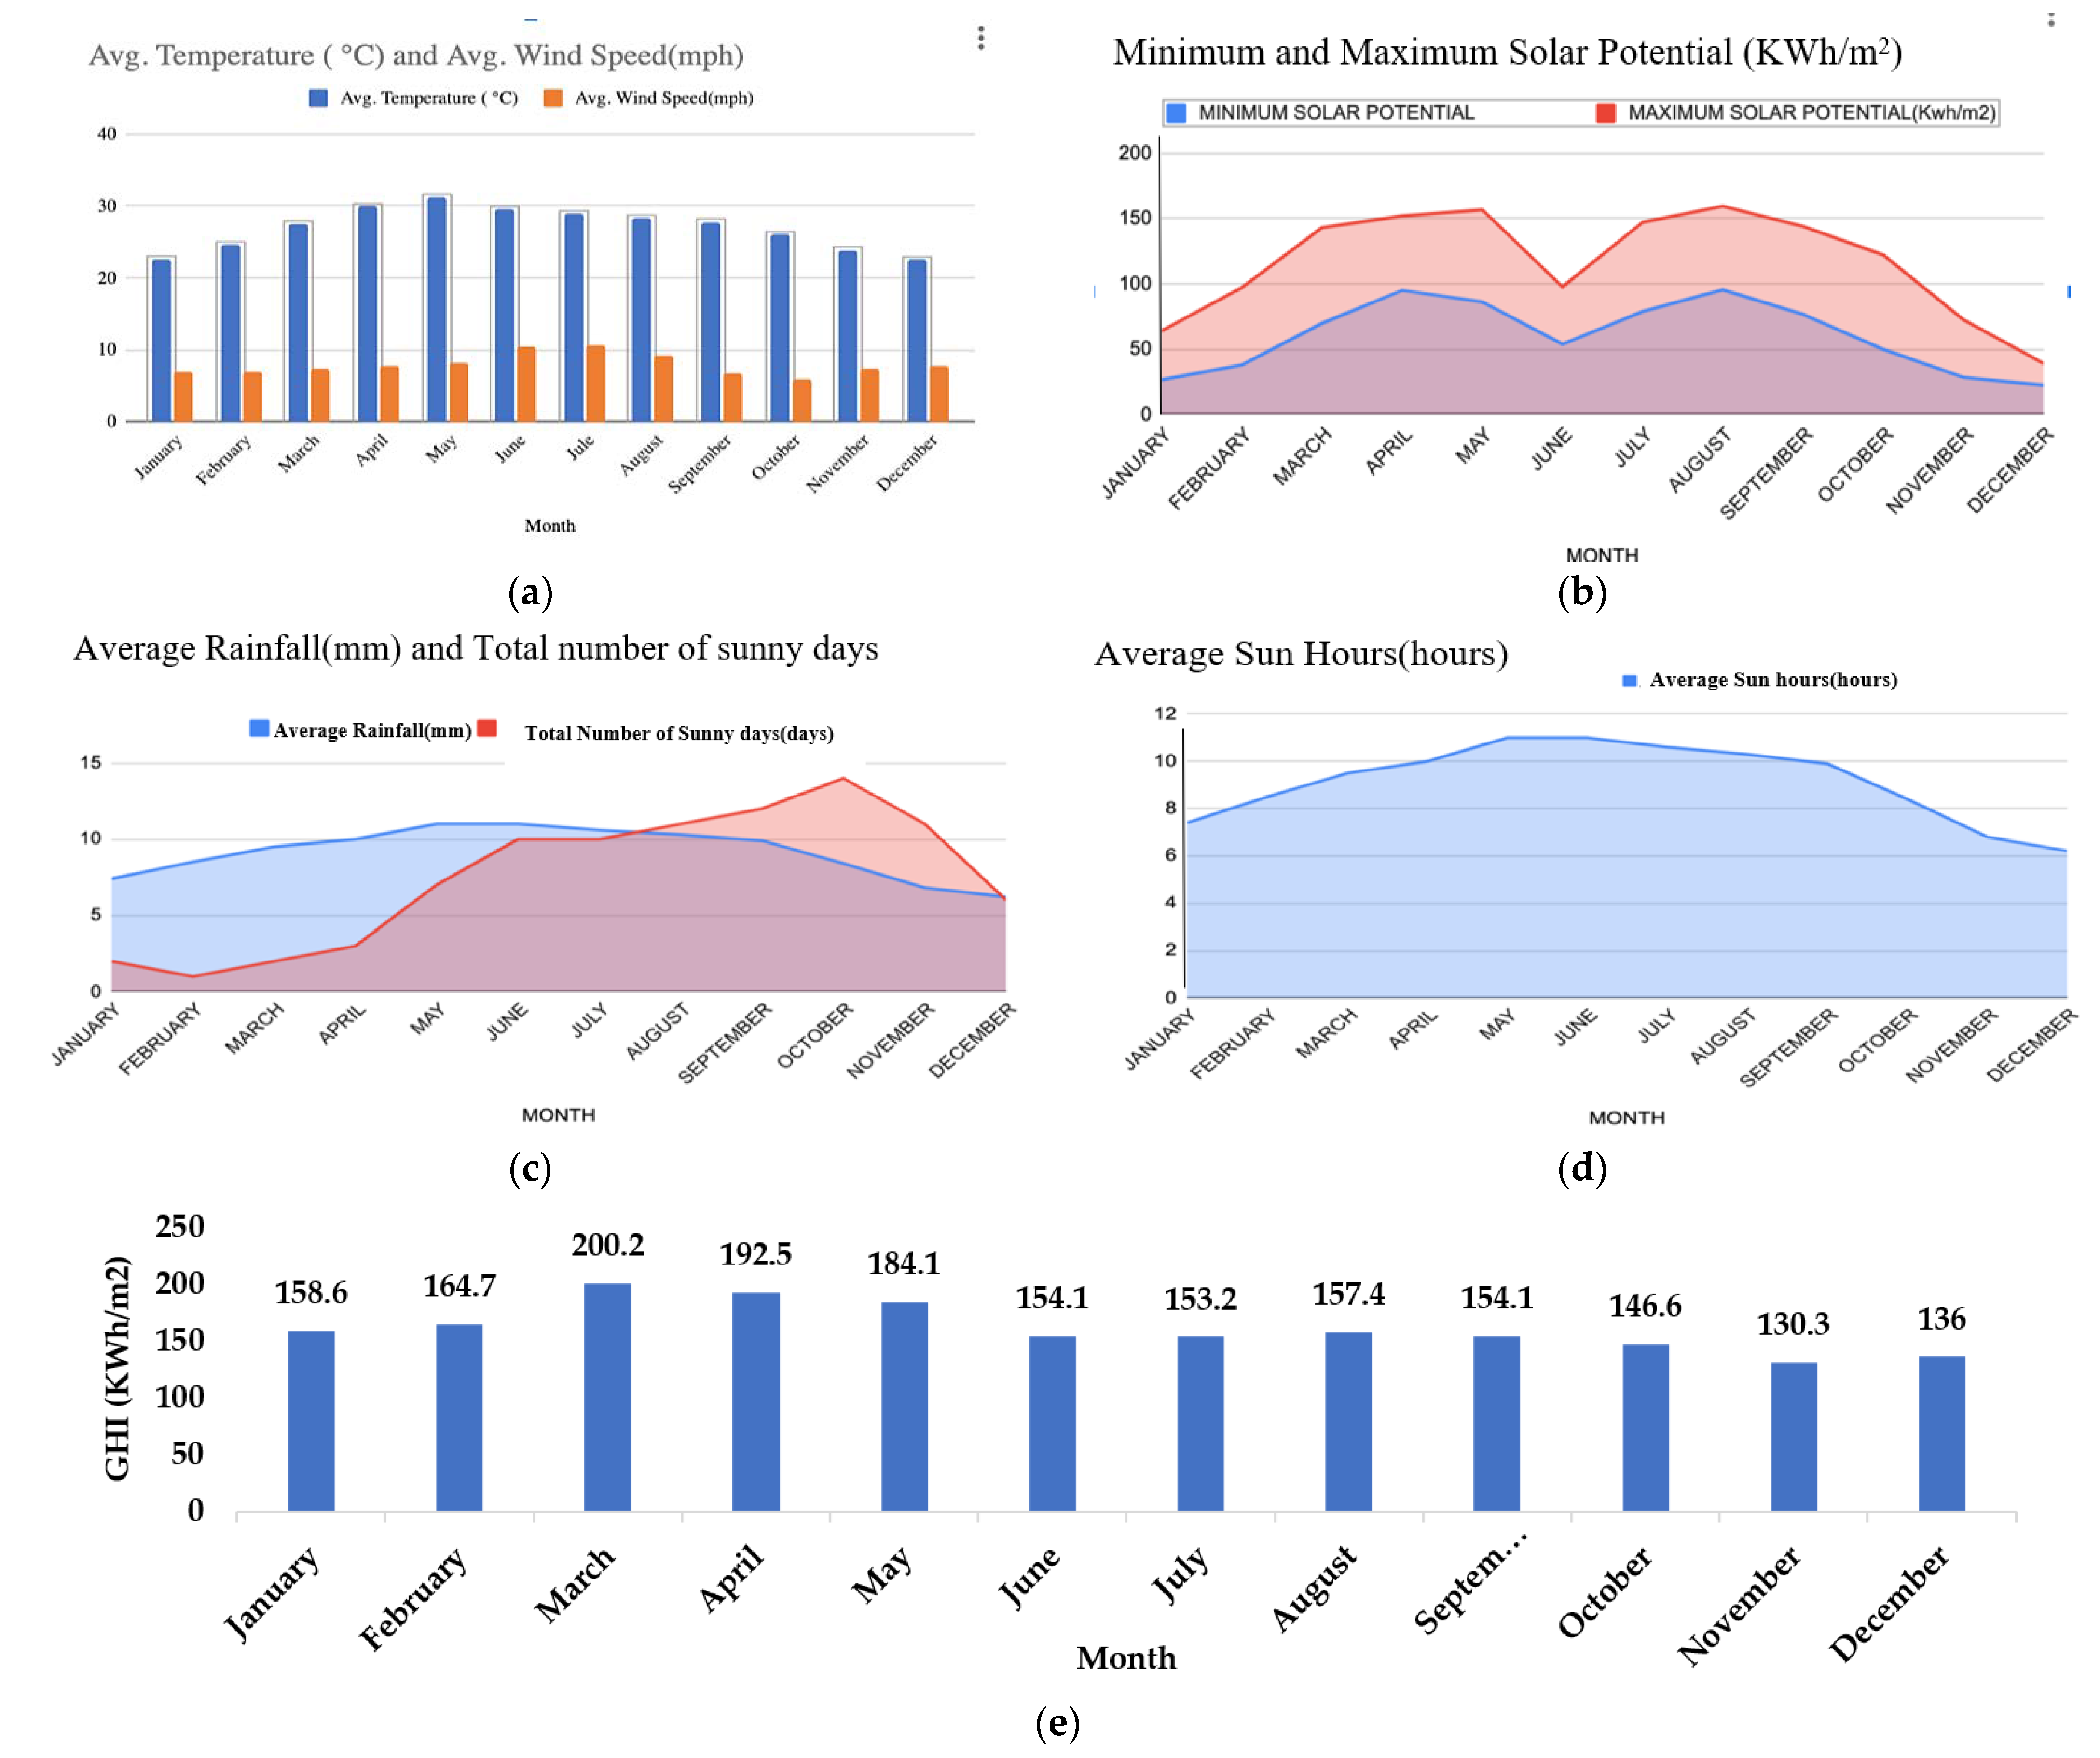
The average temperature at Vellore was obtained for every month. The data regarding the average temperature were collected from [23]. The average temperature at Vellore was 22.6 °C during the month of January. It increased and peaked in May at a temperature of 31.2 °C. After that it decreased gradually until it became 22.5 °C. A similar trend was noticed for minimum temperature and maximum temperature. The detailed temperature data is presented below in Figure 6a. The average wind speed at Vellore followed a trend where it increased till July and then it decreased continuously till December, as shown in Figure 6a. In January the wind speed remained 7 mph. In March, there was a slight increase in the average wind speed to 7.5 mph. It increased further up to 10.6 mph. After July, the wind speed decreased to 6 mph which was the lowest of the year. After that it increased again up to 7.8 mph. The minimum and maximum solar potential increased till May and then decreased in June. It further increased till August and September before decreasing till December. This can be seen in Figure 6b. The performance of the solar PV system is affected by rainfall. Figure 6c describes the average rainfall and total number of rainy days in Vellore. We can see that on the month of October, the energy produced was lower than other months. This can be attributed to the total number or rainy days. The average sun hours remained low at 7.8 h in January but it then steadily increased and peaked in May at 10.6 h. It then decreased till December, becoming 6 h. This is described in Figure 6d.
The GHI irradiance/day for each month can be obtained from the research article [23]. Using the helioscope software, one can also obtain similar GHI values for the solar PV system. Figure 6e shows the GHI emissions obtained through the helioscope software.

2.3. System Design

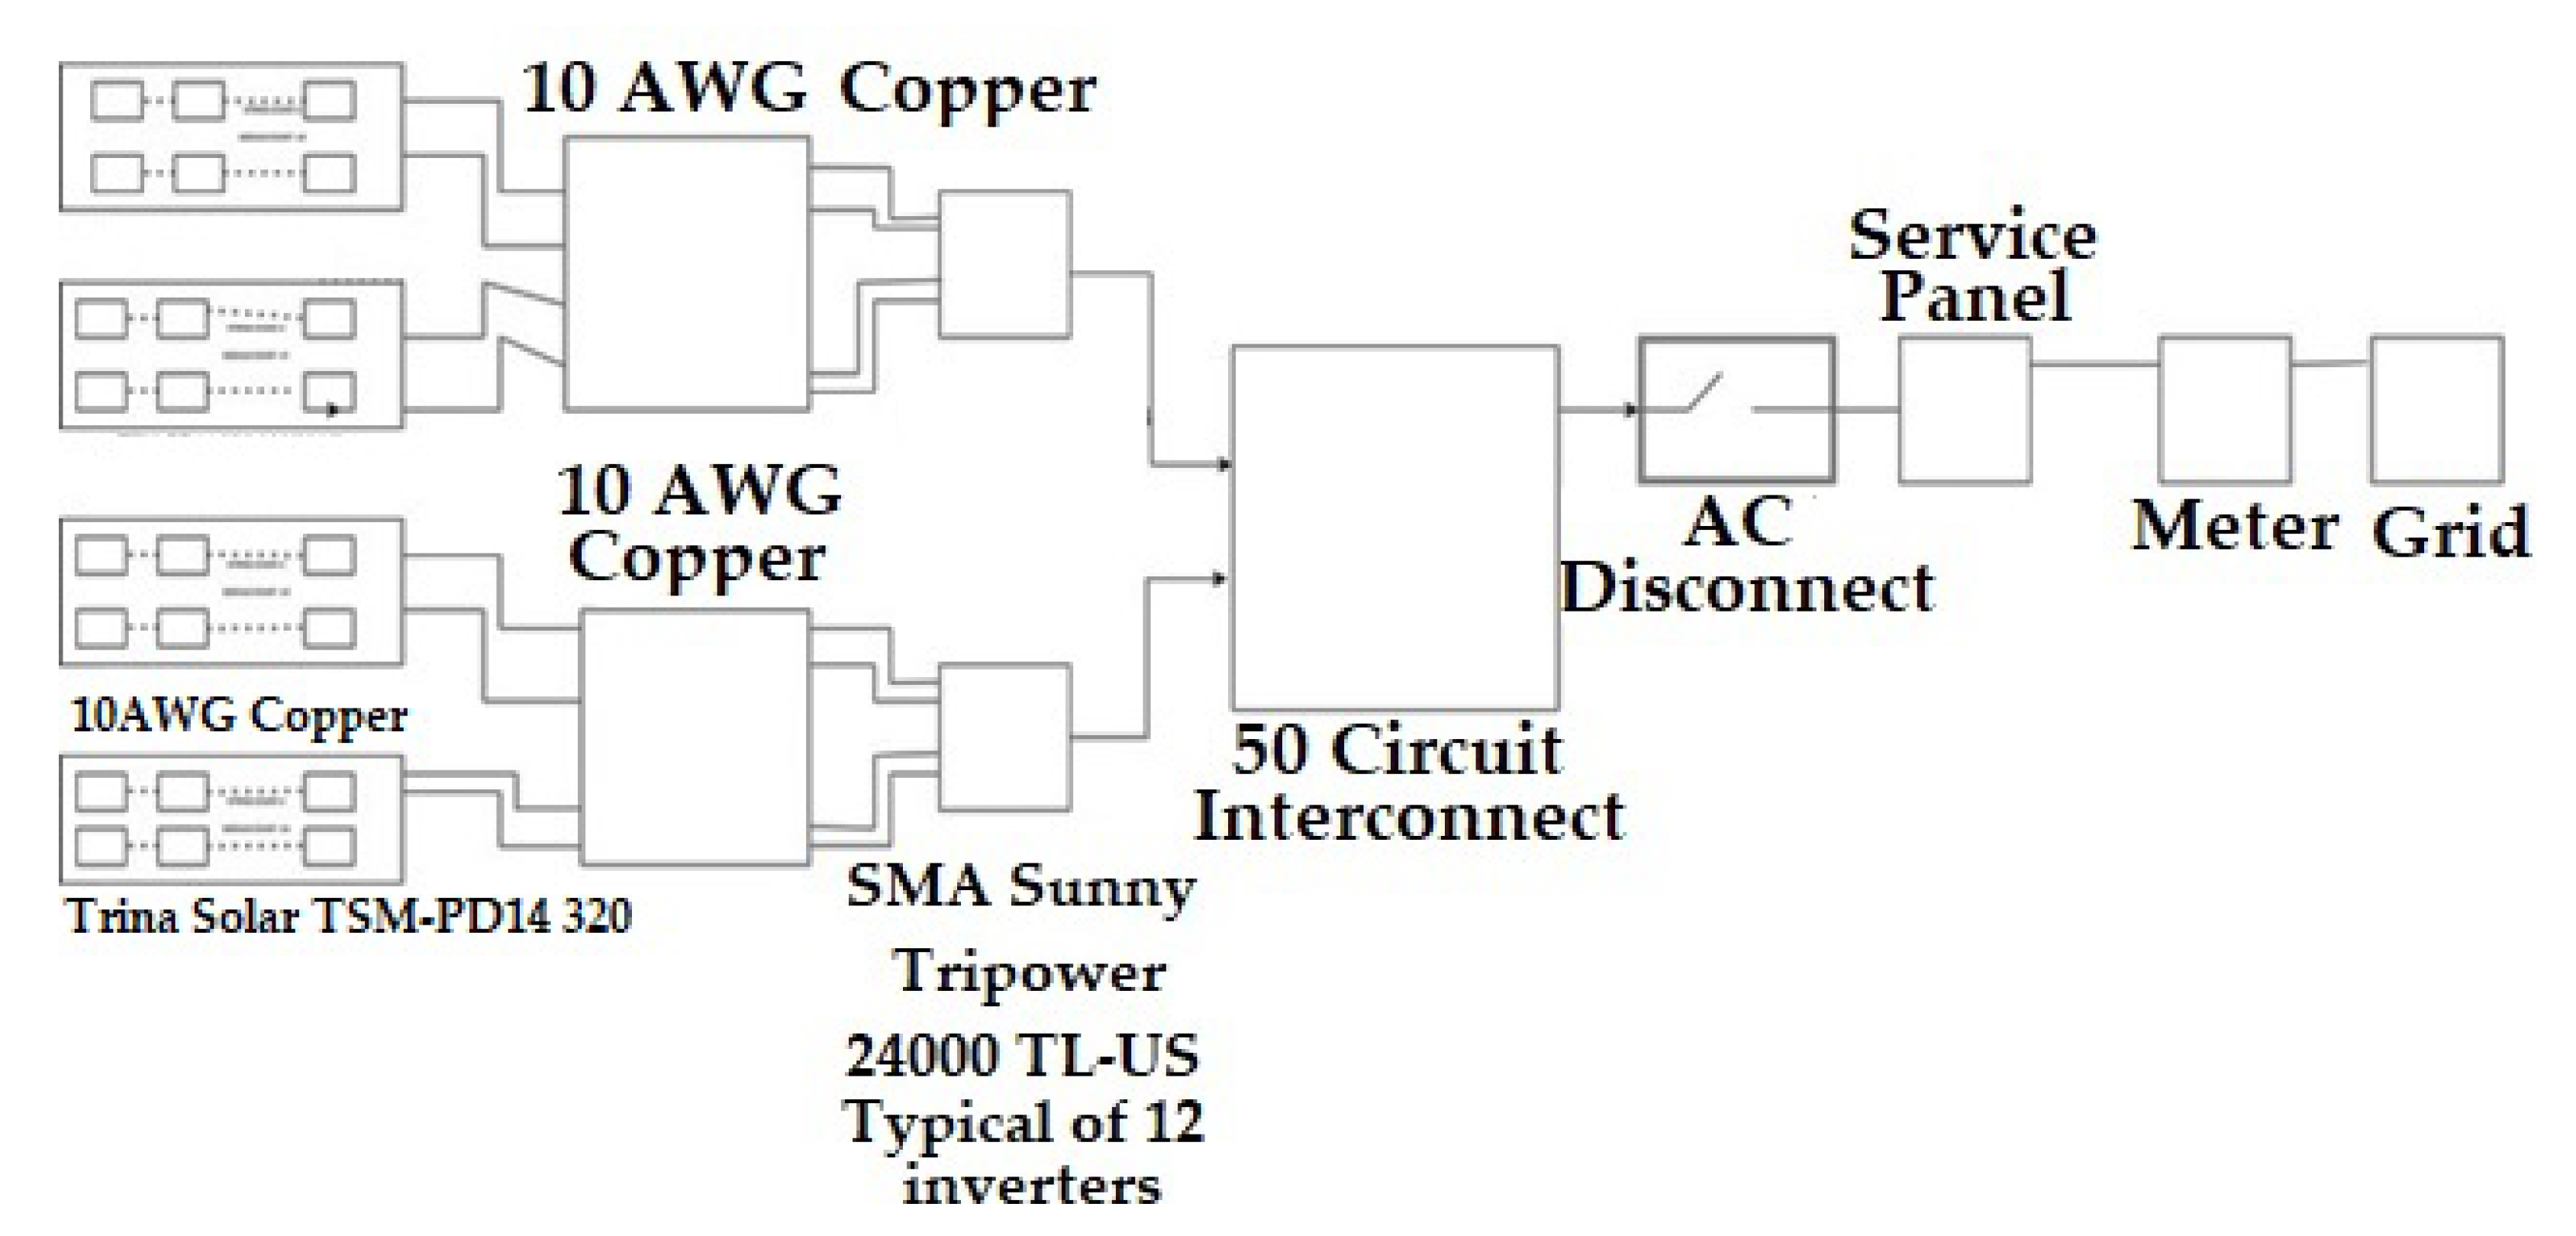
4688 PV modules of Trina Solar TSM-PD14 3209 (May 15) [24] were chosen for installation. The STC Rating of the module was 320 W. The PV modules were connected to copper switches which were in turn connected to 50 nos. of SMA Sunny Tripower 24,000TL-US inverter [25]. The maximum input voltage of the inverter was 1000 V. The AWG Copper wires [26] were of string type and were 52,660 ft long. The component specifications are tabulated in Table 1.
The PV modules were used to create a floating solar PV system. The panel consisted of a number of series and parallel connections of solar cells. The first panel was made up of two strings that represent the maximum number of PV modules that may be linked in series. In this string, 42 PV modules were used to give the proper voltage to the inverter. The voltage from the panel can be 1000 V as input of the inverter. The inverter was delivered in the 450 V to 800 V MPPT range. The inverter was connected to the external circuit and then this was then connected with the AC disconnector to protect the service panel from overvoltage and overcurrent follow.

2.4. EV Specifications

The specifications of the different vehicles are tabulated in Table 2 [27,28,29].

2.5. Associated CO2 Emissions Calculation for EVs

The energy consumed per km of different types of EVs was obtained from previously conducted studies and the CO2 emissions were also obtained [30]. The CO2 emission from the coal-based plant was 1000 g/kWh whereas the same was 40 g/kWh for the PV-based plant. The energy consumed per km for electric cars was 151 Wh, while it was 7.9 Wh for E-bikes and 30.7 Wh for E-scooters. From the analysis conducted using Helioscope, the annual energy generated from 1.5 MWp FSPVS was 2387.89 MWh. The total annual distance covered by the vehicle when charged from the generated energy of FSPVS is given by
a n n u a l   d i s t a n c e   c o v e r e d   i n   k m   ( D k = 1 , 2 , 3 ) = E G E C k
where E G represents the annual energy generated from a 1.5 MW floating PV plant (Wh) and E C k represents the energy consumption per km. The distance covered is represented by D k , where k = 1   for   the   Bike ,   2   for   the   Scooter   and   3   for   the   car .
The percentage km covered more by the vehicle is given by:
  D m o r e , k   = E G E C k + 1 E G E C k E G E C k + 1
The annual CO 2 emission of the vechicle is given by the following equation
A n n u a l   CO 2   e m i s s i o n ,   A C E k = 1 , 2 , 3   = E G E C k   C E k
w h e r e   C E k represented the life cycle CO2 emission/km from the vehicle. The saving in CO 2 emission per unit is seen as the difference between the CO 2 emission from the coal plant and the CO 2 emission from PV plant, where CEcp   and   CEpv represent the CO 2   emission   from   coal based   and   PV based   plants ,   respectively .
S a v i n g   i n   CO 2   e m i s s i o n   p e r   u n i t ( S ) = C E c p C E p v
The total CO 2 emission savings (when charged from FPVS instead of the conventional grid) is given by the following equation,
T o t a l   CO 2   e m i s s i o n   s a v i n g s ( T C E ) = E G C E c p C E p v 1000
Finally, the CO2 emission saving when PV is used to charge the different types of EVs are calculated using
C E S k = 1 , 2 , 3 = T C E A C E k = 1 , 2 , 3
The analysis of the emission saving by assuming 10 × 10 5 km distance covered by the EVs have been calculated. The energy required for the EV to cover 10 × 10 5 km is given:
E k = 1 , 2 , 3 = E C k = 1 , 2 , 3 10 × 10 5
The percentage energy requirement more required by different EVs compared to the other is given by
E m o r e k = 1 , 2 = E C k + 1 E C k E C k
The annual CO 2 emission from different EVs are given by the following equation:
A C E k = 1 , 2 , 3 = C E k = 1 , 2 , 3 10 × 10 5
The total CO 2 emission saving (when charged from FPVS instead of conventional grid) for different types of EVs are given by the following equation:
T C E k = 1 , 2 , 3 = ( C E c p C E p v ) × E k = 1 , 2 , 3 1000
Finally, the CO2 emission saving when FSPVS is used to charge the different types of EVs are given by
E S k = 1 , 2 , 3 = T C E k = 1 , 2 , 3 A C E k = 1 , 2 , 3

2.6. Analysis in Evaporation

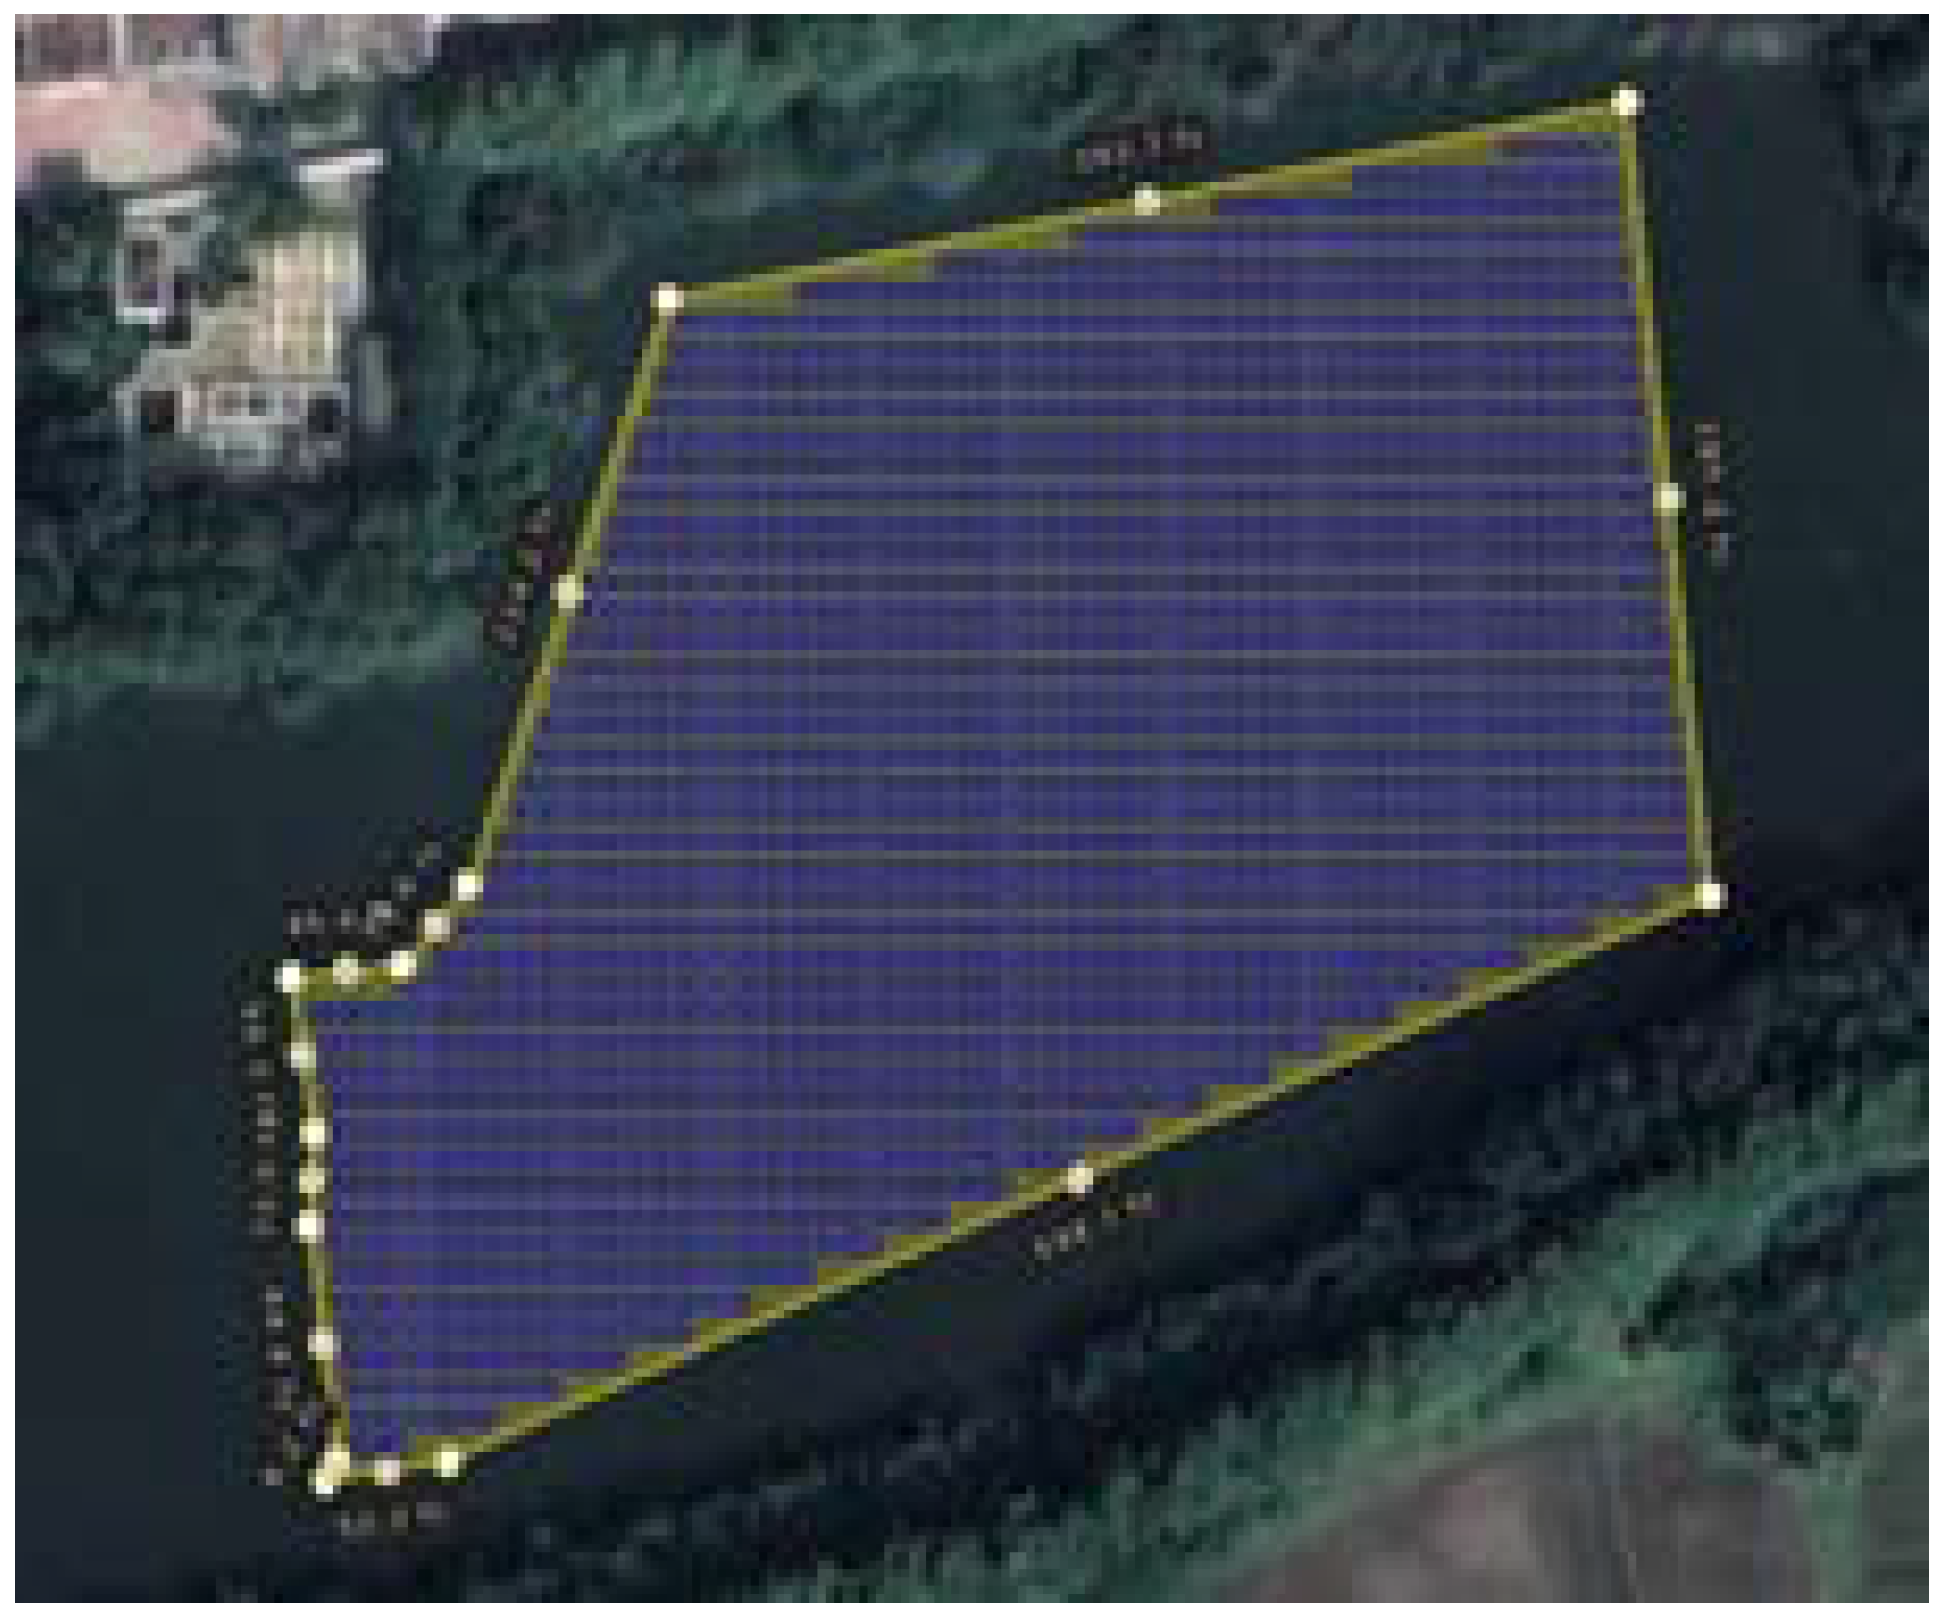
FSPVS are self-regulating and the FSPVS may increase their producing efficiency by 11% over land-based PV systems as temperatures rise [26]. In addition to limiting water evaporation, the floating solar panels also block excessive sunlight, avoiding an algal growth in the process. Layout of the PV site is shown in Figure 7.
The perimeter proposed PV plant is 53 × 104 m while the area of the PV plant is 0.15 × 10¹¹ m2. The overall evaporation/ water saving will be 37,125 kL/annum [31], lowering the plant’s specific water usage.

3. Results

3.1. Floating Plant Analysis

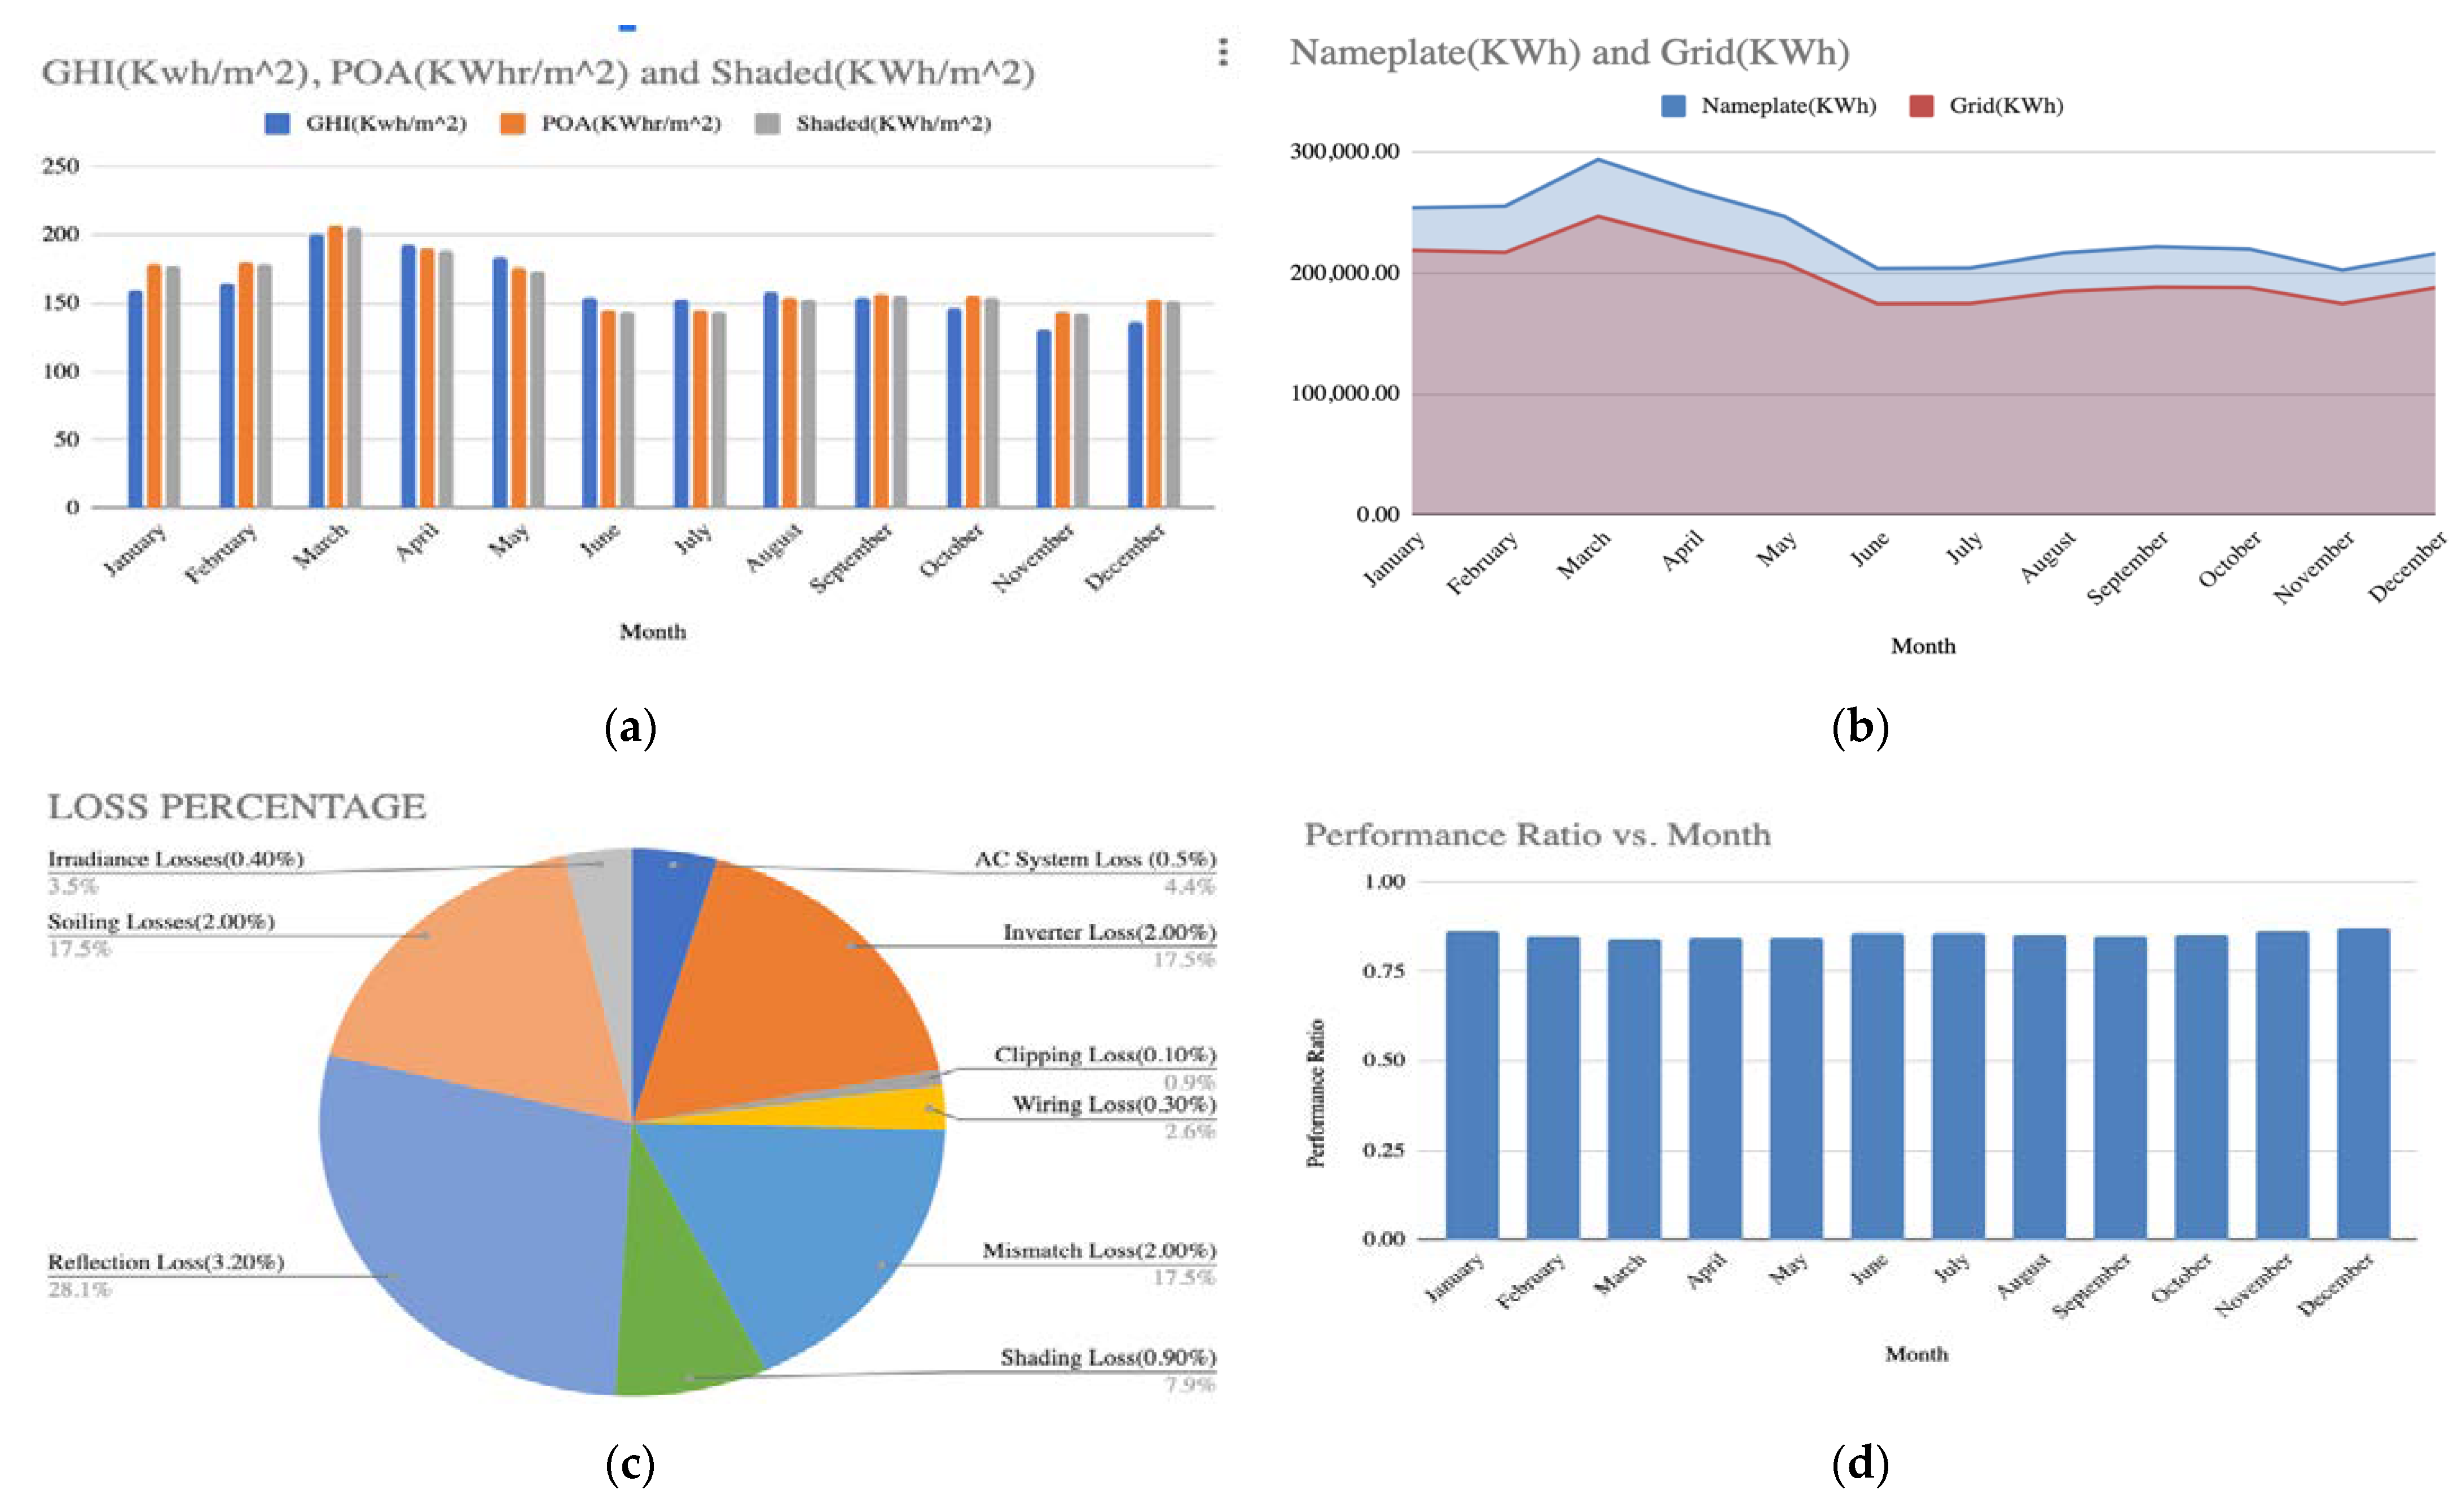
Block diagram of the floating SPV plant is shown in Figure 8. The GHI, POA irradiation and shaded irradiation from the floating plant obtained by month is given below in Figure 9a. One can see that the radiation increased from January to March. It then decreased from March to December. About 200.2 kWh of GHI was present during the month of March. The least amount of GHI can be seen in the month of November where the GHI was 130.3 kWh/m2. A similar trend is seen for POA and shaded radiation. It can be seen that the POA was highest in March, at about 206.6 kWh/m2, while it was lowest during June and July with about 145.4 kWh/m2. The total energy extracted from the grid and the nameplate energy is given below in Figure 9b. The nameplate kWh is the energy that should be generated under the ideal case. There are a many losses associated with a floating PV system. such as AC system losses, inverter losses, charging losses, wiring losses, mismatch losses, temperature losses, shading losses, reflection losses, soiling losses and irradiance losses. The highest loss was due to reflection losses of about 3.2%. There were also a significant number of losses due to soiling. There were also significant losses due to the SMA Sunny Tripower 24,000 TL-US inverter. The inverter has an approximate efficiency of 98% and thus there was about 2% loss due to the inverter. Figure 9c shows the distribution of different losses and Figure 9d describes the performance ratio over different months of a year.
The total energy provided to the grid was 2387.89 MWh while the nameplate energy was 2800.03 MWh. This is because there were various losses. Firstly, there were losses due to output at irradiance level which led to a decrease in the energy to grid of about 0.4%. Then there were losses due to cell temperature which led to losses of up to −9.2%. There was a further decrease of up to −2.9% due to mismatch losses. Furthermore, when the optimal DC output is considered, there was a further decrease leading to 2450.03 MWh of energy. When the constrained DC output is considered, there was a further reduction in the actual energy provided to the grid of 0.1% leading to 2447.69 MWh. Considering the inverter output, there was a further decrease in energy of up to 2.0%. Thus, the final energy provided by the floating PV system to the grid was 2387.89 MWh.
The actual energy generated was 2387.89 MWh while the energy generated under the ideal case was 2800.03 MWh. Thus, the performance ratio of the floating PV system was 0.8528 and the performance ratio was 0.8528. The calculation of the performance ratio of the PV system was also calculated for every month and it is given in Figure 9d. The performance ratio of the PV system was also calculated for every month and is given in Figure 9d. The above graph in Figure 9d shows the performance ratio by each month. The highest performance ratio was given during the month of December with a performance ratio of 0.87. It can be seen that the performance ratio was high at the beginning of the year with a performance ratio of 0.86 in January. The performance ratio slowly decreased until March where the performance ratio was 0.83. It increased in April where the performance ratio was 0.84 but then it again decreased during the month of May where the performance ratio was 0.84. It then increased after the month of May gradually until December where it reached 0.87.

3.2. Charging of EVs from FSPVS

In this work, three types of electric vehicles were considered: electric scooters, electric bikes and electric cars. The annual CO2 emission savings are tabulated in Table 3.
The annual CO2 emission was also measured by assuming a fixed coverage distance of 10 × 10 5 km. The annual CO2 emission of bike, scooter, and car was obtained by the equations mentioned above. Finally, the emission saving when PV is used along with electric bike, scooter and car was calculated and compared. Table 4 presents the CO2 emission parameters assuming constant distance coverage.
It can be seen that the CO2 emission savings was positive in the case of the E-car, but it turned out to be negative in the case of the E-bike and E-scooter. According to the research, when charged by floating PV, the net CO2 emission for an e-bike, e-scooter, and e-car, respectively, was zero in just 25.5 months, 12.1 months, and 7.7 months. All three types of electrical cars were zero emission vehicles after the aforementioned time periods. The analysis also took into account the predetermined distance (10 × 10 5 km) that each of the three types of vehicles must travel in order to charge. When using a floating PV system to charge electric vehicles, carbon emissions were reported to be positively reduced for electric vehicles but not for electric scooters or cycles. In such situation, it was estimated that using an electric bike, scooter, or automobile would result in CO2 emission reductions of −85.16 Ton, −3.28 Ton, and 525.6 Ton, respectively. For countries that rely on renewable energy generation, analysis reveals that all three types of electric vehicles are successful in lowering CO2 emissions, but when a set distance travelled is taken into account, only electric automobiles reduce carbon emissions. The electric car is the best option for reducing CO2 emissions out of all the electric vehicles that have been taken into consideration.

4. Conclusions

In this article the performance of a 1.5 MWP floating PV system using Helioscope software has been simulated and performance of the same has been analyzed to charge different types of EVs, such as the E-bike, E-scooter and E-car. The annual energy generation from the 1.5 MWp floating PV plant is of 2387.89 MWh. The analysis shows that the charging of EV using a floating PV system is more efficient from the point of view of CO2 emission. The findings indicate that an E-bike, E-scooter, or E-car will be a net zero CO2 emission vehicle in 25.5 months, 12.1 months, and 7.7 months, respectively, when charged from floating PV plant. When the floating PV system is used to charge various types of electric vehicles for a fixed distance coverage of 10 × 10 5   km, it has been observed that the CO2 emission savings for the E-bike, E-scooter, and E-car are −85.16 Ton, −3.28 Ton, and 525.6 Ton, respectively. According to the findings of the analysis, all three types of electric vehicles are effective in reducing CO2 emissions for nations that rely on renewable energy generation; however, when considered for a fixed distance covered, only electric cars save carbon emissions. It can be seen that, among the various types of electric vehicles that have been considered, the E-car is the most effective choice in terms of the reduction in CO2 emission. Additionally, 37,125 kL of water will be saved annually from evaporation owe to the installation of the floating PV plant.

Author Contributions

Data curation, methodology, visualization, writing—original draft preparation, A.R.; Conceptualization, software, formal analysis, investigation, validation, S.C.; writing—review and editing, supervision, D.E.; writing—review and editing, resources, data curation, supervision, funding acquisition, H.K.; resources, data curation, K.M.A., resources, data curation, methodology, visualization, N.C.G.; supervision, project administration, E.B.A. All authors have read and agreed to the published version of the manuscript.

Funding

This research received no external funding.

Institutional Review Board Statement

Not applicable.

Informed Consent Statement

Not applicable.

Data Availability Statement

The data sources employed for analysis are presented in the text.

Conflicts of Interest

The authors declare no conflict of interest.

References

  1. Ellison, E.; Baker, L.; Wilson, A. IPCC Special Report Meeting: Climate Change Around the Globe. Weather 2020, 75, 293–294. [Google Scholar] [CrossRef]
  2. Shenoy, S.; Gorinevsky, D.; Trenberth, K.E.; Chu, S. Trends of extreme US weather events in the changing climate. Proc. Natl. Acad. Sci. USA 2022, 119, e2207536119. [Google Scholar] [CrossRef] [PubMed]
  3. Biros, C.; Rossi, C.; Talbot, A. Translating the International Panel on climate change reports: Standardisation of terminology in synthesis reports from 1990 to 2014. Perspectives 2020, 29, 231–244. [Google Scholar] [CrossRef]
  4. Kobzar, O.; Melnyk, V.; Boon, E.K.; Derykolenko, O.; Kharchenko, M.; Karintseva, O. Environmental determinants of energy-efficient transformation of national economies for sustainable development. Int. J. Glob. Energy Issues 2021, 43, 262. [Google Scholar] [CrossRef]
  5. Kumar, M.; Niyaz, H.M.; Gupta, R. Challenges and opportunities towards the development of floating photovoltaic systems. Sol. Energy Mater. Sol. Cells 2021, 233, 111408. [Google Scholar] [CrossRef]
  6. Haugwitz, F.; Advisor, S. Apricum Floating Solar PV Gains Global Momentum. Available online: https://www.pv-magazine.com/2020/09/22/floating-solar-pv-gains-global-momentum/ (accessed on 25 November 2022).
  7. Kumar, M.; Kumar, A.; Gupta, R. Comparative degradation analysis of different photovoltaic technologies on experimentally simulated water bodies and estimation of evaporation loss reduction. Prog. Photovolt. Res. Appl. 2020, 29, 357–378. [Google Scholar] [CrossRef]
  8. Available online: https://www.globenewswire.com/en/news-release/2022/02/24/2391102/0/en/Global-Floating-Solar-Panels-Market-to-Reach-4-8-Thousand-MW-by-the-Year-2026.htm (accessed on 25 November 2022).
  9. Floating Solar Market Size to Hit US$ 10.09 Billion by 2030. Available online: https://www.precedenceresearch.com/floating-solar-market (accessed on 25 November 2022).
  10. Sahu, A.; Yadav, N.; Sudhakar, K. Floating photovoltaic power plant: A review. Renew. Sustain. Energy Rev. 2016, 66, 815–824. [Google Scholar] [CrossRef]
  11. Goswami, A.; Sadhu, P.K. Degradation analysis and the impacts on feasibility study of floating solar photovoltaic systems. Sustain. Energy Grids Netw. 2021, 26, 100425. [Google Scholar] [CrossRef]
  12. Oliveira-Pinto, S.; Stokkermans, J. Assessment of the potential of different floating solar technologies–Overview and analysis of different case studies. Energy Convers. Manag. 2020, 211, 112747. [Google Scholar] [CrossRef]
  13. Taye, B.Z.; Nebey, A.H.; Workineh, T.G. Design of floating solar PV system for typical household on Debre Mariam Island. Cogent Eng. 2020, 7, 1829275. [Google Scholar] [CrossRef]
  14. Goswami, A.; Sadhu, P.; Goswami, U.; Sadhu, P.K. Floating solar power plant for sustainable development: A techno-economic analysis. Environ. Prog. Sustain. Energy 2019, 38, e13268. [Google Scholar] [CrossRef]
  15. Costa, L.C.A.; Silva, G.D.P. Save water and energy: A techno-economic analysis of a floating solar photovoltaic system to power a water integration project in the Brazilian semiarid. Int. J. Energy Res. 2021, 45, 17924–17941. [Google Scholar] [CrossRef]
  16. Ravichandran, N.; Panneerselvam, B. Performance analysis of a floating photovoltaic covering system in an Indian reservoir. Clean Energy 2021, 5, 208–228. [Google Scholar] [CrossRef]
  17. Agrawal, K.K.; Jha, S.K.; Mittal, R.K.; Vashishtha, S. Assessment of floating solar PV (FSPV) potential and water conservation: Case study on Rajghat Dam in Uttar Pradesh, India. Energy Sustain. Dev. 2022, 66, 287–295. [Google Scholar] [CrossRef]
  18. Available online: https://www.oecd.org/publications/global-ev-outlook-2020-d394399e-en.htm (accessed on 25 August 2022).
  19. Prospects for Electric Vehicle Deployment–Global EV Outlook 2021–Analysis. Available online: https://www.iea.org/reports/global-ev-outlook-2021/prospects-for-electric-vehicle-deployment (accessed on 25 November 2022).
  20. Available online: http://www.hydrogen.energy.gov/pdfs/14006_cradle_to_grave_analysis (accessed on 25 September 2022).
  21. Michalek, J.J.; Chester, M.; Jaramillo, P.; Samaras, C.; Shiau, C.-S.N.; Lave, L.B. Valuation of plug-in vehicle life-cycle air emissions and oil displacement benefits. Proc. Natl. Acad. Sci. USA 2011, 108, 16554–16558. [Google Scholar] [CrossRef] [PubMed] [Green Version]
  22. Shen, W.X.; Zhang, B.; Zhang, Y.F.; Wang, X.C.; Lu, Q.; Wang, C. Research on Life Cycle Energy Consumption and Environmental Emissions of Light-Duty Battery Electric Vehicles. Mater. Sci. Forum 2015, 814, 447–457. [Google Scholar] [CrossRef]
  23. Rajneesh, K.; Ananya, R.; Rohan, B. Prediction of Global Horizontal Radiation in Vellore using Clearness Index Model. Int. J. Eng. Technol. 2017, 9, 489493. [Google Scholar]
  24. Rahman, M.; Hasanuzzaman, M.; Rahim, N. Effects of various parameters on PV-module power and efficiency. Energy Convers. Manag. 2015, 103, 348–358. [Google Scholar] [CrossRef]
  25. Available online: http://www.reuters.com/business/energy/Singapore-unveils-one-worlds-biggest-floating-solar-panel-farms-2021-07-14/ (accessed on 29 September 2022).
  26. Suh, J.; Jang, Y.; Choi, Y. Comparison of Electric Power Output Observed and Estimated from Floating Photovoltaic Systems: A Case Study on the Hapcheon Dam, Korea. Sustainability 2019, 12, 276. [Google Scholar] [CrossRef] [Green Version]
  27. Umoette, A.T.; Ubom, E.A.; Festus, M.U. Design of Stand Alone Floating PV System for Ibeno Health Centre. Sci. J. Energy Eng. 2016, 4, 56. [Google Scholar] [CrossRef] [Green Version]
  28. Hsu, S.A. Correction of Land-Based Wind Data for Offshore Applications: A Further Evaluation. J. Phys. Oceanogr. 1986, 16, 390–394. [Google Scholar] [CrossRef]
  29. McCafferty, D.J.; Gilbert, C.; Thierry, A.-M.; Currie, J.; Le Maho, Y.; Ancel, A. Emperor penguin body surfaces cool below air temperature. Biol. Lett. 2013, 9, 20121192. [Google Scholar] [CrossRef] [PubMed] [Green Version]
  30. The Environmental Impact of Today’s Transport Types. Available online: https://tnmt.com/infographics/carbon-emissions-by-transport-type/ (accessed on 25 November 2022).
  31. Kumar, N.M.; Chakraborty, S.; Yadav, S.K.; Singh, J.; Chopra, S.S. Advancing simulation tools specific to floating solar photovoltaic systems–Comparative analysis of field-measured and simulated energy performance. Sustain. Energy Technol. Assess. 2022, 52, 102168. [Google Scholar] [CrossRef]
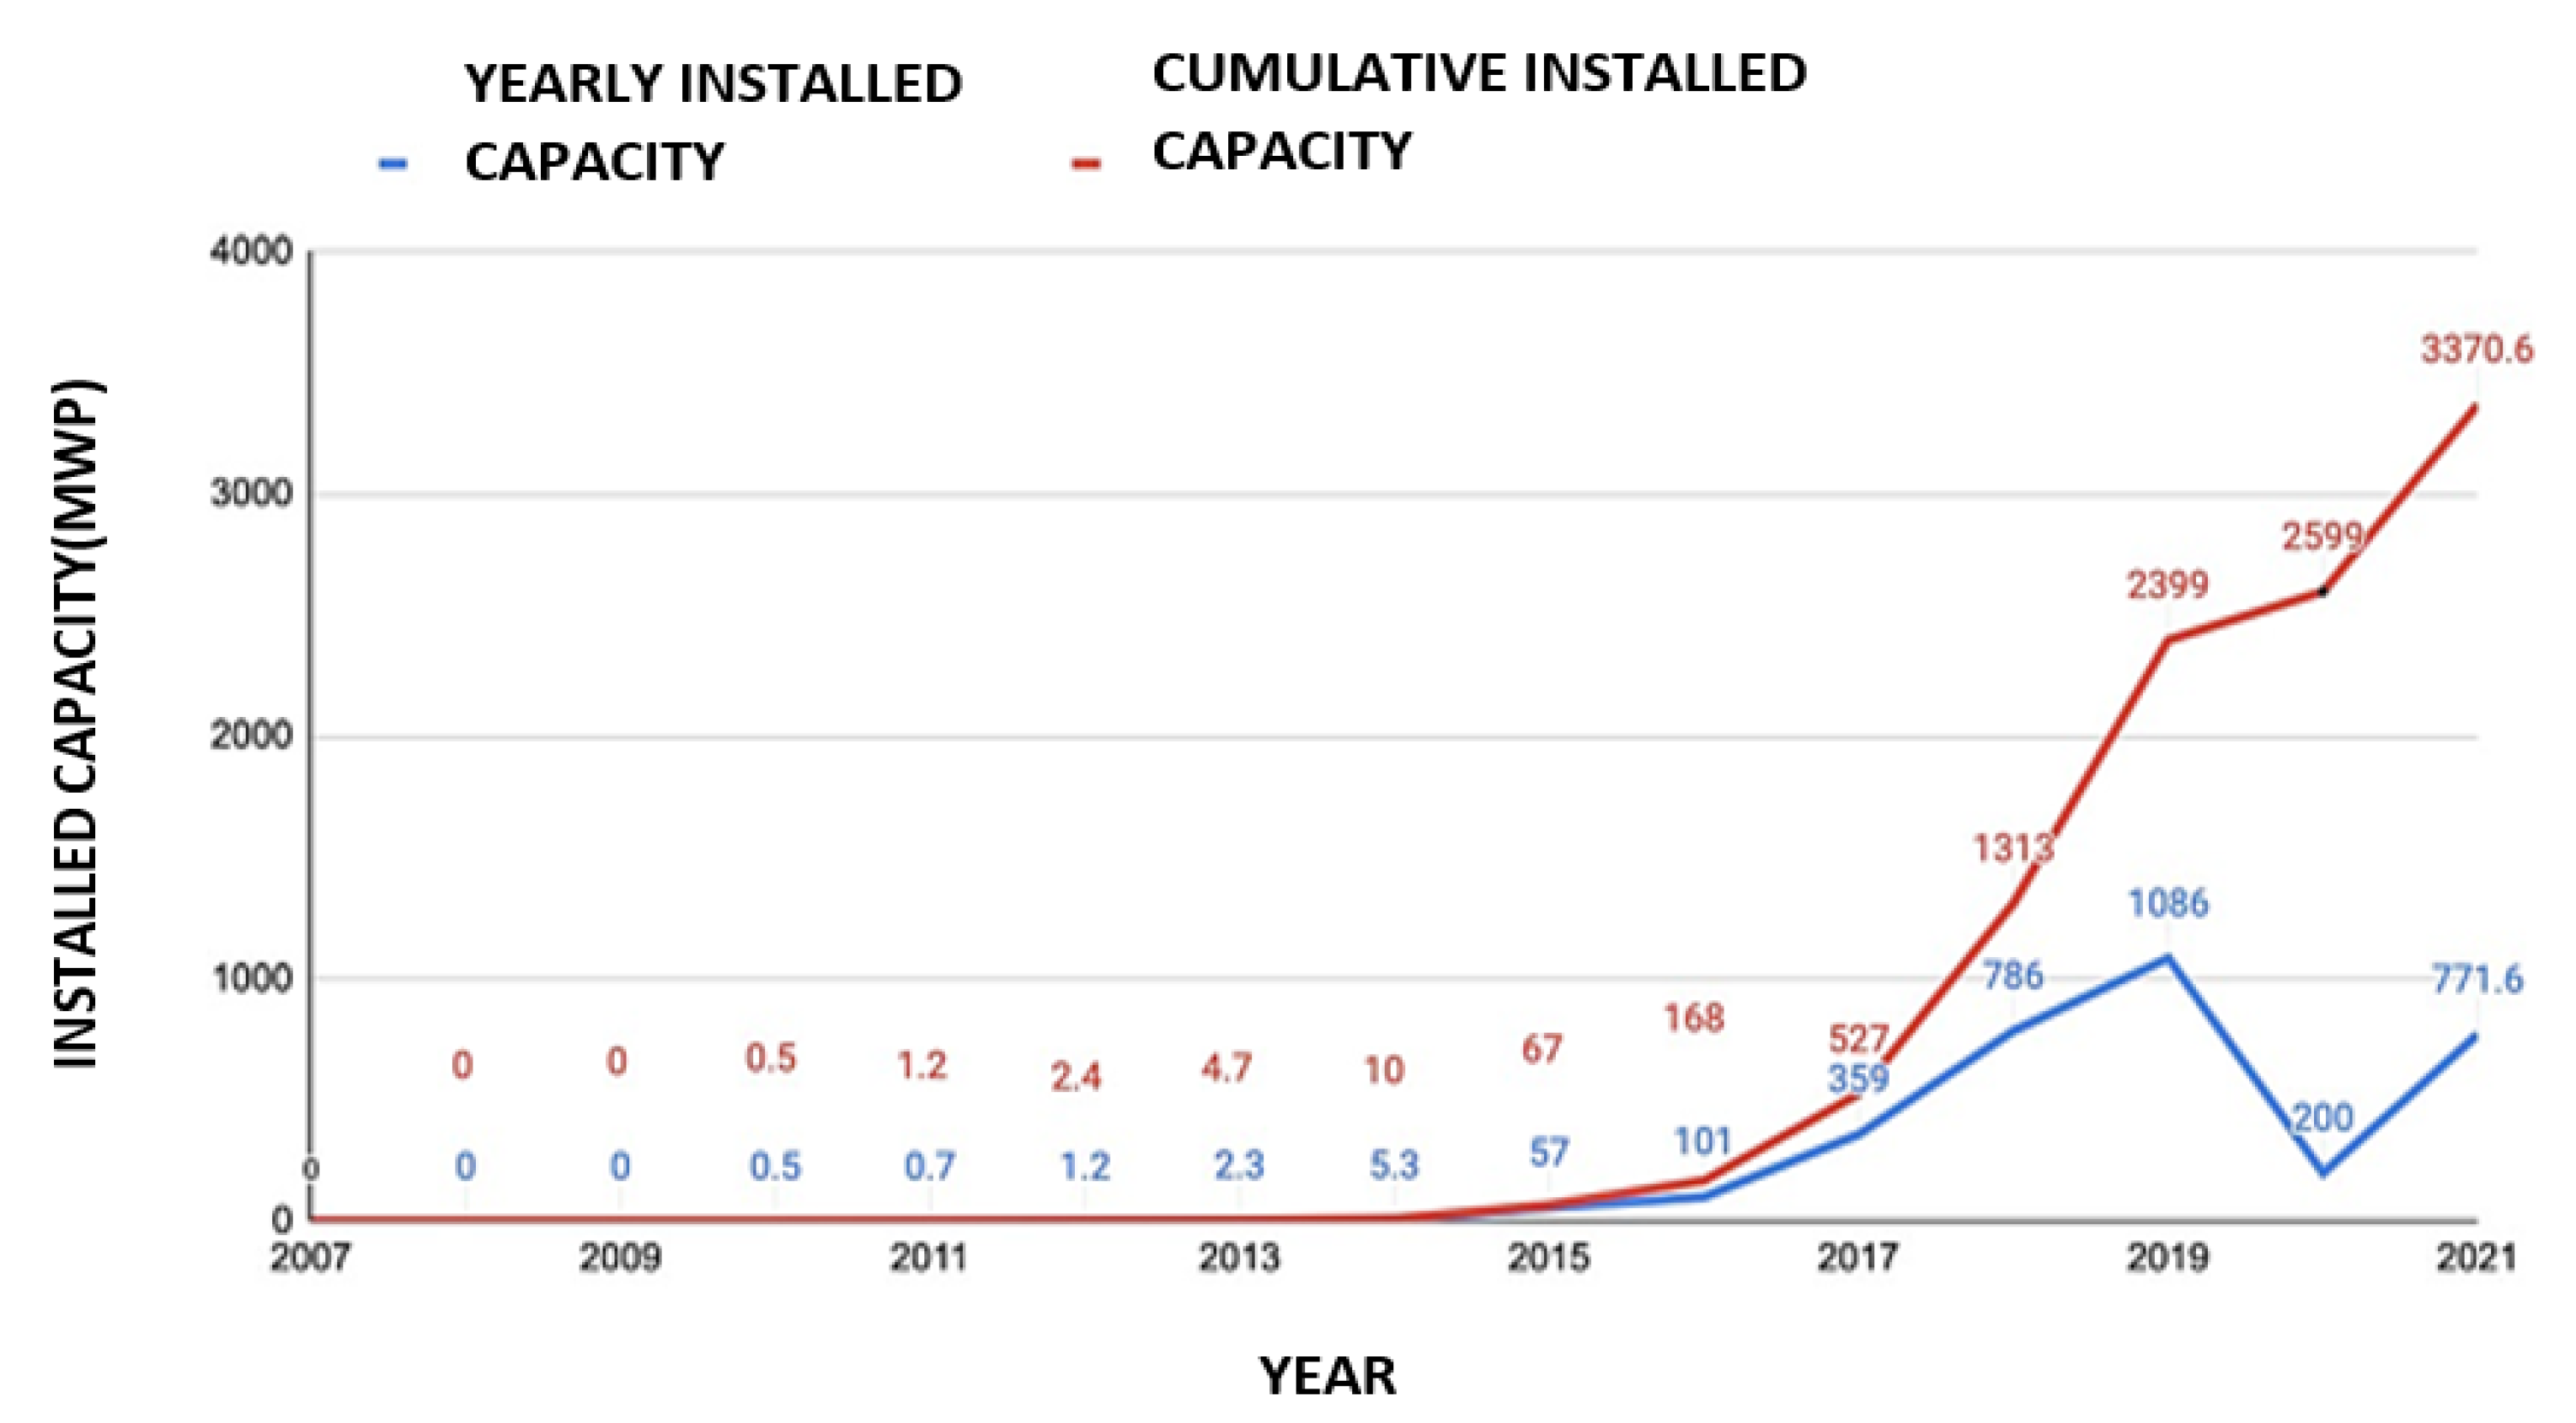
Figure 1. Yearly installed capacity of floating PV plant.
Applsci 12 12552 g001
Figure 2. Total projected market size of floating PV [9].
Applsci 12 12552 g002
Figure 3. Number of publications based on floating PV systems by year.
Applsci 12 12552 g003
Figure 4. Components of a FSPVS.
Applsci 12 12552 g004
Figure 5. EV market size (in billion USD) from 2010–2020 and projected market size till 2030.
Applsci 12 12552 g005
Figure 6. Monthly variation of various climatic parameters: (a) average temperature and wind speed; (b) minimum and maximum solar potential; (c) average rainfall and total number of sunny days; (d) average sun hours at Vellore; and (e) GHI irradiance per day by month.
Applsci 12 12552 g006
Figure 7. Layout of the PV site.
Applsci 12 12552 g007
Figure 8. Floating plant block diagram.
Applsci 12 12552 g008
Figure 9. (a) GHI, POA and shaded radiation; (b) nameplate energy and grid energy; (c) loss % age; and (d) performance ratio.
Applsci 12 12552 g009
Table 1. Specifications of module, inverter, and wire schedule.
Item nameModelParameterValue
PV moduleTrina Solar TSM-PD14 320STC Rating320 Wp
Vmp37.1 V
Imp8.63 A
Voc45.8 V
Ioc9.1 A
Quantity4689
Solar inverterSMA Sunny Tripower 24,000 TL-USMax AC Power Rating24,000 W
Max Input Voltage1000 V
Quantity50
WiresWire scheduleTierString
Wire250 × 10 AWG
Length4958 ft
Table 2. Different electric vehicle parameters and CO2 emission of electric vehicles.
ParametersBattery Capacity
(kWh)
Motor Power
(kW)
Maximum Speed
(km/h)
Maximum Torque
(Nm)
Energy Consumption
(Wh/km)
CO2 Emission
(g/psngr/km)
E-bike
(BH27)
0.280.2525407.916.1
E-scooter (Ather 450X)2.616802630.729.8
E-car
(Tesla Model 3)
5033616263915192.4
Table 3. Annual CO2 emission savings for different types of EVs when charged from FSPVS.
ParametersValue
Annual distance covered D 1 302.3 × 10 6   km
D 2 77.8 × 10 6   km
D 3 15.8 × 10 6   km
Percentage km covered more D m o r e 1 289
D m o r e 2 392
CO2 emissions (g/psngr/km) C E 1 16.1   g / psngr / km
C E 2 29.8   g / psngr / km
C E 3 92.4   g / psngr / km
Annual CO2 emissions A C E 1 4866.5   Ton / psngr
A C E 2 2317.9   Ton / psngr
A C E 3 1461.2   Ton / psngr
CO2 emissions from plantsCoal based plants1000 g/kWh
PV based plant40 g/kWh
Savings in CO2 emissions 960 g/unit
Total CO2 emission savingsTCE 2292.38   Ton
Annual emission savings when EV charged from FPVSElectric bike−2574.1 Ton
Electric scooter−25.5 Ton
Electric car831.2 Ton
Net Zero CO2 emission time period (months)Electric bike25.5
Electric scooter12.1
Electric car7.7
Table 4. CO2 emission parameters assuming constant distance coverage.
ParametersValue
Energy required E 1 7.9   Wh / km
E 2 30.7   Wh / km
E 3 151   Wh / km
Percentage energy more required E m o r e 1 289
E m o r e 2 392
Annual CO2 emissions A C E 1 161   Ton / psngr / km
A C E 2 298   Ton / psngr / km
A C E 3 924   Ton / psngr / km
Total CO2 emission saving when EV charged from FPVS instead of conventional grid T C E 1 75.84   Ton / psngr / km
T C E 2 294.72   Ton / psngr / km
T C E 3 1449.6   Ton / psngr / km
Emission savings when FPVS is used to charge EVElectric bike−85.16   Ton
Electric scooter−3.28   Ton
Electric car525.6   Ton
Publisher’s Note: MDPI stays neutral with regard to jurisdictional claims in published maps and institutional affiliations.