Article

Grouting Additives and Information-Based Construction of Jet Grouting in the Water-Rich Sand Stratum

1
College of Transportation Engineering, Nanjing Tech University, Nanjing 210009, China
2
College of Civil Engineering, Jiangsu Open University, Nanjing 210036, China
*
Author to whom correspondence should be addressed.
Appl. Sci. 2022, 12(24), 12586; https://doi.org/10.3390/app122412586
Submission received: 23 October 2022 / Revised: 1 December 2022 / Accepted: 2 December 2022 / Published: 8 December 2022
(This article belongs to the Special Issue Urban Underground Engineering: Excavation, Monitoring, and Control)

Abstract

:
The dynamic action of groundwater in the water-rich sand stratum carries away injected cement slurry before it becomes solidified, which seriously affects the determination of the diameter and strength of the column. Grouting additives and information-based construction are two main actions to control the quality of jet grouting construction. This study introduced a solution of grouting additives and information-based construction of jet grouting in the water-rich sand stratum. First, high-polymer cement grout (HPCG), red mud and phosphogypsum cement grout (RPCG) and metakaolin cement grout (MKCG) additives were screened with a series of laboratory tests on solidification time and permeability; moreover, the mix proportion of grouting fluids was developed in order to adapt for water-rich sand strata. Secondly, information-based construction of jet grouting was conducted to control grouting quantity with real-time monitoring of drill rotational velocity, drill lifting speed and injection pressure equipped with the monitoring system on the double fluid jet grouting systems. Lastly, the validity of grouting additives and information-based construction in the water-rich sand stratum was verified via a test pile in situ, and a series of material tests on drilling core samples on permeability with SEM observation. The results indicate that the high polymer is the preferred additive of grouting fluids because the solidification time can be controlled in the range of 10 min to 20 min; the permeability of drilling core samples can reach the order of 10−7, with the mix proportion being A:B = 2:1, high-polymer additive:water > 1:3, with a water-cement ratio of 0.8. The specifications of information-based construction are a drill rotational velocity of 10 r/min, a drill lifting speed of 0.2 m/min, an injection pressure of 20 MPa and a grouting quantity of 40 L/min.

1. Introduction

Jet grouting is widely used means in soil reinforcement and water-tightness by which the cement slurry is injected with high pressure and velocity into the pore and fissure of soil/rock [1,2,3,4,5,6,7]. The jet grouting technique has been widely used in various fields of geotechnical engineering after more than 160 years of development, in applications such as foundation treatment, cement–soil composite piles, braced excavation, and in control of post-construction settlement in tunnel engineering.
Jet grouting usually involves initially drilling a borehole with a 100–150 mm diameter to the required lower end of the section. Then, grout fluid is injected into the soil under high pressure at a high velocity with small-diameter nozzles, in order to break up the soil texture and produce a soil–cement mixture to form a quasi-cylindrical soil cement column [8]. The main jet-grouting methods are divided by the number of injected fluids, which are single fluid with grout only; double fluid with grout and air; and triple fluid with water or accelerator, grout and air [9,10,11,12,13,14,15,16].
The most significant parameters affecting the design of jet grouting are usually soil type, mixture influx between soil and grout, grout flow volume, exiting jet energy from the nozzle, lifting speed and rotating speed [17,18,19], which also control the compressive strength and the geometric dimensions of the soil–cement columns [20]. Six full-scale tests were carried out to determine the effect of pressure and grout volume on the mechanical and physical parameters of a column, which revealed that the uniaxial compressive strength increased logarithmically, with increased injection pressure and volume [21]. The parameters, such as lifting speed and rotational velocity of the drilling step, water-to-cement ratio (W/C), injection pressure, grout flow volume and the air and water pressure affecting diameter, as well as the uniaxial strength, increased in sandy soil as compared to clay [22].
The most important parameter that affects the success of injection application within soils is the properties of the injection materials. Extensive research has been carried out to determine the strength and mechanisms of soil–cement in different soil types. Strength tests such as uniaxial testing have been carried out to examine the use of additives to enhance the strength as well as the effects of factors such as chemicals, curing time, cement type and soil density on soil strength [23,24,25].
Grouting materials have become the key scientific restriction for grouting control of water-rich sand stratum disasters. It is urgent to prepare efficient grouting materials for water-rich sand strata to overcome the defects of existing grouting materials, and to achieve effective grouting plugging and reinforcement treatment of water-rich sand strata, which provide advantages such as the high injectability of sand layer pores, stable pumping, controllable setting time, high strength, stable volume, reasonable density of hydrated minerals, durability, good reinforcement effect, appropriate price, green environmental protection, etc. [26,27].
In the water-rich sand stratum, when the construction of water-tightness curtains use jet grouting, the dynamic action of groundwater in the water-rich sand stratum carries away the injected cement slurry before it solidifies, which seriously affects the determination of the diameter and strength of the column. This study solves the severe losses of cement slurry from jet grouting in the water-rich sand stratum with grouting additives and information-based construction. Three grouting additives, including high-polymer additive, red mud and phosphogypsum and metakaolin, were screened with a series of laboratory tests on solidification time and permeability. Based on equipping a monitoring system on the double fluid jet grouting systems, the mixed proportion of grouting fluids in laboratory tests was verified via site tests of jet grouting and laboratory tests of drilling core samples to find reasonable specifications for information-based jet grouting construction in the water-rich sand stratum.

2. Water-Rich Sand Stratum

2.1. Geology

In this research, the experimental site for double fluid jet grouting was located in Suzhou city, Jiangsu Province, China. The geology of the experiment site had 5 units within a 20 m depth of the drill hole, the stratum of which has silty clay, muddy silty clay, silty clay with silt, silt, and silty clay, as shown in Table 1 and Figure 1. The groundwater level changes seasonally according to a range that varies from 0.50 m to 1.00 m, and a buried depth which ranges from 0.50 m to 2.50 m.

2.2. Soil

Silt in the fourth layer of the stratum was the main soil reinforced with jet grouting, the state of which was slightly dense or medium dense, with a thickness ranging from 3.7 m to 14.3 m. The lithology was gray, greenish-gray, saturated silt, mainly composed of quartz, followed by feldspar and mica, with medium and uniform particle composition. The physical indexes and permeability coefficients of silt in the fourth layer of the stratum are shown in Table 1 and Table 2, according to different depths. The dry density was about 1.44~1.58 g/cm3, the liquid limit was 33.6% and the plastic limit was 22.6%. The vertical permeability coefficients ranged from 1.76 × 10⁻³ to 4.12 × 10⁻³ cm/s, and the horizontal permeability coefficients ranged from 3.25 × 10⁻³ to 7.48 × 10⁻³ cm/s.

3. Screening of Grouting Additives

The purpose of constructing jet grouting is to improve the anti-permeability of the stratum. In the water-rich sand stratum, the dynamic action of groundwater carries away the injected cement slurry before it solidifies during the construction of jet grouting. Therefore, grouting additives need to be mixed into the cement soil of jet grouting in order to reduce the solidification time of cement soil and enhance the anti-permeability of cement soil. Three grouting additives, including high-polymer additive, red mud and phosphogypsum and metakaolin were screened with a series of laboratory tests on solidification time and permeability.

3.1. Grouting Additives

3.1.1. High-Polymer Additive

High-polymer additive has the hydrophilic features of being easily soluble in water, fast curing, and impermeable to water. The high-polymer additive used in this study was produced by Shanghai Gu’en Waterproof Building Material Company, as shown in Figure 2a, the principal components of which were the acrylates of group A and group B. The ingredients of group A were the monomers of acrylate including calcium acrylate and magnesium acrylate, which is a water-soluble organic electrolyte. Group B included the crosslinking agent, the initiator agent and the accelerator agent. The ingredients of the crosslinking agent included ethylene glycol diacrylate. The ingredients of the initiator included ammonium sulfate. The ingredients of the accelerator were mainly triethanolamine and tetramethyl ethylenediamine.

3.1.2. Red Mud

Red mud is a kind of solid waste eliminated in the alumina production process, with extremely fine particles, strong alkalinity and certain impermeability. The red mud used in the study was produced by Shanxi Luliang Liulin Aluminum Factory, the color of which was reddish-brown, as shown in Figure 2b. The chemical composition of this red mud is shown in Table 3.

3.1.3. Metakaolin

Metakaolin is a new green cementitious material composed of SiO4 and AlO4 tetrahedrons, and has good anti-seepage performance, early strength, fast hardening, good volume stability, and chemical resistance with a spatial three-dimensional network bonding structure [28]. The material used in this study was metakaolin (Mk) with white powder produced by Shengyun Mining Company in Hebei Province, China. The specification of this metakaolin was AS2-1250MESH, as shown in Figure 2c, and the chemical composition of this metakaolin was a total content of over 94% silicon and aluminum, as shown in Table 4.

3.2. Solidification Time

The “pouring cup method” was used to test the solidification time of the slurry mixed with additives and cement soil. The grouting materials were prepared in the proportion of water, cement and additives; the composed grouting fluids were poured back and forth at a fixed frequency of 15 s/time until they stopped flowing. The solidification time was the time difference between the completion time of stirring the grouting fluids and the time that fluids stopped flowing.

3.2.1. OPC without Additives

The cement used in this study was ordinary Portland cement (OPC 42.5). The chemical composition of this cement is shown in Table 4.
The solidification times of grouting fluids with different contents of OPC are shown in Figure 3. The solidification time of grouting fluids decreased with the water-cement ratio. When the conventional water:cement ratio was 1:1, the solidification time of grouting fluids was 41 min. The solidification time could not prevent the dynamic action of groundwater from interfering with the solidification of cement soil.

3.2.2. HPCG

Figure 4 shows the solidification times of grouting fluids with different ratios of group A and group B. The curve in Figure 4 is V-shaped in the condition that the ratio of group A and group B increased under the constant ratio of high-polymer additive to water (1:3). When the ratio of group A to group B was 2:1, the solidification time reached a minimum, and the recommended ratio of group A to group B was 2:1.
Figure 5 shows the solidification times of grouting fluids with different ratios of high polymer and water. The curve in Figure 5 is the monotonic decline in the condition that the ratio of high-polymer additive and water increased. The solidification time of grouting fluids should be controlled in the range of 10 min to 20 min according to the hydrodynamic characteristics of the water-rich sand stratum, which inferred that the optimal ratio of high-polymer and water was greater than 1:3, and the water to cement ratio was 0.8.

3.2.3. RPCG

Figure 6 shows the solidification times of grouting fluids with different ratios of cement, red mud and phosphogypsum. When the water to cement ratio was constantly 1:1, and the ratio of red mud to phosphogypsum was 7:1, the solidification time of grouting fluids decreased with increased amounts of red mud and phosphogypsum. When the ratio of cement to the sum of red mud and phosphogypsum was 2:1, the solidification time was 36 min. When the ratio of cement to the sum of red mud and phosphogypsum was 1:1 after adding the amount of red mud, the solidification time showed no obvious change. Thus, the ratio of cement to the sum of red mud and phosphogypsum was proposed as 2:1.

3.2.4. MKCG

Figure 7 shows the solidification times of grouting fluids with different ratios of cement and metakaolin. When the water to cement ratio was constantly 1:1, the solidification time of grouting fluids increased with increased metakaolin. However, the range of change was not obvious, and the solidification time was 5 min ahead of OPC.

3.3. Permeability Test

The TJSS-25 permeability test device by Tianjin Luda Construction Instruments Company was used in this study to test the permeability of the samples. The device could simultaneously carry out the normal head permeability test of three cement soil specimens, with a maximum permeation pressure of 4 MPa and an accuracy of 0.02 MPa.

3.3.1. OPC without Additives

Figure 8 shows the permeability coefficient of cement-stabilized silt with different contents of cement, under a constant ratio of water to cement. Although an increase in the content of cement and the ratio of water to cement can improve the impermeability of cement-stabilized silt, no matter what the water to cement ratio and the cement content were, the permeability coefficients of cement-stabilized silt never changed by more than an order of magnitude, and were basically below 10−6 cm/s to meet the requirements of curtain grouting anti-seepage.

3.3.2. HPCG

Figure 9 shows the permeability coefficients of cement–high-polymer-stabilized silt with different ratios of high-polymer additive and cement. An increase in the ratio of high-polymer to cement improved the impermeability of the cement–high-polymer-stabilized silt. When the ratio of high-polymer to cement was greater than 1/420, the permeability coefficient of cement–high-polymer-stabilized silt became lower than 1 × 10⁻⁷ cm/s. However, excessive content of high-polymer additive not only increases the cost of jet grouting, but also causes blockage of jet pipes during the construction of jet grouting. Therefore, the ratio of high-polymer additive to cement was recommended as 100/420, and the mass ratio of high-polymer additive to water was recommended as 1:3.

3.3.3. RPCG

Figure 10 shows the permeability coefficients of cement–red mud-phosphogypsum-stabilized silt with different ratios of cement, and the sum of red mud and phosphogypsum. When the ratio of cement to the sum of red mud and phosphogypsum was in the range from 5:1 to 3:1, an increase in the content of red mud and phosphogypsum significantly decreased the permeability coefficient of cement–red mud-phosphogypsum-stabilized silt, which caused a difference of an order of magnitude. Therefore, the ratio of cement to the sum of red mud and phosphogypsum was recommended as 2:1, and the ratio of water to cement was recommended as 0.8.

3.3.4. MKCG

Figure 11 shows the permeability coefficients of cement–metakaolin-stabilized silty sands with different ratios of cement and metakaolin. The permeability coefficient of cement–metakaolin-stabilized silty sands with total cement–metakaolin contents of 15% decreased initially, then increased with the dosage of metakaolin minerals. The reason for these variations was that the calcium hydroxide formed by the hydration of cement could fully rehydrate with the silicon aluminum oxides in metakaolin or covalently polymerize the silicon aluminum oxides in metakaolin in an alkaline environment; more cementitious materials were formed to fill the pores in silty sands, thereby effectively improving the impermeability of silty sand [29,30], when the ratio of cement to metakaolin was greater than 5:1. However, when the ratio of cement to metakaolin was less than 5:1, even after further increases, the calcium hydroxide formed by hydration of cement could also rehydrate with part of the silicon aluminum oxide in metakaolin; the limited amount of hydroxyl ions had already not satisfied the rehydration requirement of silicon aluminum oxide in metakaolin or covalent aggregation. Therefore, the impermeability improvement of silt stabilized by admixtures of cement and metakaolin was not ideal [31]. The experimental results show that the suitable ratio of cement to metakaolin is 5:1, and the ratio of water to cement is 0.8.

4. Information-Based Construction

4.1. Framework of the Information Monitoring System

Information-based construction was implemented based on adding an information monitoring system to the jet grouting machine. The information-based jet grouting machine can provide real-time feedback on the construction parameters and quality information of jet grouting to control its quality in the column. Figure 12 shows the framework of the information monitoring system of jet grouting. The jet grouting machine included a drilling system, pulping system and feeding system. The information monitoring system included monitoring sensors, an operating host and a LORA wireless host.

4.2. Monitoring Sensor

The monitoring sensors fixed on the drilling system contained a speed sensor and a depth sensor for monitoring the retracting velocity and rotation velocity of the drill, and the position of slurry spraying. The monitoring sensors fixed on the feeding system contained an electromagnetic flowmeter and pressure gauge for monitoring the pressure and flow rate of grouting, respectively, which recorded data every 10 milliseconds to calculate the amount of cement paste per second with principles of calculus, and to estimate the diameter of the jet grouting column. An automatic pulping station was used in the pulping system for real-time monitoring of the water:cement ratio. Figure 13 shows the installation of monitoring sensors.

4.3. Operating System

The operating system was programmed based on the construction process and operating steps of double fluid jet grouting, which specifically included four steps, as shown in Figure 14. The operating system had three modules, including work, set and data; the interface is shown in Figure 14a. In the setup menu, there were three submenus of workmode, recordmode and polemode, and the setting of water/cement, as shown in Figure 14b. In the workmode, there were three types of jet grouting, including single fluid, double fluid and triple fluid. The recordmode was used to record the monitoring data by drilling depth and drilling time. The polemode had two modes, single pole and continuous pole. Figure 14c shows that the working monitor recorded the jet grouting parameters, including lifting speed, injection pressure, grout flow volume, rotation rate, depth and total slurry. Figure 14d shows the history data storage including time, depth, pile ID and other jet grouting parameters.

4.4. Test of Information-Based Construction

The proportion of grouting fluids in HPCG, RPCG and MKCG are shown in Table 5, which were acquired from the screening of grouting additives in Section 3. The design length of the jet grouting column was 2 m, the design diameter of the jet grouting column was 60 cm. The bottom elevation of the jet grouting column was —10 m, and the jet grouting column was in the silt sand stratum. Referring to Table 5, three types of grouting fluids were mixed with the additives in HPCG, RPCG and MKCG in the automatic pulping station, as shown in Figure 15, when the drill rod was rotated and retracted from the drilling hole. Grouting additives were injected into the soil to promote solidification. The use of additives made the soil–cement admixture gel. In the information-based construction test, the construction specifications of jet grouting used were a drill rotational velocity of 10 r/min, a drill lifting speed of 0.2 m/min, an injection pressure of 20 MPa, and a grouting flow rate of 40 L/min. Figure 16 shows the monitoring data of double fluid jet grouting information-based construction on three additives, HPCG, RPCG and MKCG. The grout flow volume of HPCG and RPCG reached about 40 L/min; the injection pressure of HPCG and RPCG reached the design value of 20 MPa. The grout flow volume of MKCG was unstable, the range of which varied between 45 L/min and 15 L/min, and the injection pressure of MKCG reached about 25 MPa.

5. In Situ Coring Test

5.1. Preparation of Coring Samples

Figure 17 shows the coring from the information-based construction tests 60 days after construction. The diameters of jet grouting columns were checked, as were the piling qualities of jet grouting for HPCG, RPCG and MKCG, which were 58 cm, 54 cm and 50 cm, respectively. HPCG showed the best diffusivity of the three additives in the water-rich sand stratum.
Figure 18 shows core sampling from the jet grouting columns; the inner diameter of the drill bit was 95 mm. Figure 19 shows the round table samples of permeability coefficient tests; a JWL-1018 lathe was used to process those permeability coefficient test samples. The dimensions of the permeability samples were 7 cm in top diameter, 8 cm in bottom diameter, and 3 cm in height.

5.2. Permeability Test

Table 6 shows the permeability test results of HPCG. The permeability coefficients of HPCG-1 and HPCG-2 were about 7 × 10⁻⁸ cm/s at a seepage pressure of 300 kPa. The permeability coefficients of HPCG-3 to HPCG-6 ranged from 1.1 × 10⁻⁷ to 6.5 × 10⁻⁷ cm/s at a seepage pressure of 500 kPa. The average permeability coefficient of the seven samples was 2.61 × 10⁻⁷ cm/s, which was less than the 1.0 × 10⁻⁶ cm/s required by the specifications.
Table 7 shows the permeability test results of RPCG. The permeability coefficient of RPCG-1 was 4.23 × 10⁻⁶ cm/s at a seepage pressure of 600 kPa. The permeability coefficient of RPCG-2 was 1.2 × 10⁻⁶ cm/s at a seepage pressure of 1000 kPa. The permeability coefficients of RPCG-3 to RPCG C-5 were between 1.48 × 10⁻⁶ and 2.08 × 10⁻⁶ cm/s, respectively, at a seepage pressure of 500 kPa. The average permeability coefficient of the five samples was 2.7 × 10⁻⁶ cm/s, which was more than the standard requirement of 1 × 10⁻⁶ cm/s.
Table 8 shows the permeability test results of MKCG. The permeability coefficients of MKCG-1 and MKCG-2 were about 3.08 × 10⁻⁶ cm/s at a seepage pressure of 200 kPa. The permeability coefficient of MKCG-3 was 2.42 × 10⁻⁶ cm/s at a seepage pressure of 1000 kPa. The permeability coefficients of MKCG-4 and MKCG-5 were 3.68 × 10⁻⁶ and 4.28 × 10⁻⁶ cm/s at a seepage pressure of 500 kPa. The average permeability coefficient of the five samples was 3.31 × 10⁻⁶ cm/s, and all five exceeded the standard requirement of 1 × 10⁻⁶ cm/s.
Therefore, only the permeability coefficient of the HPCG core sample was less than the specification requirement of 1 × 10⁻⁶ cm/s, which reached an order of 10−7; meanwhile, the permeability coefficients of RPCG and MKCG core samples were both on the order of 10−6, and the permeability coefficient of the HPCG core sample was one order of magnitude higher, which met the water stopping requirement of the high-pressure jet column in the water-rich sand stratum.

5.3. SEM Observations

A JSM-5900 scanning electron microscope was adopted in this study. The microstructure observations were carried out via SEM at different magnification times to evaluate the stabilization effect of silty sands stabilized with HPCG, RPCG and MKCG.
Figure 20a shows the spatial network structure of the high-polymer additive; a series of chemical reactions occurred during the curing process of the polymer grouting material to form water-insoluble polymer compounds. The cluster blocks were connected by a dense network, the number of voids was greatly reduced, and the particle units and flocs were closely arranged, which improved the water-stopping performance of HPCG.
In Figure 20b, on the surface of the large particles and in the middle of the pores, there was an obvious rod-like or needle-like structure, which is a significant feature of the existence of ettringite. The structures in the system gradually connected to form a dense large block; therefore, the overhead pores could be easily observed. The positively charged Ca2+ provided in the RPCG, on the one hand, promoted the formation of ettringite and other hydration products; on the other hand, the positively charged Ca2+ and negatively charged soil particles combined to form colloidal condensation; however, there were voids in the internal structure of the soil, and the flocculant only attached to the granular units.
In Figure 20c, the MKCG cementation material transformed the contact connection between the flaky sand particles into a cementation connection. Due to the existence of different degrees of aluminosilicate polymers on the surface of soil particles and among the particles, previously tiny individual particles, stacks and flocs in the silica–aluminate polymer formed large bulk agglomerates that attached to the granular units, with voids between the granular units and the flocs.

6. Discussion

The mix proportions of grouting fluids in laboratory tests were verified by site tests of jet grouting and laboratory tests of drilling core samples to find reasonable specifications of information-based construction of jet grouting in the water-rich sand stratum. Figure 21 shows the comparison of permeability coefficients of in situ tests with laboratory tests at 28 days; permeability coefficients of HPCG, RPCG and MKCG in laboratory tests all reached an order of 10−7; however, only the permeability coefficients of the in situ core sample of HPCG reached an order of 10−7, which was similar to the results of the laboratory tests. This indicates the reasonableness of the optimal ratio of high polymer composite cement (HPCG). The permeability coefficients of in situ core samples of RPCG and MKCG reached an order of 10−6, both of which failed to achieve required results of the laboratory tests. The SEM results showed that the HPCG had a tight mesh between the granular units and the flocs, which could reduce the internal pore space and improve the impermeability of the soil. The flocs in RPCG and MKCG were only attached to the granular units, and were washed away by the groundwater dynamics in too slow a time.

7. Conclusions

This study introduced a solution to the severe cement flurry losses of jet grouting in the water-rich sand stratum from grouting fluids and information-based construction. Three grouting additives, including high-polymer additive, red mud and phosphogypsum and metakaolin, were screened with a series of laboratory tests on solidification time and permeability. Based on the monitoring system-equipped double fluid jet grouting system, the mix proportions of grouting fluids in laboratory tests were verified with site tests of jet grouting and laboratory tests of drilling core samples to find reasonable operation specifications of jet grouting in the water-rich sand stratum. Some main conclusions are obtained as follows:
(1)
The optimal ratio of HPCG is: A:B = 2:1, high-polymer additive:water > 1:3, water:cement ratio of 0.8. The solidification time of HPCG can be controlled in the range of 10 min to 20 min, which is more than 20 min shorter than the solidification time of OPC (40 min); the solidification time of RPCG and MKCG are similar to the solidification time of OPC.
(2)
Information-based construction of double liquid jet grouting can effectively monitor the key construction control parameters in real-time. The construction specifications of jet grouting are a drill rotational velocity of 10 r/min, a drill lifting speed of 0.2 m/min, an injection pressure of 20 MPa and a grouting flow rate of 40 L/min, which can effectively and stably control the quality of jet grouting. The pumping stability order of the three cement grouting material additives is: HPCG > RPCG > MKCG.
(3)
The permeability coefficients of cement-stabilized silt by three grouting additives in laboratory tests can all reach an order of 10−7, while only the permeability coefficient of HPCG in situ core samples reached an order of 10−7; these are similar to the laboratory results, which verifies the reasonableness of the optimal ratio of high-polymer composite cement (HPCG). The permeability coefficients of RPCG and MKCG in situ core samples could not reach the experimental results.
(4)
SEM images of HPCG show that the cluster blocks are connected by a dense network, and the particle units and flocs are closely arranged. It can be found that HPCG has significant performance advantages and good engineering applicability, and is a better grouting material for reinforcing underground engineering in the water-rich sand stratum.

Author Contributions

Conceptualization, P.Z.; methodology, P.Z. and S.W.; software, X.Q.; validation, S.W. and P.Z.; formal analysis, X.Q.; investigation, S.W.; resources, S.G.; data curation, S.G.; writing—original draft preparation, X.Q.; writing—review and editing, S.G. and P.Z.; visualization, S.G.; supervision, X.H.; project administration, P.Z.; funding acquisition, S.W. and X.Q. All authors have read and agreed to the published version of the manuscript.
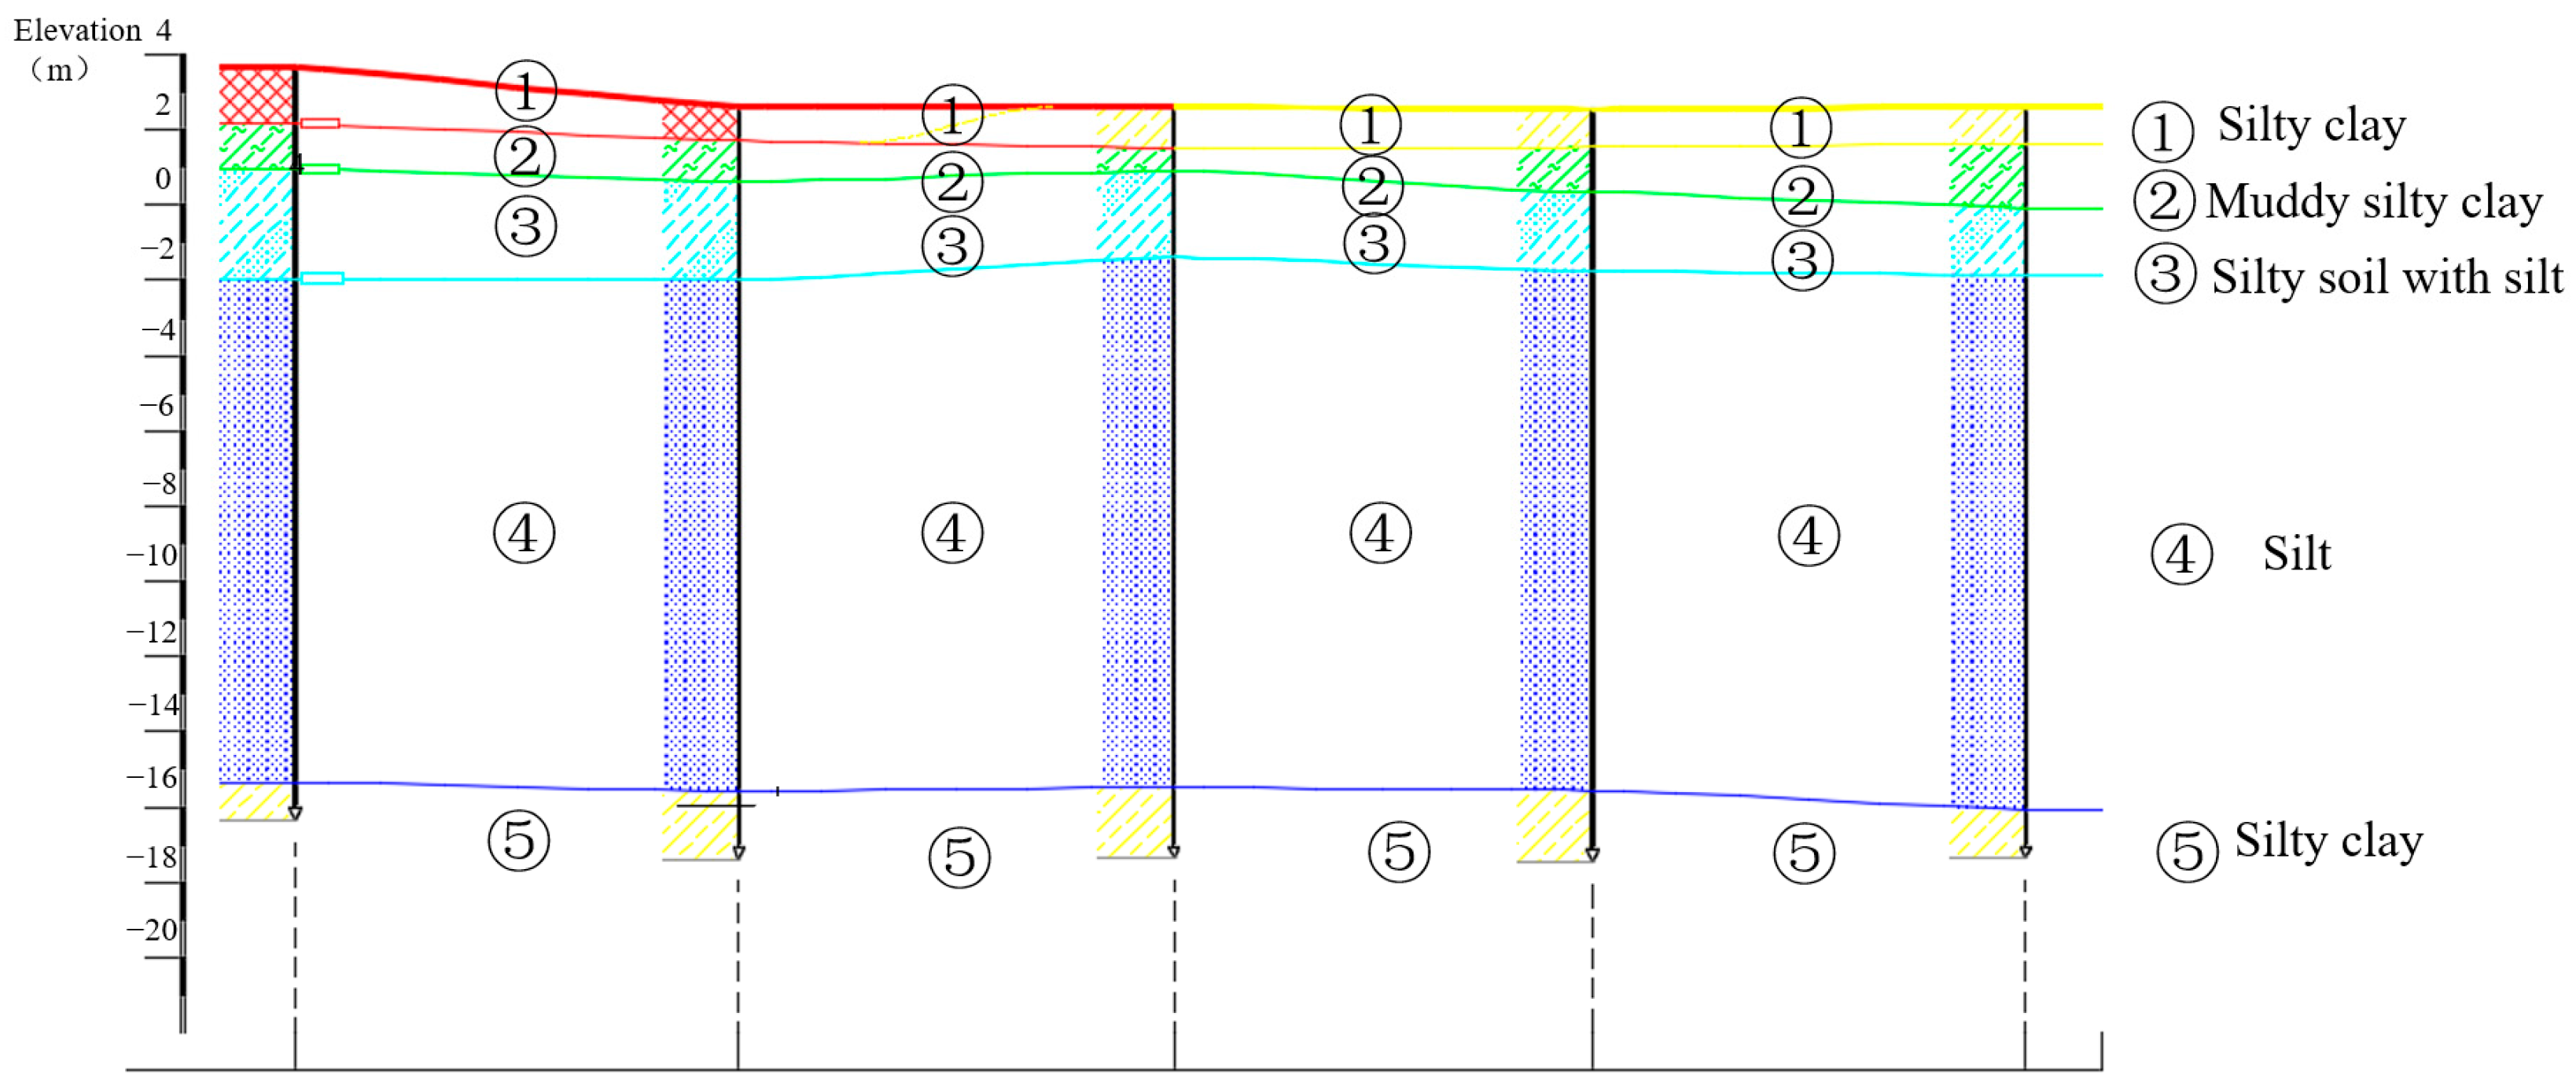
Funding

This study was funded by the National Natural Science Foundation of China (Grant No. 41902282), Science and Technology Planning Project of Jiangsu Province (Grant No. BE2022605), and the Scientific research planning project of Jiangsu Open University (The City Vocational College of Jiangsu) in 2022 during the “14th Five Year Plan” (Grant No. 2022XK013).

Institutional Review Board Statement

Not applicable.

Informed Consent Statement

Not applicable.

Data Availability Statement

Not applicable.

Conflicts of Interest

The authors declare no conflict of interest.

References

  1. Croce, P.; Modoni, G. Design of jet-grouting cut-offs. Proc. Inst. Civ. Eng.-Ground Improv. 2007, 11, 11–19. [Google Scholar] [CrossRef]
  2. Lignola, G.P.; Flora, A.; Manfredi, G. Simple Method for the Design of Jet Grouted Umbrellas in Tunneling. J. Geotech. Geoenviron. Eng. 2008, 134, 1778–1790. [Google Scholar] [CrossRef]
  3. Modoni, G.; Bzówka, J. Analysis of Foundations Reinforced with Jet Grouting. J. Geotech. Geoenviron. Eng. 2012, 138, 1442–1454. [Google Scholar] [CrossRef]
  4. Akin, M.K. Experimental studies on the physico-mechanical properties of jet-grout columns in sandy and silty soils. J. Afr. Earth Sci. 2016, 116, 190–197. [Google Scholar] [CrossRef]
  5. Modoni, G.; Wanik, L.; Maria, C.M.; Salvatore, E.; Bzówka, J.; Shui-Long, S.; Daniele, V.; Pingue, L. Strength of sandy and clayey soils cemented with single and double fluid jet grouting. Soils Found. 2019, 59, 942–954. [Google Scholar] [CrossRef]
  6. Nikbakhtan, B.; Ahangari, K. Field study of the influence of various jet grouting parameters on soilcrete unconfined compressive strength and its diameter. Int. J. Rock Mech. Min. Sci. 2010, 47, 685–689. [Google Scholar] [CrossRef]
  7. Modoni, G.; Flora, A.; Lirer, S.; Ochma’nski, M.; Croce, P. Design of jet grouted excavation bottom plugs. J. Geotech. Geoenviron. Eng. 2016, 142, 04016018. [Google Scholar] [CrossRef]
  8. Croce, P.; Flora, A.; Modoni, G. Jet Grouting: Technology, Design and Control; CRC Press: Boca Raton, FL, USA, 2014; pp. 10–12. [Google Scholar]
  9. Croce, P.; Flora, A. Analysis of single-fluid jet grouting. Géotechnique 2000, 50, 739–748. [Google Scholar] [CrossRef]
  10. Fang, Y.S.; Kao, C.C.; Chou, J.; Chain, K.F.; Wang, D.R.; Lin, C.T. Jet grouting with the superjet-midi method. Proc. Inst. Civ. Eng.-Ground Improv. 2006, 10, 69–76. [Google Scholar] [CrossRef]
  11. Essler, R. The design of jet grouting from concept to execution. In Grouting and Deep Mixing 2012; Johnsen, L.F., Bruce, D.A., Byle, M.J., Eds.; Geotechnical Special Publication No. 228; American Society of Civil Engineers: Reston, VA, USA, 2012; pp. 2071–2081. [Google Scholar]
  12. Shen, S.-L.; Wang, Z.-F.; Yang, J.; Ho, C.-E. Generalized Approach for Prediction of Jet Grout Column Diameter. J. Geotech. Geoenviron. Eng. 2013, 139, 2060–2069. [Google Scholar] [CrossRef]
  13. Shen, S.-L.; Wang, Z.-F.; Horpibulsuk, S.; Kim, Y.-H. Jet grouting with a newly developed technology: The Twin-Jet method. Eng. Geol. 2013, 152, 87–95. [Google Scholar] [CrossRef]
  14. Shen, S.-L.; Wang, Z.-F.; Sun, W.-J.; Wang, L.-B.; Horpibulsuk, S. A field trial of horizontal jet grouting using the composite-pipe method in the soft deposits of Shanghai. Tunn. Undergr. Space Technol. 2013, 35, 142–151. [Google Scholar] [CrossRef]
  15. Shen, S.L.; Wang, Z.F.; Cheng, W.C. Estimation of lateral displacement induced by jet grouting in clayey soils. Geotechnique 2017, 67, 621–630. [Google Scholar] [CrossRef]
  16. Guatteri, G.; Koshima, A.; Pieroni, R.M. Challenges in execution of jet grouting curtains at the Estreito HPP. In Grouting and Deep Mixing 2012; Johnsen, L.F., Bruce, D.A., Byle, M.J., Eds.; Geotechnical Special Publication No. 228; American Society of Civil Engineers: Reston, VA, USA, 2012; pp. 2102–2111. [Google Scholar]
  17. Kimpritis, T. The Control of Column Diameter and Strength in Jet Grouting Processes and the Influence of Ground Conditions. Ph.D. Thesis, Imperial Collage London, London, UK, 2013. [Google Scholar]
  18. Tinoco, J.; Correia, A.G.; Cortez, P. A novel approach to predicting Young’s modulus of jet grouting laboratory formulations over time using data mining techniques. Eng. Geol. 2014, 169, 50–60. [Google Scholar] [CrossRef]
  19. Busato, L.; Boaga, J.; Peruzzo, L.; Himi, M.; Cola, S.; Bersan, S.; Cassiani, G. Combined geophysical surveys for the characterization of a reconstructed river embankment. Eng. Geol. 2016, 211, 74–84. [Google Scholar] [CrossRef]
  20. Burke, G.K. The State of the Practice of Jet Grouting. Grouting Deep. Mix. 2012, 2012, 74–88. [Google Scholar] [CrossRef]
  21. Nikbakhtan, B.; Osanloo, M. Effect of grout pressure and grout flow on soil physical and mechanical properties in jet grouting operations. Int. J. Rock Mech. Min. Sci. 2008, 46, 498–505. [Google Scholar] [CrossRef]
  22. Nikbakhtan, B.; Ahangari, K.; Rahmani, N. Estimation of jet grouting parameters in Shahriar dam, Iran. Min. Sci. Technol. 2010, 20, 472–477. [Google Scholar] [CrossRef]
  23. Güllü, H.; Canakci, H.; Fareeq, I.; Zangana, A. Use of cement based grout with glass powder for deep mixing. Constr. Build. Mater. 2017, 137, 12–20. [Google Scholar] [CrossRef]
  24. Ho, L.S.; Nakarai, K.; Ogawa, Y.; Sasaki, T.; Morioka, M. Strength development of cement-treated soils: Effects of water content, carbonation, and pozzolanic reaction under drying curing condition. Constr. Build. Mater. 2017, 134, 703–712. [Google Scholar] [CrossRef]
  25. Tinoco, J.; Correia, A.G.; Cortez, P. Jet Grouting Mechanicals Properties Prediction using Data Mining Techniques. Grouting Deep. Mix. 2012, 2012, 2082–2091. [Google Scholar] [CrossRef]
  26. Sha, F.; Li, S.; Liu, R.; Li, Z.; Zhang, Q. Experimental study on performance of cement-based grouts admixed with fly ash, bentonite, superplasticizer and water glass. Constr. Build. Mater. 2018, 161, 282–291. [Google Scholar] [CrossRef]
  27. Saada, Z.; Canou, J.; Dormieux, L.; Dupla, J.C.; Maghous, S. Modelling of cement suspension flow in granular porous media. Int. J. Numer. Anal. Methods Geomech. 2005, 29, 691–711. [Google Scholar] [CrossRef]
  28. Wang, S.N.; Xue, Q.P.; Zhu, Y.; Li, G.Y.; Wu, Z.J.; Zhao, K. Experimental study on material ratio and strength performance of geopolymer-improved soil. Constr. Build. Mater. 2021, 267, 120469. [Google Scholar] [CrossRef]
  29. Wu, Z.L.; Zhu, X.Y.; Deng, Y.F.; Liu, H.S.; Zha, F.S. Behavior and micro-mechanism of cement-based modified compaction soil composed of steel slag and metakaolin. China J. Highw. Transport. 2017, 30, 18–26. [Google Scholar]
  30. Chu, C.F.; Li, X.C.; Deng, Y.F.; Tang, J.W. Influence of metakaolin on mechanical properties of cement-modified marine soft soil. Chin. J. Geotech. Eng. 2013, 35, 170–174. [Google Scholar]
  31. Ma, D.D.; Ma, Q.Y.; Huang, K.; Zhang, R.R. Pore structure and dynamic mechanical properties of geopolymer cement soil based on nuclear magnetic resonance technique. Chin. J. Geotech. Eng. 2021, 43, 572–578. [Google Scholar]
Figure 1. Geology of the place of study.
Applsci 12 12586 g001
Figure 2. Types of additives. (a) High-polymer. (b) Red mud. (c) Metakaolin.
Applsci 12 12586 g002
Figure 3. Solidification times of grouting fluids with OPC.
Applsci 12 12586 g003
Figure 4. Solidification times with different ratios of group A and group B.
Applsci 12 12586 g004
Figure 5. Solidification times with different ratios of high polymer and water.
Applsci 12 12586 g005
Figure 6. Solidification times with different ratios of cement, red mud and phosphogypsum.
Applsci 12 12586 g006
Figure 7. Effect of the ratio on the solidification aging of MKCG.
Applsci 12 12586 g007
Figure 8. Permeability coefficient of cement–soil with different contents of cement.
Applsci 12 12586 g008
Figure 9. Permeability coefficients of HPCG.
Applsci 12 12586 g009
Figure 10. Permeability coefficients of RPCG.
Applsci 12 12586 g010
Figure 11. Permeability coefficients of MKCG with different cement to metakaolin ratios.
Applsci 12 12586 g011
Figure 12. Framework of the information monitoring system of jet grouting.
Applsci 12 12586 g012
Figure 13. Installation of monitoring sensors. (a) Flowmeter. (b) Speed sensor. (c) Depth sensor. (d) Pressure sensor.
Applsci 12 12586 g013
Figure 14. The operating system for the double fluid jet grouting system. (a) Interface. (b) Setup menu. (c) Working monitor. (d) Data history.
Applsci 12 12586 g014
Figure 15. On-site mixing of modified cement grouting materials. (a) HPCG. (b) RPCG. (c) MKCG.
Applsci 12 12586 g015
Figure 16. Information monitoring data during construction of test columns. (a) HPCG. (b) RPCG. (c) MKC.
Applsci 12 12586 g016aApplsci 12 12586 g016b
Figure 17. Excavation site of test piles.
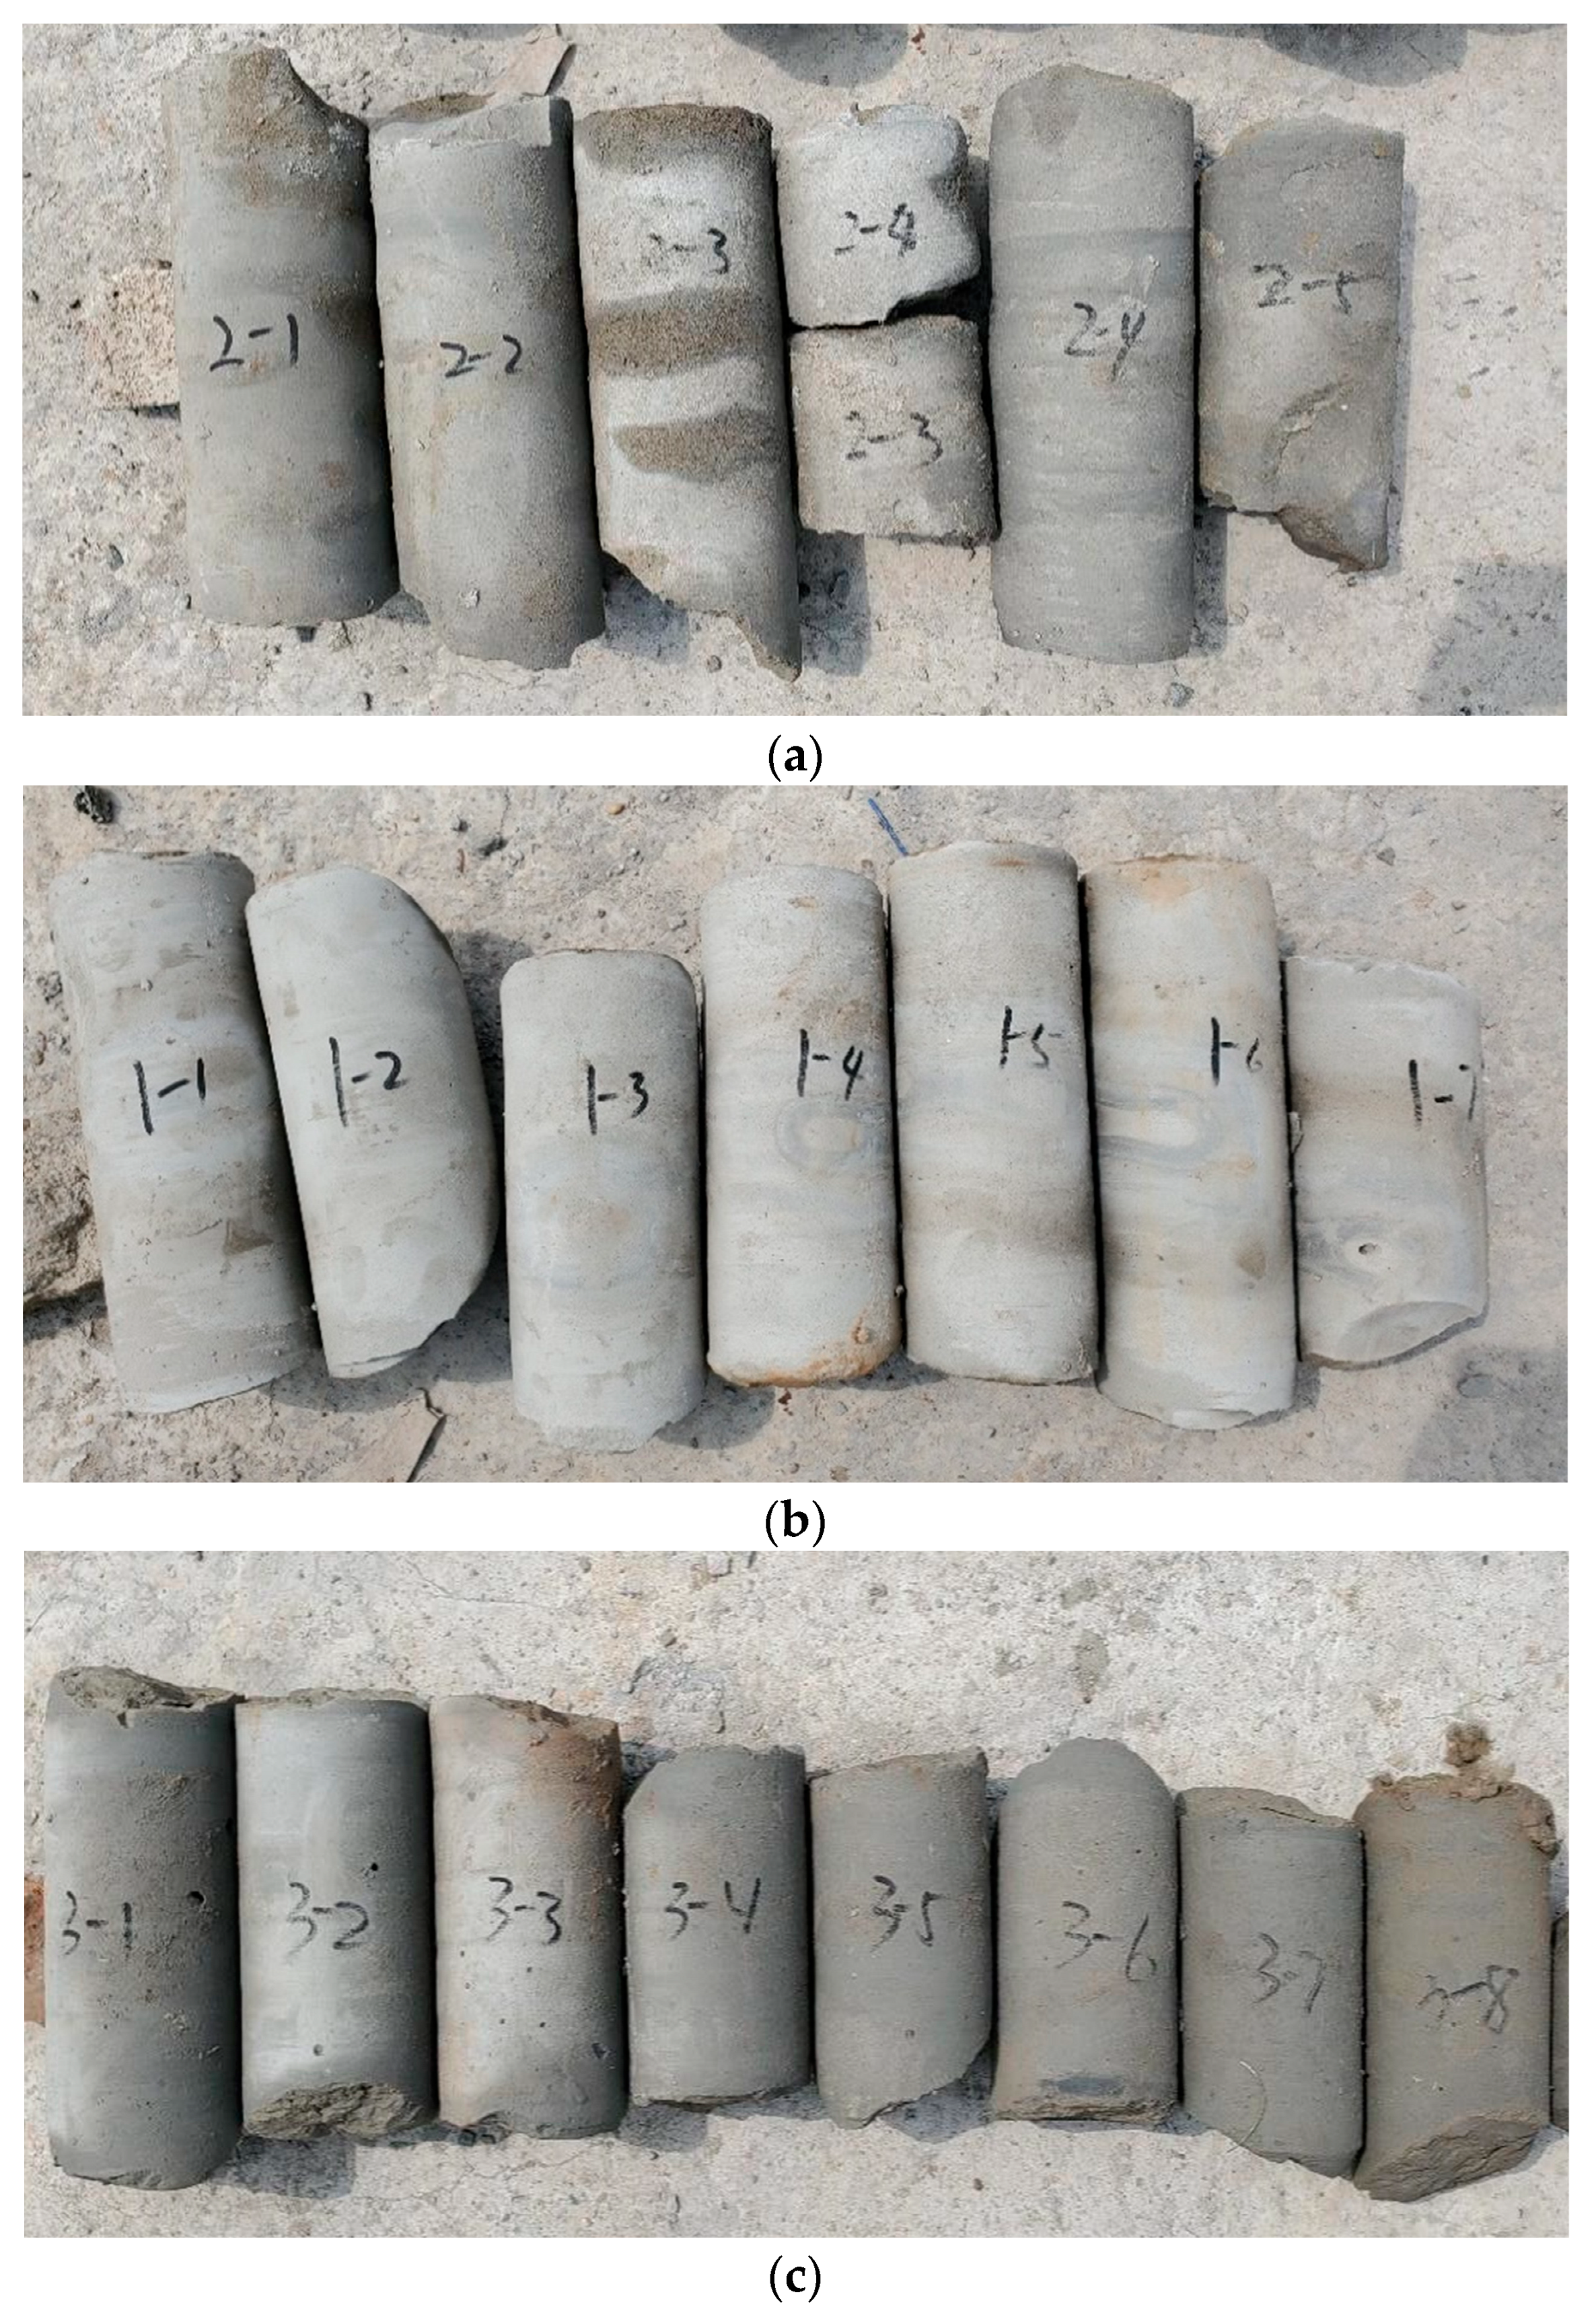
Applsci 12 12586 g017
Figure 18. Core sampling of site tests. (a) HPCG. (b) RPCG. (c) MKCG.
Applsci 12 12586 g018
Figure 19. Round table samples of permeability coefficient tests. (a) HPCG. (b) RPCG. (c) MKCG.
Applsci 12 12586 g019
Figure 20. SEM results of test columns. (a) HPCG. (b) RPCG. (c) MKCG.
Applsci 12 12586 g020aApplsci 12 12586 g020b
Figure 21. Comparison of permeability coefficients of in situ tests with laboratory tests at 28 days.
Applsci 12 12586 g021
Table 1. Physical indexes of the silt.
Sampling Depth (m)Specific GravitySaturation Density (g/cm3)Dry Density (g/cm3)Void RatioLiquid Limit (%)Plastic Limit (%)Plasticity Index (%)Liquid Index (%)
3.8~4.02.691.941.520.76033.622.67.00.67
4.8~5.02.681.941.520.759
6.8~7.02.682.001.580.691
9.8~102.681.941.440.864
11.3~11.52.681.931.440.856
Table 2. Permeability coefficients of the silt.
Sampling Depth (m)Vertical Permeability Coefficient (10−3cm/s)Horizontal Permeability Coefficient (10−3cm/s)
3.8~4.01.853.76
4.8~5.04.127.48
6.8~7.02.645.13
9.8~10.01.763.25
11.3~11.52.143.62
Table 3. Chemical composition of metakaolin and red mud.
MetakaolinChemical compositionSiO2Al2O3Fe2O3CaOMgOK2ONa2OSO3TiO2
Proportion/%57.1637.71.280.130.090.550.010.013.06
Red mudChemical compositionSiO2Al2O3Fe2O3CaOMgONa2OSO3TiO2Others
Proportion/%26.7123.75.8215.561.136.153.513.3614.06
Table 4. Chemical composition of ordinary Portland cement.
CaOSiO2Al2O3Fe2O3SOMgOF-CaOLoss on Ignition
57.2223.198.614.081.931.041.372.56
Table 5. Proportion of test columns.
Grouting MaterialMass of Each Component/kg
HPCGGroup AGroup BCementWater
157.5100100
RPCGRed mudPhosphogypsumCementWater
35580100
MKCGMetakaolinCementWater
20100100
Table 6. Permeability coefficients of HPCG.
Case IDSeepage Pressure/(kPa)Permeability Coefficient/(cm/s)Average Permeability Coefficient/(cm/s)
HPCG-13007.27 × 10−82.61 × 10⁻⁷
HPCG-23006.50 × 10−8
HPCG-35002.34 × 10−7
HPCG-45001.87 × 10−7
HPCG-55006.45 × 10−7
HPCG-65001.13 × 10−7
HPCG-73005.14 × 10−7
Table 7. Permeability coefficients of RPCG.
Case IDSeepage Pressure/(kPa)Permeability Coefficient/(cm/s)Average Permeability Coefficient/(cm/s)
RPCG-16004.23 × 10−62.7 × 10⁻⁶
RPCG-210001.20 × 10−6
RPCG-35001.49 × 10−6
RPCG-45002.08 × 10−6
RPCG-55001.48 × 10−6
Table 8. Permeability coefficients of MKCG.
Case IDSeepage Pressure/(kPa)Permeability Coefficient/(cm/s)Average Permeability Coefficient/(cm/s)
MKCG-12003.09 × 10−63.31 × 10⁻⁶
MKCG-22003.08 × 10−6
MKCG-310002.42 × 10−6
MKCG-45003.68 × 10−6
MKCG-55004.28 × 10−6
Publisher’s Note: MDPI stays neutral with regard to jurisdictional claims in published maps and institutional affiliations.

