Article

Numerical Analysis on Spanwise Correlation of Vortex-Induced Force of Split Double-Box Beam

Department of Civil Engineering, Northeast Forestry University, Harbin 150040, China
*
Author to whom correspondence should be addressed.
Appl. Sci. 2022, 12(24), 12668; https://doi.org/10.3390/app122412668
Submission received: 12 October 2022 / Revised: 30 November 2022 / Accepted: 9 December 2022 / Published: 10 December 2022

Abstract

:
The vortex-induced force of bridges is not synchronized along the span direction. The spatial correlation of vortex-induced force becomes obvious when the span of the bridge structure gradually increases, and the mass gradually decreases. Therefore, it is important to study the spanwise correlation of vortex-induced forces of long-span bridges to ensure the accuracy of the prediction of vortex-induced vibration response of bridges. The study established and improved the theory and experimental research methods for vortex-induced vibration analysis of large-span bridges by discussing the spanwise correlation during vortex-induced vibration of the split double-box beam. Taking Xihoumen Bridge as the object, two-dimensional (2D) and three-dimensional (3D) numerical models of the scaled-down sections were designed and established based on the ANSYS Fluent platform and the RANS SST turbulence model. Based on the Newmark-β algorithm, a User Defined Function (UDF) was written for vortex vibration calculation, the three-dimensional bypass of the split double-box beam in static conditions and vortex-induced vibration of the split double-box beam of which were calculated, and the spanwise correlations of the aerodynamic coefficients, the surface pressure coefficients, and the wake wind velocity of the main girder section were analyzed for the static and vibration states of the bridge. The results show that the self-excited force of the split double-box beam in vortex-induced vibration improved its spanwise correlation. Compared with those in a static state, the spanwise correlation of the lift coefficient and torque coefficient increased by 55% and 87%, respectively, and the resistance coefficient increased by more than 10 times. The correlation of the pressure coefficients increased by 153%. The correlation of wake wind velocity increased by 37% in the along-wind direction and that in the across-wind and vertical-wind direction increased by more than 10 times. The accuracy of the numerical simulation results was verified by comparing the pressure distribution and pressure spanwise correlation of the main beam with field-measured data.

1. Introduction

As a relatively new type of box beam, the split double-box beams are used in long-span bridges, the structure of which relies more and more widely on their superior flutter stability and higher critical flutter wind speed than the traditional box beams [1]. However, the existence of the middle groove causes the complex flow field around the main beam. As a result, the vortex-induced vibration performance becomes much worse. The vortex-induced vibration of split double-box beam has often been observed in engineering practices in recent years, such as the Akashi Strait Bridge [2], the Denmark Dahai Bridge [3], and the Xihoumen Bridge [4,5]. The vortex-induced vibration generally occurs at a low wind speed. Although vortex-induced vibration will not cause destructive damage, the impact on driving comfort and safety should not be ignored. Therefore, it is of vital importance to study the mechanism of vortex-induced vibration.
There is much research on the vortex-induced vibration of split double-box beams. Taking a long-span suspension bridge as the research object, Wang studied the flow field characteristics of split double-box beam through the wind tunnel and particle imaging technology [6]. Laima conducted a wind tunnel test on the segment model of the split double-box beam and analyzed the fluid flow law of the flow field around the split double-box beam at low Reynolds number conditions [7]. Jing pointed out that the aerodynamic coefficients, the Storahar number, and the distribution of surface pressure present the Reynolds number effect obviously through a static test, and because of a dynamic test, the initial reduced wind speed, the width of the lock-in region and the maximum amplitude present Reynolds number effects [8].
Numerical simulation methods have the advantages of convenience, low cost, and the ability to impose some conditions that cannot be achieved experimentally, and with the development of CFD (computational fluid dynamics), the numerical simulation research method of bridge section vortex excitation force spreading correlation has been gradually recognized and adopted [9,10]. The research on the split double-box beam mainly focuses on the two-dimensional flow field characteristics of vortex-induced vibration, the response characteristics of vibration, and the Reynolds number effect, while there are few types of research on the three-dimensional characteristics. In fact, due to the influence of the three-dimensional characteristics of the actual wind field, the vortex-induced forces are not completely synchronized along the spanwise direction but also present certain three-dimensional characteristics instead. The spatial correlation of the vortex excitation force is more obvious, especially for large-span bridges.
The spanwise correlation of vortex-induced forces of bridge structures has attracted the attention of many scholars. Wilkinson found that the amplitude of structural vibration has a certain influence on the spanwise correlation of surface pressure on cylinder through the pressure test of the rigid segment model [11]. Zhang studied the spatial correlation of wind load on a typical streamlined closed box beam through a segmental model test and found that the spanwise correlation of wind load has a great impact on average velocities, turbulence, wind attack angle, and spanwise spacing [12]. Huang studied the spanwise correlation of the vortex-induced force of rectangular sections. The results showed that the spanwise correlation of vortex-induced force in the lock-in region is stronger than that outside the lock-in region. The spanwise correlation of wake wind speed was weaker than that of aerodynamic force [13]. Wang found that the spanwise correlation of the vortex-induced force of a rectangular model was better than that of a trapezoidal model through thae segmental model test [14]. Wei explored the mechanism of vortex-induced vibration (VIV) of a streamlined box girder from the perspective of the flow field and pressure distribution. The results demonstrate that the primary cause of VIV for streamlined box girders at large attack angles is the circulation process of the massive vortex structure production and dissipation on the upper surface, rather than the alternate shedding of symmetrical vortex pairs [15].
Although a few scholars have studied the vortex excitation force spreading correlation for bridges with simpler aerodynamic profiles (e.g., rectangular sections, closed-ended streamlined sections), fewer studies have been conducted on separated double box girder sections. It is believed that the vortex vibration response is perfectly correlated along the spanwise correlation, and replacing the aerodynamic correlation with that of the incoming flow when calculating the vortex-induced vibration response of bridges. In fact, as for large-span bridges, especially the split double-box beam with complex flow fields, the approximation is conservative and becomes one of the reasons why the actual vortex-induced vibration response is inconsistent with the calculation results [16,17].
Taking Xihoumen Bridge as the engineering background, the 2D and 3D numerical models of the scaled-down sections were designed and established based on the ANSYS Fluent platform and the RANS SST turbulence model. The bypass of the split double-box beam in static conditions and the vortex vibration response of the separated double-box beam section was investigated, to obtain the correlation of the aerodynamic force, surface pressure, and wake wind velocity. The study aims to obtain the correlation between among aerodynamic force, surface pressure, and wake velocity of the separated double box girder in the stationary and vibrating conditions. It is a complement to the vortex-induced vibration characteristics analysis of large-span bridges to gain a more comprehensive understanding of the vortex-induced vibration characteristics of such complex cross-sections as split double-box beams, and to optimize the design methods for large-span bridges to enhance their comprehensive wind resistance performance.

2. Basic Theory and Methods

2.1. Definition of Aerodynamic Correlation

The correlation coefficient is an index that reflects the degree of correlation between variables and the variation range of which is [−1, 1]. When the absolute value of the correlation coefficient is close to 1, the correlation is large and when it is close to 0, the correlation is small.
The spanwise correlation coefficient of an aerodynamic force of a cylinder in a uniform flow field is defined by the following formula [18]:
R C i δ / D = cov C i δ / D / var C i = X X ¯ Y Y ¯ X X ¯ 2 . Y Y ¯ 2
where: Ci—aerodynamic parameters (pressure coefficient and three component coefficient),
  • δ—spanwise spacing,
  • D—characteristic length of section,
X , X ¯ , Y , Y ¯ —a time-history curve of aerodynamic parameters at different positions of a cylinder.
The spanwise correlation coefficient of aerodynamic force of stationary mean beam in a uniform flow field defined by the following formula [18]:
R C i δ / D = exp c i δ D
where: ci—the exponential attenuation coefficient corresponding to the aerodynamic coefficient “Ci.
The degree of spanwise correlation of aerodynamic coefficients of the main beam in static state can also be expressed in terms of the correlation length Li [13]:
L i / D = 0 R C i δ / D d δ / D = 1 / c i
The aerodynamic force of main beam sections which are under vibration is composed of external excitation force and self-excitation force related to vibration. The correlation coefficient is defined by the following formula [18]:
R C i δ / D = 1 d i exp C i δ / D + d i
where: di—the horizontal asymptote of the attenuation function which represents the fully relevant part of the aerodynamic parameters; ci, di can be obtained by fitting the test data with the least square method.

2.2. Numerical Simulation of Turbulent Flow

2.2.1. Reynolds Averaging N-S Equation (RANS Equation)

Reynolds averaging method is to average the N-S equation and turn to solve the time-averaged N-S Equation (5), which can obtain better simulation results while greatly reducing the computational effort, and is currently a more widely used numerical simulation method [19,20].
t ρ u i + x j ρ u i u j = p x i + x j μ u i x j ρ u i u i ¯ + S i
The continuity equation based on RANS and equation of motion are, respectively:
u i / x i = 0
ρ u i ¯ t + x j ρ u i u j ¯ = p x i + x j μ u i ¯ x j ρ u i u i ¯
where: i , j = 1 , 2 , ρ = 1.225   kg / m 3 is density of air, μ = 1.7894 5 kg / m s is dynamic viscosity coefficient.

2.2.2. SST k-ω Turbulent Flow Model

The SST (Shear Stress Transport) k-ω model is a hybrid model proposed by Menter [21], whose core idea is to combine the k-ε model and the k-ω model. The k-ω model is used for the boundary layer region and the k-ε model for the free shear flow region, making full use of their respective advantages to improve the reliability and accuracy of the model. The expression of the SST k-ω model is given by:
ρ D k D t = x j μ e f f , k k x j + S k
ρ D ω D t = x i μ e f f , ω k x i + S ω
where: μ e f f , k and μ e f f , ω is equivalent viscosity of the turbulent term, S k and S ω are the source term of the specific dissipation rate of turbulent kinetic energy.
The reliability of the computational results using the SST k-ω model has been confirmed by many scholars. Given this, the SST k-ω model is used to simulate the turbulent viscosity in this paper [22,23,24].

2.3. Numerical Solution Method Based on FLUENT

2.3.1. Overview of Solver Methods

The basic flow of the software used for the calculation of the vortex-induced vibration in this paper is shown in Figure 1.
To perform vortex-induced vibration calculations of the bridge main beam, the main beam in the static state is fully bypassed at first and then suddenly released.
In each time step where the calculation is performed, the N-S equations are solved by Fluent to obtain the velocity and pressure fields around the main beam and the lift and torque acting on the main beam. The lift F y t and torque M α t acting on the main beam are extracted by the UDF program and substituted into the structural dynamics equations, and the vertical and torsional vibration equations:
m y ¨ + c y y ˙ + k y y = F y t
I m α ¨ + c α α ˙ + k α α = M α t
The Newmark-β method in UDF is used to solve Equations (10) and (11) to obtain the vertical and torsional displacements and velocities of the main beam at the corresponding moments. The velocities at this point are transferred to the main beam section and the accompanying fluid moves with the main beam in the rigid body through the dynamic grid macro DEFINE_CG_MOTION. The velocities are obtained in the dynamic grid region, the grid is updated using local redrawing of the dynamic grid, the calculation of this time step is completed, and the calculation is carried out in the next time step until the end of the calculation when the stable response is obtained.

2.3.2. Newmark-β Algorithm

The Newmark-β algorithm is essentially a time-domain stepwise integration method, whose basic principle is to replace the equilibrium conditions at any time by satisfying the structural dynamics equations at a finite number of momentary points, thus achieving the purpose of replacing the true solution accuracy with the displacements, velocities, and accelerations at particular time points [25].
The procedure for writing the Newmark-β algorithm in this paper is as follows.
1. Preparation of basic data and calculation of initial conditions
(1) Select the time step Δ t and parameters β γ , and calculate the integration constant
a 0 = 1 β Δ t 2 ,   a 1 = γ β Δ t ,   a 2 = 1 β Δ t ,   a 3 = 1 2 β 1 ,   a 0 = γ β 1 ,   a 5 = Δ t 2 γ β 2 ,   a 6 = Δ t 1 γ ,   a 7 = γ Δ t
(2) Given the initial values x 0 , x ˙ 0 and x ¨ 0 .
2. Formation of mass matrix M , damping matrix C , and stiffness matrix K .
3. Formation of the equivalent stiffness matrix K ^ :
K ^ = K + a o M + a 1 C
4. Calculation of the equivalent load at each time step t i + Δ t moment:
P ^ i + Δ t = P ^ i + Δ t + M a 0 x i + a 2 x ˙ i + a 3 x ¨ i + C a 1 x i + a 4 x i + a 5 x i
Calculation of the displacement at each time step t i + Δ t moment:
K ^ x i + Δ t = P ^ i + Δ t
Solving for the velocity and acceleration at each time step moment:
x ¨ i + Δ t = a 0 x i + Δ t x i a 2 x ˙ i a 3 x ¨ i
x ˙ i + Δ t = x ˙ i + a 6 x ¨ i + a 7 x ¨ i + Δ t
The dynamic response of the structural system at any point in time is obtained by cycling the calculation steps 4 to 6 until the calculation converges.

3. Overview of Numerical Simulation of Split Double-Box Beam

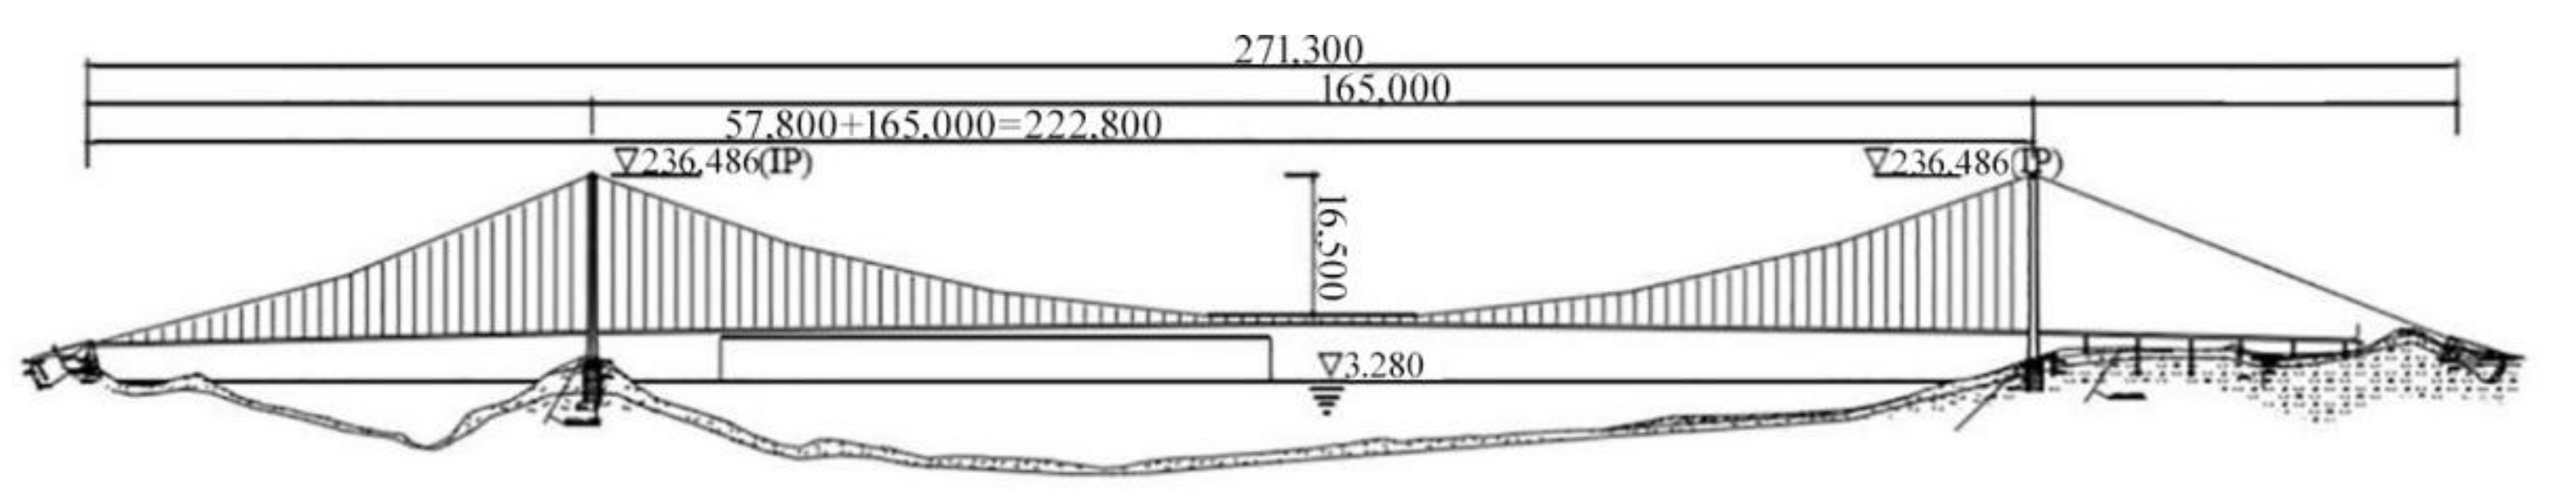
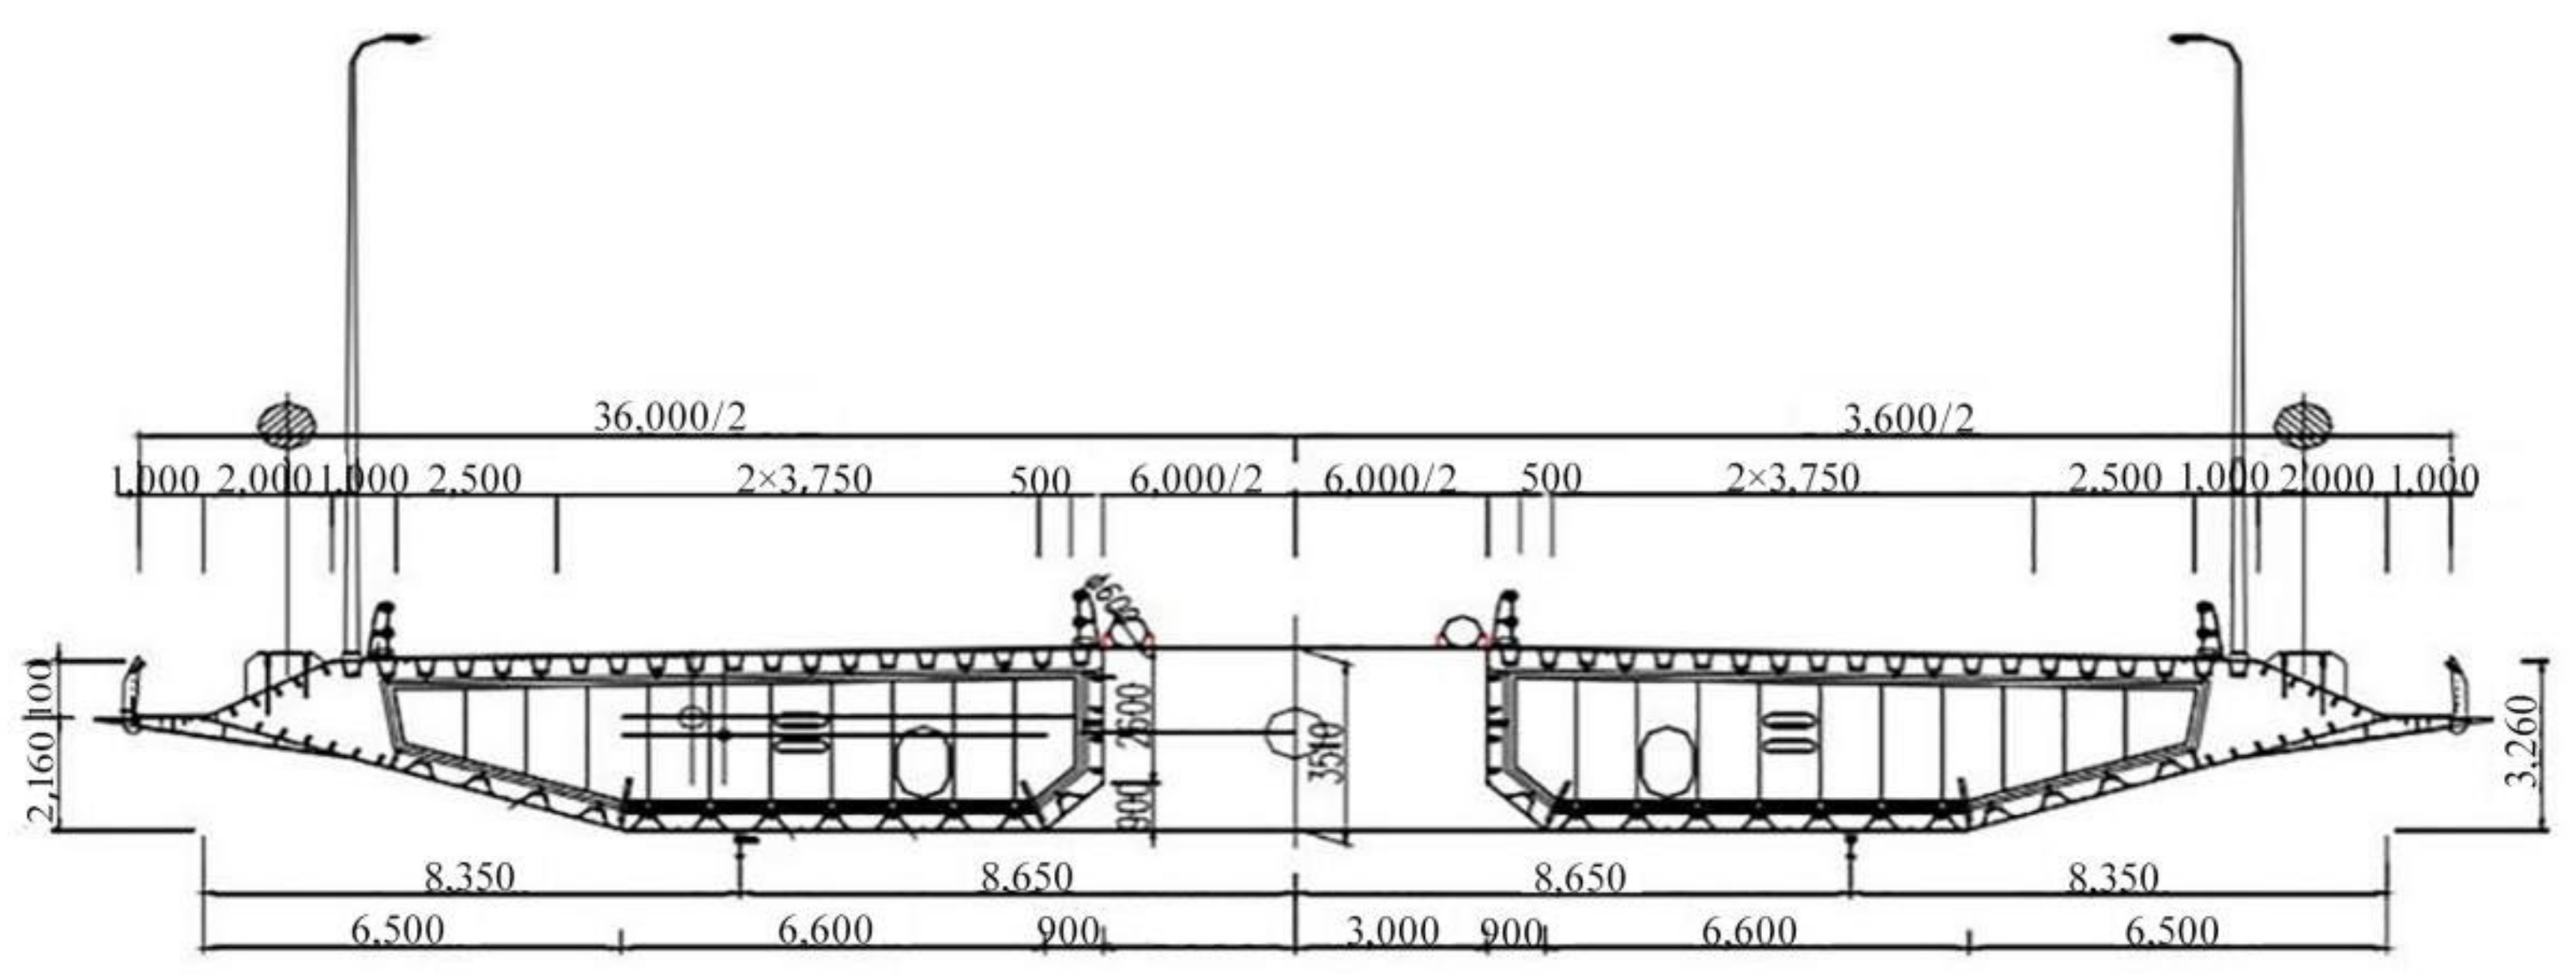
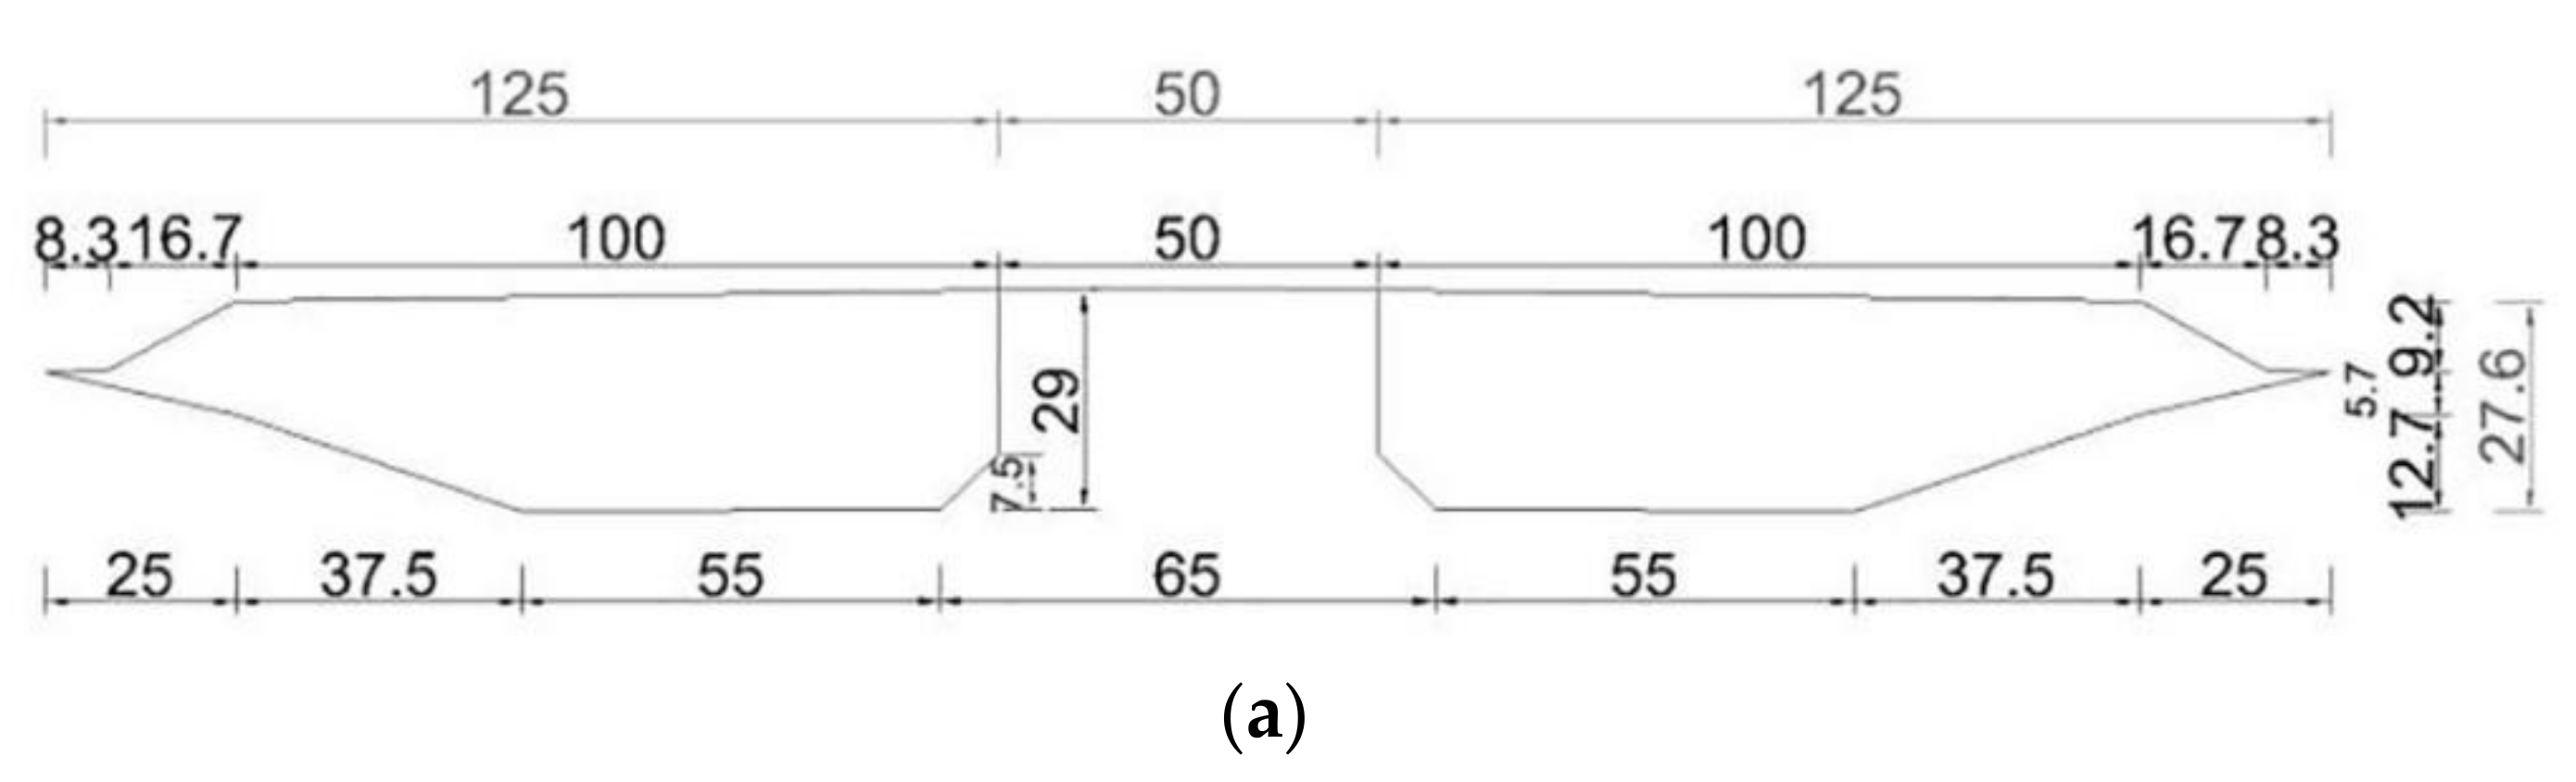
3.1. Overview of the Bridge Model

The Xihoumen Bridge, a split steel-box girder suspension bridge, is 2588 m in total with a 1650 m main bridge. The bridge adopts a (578 + 1650 + 485) m span layout (Figure 2). The central main span of the bridge is 1650 m, adopting a section of the steel-box girder with two spans of continuous split main beam, and the middle groove is 6 m in wide (Figure 3).

3.2. Establishment of Numerical Model

Taking Xihoumen Bridge as a prototype, the section scaling model design is carried out. The fixed section model scaling ratio is λ L = 1 : 120 , and the wind speed scaling ratio is λ V = 1 : 3 . The spreading length should be taken as L / D 3 when considering the influence of the spreading correlation. The model length is taken as L = 780   mm in this paper, and the specific model parameters are shown in Table 1. ANSYS ICEM was used for modeling. The cross-section and top view of the bridge deck of the 3D numerical model and the model effect are shown in Figure 4.

3.3. The Arrangement of Pressure Measuring Section

To take the correlation between sections with different spanwise spacing into account, six pressure-measuring sections are arranged along the length of the model in the way of variable spacing. The sections are numbered 1#~6#, where 1# section is located at the middle of the model length direction, 2# sections are arranged at 40 mm from 1# section, 3# and 4# sections are arranged at 120 mm around 1# section, 5# and 6# sections are arranged at 2820 mm around 1# section, as shown in Figure 4b.

3.4. Setup of Numerical Simulation

3.4.1. Demarcation of Grids

The grids are divided by the principle of ‘rigid motion area + moving grid area + static grid area’.
When demarcating the 2D grids, the rigid motion area is divided by structured grids, and adhered body quadrilateral grids were adopted on the wall surface of the bridge model. The grids in the rigid area will not be deformed with the motion of the rectangular section, when vortex-induced vibration occurs in the main beam which can ensure the accuracy of the calculation results. The dynamic grid area is divided using a non-structural grid triangular grid, and the grids in this area are continuously updated with the motion of the rigid body.
When demarcating the 3D grids, the rigid motion area is divided by hexahedral structured grids, the dynamic grid area is divided by unstructured grid tetrahedral cells, and the static grid area is divided by hexahedral structured grids, which are relatively sparse and change smoothly from inside to outside. The grids at the interface of each area are basically the same size to ensure the stability and accuracy of the calculation.
To ensure that Y+ < 1, the distance between the center of the body fitted grid elements on the first layer and the wall is set as 0.05, and the growth rate of the grid is set as 1.05 to ensure the smoothness of grid transition [18]. The demarcation of grids is shown in Figure 5a–c.

3.4.2. The Setting of Boundary Conditions

To meet the requirement that the blocking degree is less than 5%, the cross-section flow field is calculated in a rectangular region. The size of the calculation region is 30B × 20B, in which the upstream inflow region is 10B and the downstream wake region is 20B. The distance between the upper and lower boundaries is 10B. The boundary conditions are set as follows: The inlet on left is set as the velocity-inlet, the inlet is an uniform flow, and the incoming wind speed V is selected in the range of V = 1~4 m/s [27], corresponding to the range of the reduced wind speed V r e d = V / f h D : Vred = 4.71~18.81, the turbulence intensity is set as Iu = 0.5% [28,29,30], and the turbulence viscosity ratio is 10%. The outlet on right is set as the boundary condition of the pressure outlet, the relative pressure is 0. Both the upper and lower symmetrical planes adopt symmetry boundary conditions, and the velocity perpendicular to the boundary is 0. The common interface between the rigid grid area and the dynamic grid area, and the dynamic grid area and the static grid area exchange data by interpolation (Interface). The surface of the bridge main girder model is set as a solid boundary condition (Wall), and the computational domains are all air basins (Fluid). The reference pressure is taken as 1 atmosphere. The specific settings are shown in Figure 5d.
Figure 5. Boundary conditions and demarcation of grids. (a) Grid demarcation of 2D model of a bridge section; (b) Grid demarcation of 3D model of a bridge section; (c) Details of grid demarcation of a rigid area; (d) Boundary conditions.
Applsci 12 12668 g005

3.4.3. The Setting of the Solver

The numerical simulation is calculated by ANSYS Fluent software, and the turbulence model based on SST k-ω of RANS is mainly used for transient analysis in this paper. The pressure-velocity coupled field iterative algorithm uses the SIMPLE algorithm which converges rapidly, spatial discretization of the N-S equation is carried out by the finite volume method. The time integration format is in second-order implicit format, the convection term is in bounded central difference format, the dissipative term is in second-order windward format, the pressure term is in second-order format, and the pressure face-center to body-center interpolation is linear. The time step of the numerical calculation is set as 0.001 s, each time step is calculated 30 times iteratively and the calculation residual is set as 1 × 10 5 .

3.5. Verification of Irrelevance

The grid independence and time-step independence were verified to find the number of grids and time steps suitable before conducting the 2D numerical simulation in this paper.
1. Verification of irrelevance of grid quantity:
The grids were divided into three quantities 219,812, 582,427, and 1,060,227, the time step was set as 0.001 s, and the reduced wind velocity of the incoming wind was 6.21. Numerical simulations were carried out for the three numbers of grids to verify the grid independence, and the results are shown in Table 2.
It was found that the drag coefficient, Storaha number (St), and the root means square (RMS) value of lift coefficient were basically close to each other under three conditions with different grid quantities when the time step was set as 0.001 s, and the difference was not significant. Therefore, the influence of grid quantity on the calculation results is small and can be neglected.
2. Verification of irrelevance of time step:
The time steps were taken as 0.0005 s, 0.001 s, and 0.01 s to verify the irrelevance of the time step when the number of grids was 582,427, and the results are shown in Table 3.
It was found that the root means square of lift coefficient, resistance coefficient, and ST number do not differ much at time steps of 0.001 s and 0.0005 s. However, the results at the time step of 0.01 s differ significantly, probably because the smaller the time step for the same number of iterative steps in the calculation process, the more accurate the resultant values are. At the same time, if the time step is too small, the calculation period will increase significantly; if the time step is too large, the accuracy of the calculation results will be affected.
Therefore, considering the accuracy of the calculation results and the efficiency of the calculation process, the number of grids was chosen as 582,427 and the time step was chosen as 0.001 s to save the calculation time and improve the calculation efficiency.

4. Results and Analysis

4.1. Analysis of Two-Dimensional Numerical Simulation

The 2D static winding and vortex vibration response analysis of the split double-box beam was carried out to identify the vortex vibration locking interval of the 2D model of the main beam.
During the two-dimensional numerical simulation process, the vortex-induced vibration response was calculated for the reduced wind speeds of 5.18, 6.12, 6.59, and 8.47 respectively, and the FFT transform of the displacement time curve of the main beam structure is shown in Figure 6. It can be seen that the vortex vibration locking interval of the main beam model section is derived to be about 5.18~8.47 for the reduced wind speed.

4.2. Three-Dimensional Bypass of the Bridge in Static State

4.2.1. Spanwise Correlation of Aerodynamic Coefficients When the Bridge Is in Static State

Based on the results of two-dimensional numerical simulation, four kinds of reduced wind velocities of 5.65, 6.21, 6.68, and 7.44 were selected in this section to simulate the aerodynamic spanwise correlation of the split double-box beam in a static state, and obtained the aerodynamic coefficients of the six measuring sections shown in Figure 4b. The aerodynamic force of the main beam section is mainly determined by the forced load caused by the wind velocity in the static state, therefore, Formula (1) is used to fit the numerical simulation results of the spanwise correlation coefficients of aerodynamic coefficients of the main beam section. The attenuation coefficient (ci) can be obtained from Formula (2). The results are shown in Table 4 and Figure 7.
It can be seen in Table 4 and Figure 7:
  • Comparing the attenuation coefficient of the aerodynamic coefficients under different wind velocities, it can be seen that the attenuation coefficient corresponding to the spanwise correlation coefficient of the lift and torque coefficient, and changes slightly, and decreases gradually with the increase of reduced wind velocity. The attenuation coefficient corresponding to the spanwise correlation coefficient of the resistance coefficient changes greatly with the wind velocity, which is significantly greater than that of the lift and torque coefficient. Therefore, the resistance decays the fastest in the process of the aerodynamic force decaying along the spanwise direction.
  • The spanwise correlation length of lift and torque increases with the increase of wind velocity, while that of resistance varies greatly.
  • The spanwise correlation of all three kinds of aerodynamic coefficients decreases with the increase of the spanwise length in the static state. The lift has the slowest decay rate, followed by torque, and drag has the fastest decay rate.

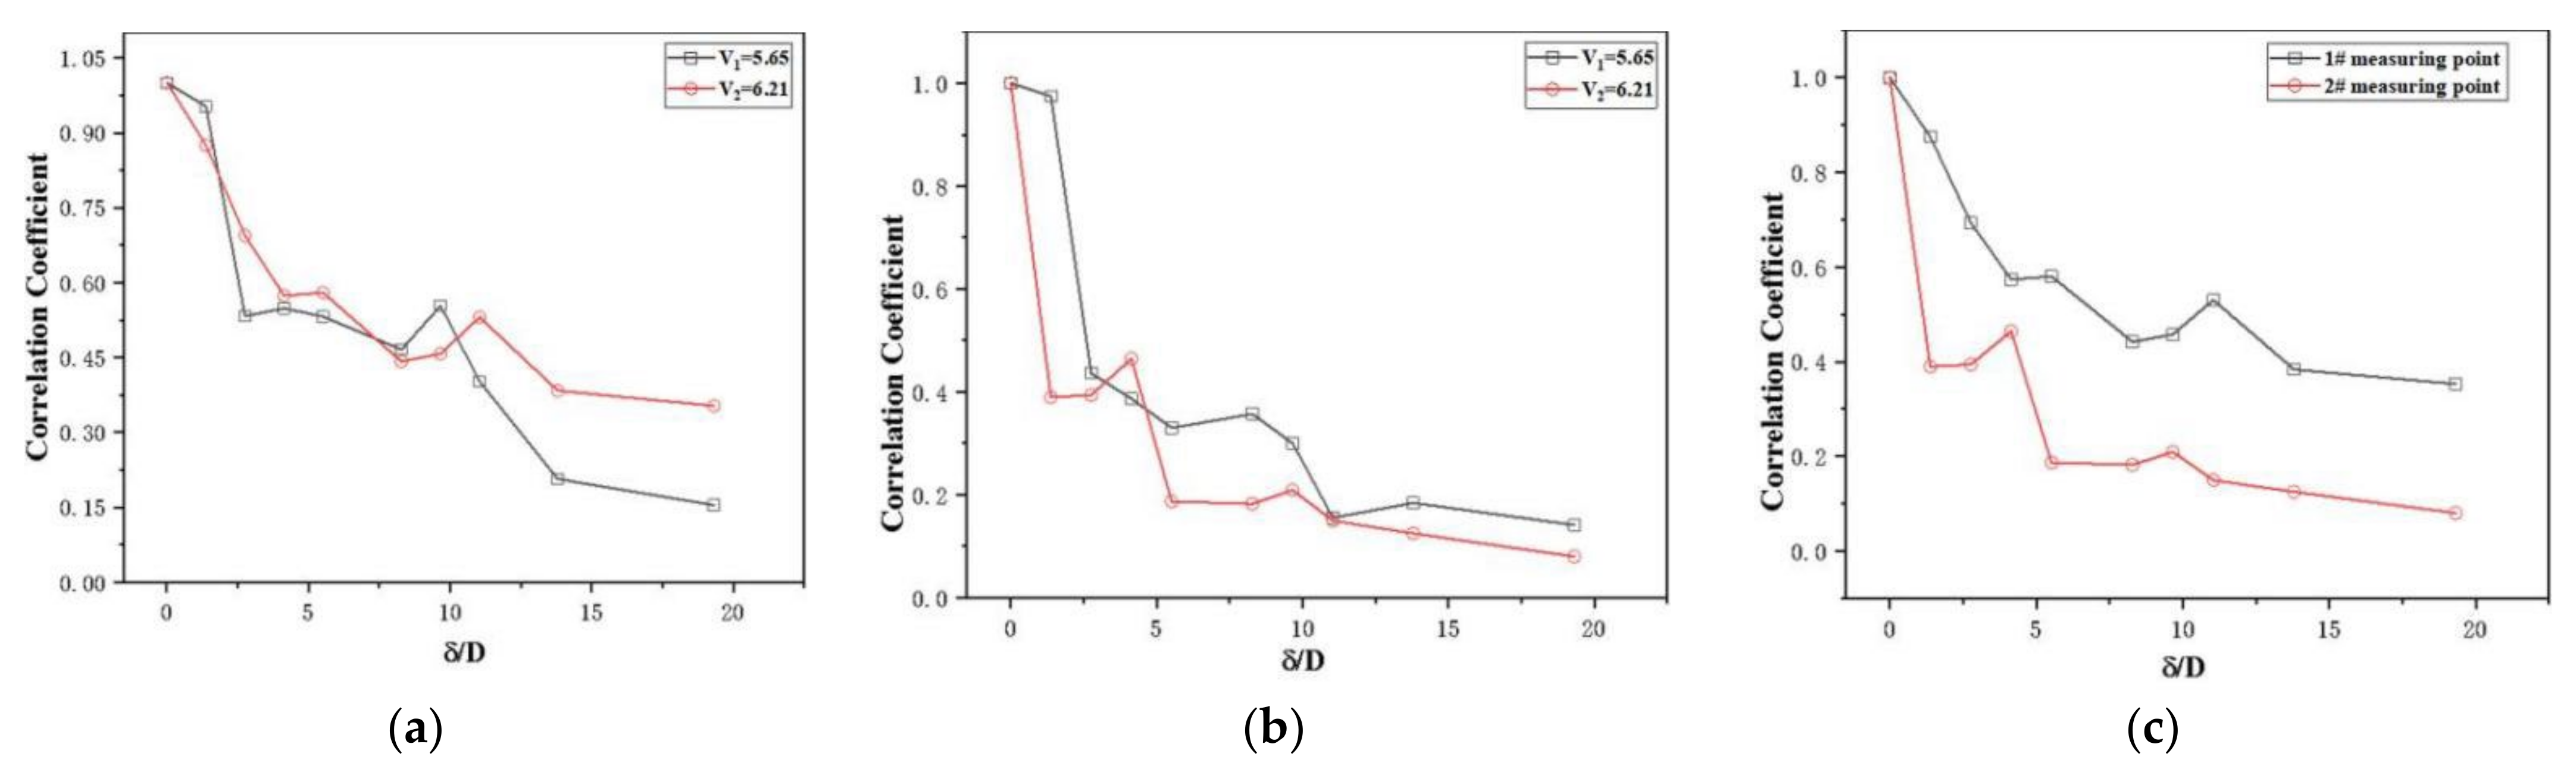
4.2.2. Spanwise Correlation of Surface Pressure Coefficient When the Bridge Is in a Static State

Two pressure points near the wake area are selected in this section to study the correlation of the pressure coefficient when the reduced wind velocity is 5.65 and 6.21. The measuring points are shown in Figure 8. The variation of the spanwise correlation coefficient of the pressure coefficient with the spanwise spacing at each measuring point is shown in Figure 9.
It can be seen in Figure 9:
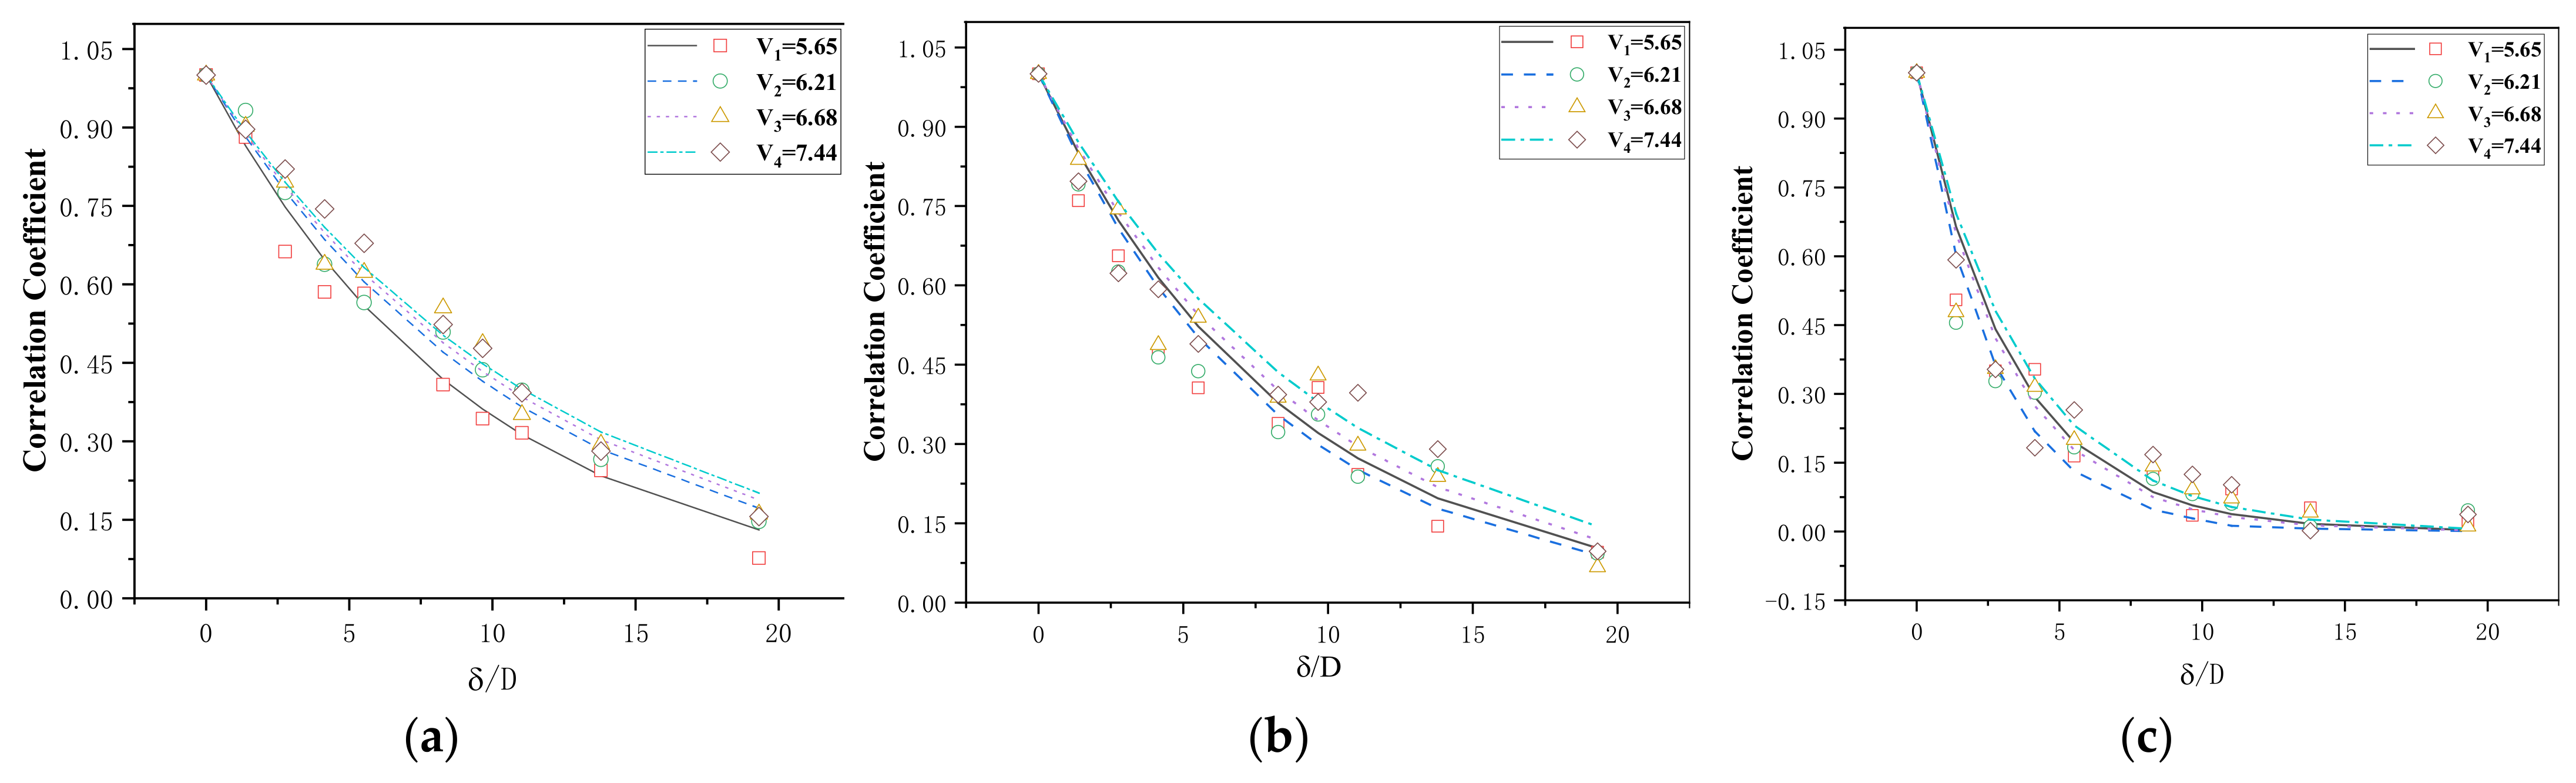
  • The spanwise correlation coefficient of the pressure coefficient decreases gradually with the increase of spanwise spacing.
  • The spanwise correlation of the pressure coefficient of the upstream panel is higher than that of the downstream panel under the same wind speed. The possible reason is that the upstream panel is located on the windward side and the intermediate groove has certain limitations that make the vortex separation and reattachment of the fluid in the wake area after passing through the upstream panel stronger than that of the downstream panel, and as a result, the spanwise correlation of the pressure coefficient of the upstream panel is also stronger.

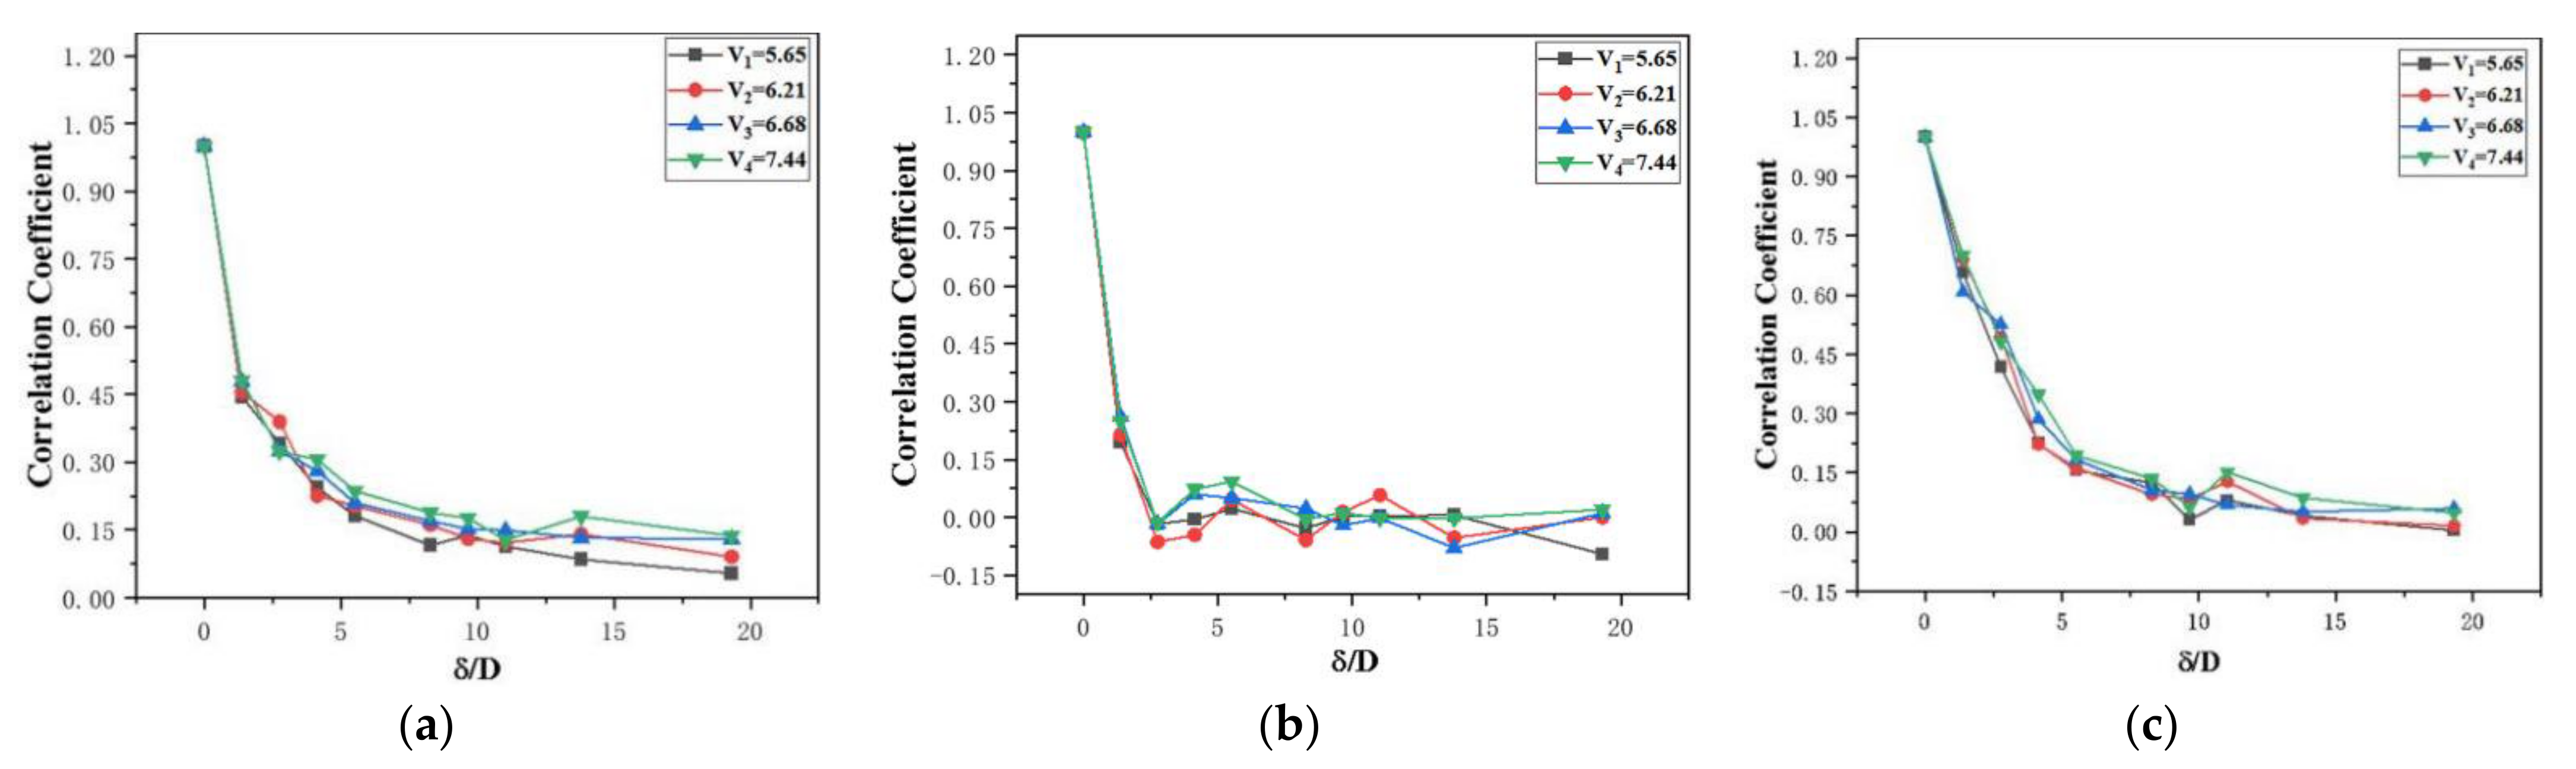
4.2.3. Spanwise Correlation of Wake Wind Velocity When the Bridge Is in a Static State

In this section, the spanwise correlation numerical simulation of fluctuating wind speed in the wake region is carried out for the bridge beam in the static state when the reduced wind velocity is 5.65, 6.21, 6.68, and 7.44. Figure 10 shows the variation of the spanwise correlation coefficient of the main beam in the wake region with spanwise spacing under different reduced wind velocities.
It can be seen in Figure 10:
  • The spanwise correlation coefficient of fluctuating wind velocity in along-wind direction and vertical-wind direction decrease exponentially with the increase of spanwise spacing in the wake region of the main beam of the split double-box beam;
  • The spanwise correlation coefficient of across-wind fluctuating wind velocity approaches to 0 gradually after a precipitous decline, that is, the correlation between different sections of the across-wind fluctuating wind velocity is weak.
  • The spanwise correlation coefficient of fluctuating wind velocity in each direction changes little under different wind speeds which means it does not change with the change in wind velocity.
In general, the spanwise correlation of across-wind fluctuating wind velocity is the strongest, and the attenuation trend is slow. The spanwise correlation of along-wind fluctuating wind velocity is second and that of across-wind fluctuating wind velocity is the worst.

4.3. Analysis of the Results of Three-Dimensional Vortex-Induced Vibration

4.3.1. Spanwise Correlation of Aerodynamic Coefficients When the Bridge Is in the Vibrational State

The response of vortex-induced vibration of split double-box beam is numerically simulated by the dynamic-grid technology under three kinds of reduced wind velocities of 5.65, 6.21 and 6.68.
Aerodynamic force is composed of external excitation force and self-excitation force related to vibration in the vibrational state. Therefore, Formula (4) is used to fit the numerical simulation results of the spanwise correlation coefficients of aerodynamic coefficients of the main beam section. The results are shown in Table 5 and Figure 11.
It can be seen in Table 5 and Figure 11:
  • The same as that in the static state, the spanwise correlation of aerodynamic coefficients decreases with the increase of the spanwise length in the vibrational state. The attenuation speed of the lift is the slowest, the torque is the second, and the resistance is the fastest.
  • The spanwise correlation length of the lift coefficient is the largest, that of the resistance coefficient is second and that of the resistance coefficient is the smallest in the vibrational state. However, the spanwise correlation length of aerodynamic coefficients are smaller than those in the static state.
Moreover, compared to those in the static state, the spanwise correlation coefficient of the aerodynamic coefficients of the split double-box beam is significantly larger in the vibrational state, and the attenuation speed is smaller under the same spanwise spacing. A possible reason is that in addition to the forced load of the wind velocity, the vortex-induced force in the vibrational state includes the self-excited force caused by the vibration of the structure as well. Therefore, the self-excited force has a great influence on the spanwise correlation of the vortex-induced force.

4.3.2. Spanwise Correlation of Surface Pressure Coefficient When the Bridge Is in the Vibrational State

Two measurement points, which are shown in Figure 8, were selected in this section to study the correlation of the pressure coefficient in the vibrational state when the reduced wind velocity is 5.65 and 6.21. The variation of the spanwise correlation coefficient of the pressure coefficient with the spanwise spacing is shown in Figure 12.
It can be found in Figure 12 that:
  • The spanwise correlation of the model surface pressure in the wake region in vibration is relatively higher. The spanwise correlation coefficient decreases with the increase of spanwise spacing firstly and then fluctuates around a certain value.
  • As with that in the static state, the spanwise correlation of the pressure coefficient of the upstream panel is higher than that of the downstream panel in the vibrational state.
Moreover, different from the continuous decrease of the pressure’s spanwise correlation coefficient in a static state, the pressure’s spanwise correlation coefficient tends to a relatively stable correlation value gradually in the vibrational state, and the spanwise correlation coefficient of pressure is relatively higher as well. A possible reason is that the natural vibration of the main beam structure plays a definite role in controlling the shedding of the vortex in the vortex-induced vibration of the bridge.

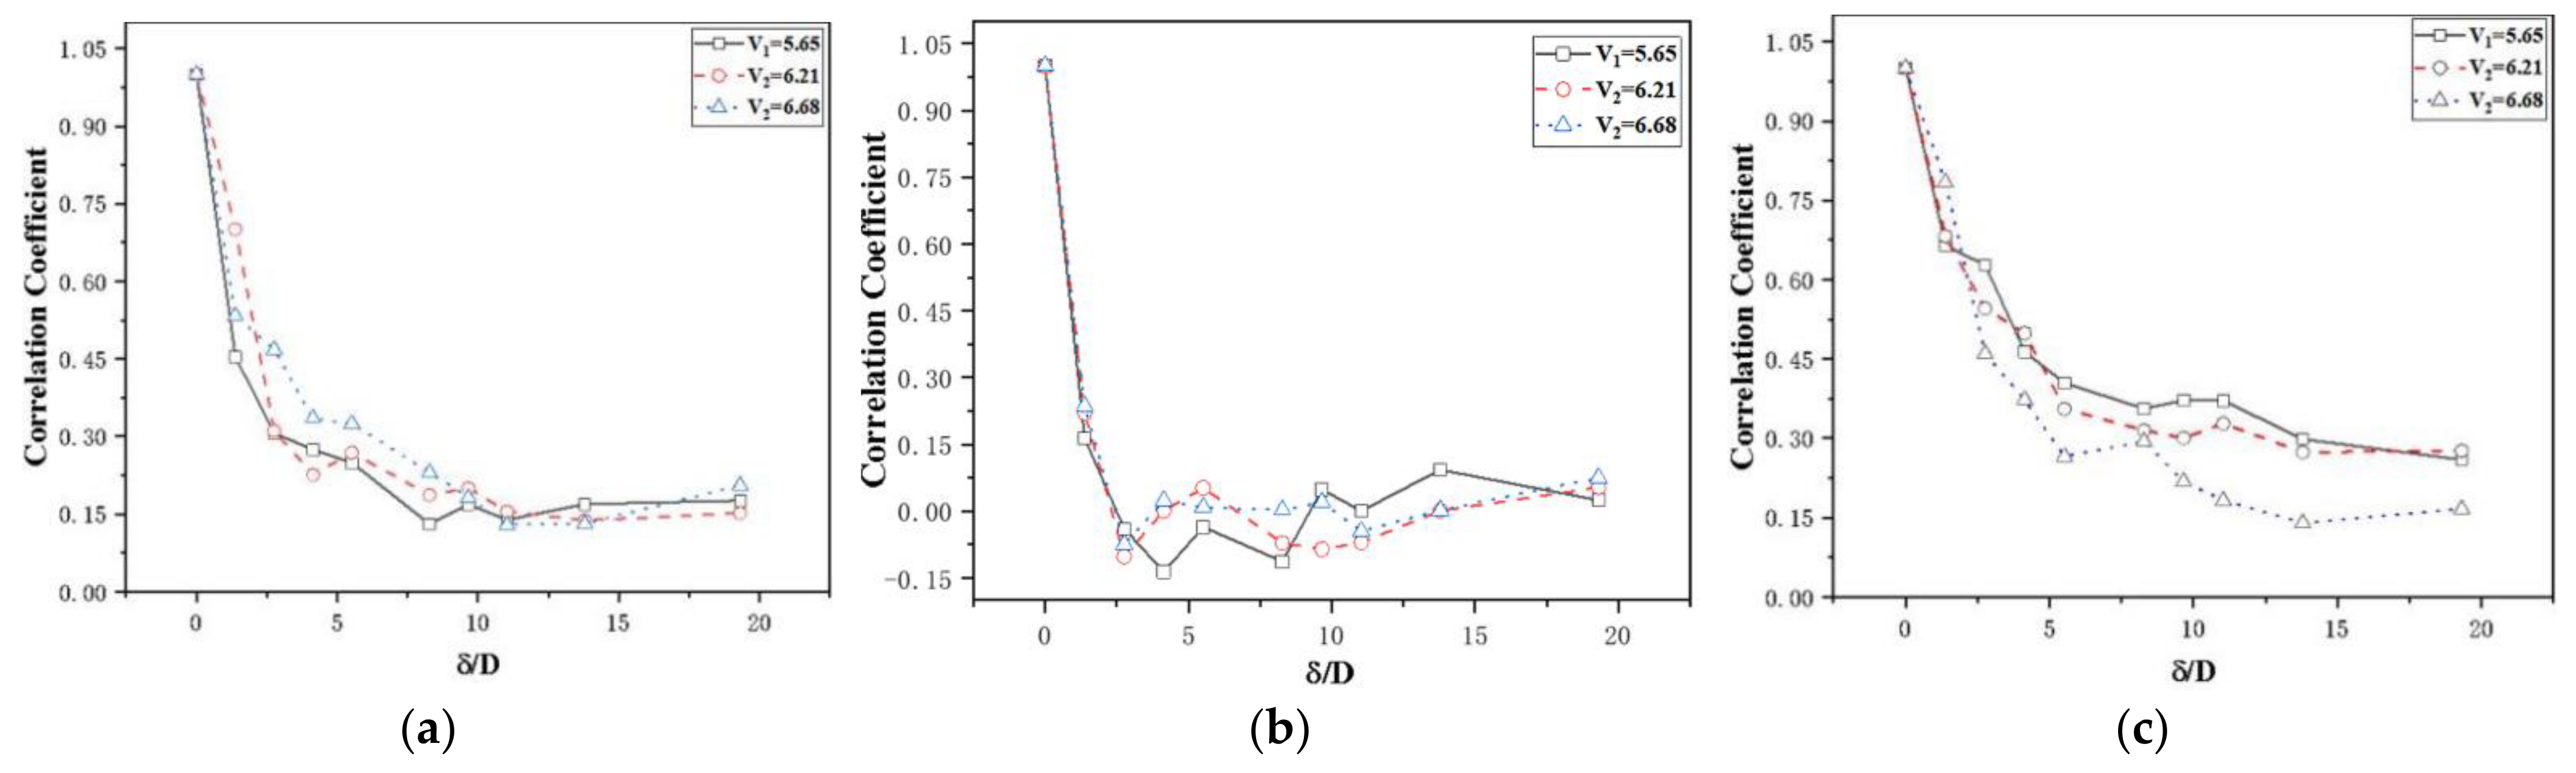
4.3.3. Spanwise Correlation of Wake Wind Velocity of the Model when the Bridge Is in the Vibrational State

In this section, dynamic grid technology and the method of embedding UDF into solver FLUENT are used to carry out the spanwise correlation numerical simulation of fluctuating wind velocity in the wake region under vibrational state when the reduced wind velocity is 5.65, 6.21, and 6.68. The variation of the spanwise correlation coefficient of the main beam in wake region with spanwise spacing is shown in Figure 13.
It can be found in Figure 13 that:
  • The trend of the spanwise correlation coefficient of fluctuating wind velocity in the wake area in the vibration state is basically the same as that in a static state.
  • Moreover, the spanwise correlation of the fluctuating wind in the vibrational state is stronger than that in the static state both in the along-wind and vertical-wind direction, especially the vertical-wind direction, in which the spanwise correlation coefficient is much higher. A possible reason is that the vortex vibration of the bridge is in the vertical direction, while the form of vibration has a great impact on the shedding of the wake during vibration. Therefore, the mutual disturbance of the spanwise airflow should be fully considered during the controlling of vortex vibration.

5. Comparison with Measured Data

Taking the measured data of Xihoumen Bridge [26] as a reference, the numerical simulation results in this paper and the measured data are compared to increase the persuasiveness.
The vortex-induced vibration of the bridge occurred irregularly during the field measurement. Li et al. [26] analyzed the vortex-induced vibration in four period, the duration of the analysis was 10 min (10:40–10:50 p.m. on 29 October 2009). The wind regime was as follows: U = 8.41 m/s, θ = 94.0°, Iu = 4.91%.

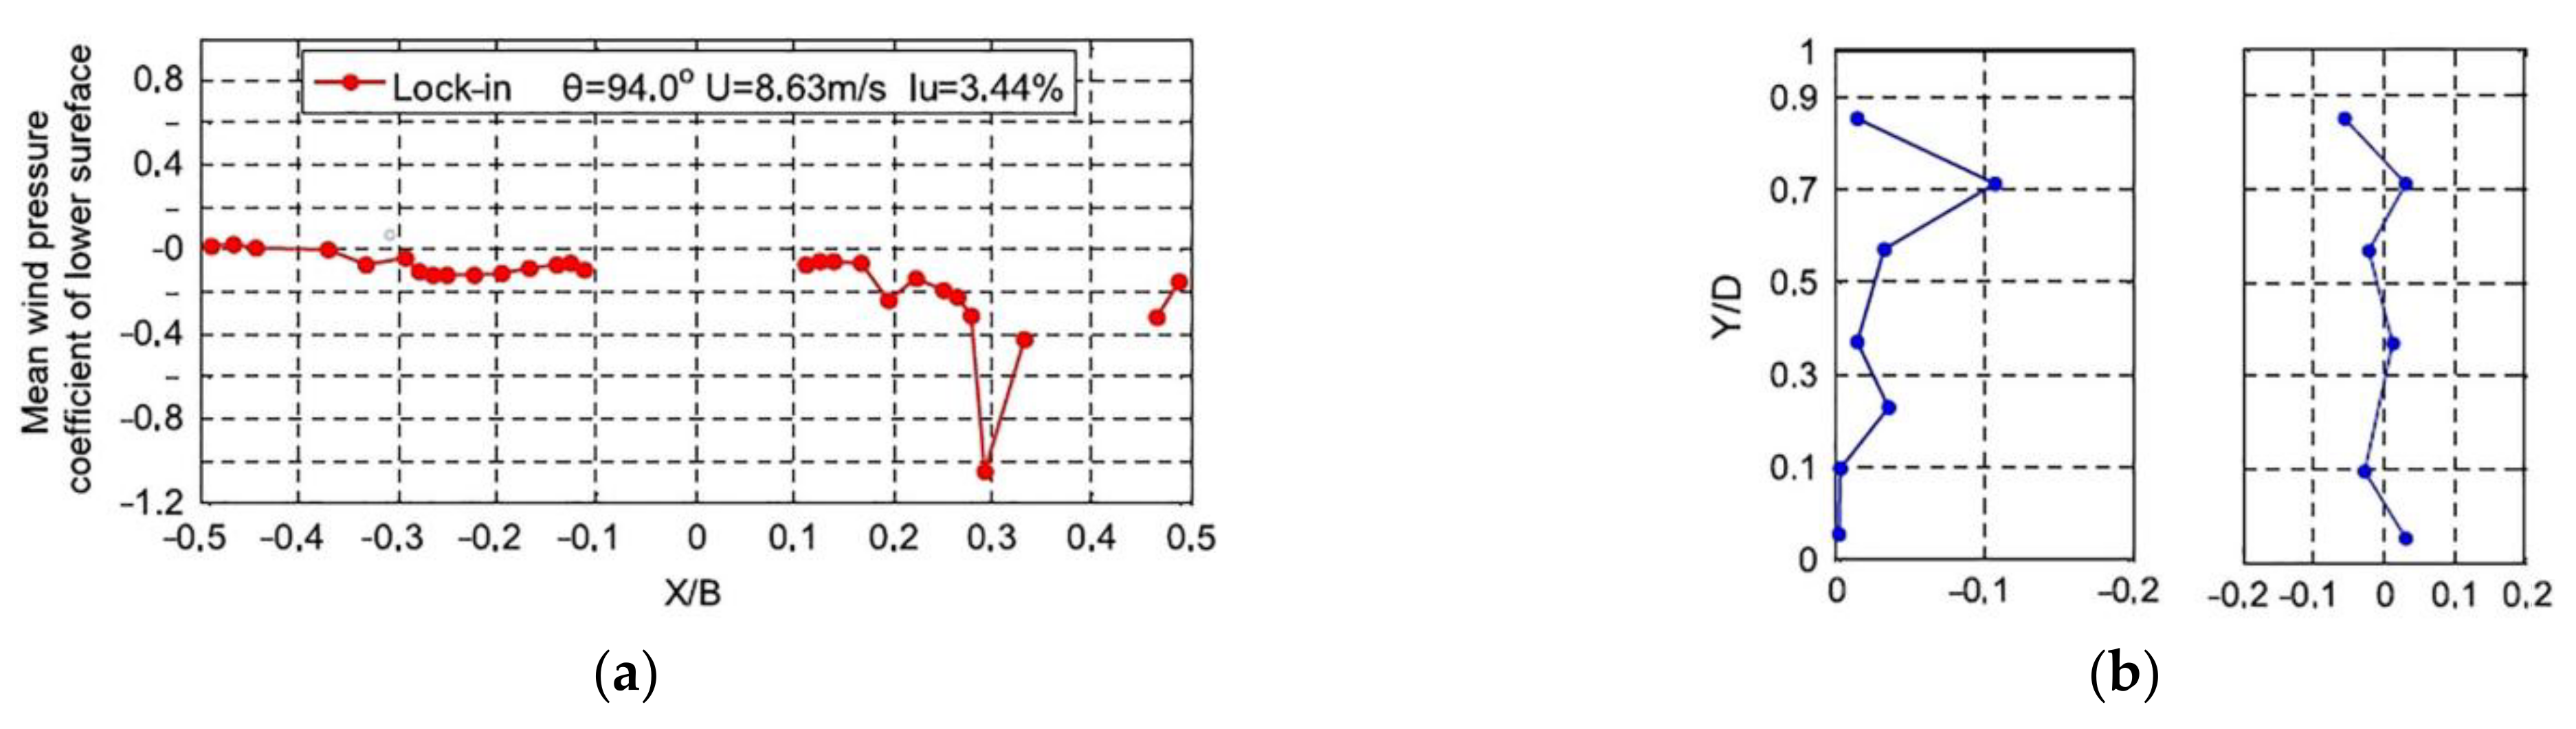
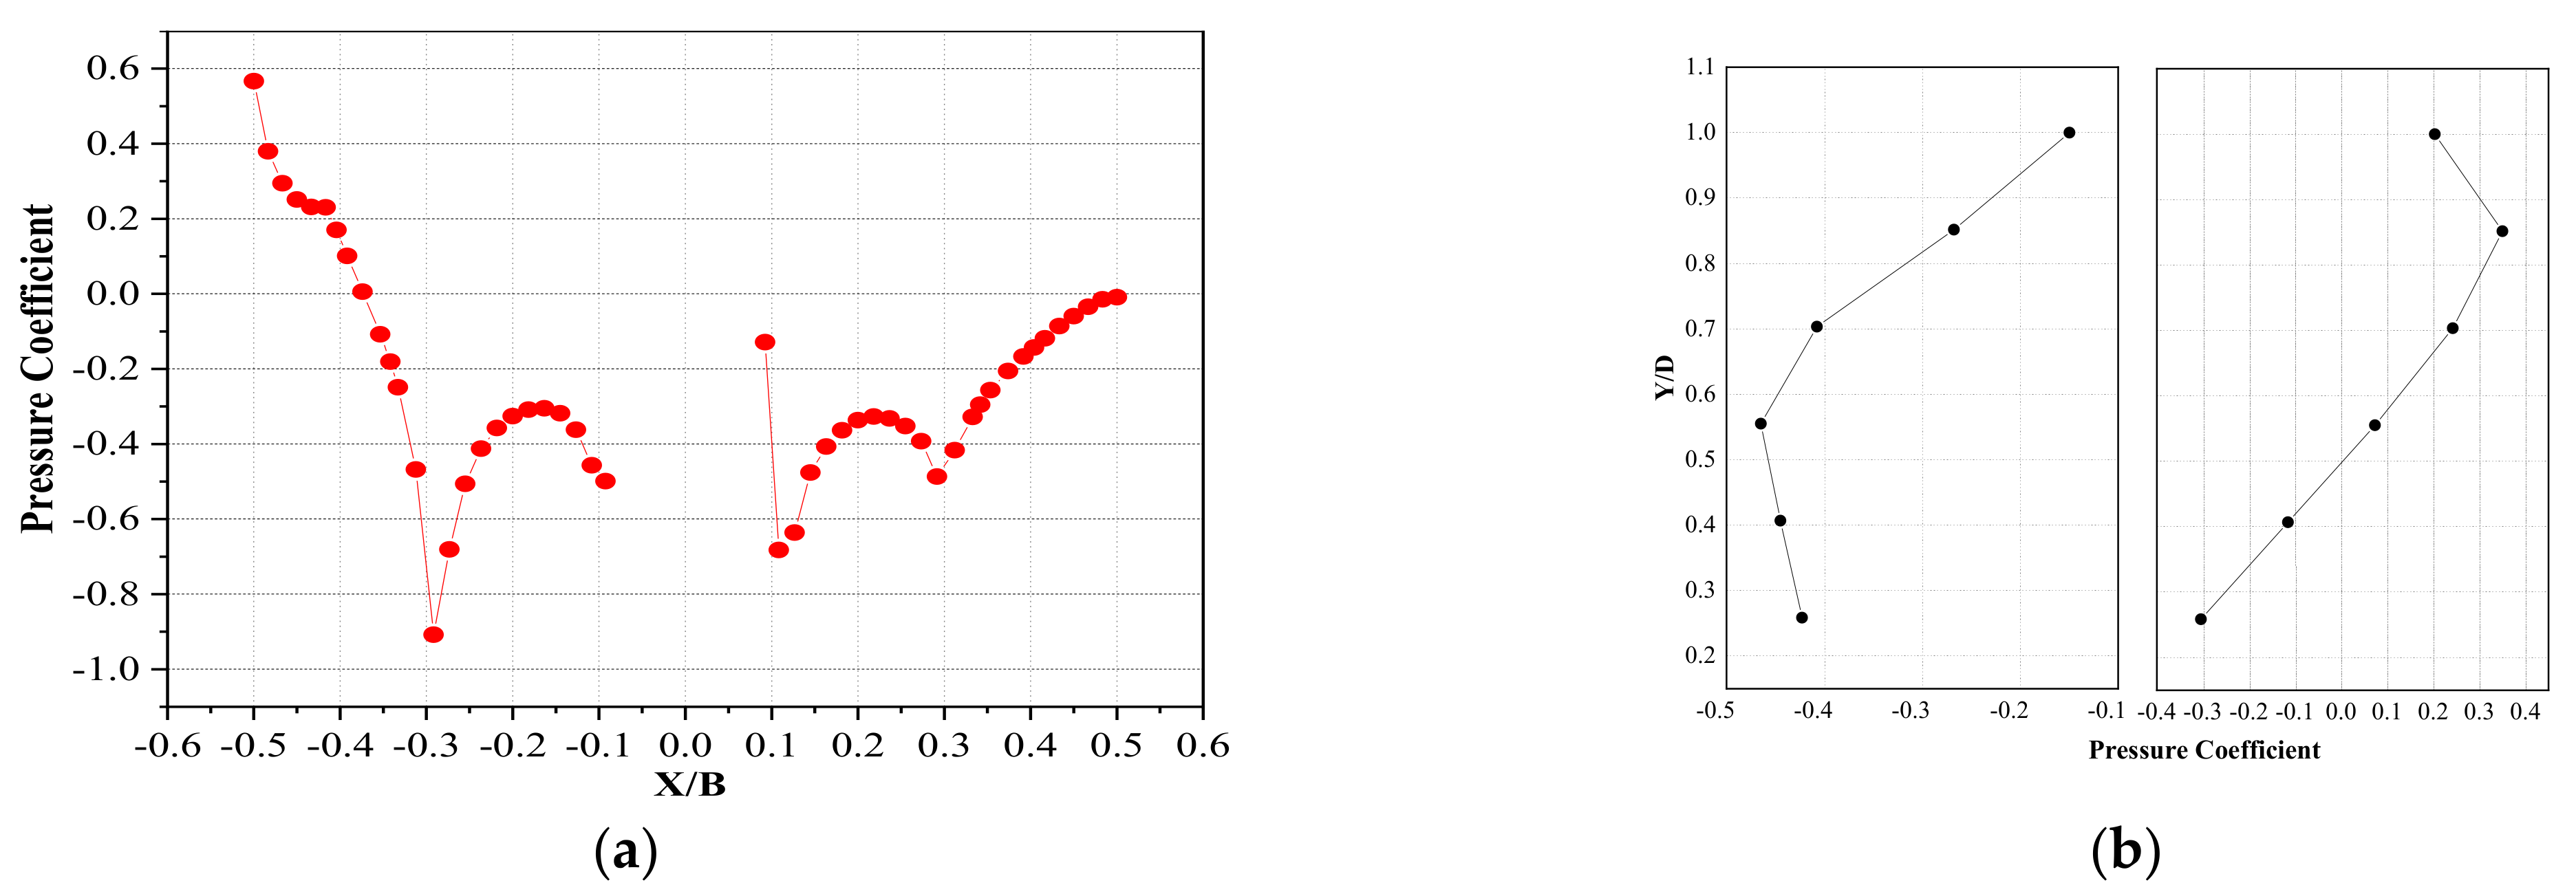
5.1. Pressure Distribution Law in Lock-In Range

The average distribution of pressure C ¯ P around the deck of the inner bridge measured by Li et al. [26] is shown in Figure 14.
C ¯ P at the measurement point is defined as:
C ¯ P i = 2 P ¯ i P ρ U ref 2
where: P ¯ i —the mean pressure at the measurement point on the model surface, ρ —the air density, taken as 1.225 kg/m3, P —the static pressure at the reference height, U r e f —the velocity in the downwind direction at the reference height.
The pressure distribution of pressure measuring Section 1 in numerical simulation is shown in Figure 15 when the reduced wind speed is 6.21.
It can be found from Figure 14a and Figure 15a that:
The trend of the pressure distribution law in general gained from numerical simulation in this paper is the same as that in the document [26]. The pressure coefficient on the lower surface of the upstream section is decreasing gradually and reaches the maximum negative value at the corner (0.3), and then resumes its upward trend. The pressure coefficients are all negative on the lower surface of the downstream section and those near the waking wind of the downstream section are all close to 0.
It can be found from Figure 14b and Figure 15b that:
The pressure coefficient at the tail of the upstream section in the middle groove is negative, which decreases first and then increases gradually in this paper, while the pressure coefficient increases first and then decreases gradually at the leading edge of the downstream section. There is a vortex formed in the middle groove. That is to say that the airflow is shedding and forming complicatedly in the middle groove. Compared to Figure 14b, it can be seen that the results above are quite different from those obtained in the document [26]. The possible reason is that it takes 0.001 s as the time step to record the data in field measurement, while the pressure coefficient shown in Figure 14 is the average of the pressure in 10 min, of which the volume of data is larger, and the description of the vortex-vibration period is more comprehensive. It can also be caused by errors due to operation in the field measurement.

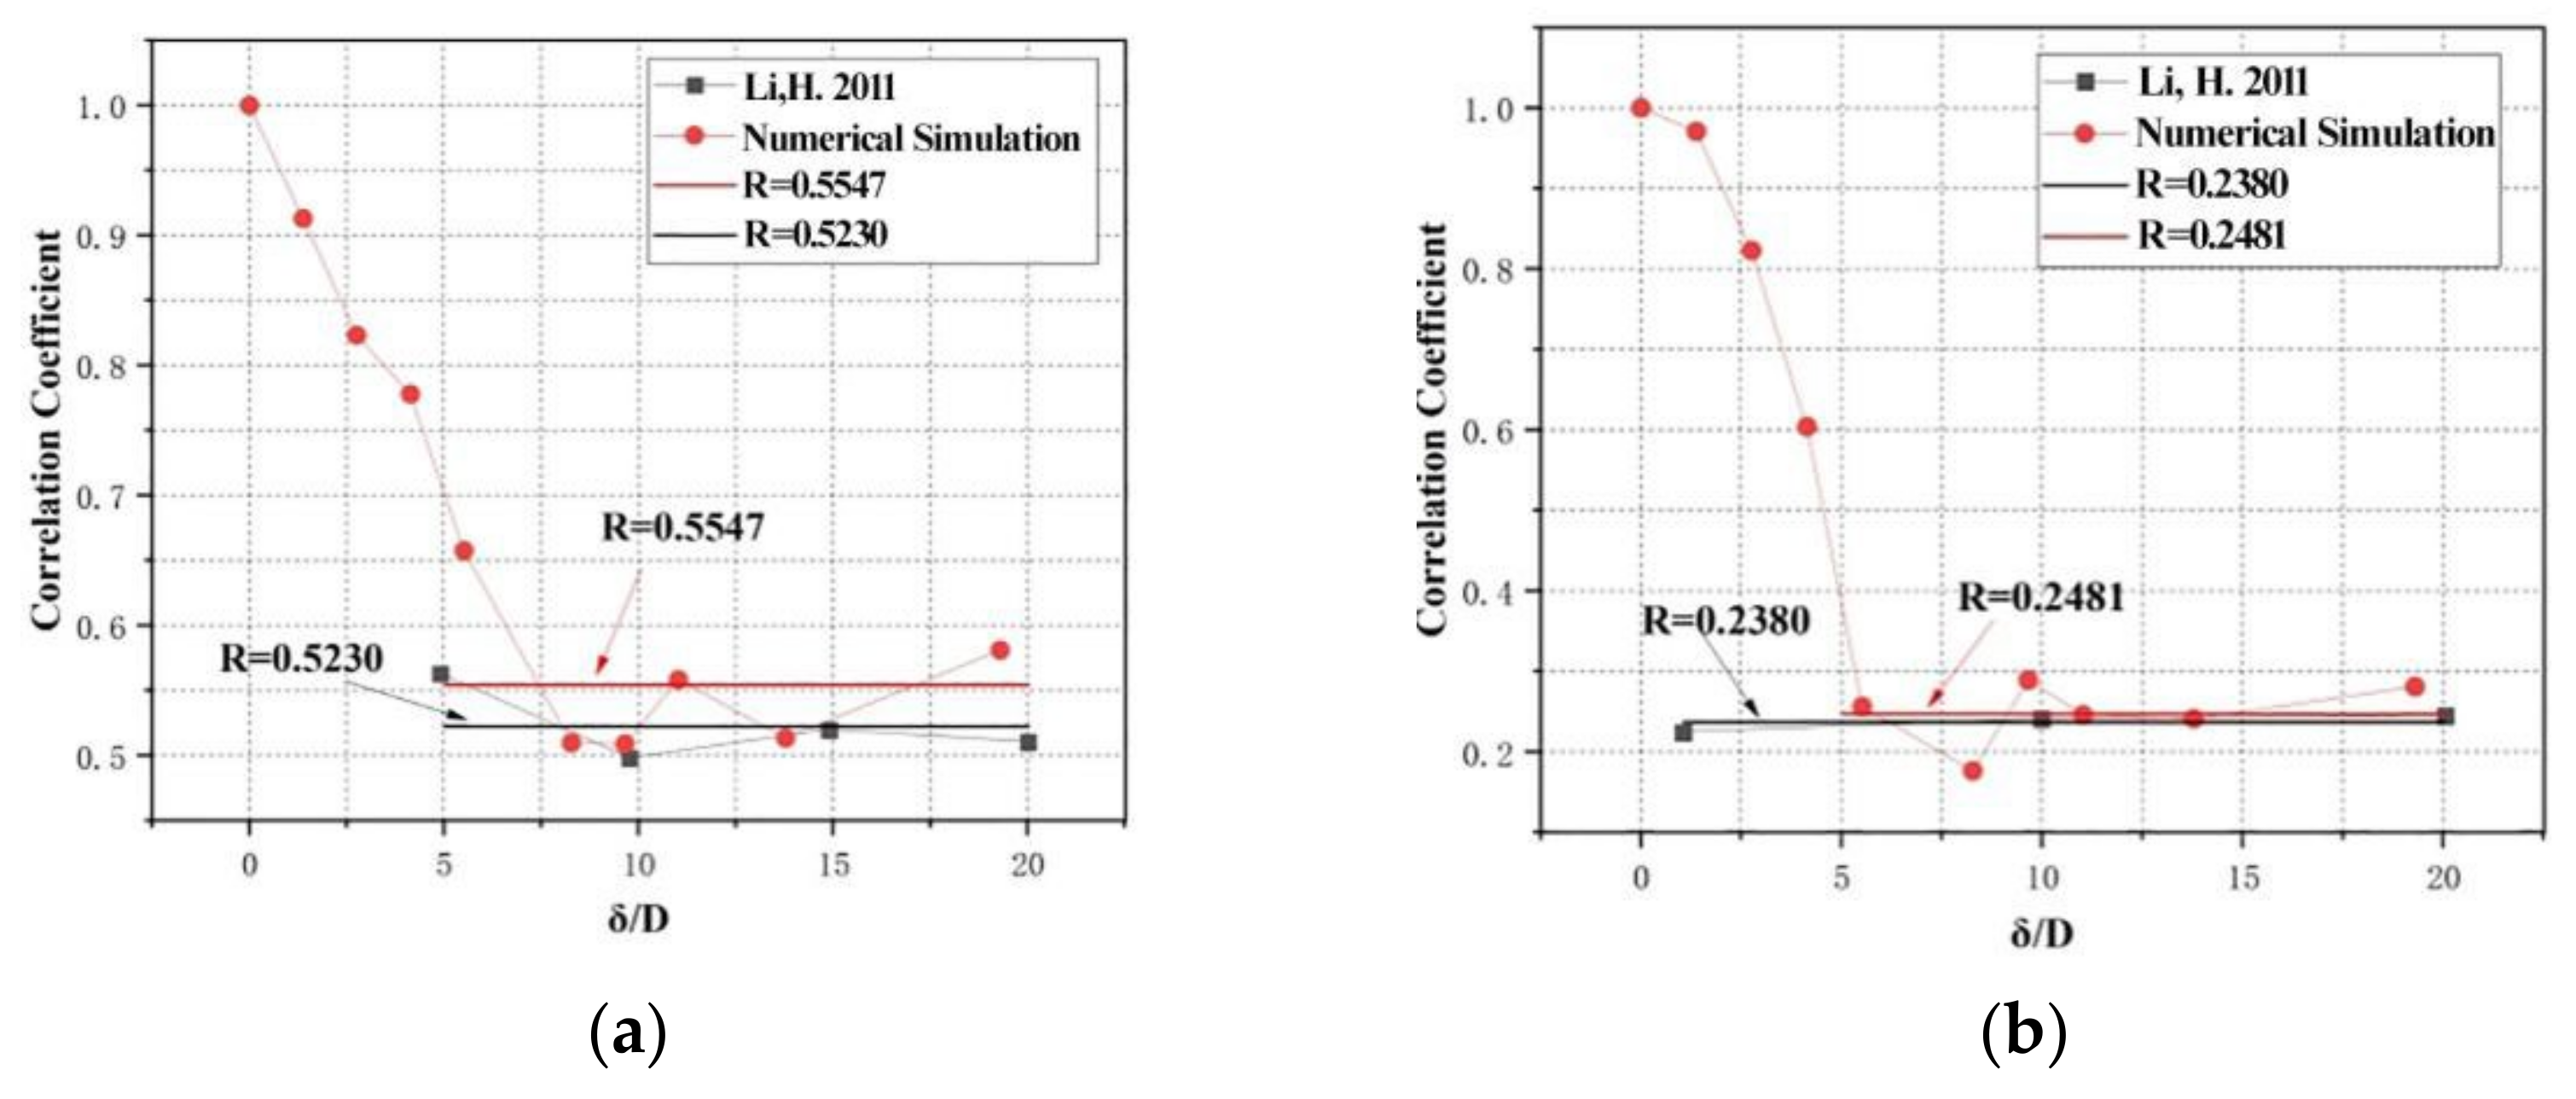
5.2. Spanwise Correlation of Wind Pressure in Lock-In Range

Li et al. [26] selected the wind pressure on the upper surface and lower surface of the split double-box beam in the wake region to calculate the spanwise correlation. The reduced wind speed was set as Vr = 6.21 when the 3D numerical vortex-induced vibration of the separated double box girder is simulated. The spanwise correlation of the pressure coefficient in the wake region of the downstream section of the bridge is shown in Figure 16.
It can be found in Figure 16 that:
Although the pressure distribution law of the numerical simulation of a split double-box beam is slightly different from that of field measurement in document [26], the error of spanwise correlation of the upper and lower surface pressure coefficients between the document [26] and the result of numerical simulation is 5.71% and 4.07%, respectively, which are acceptable. Therefore, the numerical simulation results in this paper are reliable.

6. Conclusions and Prospect

Taking Xihoumen Bridge as the engineering background, the spanwise correlation of vortex-induced force on the split double-box beam was studied in this study through the method of numerical simulation. The two-dimensional and three-dimensional numerical models were established and the numerical simulation of the bypass of a split double-box beam in static state was carried out through the fluid calculation software FLUENT. The vortex-induced vibration of the numerical model was simulated by the Newmark-β algorithm as well. The spanwise correlation of the aerodynamic coefficient, the surface pressure coefficient, and the wake wind velocity of the model under static and vibrational state was analyzed. Furthermore, a comparison with the field measurement results of relevant documents was conducted to verify the reliability of the results. The conclusions can be summarized as follows.
  • The spanwise correlation of the aerodynamic coefficients of the split double-box beam decrease with the increase of the spanwise spacing overall. The attenuation speed of the lift is the slowest, the torque is the second, and the resistance is the fastest; moreover, the attenuation trend is independent of the wind velocity. The spanwise correlation of aerodynamic coefficients in the vibrational state is stronger compared to those in the static state and the speed of attenuation is slower as well.
  • The spanwise correlation of the surface pressure coefficient of the split double-box beam decreases with the increase of the spanwise spacing overall. The spanwise correlation of the pressure coefficient of the upstream panel is higher than that of the downstream panel under the same wind speed. The spanwise correlation coefficient of the pressure coefficient in the vibrational state is stronger compared to that in the static state.
  • The spanwise correlation of the wake wind velocity of the split double-box beam decreases with the increase of the spanwise spacing overall. The attenuation speed of vertical-wind fluctuating wind is the slowest, the along-wind is the second, and the across-wind is the fastest; moreover, the spanwise correlation of across-wind fluctuating wind velocity is worse than that of the other two wind directions under the same wind speed. The spanwise correlation of wake wind velocity under the vibrational state, especially the vertical wind fluctuating wind velocity, is lower than those in the static state.
  • Although the pressure distribution law of numerical simulation within the lock-in region of vortex-induced vibration of split double-box beam is slightly different from that of field measurement in the document [16], the correlation values are basically the same. Therefore, the numerical simulation results in this paper are reliable.
The study and discussion of the spreading correlation during vortex vibration of split double-box beam sections in this paper can be used as a supplement to the study of the direction of gas bypassing for vortex vibration of split double-box beam, which is of great scientific and engineering significance in understanding the vortex vibration characteristics of such complex sections as well as optimizing the bridge design and enhancing its wind resistance performance. However, there is still much room for improvement and refinement in this study due to the various aspects involved in the numerical simulation process, such as the establishment of the bridge model, the setting of the wind area conditions, and the selection of the solver:
  • The numerical simulation of the bridge was carried out under the condition of a constant wind field, which is different from the more random wind field in the actual engineering. Therefore, there is still some distance to apply the results of numerical simulation to engineering practice. The randomness of the wind field in the numerical simulation can be further improved to be closer to the reality.
  • The bridge model which was used in the numerical simulation process was a bare bridge model without any of the bridge appurtenance taken into account, while, the existence of the appendages will cause some changes in the aerodynamic shape of the bridge, which will lead to some influence on the vortex vibration response. The appendages can be further added when building the numerical model of the bridge structure to simulate the actual bridge more realistically.

Author Contributions

Conceptualization, J.J. and L.D.; methodology, L.D. and L.Z.; software, L.D.; validation, L.D. and L.Z.; formal analysis, J.J. and L.D.; investigation, L.D.; resources, J.J.; data curation, L.D.; writing—original draft preparation, L.D.; writing—review and editing, J.J. and L.Z.; visualization, L.D.; supervision, J.J. and L.Z.; project administration, J.J. and L.D.; funding acquisition, J.J. and L.D. All authors have read and agreed to the published version of the manuscript.

Funding

This research was funded by the National Natural Science Foundation of China (Grant No. 51908108).

Institutional Review Board Statement

Not applicable.

Informed Consent Statement

Not applicable.

Data Availability Statement

The data used to support the findings of this study are available from the authors upon request.

Conflicts of Interest

The authors declare no conflict of interest.

References

  1. Xiang, H.F.; Ge, Y.J. Refinements on aerodynamic stability analysis of super long-span bridges. J. Wind. Eng. Ind. Aerodyn. 2002, 90, 1493–1515. [Google Scholar] [CrossRef]
  2. Ai, G.Z.; Xia, H.X. Hardening truss of suspension bridg—comparison of reinforced truss and reinforced box girder of Mingshi Channel Bridge. Foreign Bridge 2000, 4, 15–20. [Google Scholar]
  3. Larsen, A.; Svensson, E. Design aspects of tuned mass dampers for the Great Belt East Bridge approach spans. J. Wind. Eng. Ind. Aerodyn. 1995, 54, 413–426. [Google Scholar] [CrossRef]
  4. Zhang, W.; Wei, Z.G. Comparison and analysis of vortex-induced vibration for twin-box bridge sections based on experiments in different reynolds numbers. Tongji Daxue Xuebao J. Tongji Univ. 2008, 36, 6–11. [Google Scholar]
  5. Chen, W.L.; Gao, D.L. A Field Investigation on Vortex-Induced Vibrations of Stay Cables in a Cable-Stayed Bridge. Appl. Sci. 2019, 9, 4556. [Google Scholar] [CrossRef] [Green Version]
  6. Wang, J. Vortex-Induced Vibration Performance and Flow Field of Twin-Box Girder. Master’s Thesis, Southwest Jiaotong University, Chengdu, China, 2018. [Google Scholar]
  7. Laima, S.J. Investigation of Vortex-Induced Vibrations of Twin-Box Girder of Long-Span Suspension Bridges. Ph.D. Thesis, Harbin University of Technology, Harbin, China, 2016. [Google Scholar]
  8. Jing, H.Q. Study on Reynolds Number Effects on Vortex-Induced Vibration of Twin-Box Bridges Sections by Wind Tunnel Test. Master’s Thesis, Harbin University of Technology, Harbin, China, 2012. [Google Scholar]
  9. Rakhsha, M.; Kees, C.E. Lagrangian vs. Eulerian: An Analysis of Two Solution Methods for Free-Surface Flows and Fluid Solid Interaction Problems. Fluids 2021, 6, 460. [Google Scholar] [CrossRef]
  10. Moraes, P.G.; Alcântara Pereira, L.A. Surface Roughness Effects on Flows Past Two Circular Cylinders in Tandem Arrangement at Co-Shedding Regime. Energies 2021, 14, 8237. [Google Scholar] [CrossRef]
  11. Wilkinson, R.H. Fluctuating pressures on an oscil-lating square prism. Part II. Spanwise correlation and loading. Aeronaut. Q. 1981, 32, 111–125. [Google Scholar] [CrossRef]
  12. Zhang, G.H.; Zhao, L. Spatial correlation of wind loads for cross-section of a streamlined closed boxgirder. J. Vib. Shock. 2012, 31, 76–806+114. [Google Scholar]
  13. Huang, L.K. Spatial Correlation of Wind Loads for Cross-Section of a Streamlined Closed Box Girder. Master’s Thesis, Hunan University, Changsha, China, 2013. [Google Scholar]
  14. Wang, X.N. Study on the Characteristic and Spanwise Correlation of Vortex-Induced Focrceon Bluff Body. Master’s Thesis, Southwest Jiaotong University, Chengdu, China, 2017. [Google Scholar]
  15. Wei, Z.L.; Shen, M.H. Study on the Correspondence of Vortex Structures and Vortex-Induced Pressures for a Streamlined Box Girder. Appl. Sci. 2022, 12, 1075. [Google Scholar] [CrossRef]
  16. Nagao, F.; Utsunomiya, H. Basic study on spatial correlations offluctuating lifts acting on plate. J. Wind. Eng. Dustrial Aerodyn. 2003, 91, 1349–1361. [Google Scholar] [CrossRef]
  17. Gong, H.F.; Lin, Z.X. Wind Resistance Design Guide for Highway and Bridges; People’s Communications Pressy: Beijing, China, 1996. [Google Scholar]
  18. Ricciardelli, F. Effects of the vibration regime on the spanwise correlation of the aerodynamic forces on a 5:1 rectangular cylinder. J. Wind. Eng. Ind. Aerodyn. 2009, 98, 215–225. [Google Scholar] [CrossRef]
  19. Ye, Y.J. Numerical Simulation of Equilibrium Atmospheric Boundary Layer Based on RANS Model. Master’s Thesis, Hefei University of Technology, Hefei, China, 2018. [Google Scholar]
  20. Yang, W. Numerical Simulation Study of Structural Wind Load and Response Based on RANS. Ph.D. Thesis, Tongji University, Shanghai, China, 2004. [Google Scholar]
  21. Menter, F.R. Two-equation eddy-viscosity turbulence models for engineering applications. AIAA J. 1994, 32, 1598–1605. [Google Scholar] [CrossRef]
  22. Lu, H.Y.; Jia, J. Study on Nonlinear Aerodynamic Characteristics of a Semi-Closed Box Bridge Deck Based on Coupled Amplitude Variation. Appl. Sci. 2022, 12, 7609. [Google Scholar] [CrossRef]
  23. Zanotti, A.; Nilifard, R.; Gibertini, G.; Guardone, A.; Quaranta, G. Assessment of 2D/3D numerical modeling for deep dynamic stall experiments. J. Fluids Struct. 2014, 51, 97–115. [Google Scholar] [CrossRef]
  24. Wu, T.; Kareem, A. Modeling hysteretic nonlinear behavior of bridge aerodynamics via cellular automata nested neural network. J. Wind Eng. Ind. Aerodyn. 2011, 99, 378–388. [Google Scholar] [CrossRef]
  25. Deng, X.L. Numerical Simulation Numerical Simulation of Vortex-Induced Vibrations Using PC-Newmark—Based Fluid-Structure Interaction Method. Master’s Thesis, Zhejiang University, Hangzhou, China, 2015. [Google Scholar]
  26. Li, H.; Laima, S.J. Investigation of vortex-induced vibration of a suspension bridge with two separated steel box girders based on field measurements. Eng. Struct. 2011, 33, 1894–1907. [Google Scholar] [CrossRef]
  27. Yuan, W.Y. Study on Flow Field of Twin Box Girder during the Whole Process of Wind Induced Vibration. Master’s Thesis, Harbin University of Technology, Harbin, China, 2015. [Google Scholar]
  28. Yu, M. Study on Aerodynamic Performance and Vortex-induced Vibration Control of Long-span Suspension Bridge with Separated Double Box Girder Based on CFD. Master’s Thesis, Chongqing Jiaotong University, Chongqing, China, 2020. [Google Scholar]
  29. Liu, J. Research on Vortex-Induced Force Properties and Vortex-Induced Vibration Prediction Method for Typical Bridges Sections. Master’s Thesis, North China University of Water Resources and Electric Power, Zhengzhou, China, 2022. [Google Scholar]
  30. Gong, H.X.; Liu, Z.W. Numerical Simulation and Mechanism Analysis of Vortex-Induced Vibration of Rectangular Cylinder. J. Highw. Transp. Dev. 2016, 33, 76–85. [Google Scholar]
Figure 1. Flowchart of the calculation of the Newmark-β method embedded in FLUENT.
Applsci 12 12668 g001
Figure 2. Stereoscopic diagram of Xihoumen Bridge [26].
Applsci 12 12668 g002
Figure 3. Relevant parameters of Xihoumen Bridge [26].
Applsci 12 12668 g003
Figure 4. Dimension of numerical model. (a) Cross section of the numerical model (mm). (b) Top view of the bridge deck (mm) and the layout plan of pressure measuring section. (c) Effect drawing of numerical model.
Applsci 12 12668 g004aApplsci 12 12668 g004b
Figure 6. FFT transformation of main beam section displacement curves. (a) Reduced wind velocity Vr = 5.18; (b) Reduced wind velocity Vr = 6.12; (c) Reduced wind velocity Vr = 6.59; (d) Reduced wind velocity Vr = 8.47.
Applsci 12 12668 g006
Figure 7. Spanwise correlation of aerodynamic coefficients in static state (δ/D: dimensionless spacing). (a) Spanwise correlation of lift coefficient; (b) Spanwise correlation of torque coefficient; (c) Spanwise correlation of resistance coefficient.
Applsci 12 12668 g007
Figure 8. The layout of pressure measuring points in the wake area.
Applsci 12 12668 g008
Figure 9. Correlation of pressure coefficient at each measuring point. (a) Spanwise correlation of pressure coefficient at 1# measuring point; (b) Spanwise correlation of pressure coefficient at 2# measuring point; (c) Spanwise correlation of pressure coefficient at two measuring points when Vr = 6.21.
Applsci 12 12668 g009
Figure 10. Spanwise correlation of wake wind velocity of the main beam in the static state. (a) Spanwise correlation of along-wind fluctuating wind velocity; (b) Spanwise correlation of across-wind fluctuating wind velocity; (c) Spanwise correlation of vertical-wind fluctuating wind velocity.
Applsci 12 12668 g010
Figure 11. Spanwise correlation of aerodynamic coefficients in the vibrational state. (a) Spanwise correlation of lift coefficient; (b) Spanwise correlation of torque coefficient; (c) Spanwise correlation of resistance coefficient.
Applsci 12 12668 g011
Figure 12. Correlation of pressure coefficient at each measuring point. (a) Spanwise correlation of pressure coefficient at 1# measuring point; (b) Spanwise correlation of pressure coefficient at 2# measuring point; (c) Spanwise correlation of pressure coefficient at two measuring points when Vr = 6.21.
Applsci 12 12668 g012
Figure 13. Spanwise correlation of wake wind velocity of the main beam in the vibrational state. (a) Spanwise correlation of along-wind fluctuating wind velocity; (b) Spanwise correlation of across-wind fluctuating wind velocity; (c) Spanwise correlation of vertical-wind fluctuating wind velocity.
Applsci 12 12668 g013
Figure 14. The average pressure distribution within 10 min in the lock-in range of vortex-induced vibration of the S1 section in the document [26]. (a) Pressure distribution on section S1 of the main beam; (b) Vertical pressure distribution of the upstream and downstream sections of the middle groove.
Applsci 12 12668 g014
Figure 15. Pressure distribution of pressure measuring Section 1 in numerical simulation of vortex-induced vibration. (a) Pressure distribution on the lower surface of pressure measuring Section 1 of the main beam; (b) Pressure distribution of the upstream and downstream sections of the middle groove.
Applsci 12 12668 g015
Figure 16. Spanwise correlation of pressure coefficient in wake region of downstream section of bridge of numercial simulation and Li, H.’s measurement [26]. (a) Spanwise correlation of pressure coefficient of an upper surface; (b) Spanwise correlation of pressure coefficient of a lower surface.
Applsci 12 12668 g016
Table 1. Design parameters of Sepilt double-box beam section model.
ParameterValue of Real Bridge Similarity RatioDesign Value of Model
Length of main beam
L (m)
96.31:1200.78
Width of bridge deck
B(m)
361:1200.3
Height of main beam
D(m)
3.51:1200.029
Equivalent mass
meq (kg/m)
26,2651:12021.824
Vertical frequency
fh (Hz)
0.183140:17.32
Turning frequency
fa (Hz)
0.229540:19.18
Wind Speed
U(m/s)
__1:3__
Damping ratio
ξ (%)
0.51:10.5
Table 2. Comparison of simulation results on the number of grids (time step: 0.001 s).
Number of GridsLift Coefficient
C L R M S
Resistance Coefficient
C R
St
1219,8120.07700.02130.177
2582,4270.07870.02120.176
31,060,2270.07400.02140.178
Table 3. Comparison of simulation results on time step (the number of grids: 582,427).
Time StepLift Coefficient
C L R M S
Resistance Coefficient
C R
St
10.00050.07670.02160.177
20.0010.07870.02120.176
30.010.05140.02440.155
Table 4. Fitting value of aerodynamic spanwise correlation coefficient parameters and spanwise correlation length of the main beam in a static state.
ParameterAerodynamic CoefficientReduced Wind Velocity
5.656.216.687.44
c
(attenuation coefficient)
lift coefficient0.1050.0910.0860.083
resistance coefficient0.2960.3650.3130.265
torque coefficient0.1170.1250.1100.100
L
(spanwise correlation length)
lift coefficient9.5110.9811.5612.03
resistance coefficient3.382.743.193.77
torque coefficient8.558.009.079.97
Table 5. Fitting value of aerodynamic spanwise correlation coefficient parameters and spanwise correlation length of the main beam in the vibrational state.
ParameterAerodynamic CoefficientReduced Wind Velocity
5.656.216.68
c
(attenuation coefficient)
lift coefficient0.1190.1180.107
resistance coefficient0.3390.4370.386
torque coefficient0.1590.1430.148
L
(spanwise correlation length)
lift coefficient0.3710.3960.386
resistance coefficient0.2250.2510.240
torque coefficient0.3960.3880.291
di
(horizontal asymptote of the function)
lift coefficient8.4378.4759.346
resistance coefficient2.9502.2882.591
torque coefficient6.2896.9936.757
Publisher’s Note: MDPI stays neutral with regard to jurisdictional claims in published maps and institutional affiliations.

