Article

Geometrical Effect of Active Material on Electrode Tortuosity in All-Solid-State Lithium Battery

School of Materials Science and Engineering, Pusan National University, Busandaehak-ro 63 beon-gil, Geumjeong-gu, Busan 46241, Republic of Korea
*
Author to whom correspondence should be addressed.
Appl. Sci. 2022, 12(24), 12692; https://doi.org/10.3390/app122412692
Submission received: 21 November 2022 / Revised: 8 December 2022 / Accepted: 9 December 2022 / Published: 11 December 2022

Abstract

:
In this study, the effect of the active material geometry on the tortuosity in the ion transport path of the electrode composite of an all-solid-state lithium battery was systematically analyzed in terms of the different design and process factors of an electrode. A direct current technique (i.e., chronoamperometry) using an electron-blocking cell was used to analyze the tortuosity to minimize the experimental error. In addition, aluminum oxide was selected as a hypothetical active material in a composite electrode to exclude the possible disturbance of the ion transport signal caused by real active materials. The experimental results showed that the shape and composition of the active material had significant influences on the ion transport characteristics. In particular, when a fibrous material was applied with a high active material ratio, the degree of tortuosity was significantly increased, reaching values as high as 45, due to the insufficient filling in the micropores formed by particle aggregation. Moreover, the tortuosity degree decreased below 15 as the pressing pressure increased during electrode manufacturing, and the cause of this decrease differed with the active material’s particle shape. The analysis results confirmed that the change in tortuosity resulting from the electrode design factors of an all-solid-state battery has distinctive features compared to that for a conventional liquid electrolyte-based lithium-ion battery.

1. Introduction

The all-solid-state lithium battery is receiving significant attention as a next-generation lithium secondary battery because all the constituent materials, including the electrolyte, are made of solids, and it is safer and has a higher energy density than a liquid-type organic electrolyte-based lithium-ion battery [1,2,3]. However, the limited ductility of a solid electrolyte makes it difficult to cover the rough surface of the active material and penetrate the micropores of the electrode. Thus, the contact characteristics between the active material and solid electrolyte and the filling rate of the electrolyte in the electrode are relatively low compared to those of liquid electrolyte-based lithium-ion batteries [4]. This situation causes two significant problems. The first is poor contact, which increases the interface resistance between the active material and electrolyte. This causes an increase in the overvoltage during battery operation, which adversely affects vital performance parameters such as the capacity, energy density, and rate capability. The poor contact problem is a critical issue in all-solid-state batteries and has generated interest among many researchers [5,6,7,8]. The other problem is that the transport of ions in the electrode is greatly limited by the low filling factor, as well as the distribution and connectivity problems of the solid electrolyte [9,10]. It has been reported that the ion transport resistance in the electrode is a significant factor in the high-rate charge/discharge of the battery [11,12,13]. In relation to the kinetics, facile ion transport within the electrode is essential to the performance of an all-solid-state battery.
Tortuosity is considered one of the most important parameters of porous media and there has been much effort to characterize the microstructure and ion transport properties of electrode composites in batteries by using it [14,15,16,17,18,19]. Because higher tortuosity indicates a more complicated transport path for the ions in the electrode, the tortuosity is directly related to the high-rate charge/discharge characteristics of the battery. Therefore, previous studies have used the tortuosity to predict the ease of ion transport in the electrode and the battery output characteristics in relation to the design factors of the electrode (e.g., the thickness, density, composition, size, and shape of active material particles). Ebner et al. used the Bruggeman relation to derive the tortuosity of the ion transport path in an electrode according to the shape of the active material in a liquid-type lithium-ion battery [20], and Usseglio-Viretta et al. mathematically analyzed the shape and size of the active material particles, along with the tortuosity of the ion transport path, due to the pores formed as a result in a liquid-type lithium-ion battery [21]. The reports related to electrodes for all-solid-state batteries primarily discuss the distribution of the electrolyte and pores inside the electrode. So et al. derived porosity and tortuosity values by modeling the interface characteristics and structural changes of solid particles in relation to the pressure applied during electrode manufacturing [22]. Assuming that the pores inside an electrode were entirely filled with a solid electrolyte, Hlushkou et al. used calculated the tortuosity values to analyze the effect on the filling factor of the electrolyte in an all-solid-state electrode [23].
However, most studies on tortuosity changes in relation to the microstructures of electrodes are conducted using computational simulation [20,21,22,23,24,25]. Although computational simulation is suitable for simplifying and realizing complex microstructures, there is a limit to perfectly simulating the microstructure of an actual electrode because it is difficult to implement the non-uniform distribution of particles or closed pores in a solid electrode. In fact, in a tortuosity analysis using computer simulation, in a situation where the porosity is very low or the influence of active material particles is significant, even lithium-ion batteries show a significant deviation from the actual experimental results [26]. The result may be different from the experimentally derived result because, in many cases, it is difficult to quantify the diffusion coefficient values, and so arbitrary sets are used and analyzed [27]. On the other hand, such a tortuosity variation in the electrode is also observed in research based on experiments, e.g., electrochemical impedance spectroscopy (EIS) [27,28,29,30]. Impedance spectra obtained from EIS are affected by various reaction signals, including the state of the contact between particles in an electrode [31], contact between particles and a substrate [32], oxidation/reduction reactions [33], active material interface reactions, and reaction products [34]. In many cases, the influence of artifacts caused by the structure of the test cell cannot be ignored [35]. Therefore, when only analyzing specific reaction patterns in a battery (e.g., tortuosity analysis), great care is required in the equivalent circuit construction and application [36].
In short, studies on the tortuosity in an electrode are primarily conducted using a theoretical, computational simulation method that simplifies and analyzes the microstructure of an actual electrode and an EIS analysis method with a relatively high experimental error. Hence, in-depth research is still needed to obtain more accurate results. When an electrode for an all-solid-state battery has a high active material ratio, the solid electrolyte does not sufficiently fill the spaces between the active material particles, resulting in randomly generated pores. This makes the path complex and unpredictable. Thus, there is a need for reliable tortuosity test results for solid electrolyte electrodes with high active material content [36].
In this study, the tortuosity of an all-solid-state battery electrode with a high active material ratio was quantified in an attempt to gain an in-depth understanding of the ion transport in the electrode. Different electrode design factors (active material shape and size) and a process factor (pressing pressure) were set as variables. To minimize the experimental errors by simplifying the test cell and analysis method, an electron-blocking cell was used with direct current techniques (i.e., the tortuosity was analyzed by chronoamperometry). In addition, aluminum oxide powder (Al2O3), a non-conductive material, was used as a hypothetical active material to exclude the interface reaction between the active material and electrolyte, which can affect the electrochemical quantification of tortuosity. Specifically, a composite electrode with Al2O3, an inert material, was selected as a model system for a thorough analysis of the geometrical effect of active materials on the ion transport through a solid electrolyte in a composite electrode, in a similar manner as in previous works [36,37]. The ease of ion migration and migration path connectivity were investigated using the tortuosity and porosity determined for each design and process condition, together with the Bruggeman coefficient derived from it. In addition, the characteristic trends were experimentally demonstrated in the all-solid-state battery electrode and we compared them with the results for an existing liquid electrolyte-based lithium-ion battery electrode.

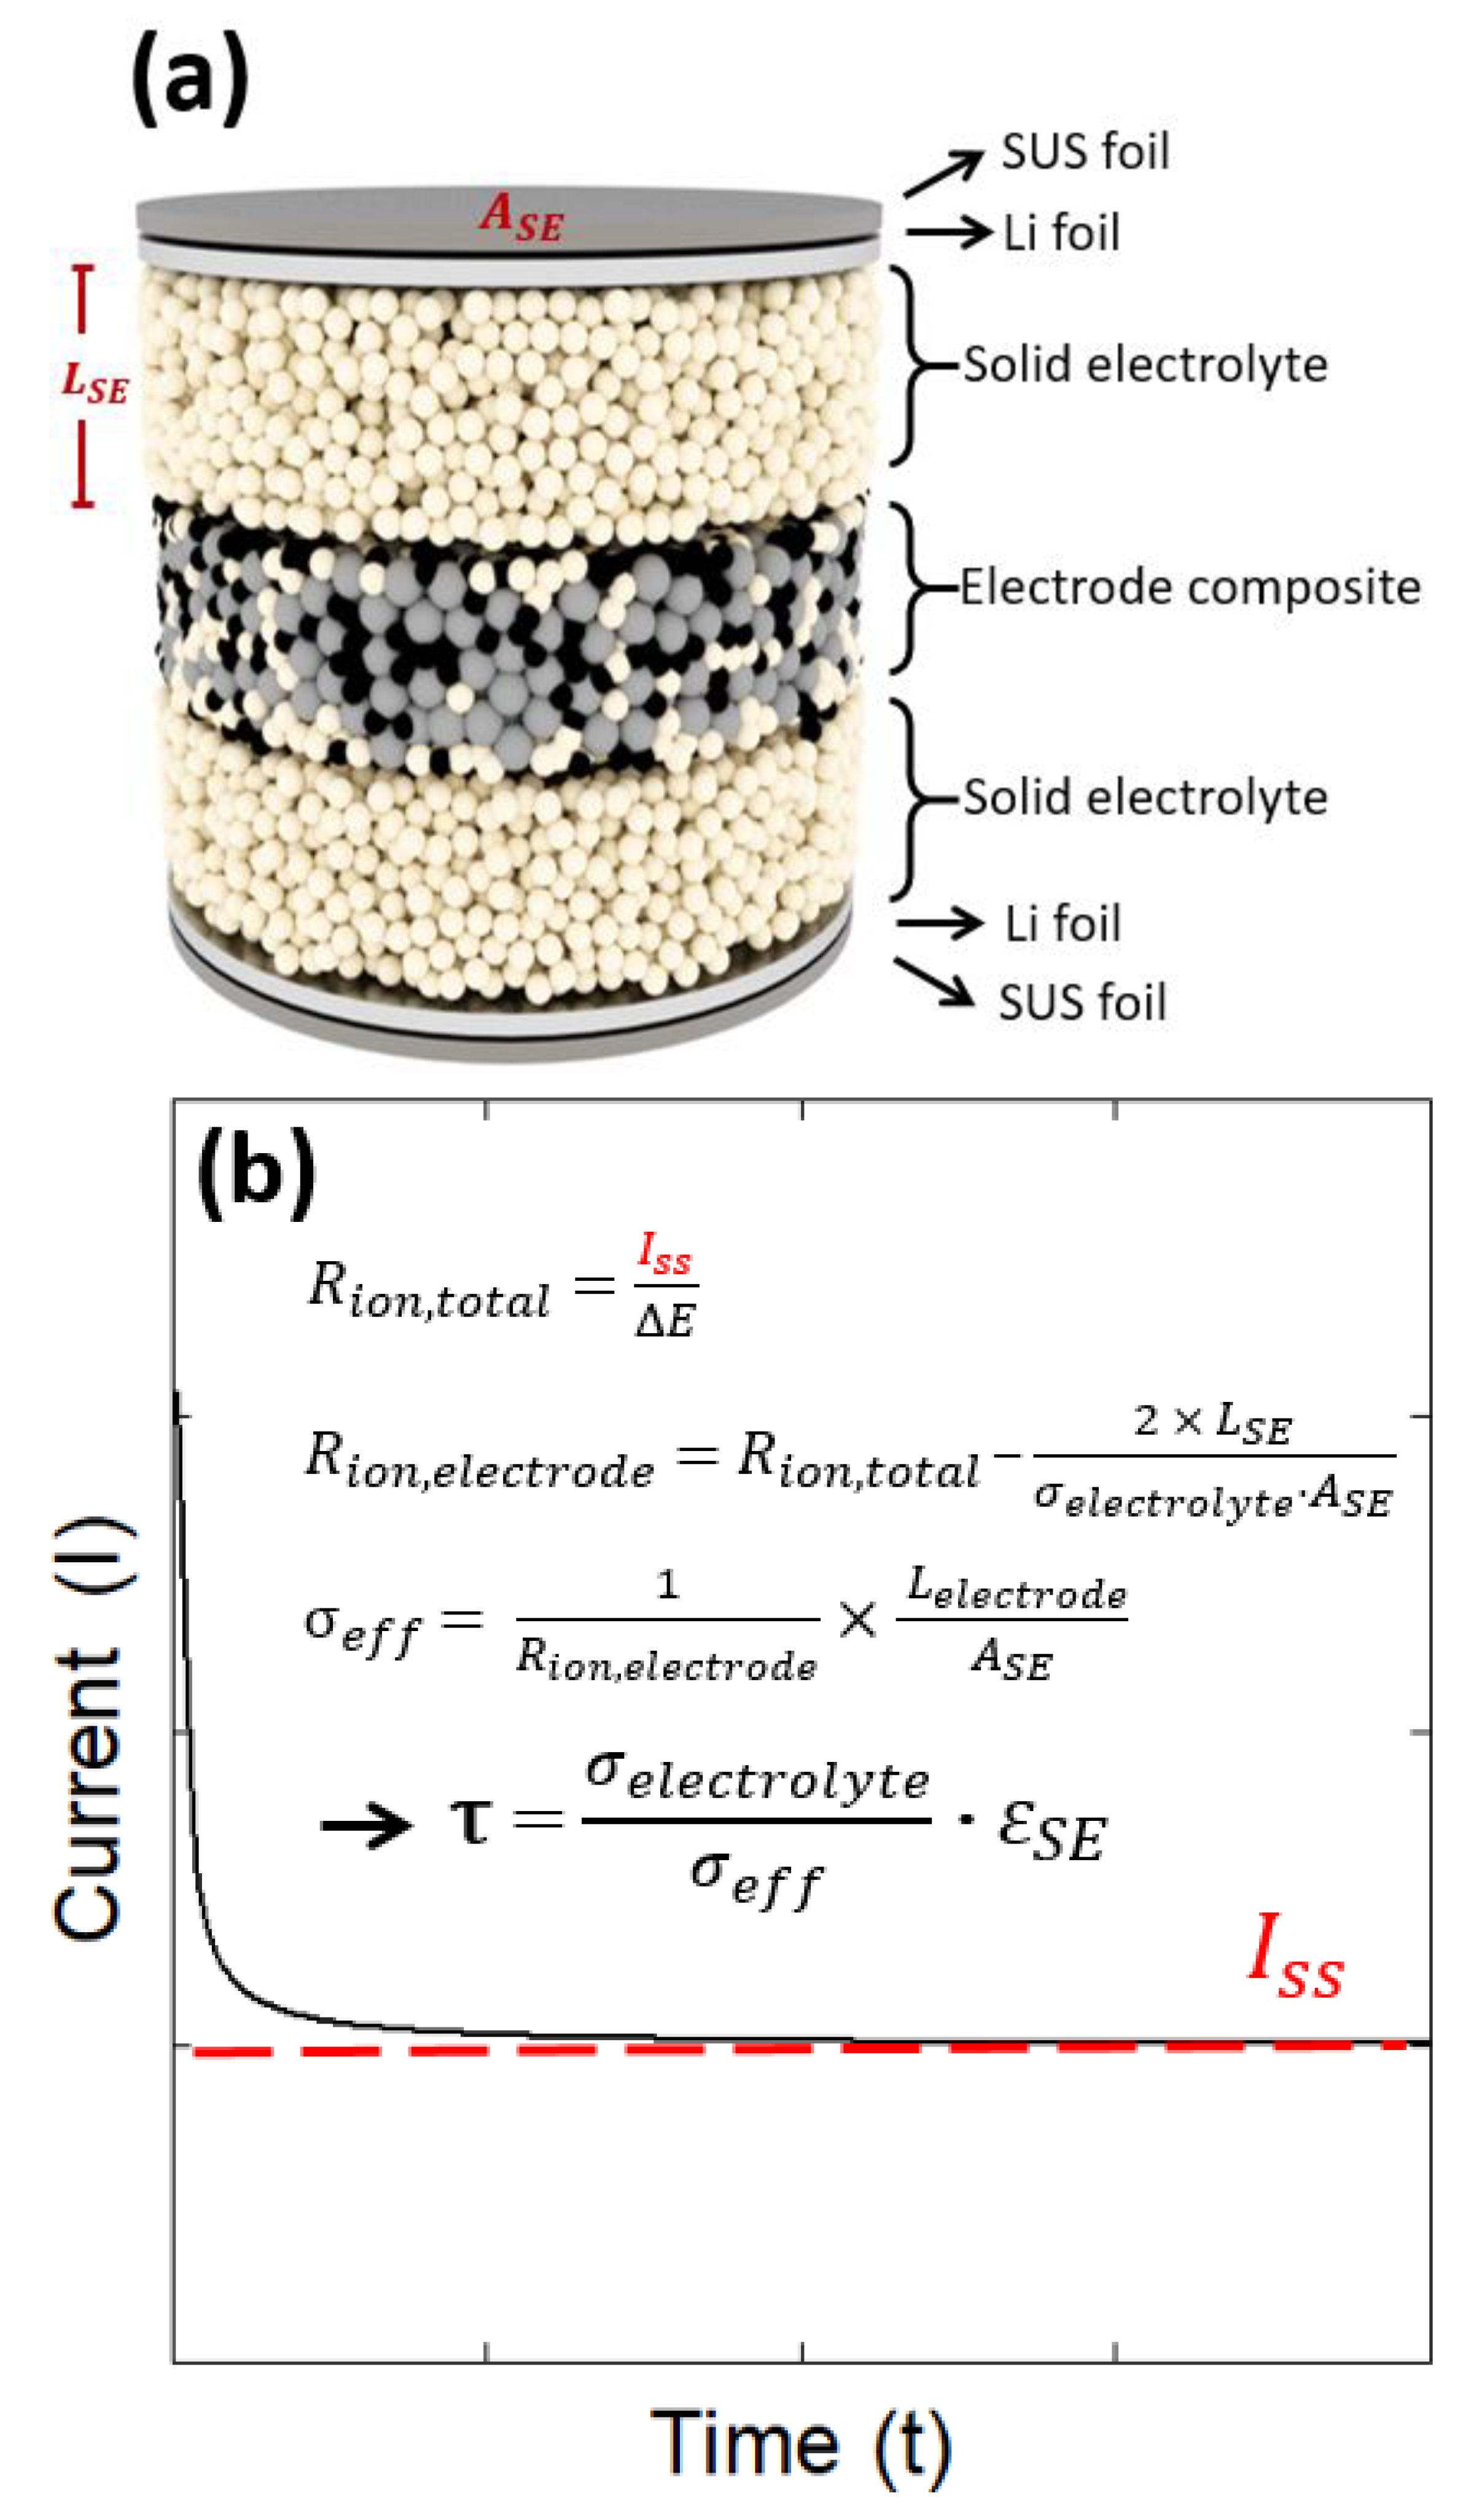
2. Theoretical Background

The ion transport path through the electrolyte in the electrode can be quantified by the tortuosity (τ) [38].
τ = I real I direct
Here, Ireal is the actual transport distance of ions in the electrolyte, and Idirect is the vertical straight transport distance of ions in the electrolyte. The degree of tortuosity is a relation showing how much the actual transport path is distorted compared to a straight transport path of ions in the electrolyte, with a higher value indicating a more complicated path. Because the ease of ion transport can be represented by the ionic conductivity, Equation (1) is identical to the equation below [39].
τ = σ electrolyte σ eff · ε
where σelectrolyte is the intrinsic conductivity of the electrolyte, σeff is the effective conductivity, and ε is the volume fraction of the electrolyte. The Bruggeman relation is a typical empirical formula that links the tortuosity with the ease of ion transport [40,41].
τ = ε α
Here, ε is the porosity, and α is the Bruggeman coefficient. In the above formula, ε is the ratio of the electrolyte that can move ions, and α represents the connectivity of the ion transport pathway [42].

3. Experimental Details

3.1. Materials and Electrode Fabrication

A total of five types of Al2O3 powder with different shapes and sizes were used as hypothetical active materials: (1) a small spherical shape (Al2O3, 99.8%, 8–12 μm, Lumi-M Co., Seoul, Republic of Korea), (2–3) medium and large spherical shapes (Al2O3, 99.8%, 90 μm, Lumi-M Co., Republic of Korea; powder was sieved and classified into two sizes), (4) plate shape (Al2O3, primarily α phase 99.5%, Sigma-Aldrich, St. Louis, MO, USA), (5) fibrous shape (Al2O3, with a diameter of 2–6 nm and length of 200–400 nm, Sigma-Aldrich, St. Louis, MO, USA). The shape and size of the Al2O3 powder were observed using a field emission scanning electron microscope (FESEM; MIRA3, TESCAN, Brno, Czech Republic). In particular, the average sizes of the spherical particles were determined by laser diffraction particle size analyzers (LS 13 320 SW, Beckman Coulter, Brea, CA, USA). Argyrodite (Li6PS5Cl, 3 μm, CIS Solid Electrolyte, Seoul, Republic of Korea) and carbon black (acetylene, 100%, compressed, Thermo Fisher Scientific, Oxford, UK) were used as the electrolyte and conductive material, respectively. At this time, no binder was added, in order to clearly observe the tortuosity change in relation to the active material’s shape. In other words, the electrode was composed of an inert active material, a solid electrolyte, and a conductive material (the term “electrode” used hereinafter means “electrode composite” unless otherwise specified). When analyzing the tortuosity in relation to the active material ratio or solid electrolyte ratio, the solid electrolyte volume ratio was varied between 0.32 and 0.72.
To ensure a uniform dispersion of the mixture (active material + solid electrolyte + conductive material), it was mixed and dispersed evenly for 10 min at 2000 rpm in a Thinky mixer (AR-100 Planetary centrifugal mixer, Thinky, Tokyo, Japan). Then, 80 mg of the dispersed mixture was hydraulically pressed in a Φ13 mm mold at approximately 109 MPa to obtain a thick film pellet having a thickness of approximately 250–350 μm. To analyze the tortuosity degree in relation to the shape of the active material, the pressure condition was fixed at 109 MPa, and the hydraulic pressure condition was varied between 44 and 655 MPa to analyze the tortuosity degree according to the pressing pressure.

3.2. Cell Fabrication and Tortuosity Measurement

Figure 1a shows a schematic diagram of the electron-blocking cell used for the tortuosity analysis. When manufacturing the cell, stainless steel foil (SUS 444, 10 um, Woori-Science, Seoul, Republic of Korea) was used as the substrate, and lithium foil (99.9%, 10 um, MTI Corporation, Richmond, CA, USA) was used as the electrode material for the anode and cathode. When a potential difference was applied between the anode and cathode, the cell was suitable for analyzing the Li+ transport pattern in the electrode composite because the electrolyte layer blocked the transport of electrons, and only the transport of ions occurred. The steady-state current (Iss) was determined by applying a specific potential difference, ΔE (=100 mV), to both ends of this cell (see Figure 1b). The resistance (ΔE/Iss) determined at this time was the total ion transport resistance (Rion,total) inside the electron-blocking cell, which was the sum of the electrode composite resistance and electrolyte resistance of the two layers. Therefore, by calculating the resistance of the solid electrolyte layer using the ionic conductivity (σelectrolyte = 0.174 S/m), thickness (LSE = approximately 600 μm), and area (ASE = 1.33 cm2) of the solid electrolyte, and subtracting it from Rion,cell, the electrode composite resistance (Rion,electrode) was calculated.
R ion , electrode = R ion , total 2 × L SE ( σ electrolyte · A SE )
Then, the Li+ conductivity (σeff) in the electrode composite was finally derived using the area (ASE) and thickness of the electrode composite (Lelectrode), and the tortuosity was determined by substituting this into Equation (2).
In addition, the porosity (n) of the electrode was determined using the formula below, as a value representing the free volume, excluding the volume of the particles in the electrode composite.
n = V real V theo V real
Here, the actual electrode volume (Vreal) and theoretical volume of the constituent materials (Vtheo) can be determined using the following equation.
V real = L electrode · A electrode
V theo = m AM ρ AM + m SE ρ SE + m CA ρ CA
where Lelectrode and Aelectrode represent the thickness and area of the electrode composite, respectively; mAM, mSE, and mCA represent the masses of the active material, solid electrolyte, and conductive additive, respectively; and ρAM, ρSE, and ρCA represent the respective theoretical densities.
All the electrochemical test cells were manufactured in an Ar-filled glove box (KK-011AS-Extra (3 Port), Korea Kiyon, Seoul, Republic of Korea), and the electrochemical tests were performed using a potentiostat (BCS 810, Biologic, Seyssinet-Pariset, France).

4. Results and Discussion
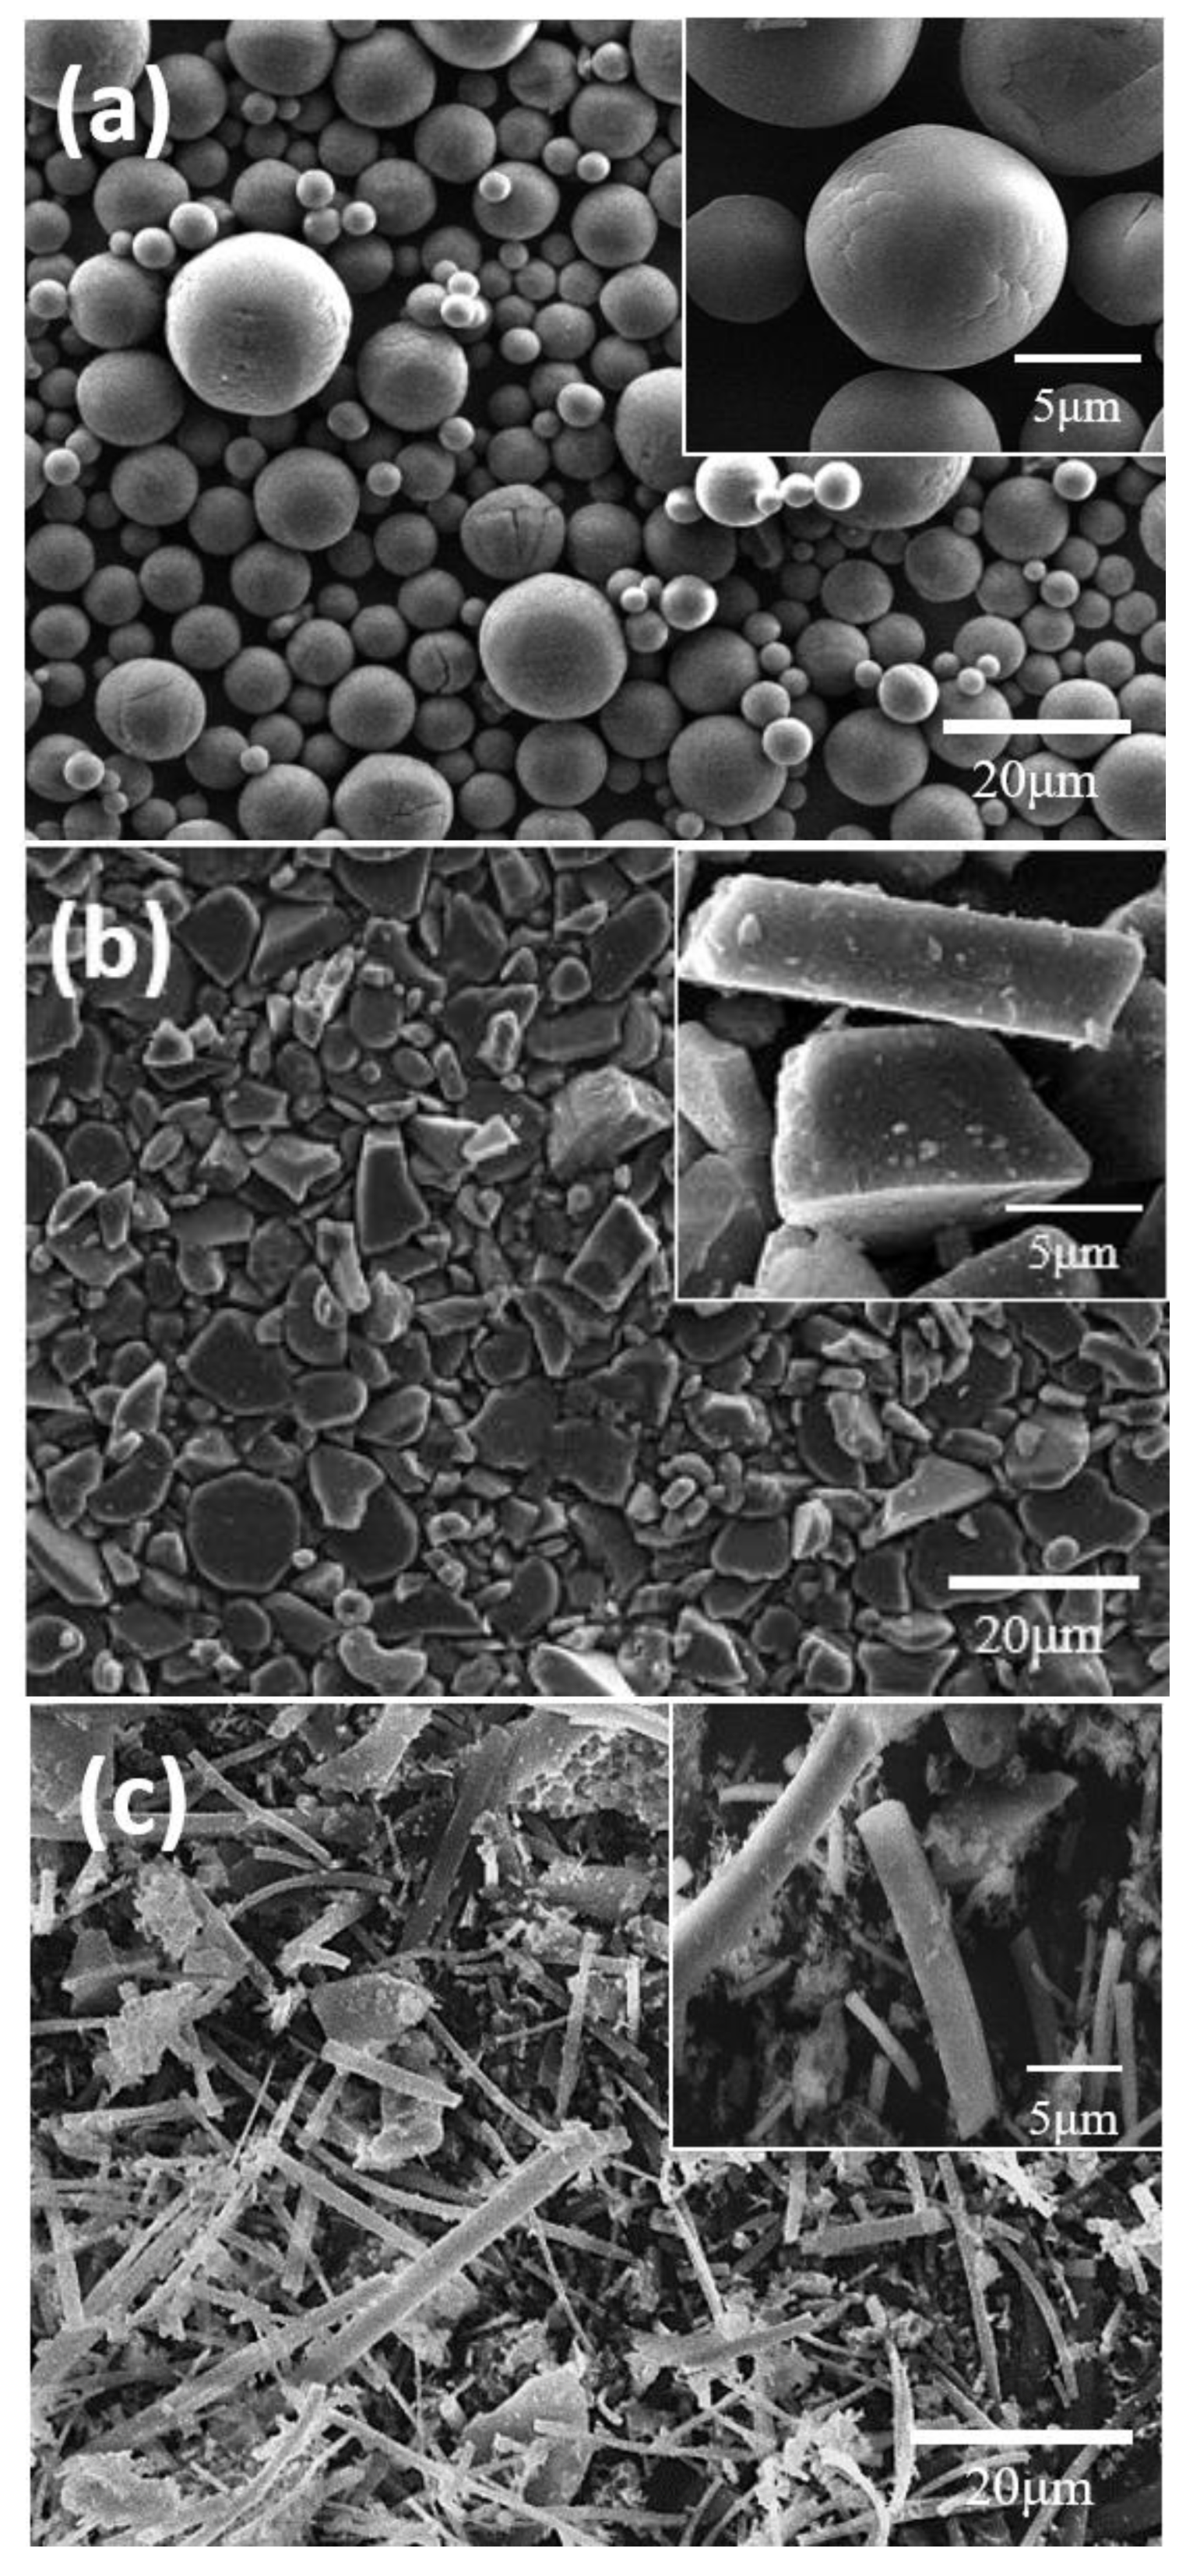
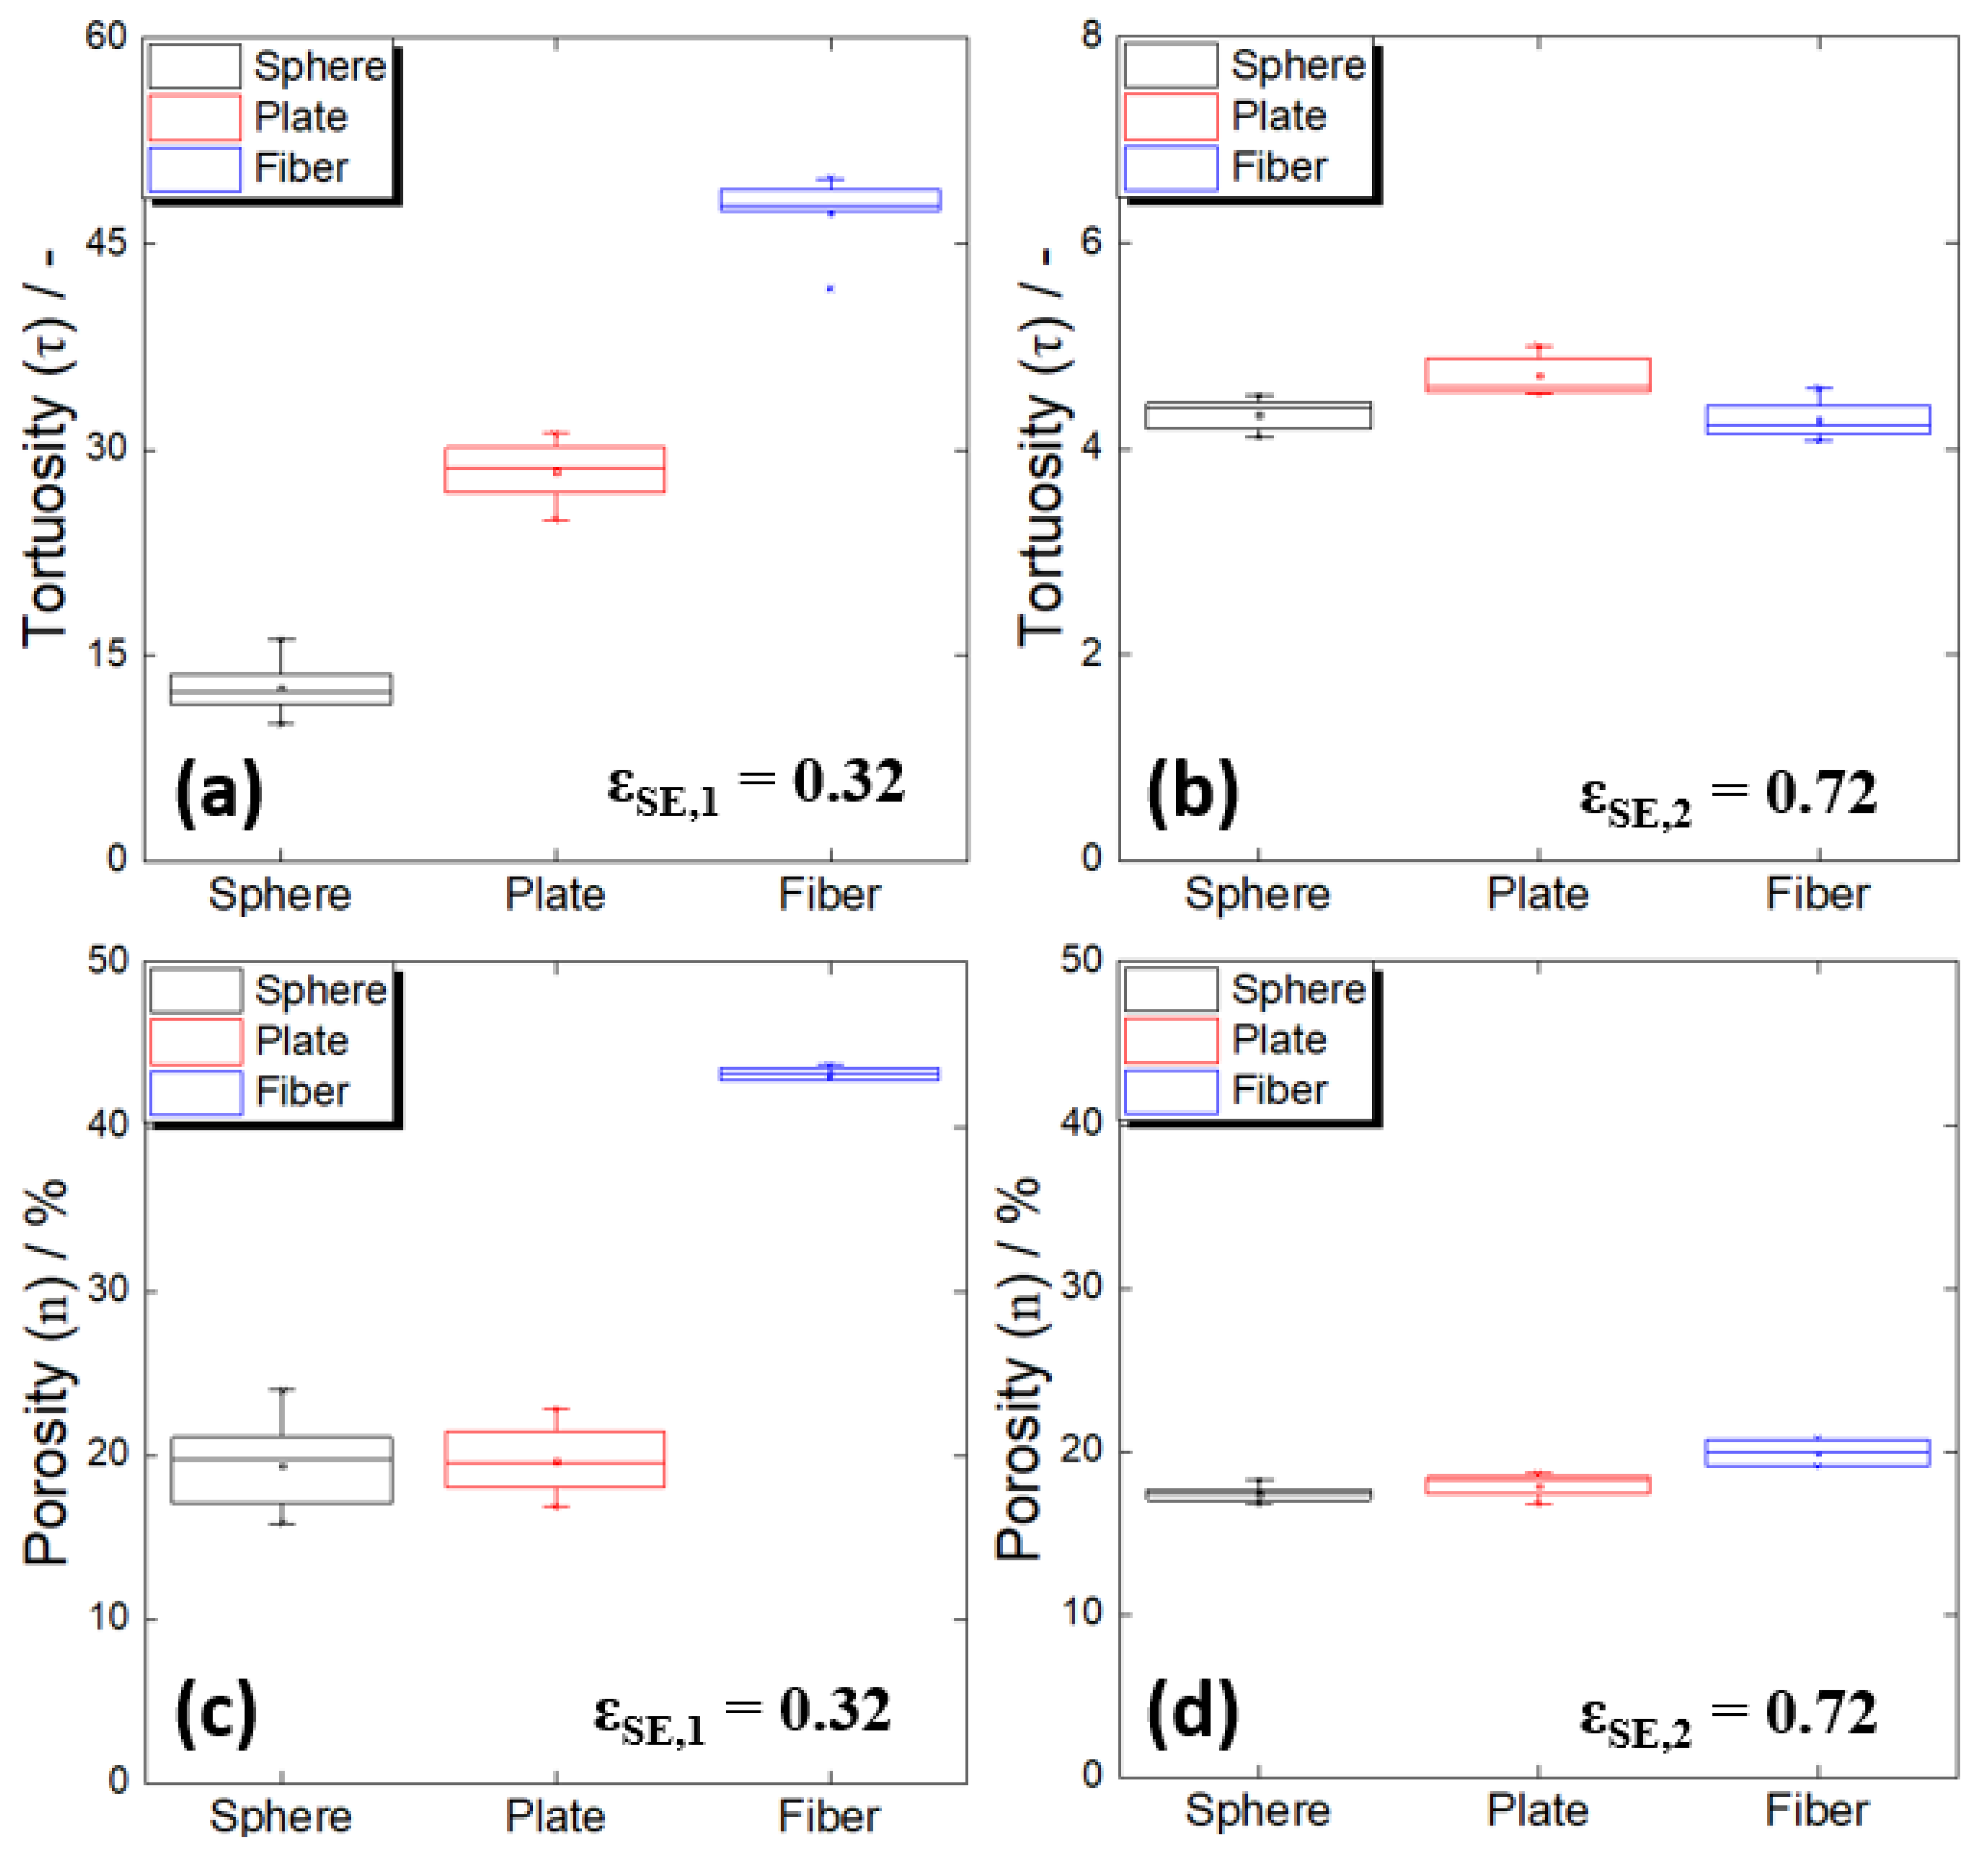
4.1. Shape Effect

Figure 2a–c show electron micrographs of the spherical, plate-shaped, and fibrous Al2O3 particles used for the analyses of the electrode tortuosity according to the shape of the active material, respectively. It was confirmed that each had the designed shape characteristics. The spherical particles were isotropic and were well separated from each other. The plate-shaped particles were anisotropic, which meant that their aspect ratios were distributed in various ways, while the fibrous particles had extremely large aspect ratios and many micropores were formed due to the aggregation of the particles.
To perform a more in-depth analysis of the difference in tortuosity in relation to the particle shape in the all-solid-state battery electrode, the ratio of solid electrolyte in the electrode (εSE) was adjusted: εSE,1 = 0.32, εSE,2 = 0.72. Figure 3 shows the chronoamperometric curves of the test cell fabricated with the three types of active materials, using the high (εSE,1, Figure 3a) and low (εSE,2, Figure 3b) active material ratios, for a total of six active material conditions. In all six cases, a steady state was reached after an initial rapid decrease in current. In addition, because the transport of lithium ions was relatively complex with a high active material ratio (εSE,1), it took longer to reach a steady state compared to the case with the low active material ratio (εSE,2), and the steady-state current (Iss) was also low. The tortuosity was determined based on the steady-state current using the method presented in Section 2, and the results with the high (εSE,1) and low (εSE,2) active material ratios are shown in Figure 4a,b, respectively.
First, under the condition in which the ratio of active material was high (εSE,1), a significant difference in tortuosity occurred according to the shape (Figure 4a), with tortuosity values two times and three times higher than the spherical shape, for the plate and fiber shapes, respectively. Because the electrodes all had the same electrolyte volume ratio, this difference could be said to reflect a difference in the ease of lithium-ion transport due to the shape of the active material or connectivity difference in the transport path. On the other hand, the spherical and plate-shaped electrodes had almost the same porosity (~20%), while the fibrous electrodes had values that were approximately twice as large (Figure 4c). The fact that the spherical and plate-shaped electrodes had the same porosity suggested that the difference in the tortuosities of the electrodes with these two forms of active material was due only to the complexity of the ion transport path in the solid electrolyte. In the case of plate-shaped particles with a large aspect ratio, considering the previous report that the particles tend to be preferentially arranged in a direction parallel to the substrate during the electrode manufacturing process [21], the tortuosity difference between the spherical and plate-shaped particles with the same porosity was easy to understand. The preferential arrangement of our plate-shaped particles was also observed in the cross-sectional image of the composite electrode (Figure 5a).
On the other hand, it is noteworthy that the fiber type had twice the porosity. This means that when the active fibrous material was used, the solid electrolyte did not smoothly penetrate the pores inside the electrode during the electrode manufacturing process. In the case of the fibrous particles, unlike the other shapes, particle aggregation was observed, and, as a result, countless micropores were formed between the particles (Figure 2c). Thus, it is believed that the electrodes composed of fibrous particles had high porosity and tortuosity values because the solid electrolyte did not sufficiently fill the numerous micropores formed by the aggregation of particles. The above argument was supported by the cross-sectional image of the electrode (Figure 5b). When an active fibrous material is used in an electrode for a lithium-ion battery using a liquid electrolyte, the excellent permeability of the liquid electrolyte generally increases the active material/electrolyte contact area, which is known to be advantageous for realizing a high-power battery [43]. However, given the above results, it is necessary to pay great attention to the low filling rate of the solid electrolyte resulting from particle aggregation in all-solid-state battery electrodes, especially when a high proportion of active fibrous material is used.
To experimentally verify the above arguments about the low filling results when a solid electrolyte was used with fibrous particles, the same analysis was performed for a high electrolyte ratio (low active material ratio) with a relatively low solid electrolyte permeation problem. As a result, the differences in the tortuosity and porosity values between the fibrous type and the other shapes were significantly reduced at a low active material ratio (Figure 4b,d). It is quite likely that the particle aggregation was suppressed as the electrolyte ratio increased, and the electrolyte filling was also dramatically improved.
It should be mentioned that it is not easy to use computer simulation to investigate the microstructure of an electrode for an all-solid-state battery in which active material aggregation and insufficient electrolyte filling occur. In general, when computational simulation is used for tortuosity analysis, it is common to simplify the microstructure of an electrode and then analyze it based on a theoretical formula. The result may have a significant error compared to the actual result. The discrepancy between the theoretical and actual values could also be confirmed using the results for the change in tortuosity in relation to the volume ratio of the solid electrolyte in the electrode (Figure 6). When the Bruggeman relation (Equation (3)) was applied with the low active material ratio (εSE > 0.45), which was considered to have relatively few problems with dispersion, aggregation, and electrolyte penetration, the Bruggeman coefficient was estimated to be approximately 3.13. It is noteworthy that when the active material ratio was approximately 60% or greater (εSE < 0.6, blue dotted circle in Figure 6), the tortuosity value derived from the actual experiment was larger than the expected value based on the Bruggeman relation, and a larger active material ratio resulted in a more significant difference. These results suggest that erroneous results may be derived when the microporous structure in the electrode for an all-solid-state battery is overly simplified and implemented.

4.2. Size Effect

Figure 7a–c show electron micrographs of the Al2O3 powders used to analyze the effect of the active material size on the tortuosity in an electrode, together with particle size analysis data (Figure 7d). A total of three types were used, with average diameters of approximately 10, 70, and 100 μm (hereafter, they are called S10, S70, and S100, respectively). As previously mentioned, because active material aggregation was determined to have a significant effect on the tortuosity, the active material size effect was analyzed by removing the powder with a relatively low particle diameter (<10 μm), which had a relatively high possibility of particle aggregation.
Figure 8a shows the change in tortuosity according to the particle size of the active material. It could be confirmed that the tortuosity slightly increased with the diameter of the active material particles. This was contrary to the previously reported tortuosity change in relation to the active material’s size in an all-solid-state battery electrode. Froboese et al. reported that as the particle size of the active material increased, the interparticular interstices were better filled by the electrolyte, and the tortuosity decreased [36]. However, these results were obtained using a very low active material ratio or a high electrolyte ratio (electrolyte volume ratio in the electrode: 50–90%) compared to this study, suggesting that sufficient electrolyte effectively filled the large particle gaps, which in turn resulted in low tortuosity [36,44,45]. On the other hand, in this study, a high active material ratio (electrolyte volume ratio: 32%) was used for a high-energy-density all-solid-state battery, which is a recent industrial development direction. Thus, the electrolyte content may not have been sufficient to fill all the particle gaps.
A comparison of the porosity results according to the particle size (Figure 8b) showed that the porosity values of the electrodes using S10 and S70 were statistically similar. This suggested that the S70 electrode had the same volume of unfilled pores as the S10 electrode, but had a high degree of tortuosity because of the poor connectivity of the solid electrolyte in the large particle gaps. On the other hand, the electrode using S100 showed an increase in porosity compared to the other two electrodes. Therefore, it was conjectured that the overall connectivity of the ion transport path in the S100 electrode had further deteriorated as a result of the increase in the volume of unfilled pores, along with the low connectivity of the solid electrolyte in the large particle gaps. The difference in the ion-path connectivities of the S10, S70, and S100 electrodes was also confirmed by the change in the Bruggeman coefficient (Figure 8c). In conclusion, when the electrode had a high active material ratio, it should be noted that the connectivity of the electrolyte may have deteriorated because of the limited amount of solid electrolyte, even if the particle size of the active material and interparticle gaps increased.

4.3. Electrode Density (Pressure) Effect

When manufacturing an electrode for a solid-state battery, a pressing process is included to improve the contact characteristics between the internal solid particles. Therefore, examining how the electrolyte connection characteristics vary depending on the pressurization condition is essential. Figure 9a–c show how the tortuosity, porosity, and Bruggeman coefficient changed with different shapes of the active material, respectively, when the applied pressure changed in the range of 40–660 MPa during the manufacture of electrodes. Overall, regardless of the shape of the active material, the degree of tortuosity tended to decrease monotonically as the pressing pressure increased. However, the pattern of the porosity change was somewhat different when it had a fibrous shape compared to those with the other shapes.
First, in the case of electrodes containing spherical and plate-shaped active materials, the change in porosity with an increase in the pressing pressure was insignificant (Figure 9b). This means that an increase in pressure did not significantly improve the electrolyte penetration into the pores in the electrode. On the other hand, it was confirmed that the Bruggeman coefficient, which reflects the electrolyte connectivity, decreased significantly as the applied pressure increased (Figure 9c). In other words, the decrease in tortuosity with increasing pressure in electrodes containing spherical and plate-shaped active materials was believed to be due to improved contact between electrolyte particles (reduction in lithium-ion migration resistance at electrolyte grain boundaries) and improved tightness of ion migration paths [46].
In the case of an electrode containing a fibrous material, the porosity changed significantly in the region where the pressing pressure was low, but there was almost no change in the area where the pressing pressure was high (regions A and B in Figure 9b). On the other hand, the Bruggeman coefficient did not differ in the low-pressure region but changed significantly in the high-pressure region (regions A and B in Figure 9c). As previously discussed, there are many micropores in an electrode composed of a fibrous material due to the aggregation of particles. When pressure was applied, the electrolyte penetrated the agglomerate and filled these micropores (region A), which eventually led to a considerable decrease in tortuosity. Then, when electrolyte penetration into the micropores of the aggregate was no longer possible because of the limited electrolyte ductility (region B), as in the case of using spherical and plate-shaped active materials, the contact characteristics of the electrolyte particles improved as the pressing pressure increased, and the tortuosity further decreased.
In summary, as the pressing pressure increased during electrode manufacturing, the degree of tortuosity decreased, resulting from the improved contact between electrolyte particles and the electrolyte filling factor in the electrolyte. This was an exceptional result only in the electrode of an all-solid-state battery, which was not observed in a lithium-ion battery using a liquid electrolyte. In general, in the case of a lithium-ion battery, when the electrode is pressurized, the distortion of the ion transport path filled with liquid electrolyte becomes severe, and the tortuosity tends to increase [47]. On the other hand, in an electrode for an all-solid-state battery, the pressing pressure is effective in improving the tortuosity (i.e., the mobility of lithium ions) within a range where the mechanical destruction of the active material does not occur [48] and is more effective in improving the fibrous shape than when the active material has a spherical or plate-like shape.

5. Conclusions

In this study, the tortuosity in all-solid-state battery electrodes was systematically analyzed in relation to electrode design factors (i.e., the active material shape and size) and a process factor (pressing pressure). The experimental results are summarized as follows.
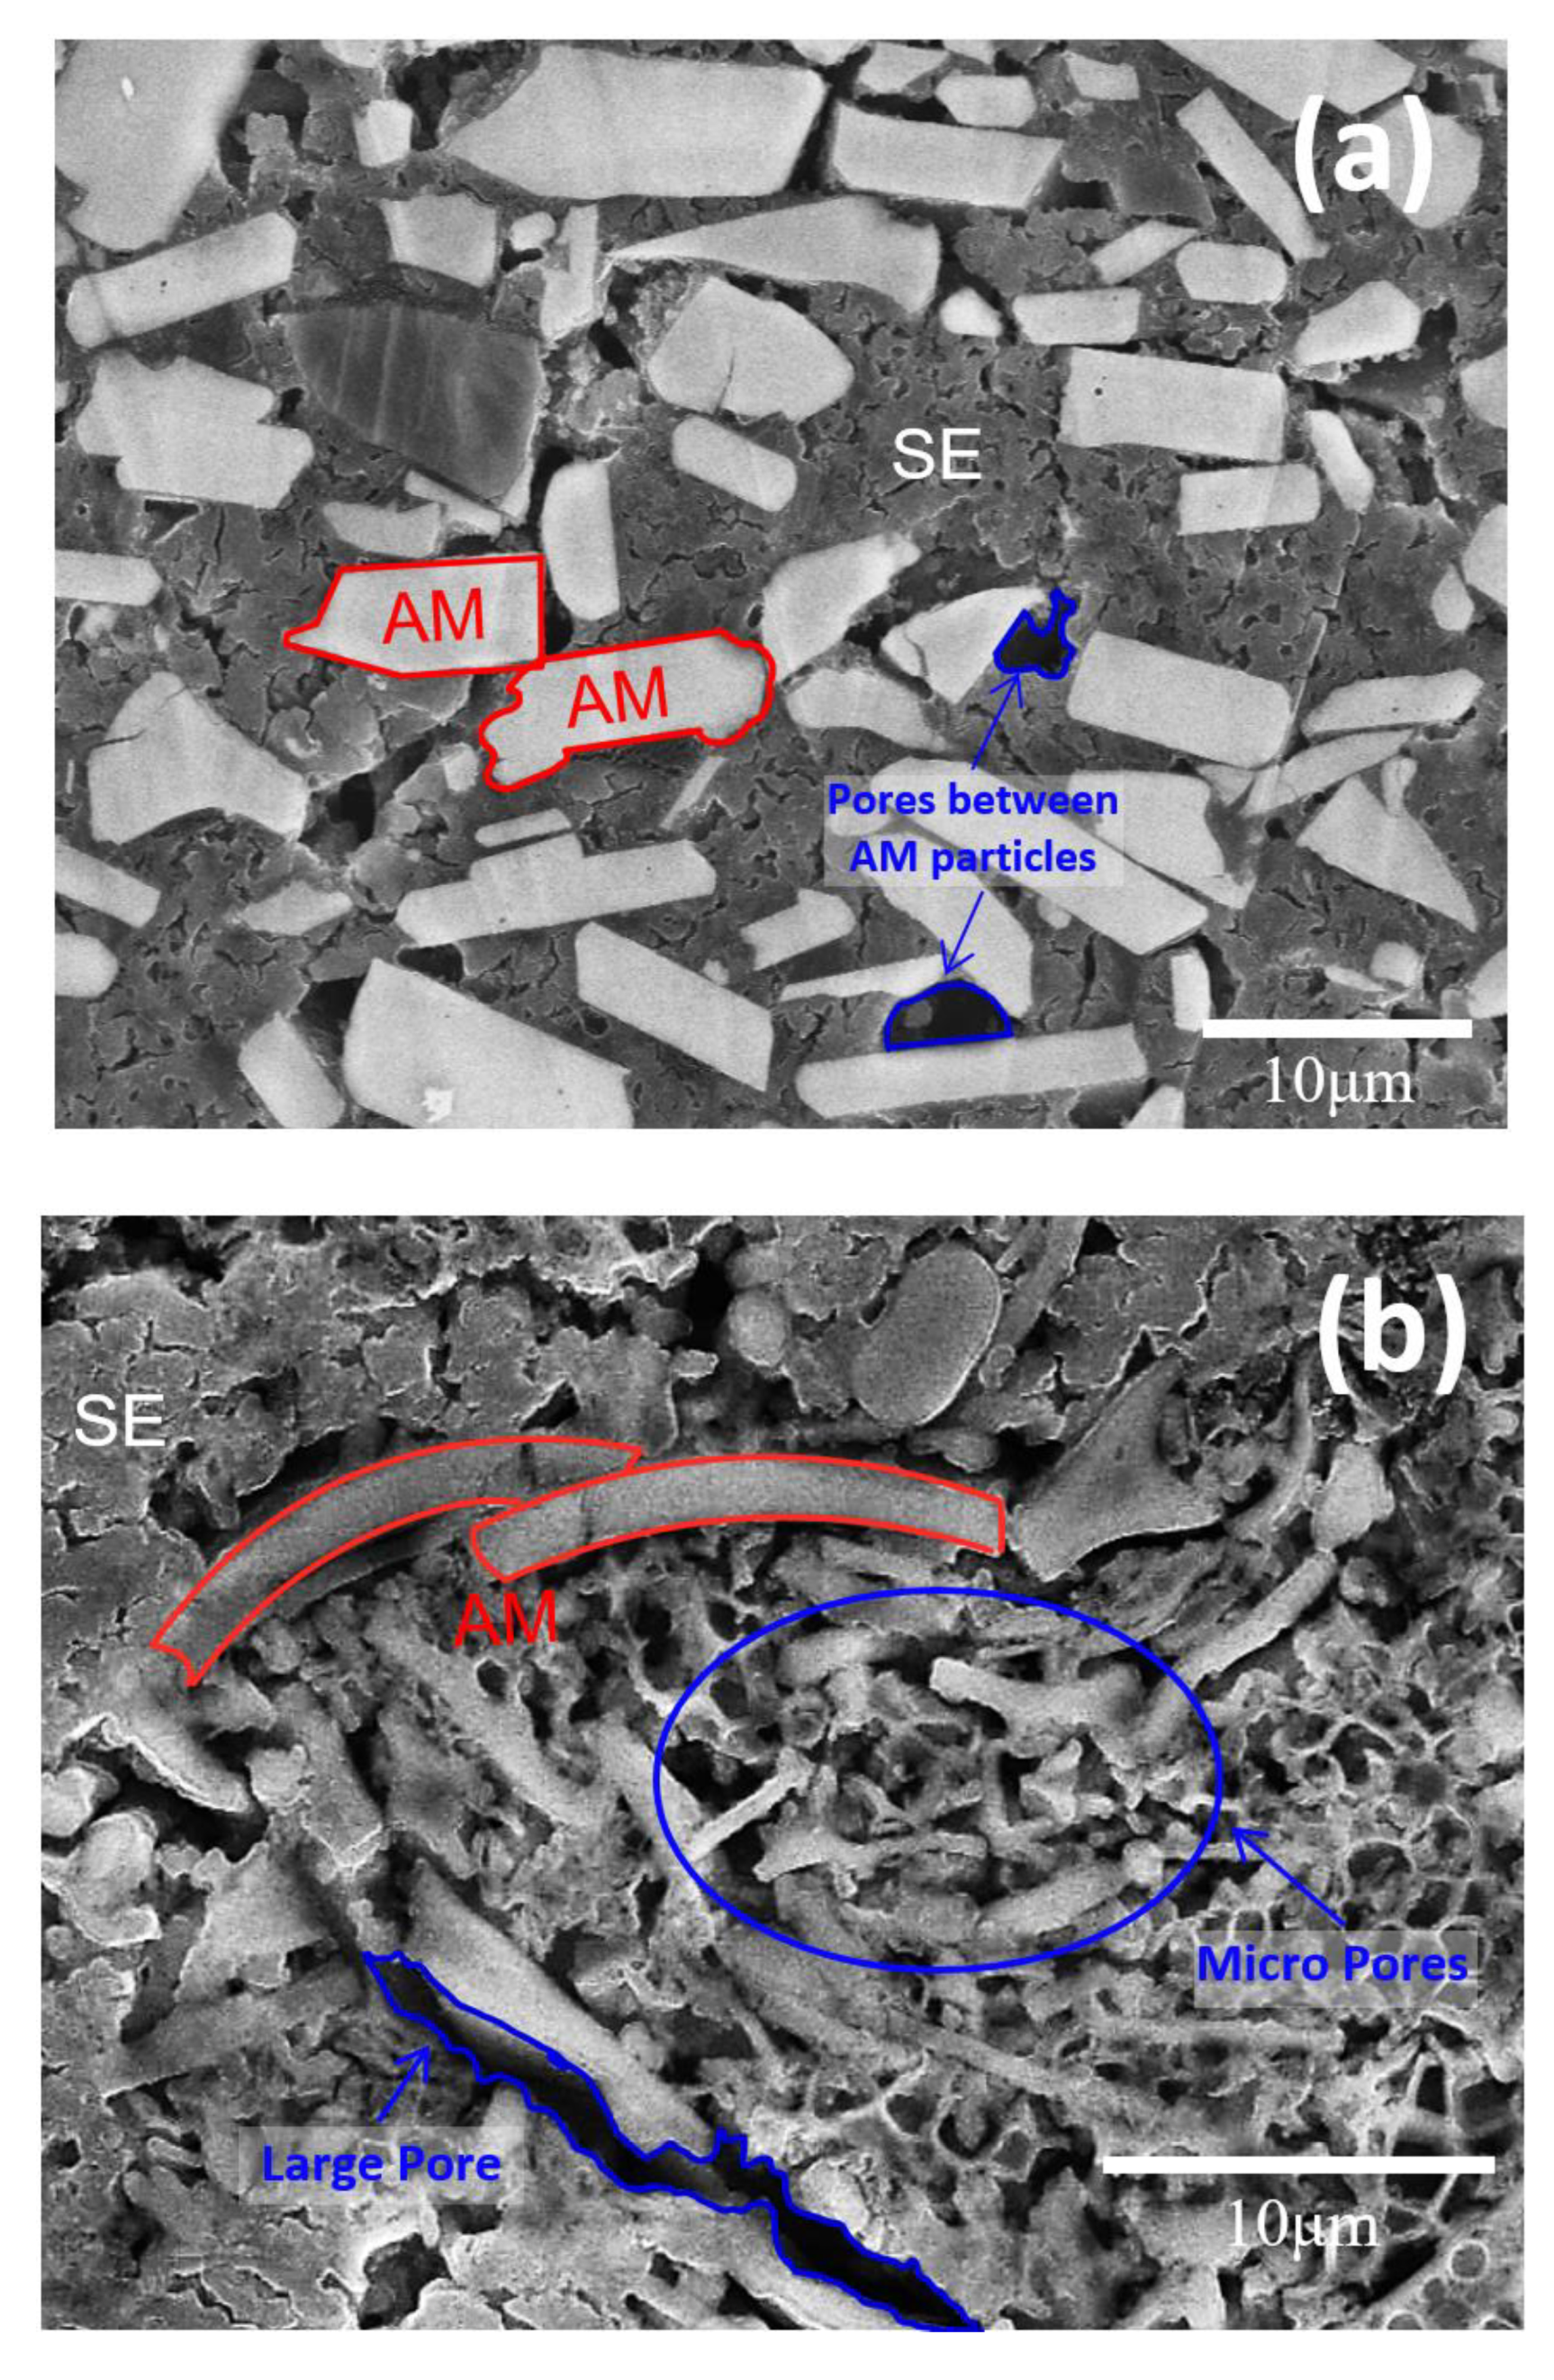
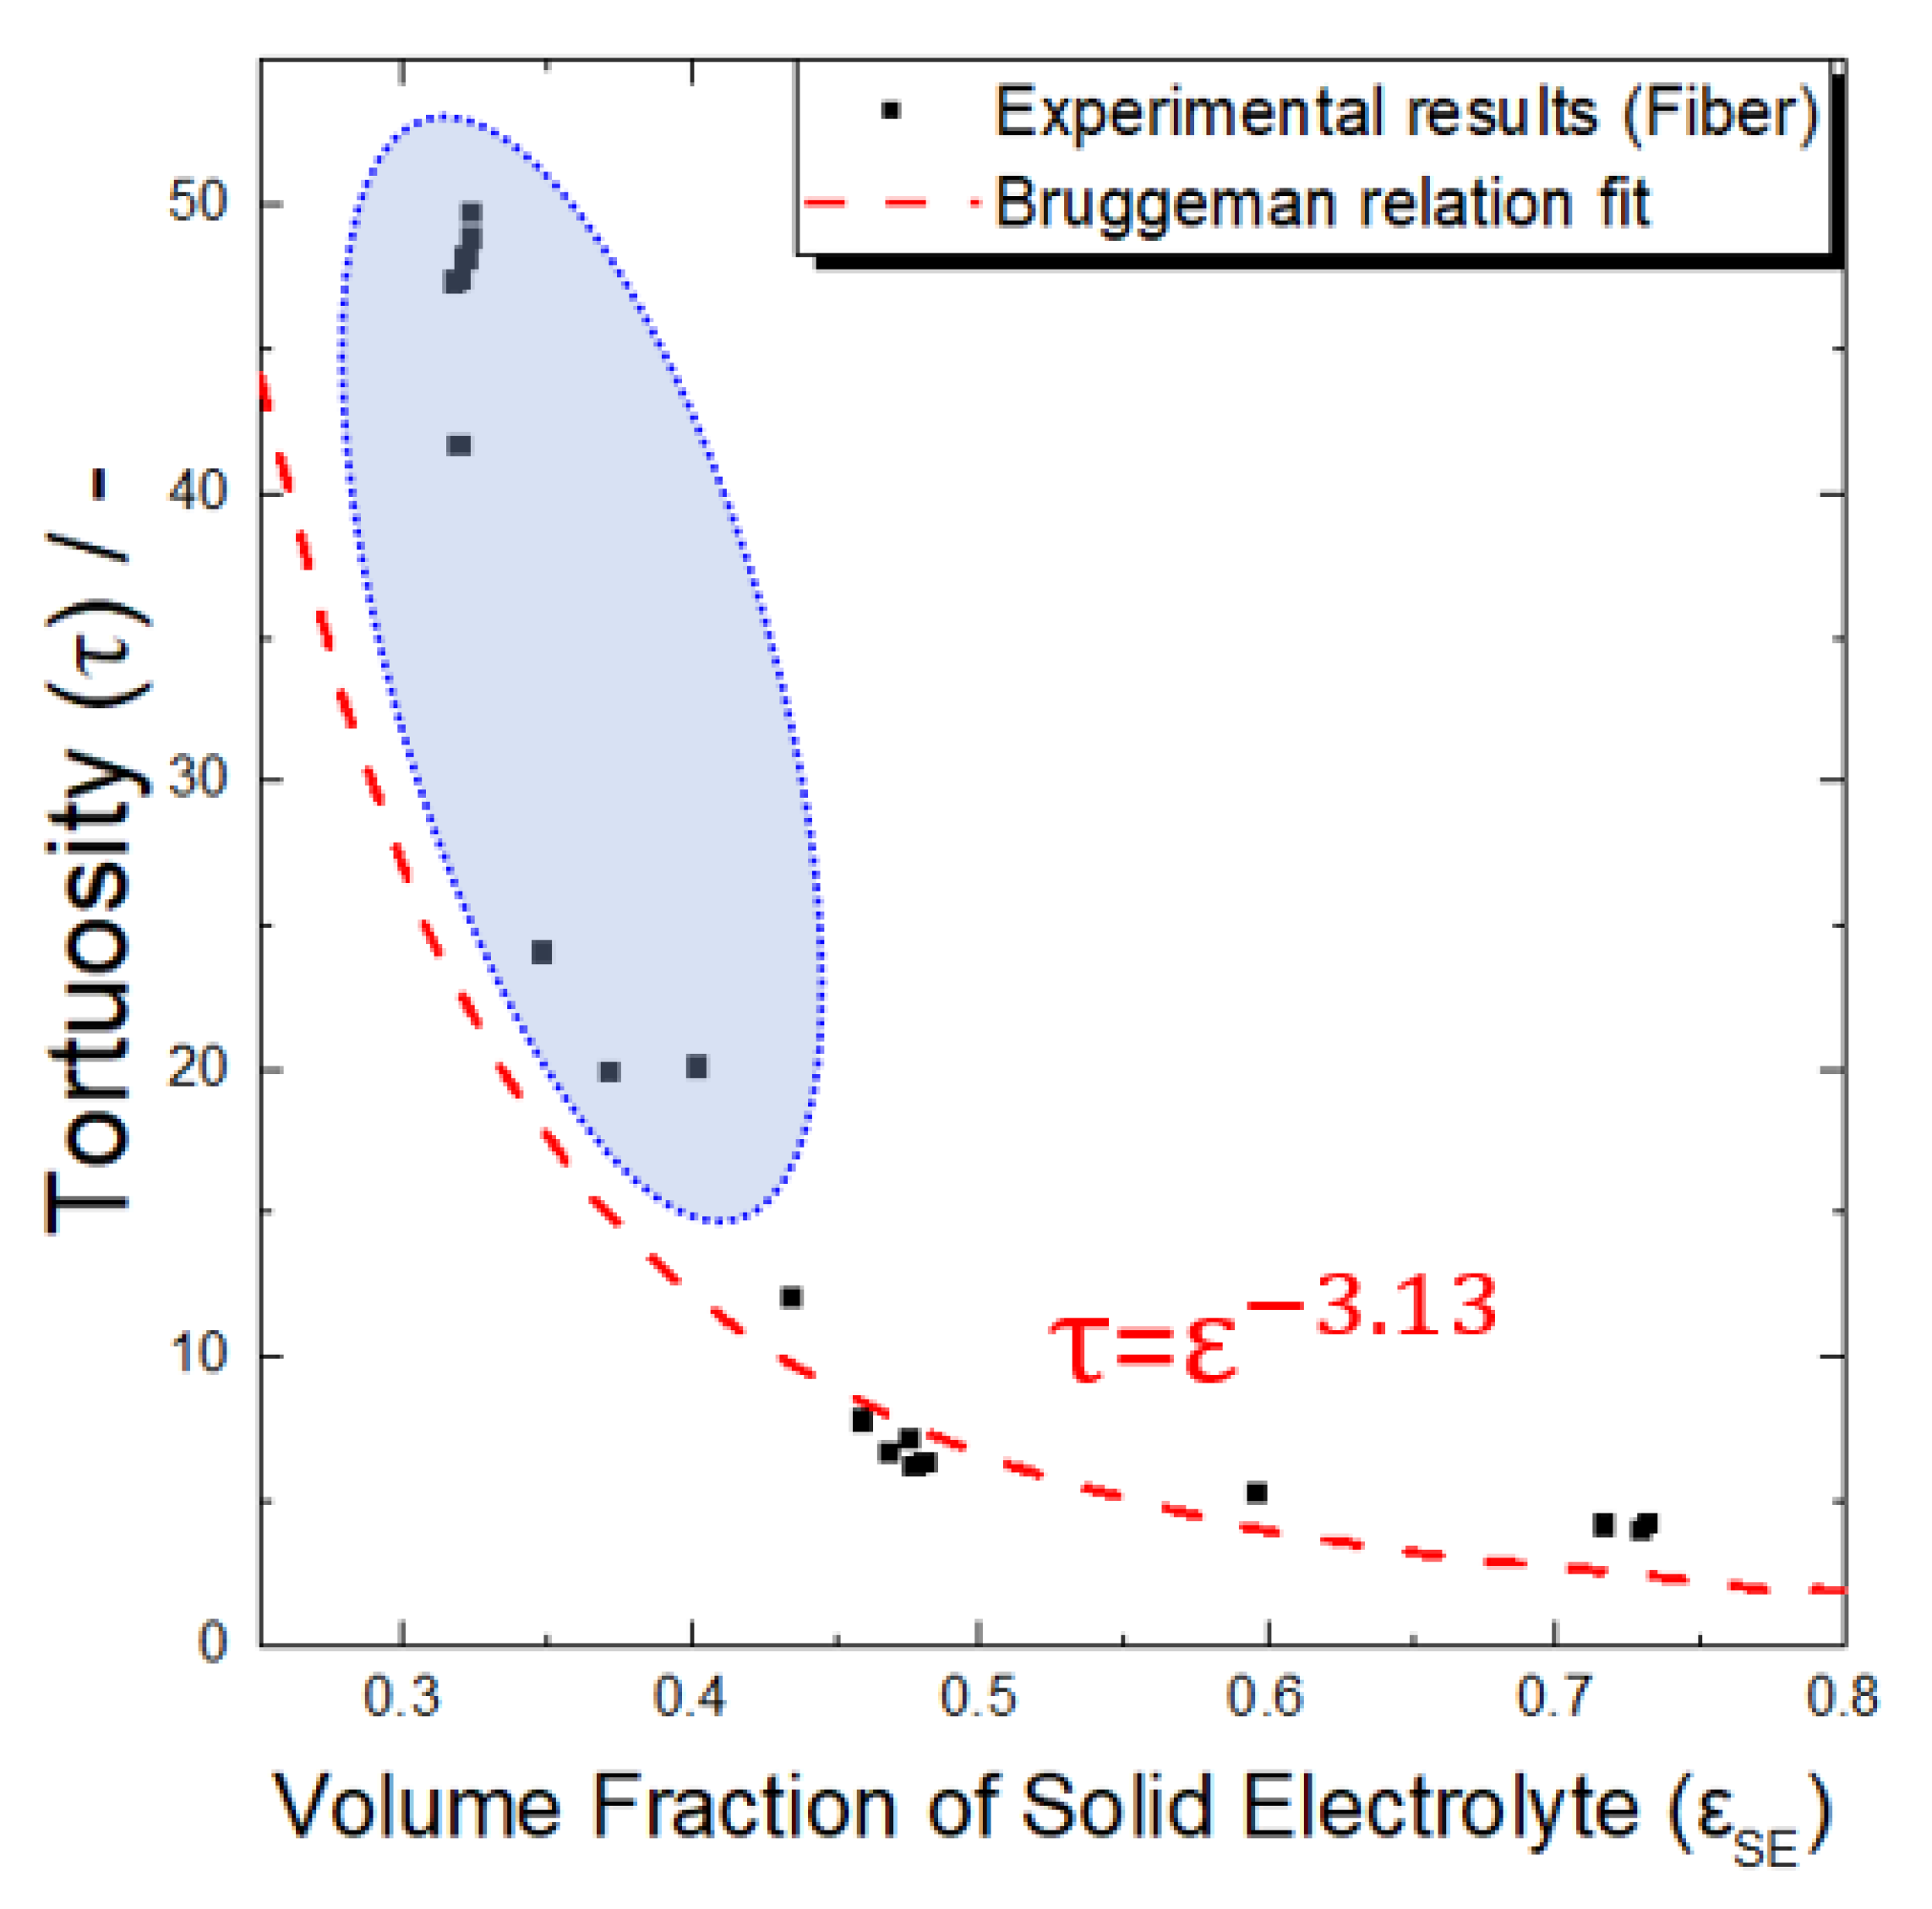
  • In the electrodes with a high active material ratio, the tortuosity values increased in the order of spherical, plate-shaped, and fibrous active materials. Because the porosity values of the electrodes using the spherical and plate-shaped active materials were almost the same, the difference in tortuosity between the two shapes was due to the difference in the complexity of the solid electrolyte path resulting from a simple shape difference. The porosity of the electrode using the active fibrous material was approximately twice that of the others because the solid electrolyte did not sufficiently fill in the micropores formed by the aggregation of the material particles. In an all-solid-state battery electrode, when a high proportion of active fibrous material is used, special attention should be paid to the low filling factor of the solid electrolyte resulting from particle aggregation.
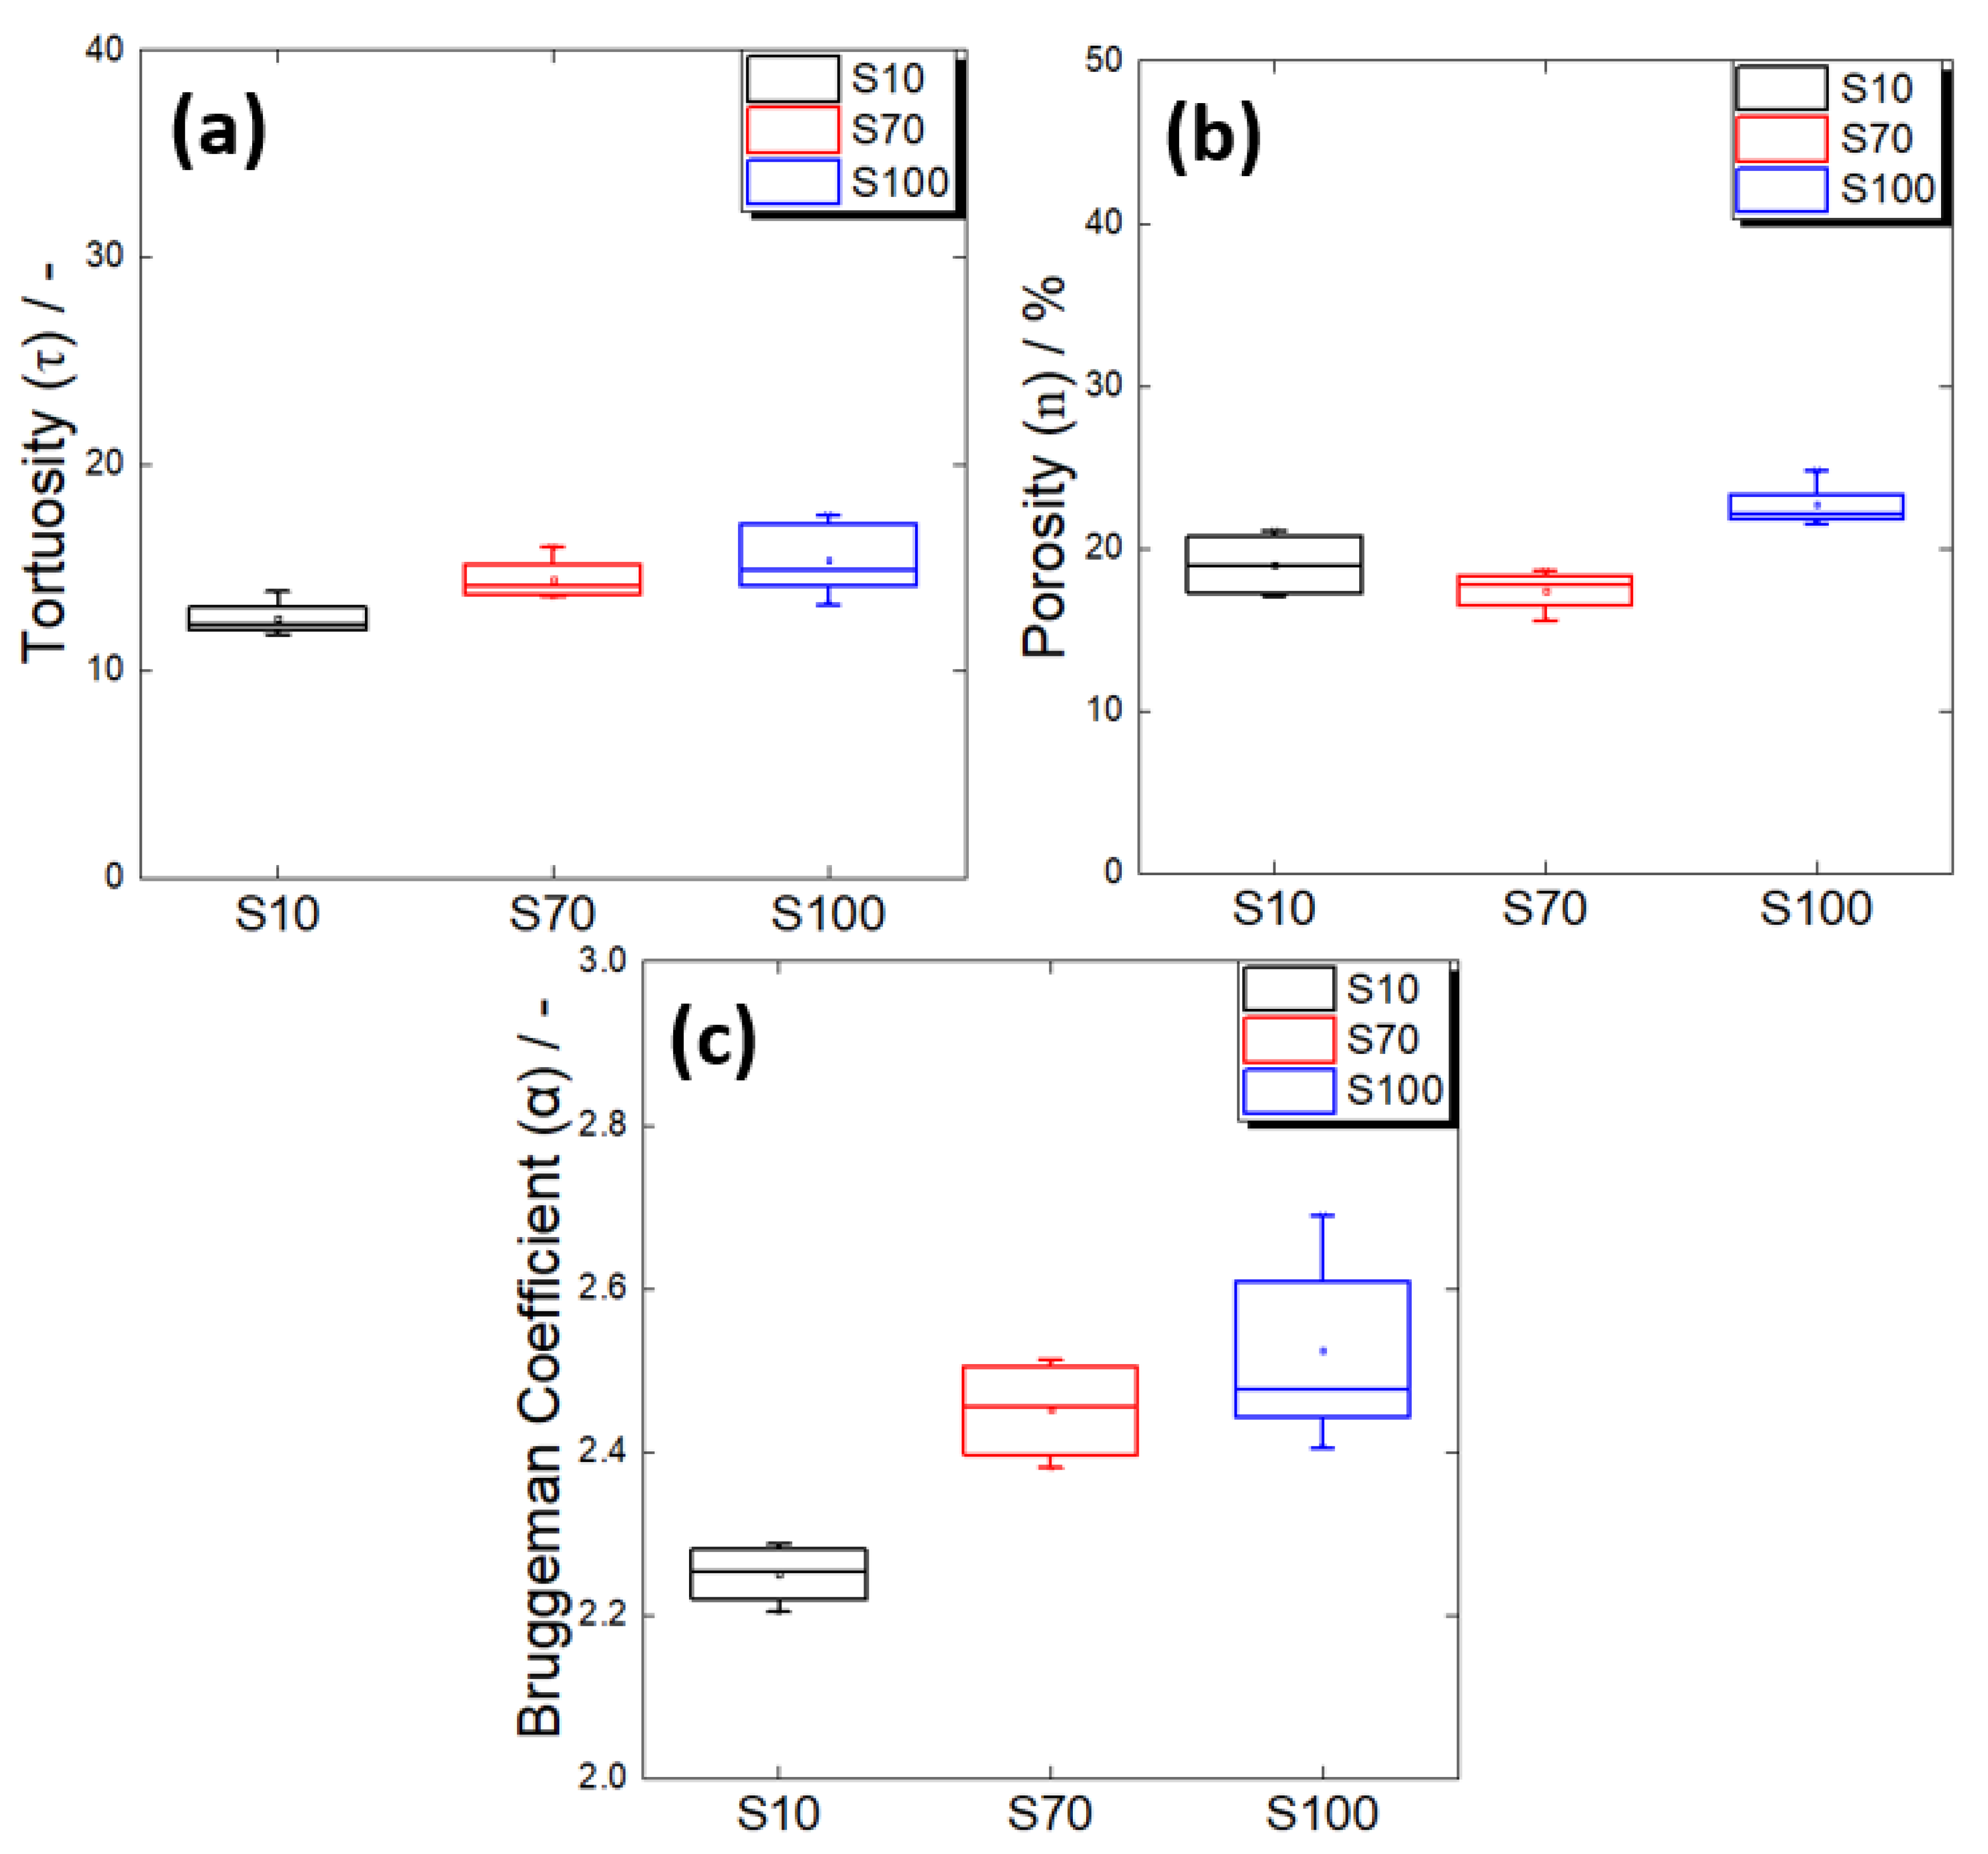
  • As the particle size of the spherical active material increased, the degree of tortuosity also increased. When the particle sizes were 10 μm and 70 μm, the electrode porosity values were similar, suggesting that the 70 μm active material electrode had higher tortuosity due to the poor connectivity of the solid electrolyte in the large particle gaps. The electrode with the 100 μm active material showed a significant increase in porosity, implying that the increase in unfilled pores, along with the low solid electrolyte connectivity in the large particle gaps, additionally contributed to the increase in tortuosity. In other words, even if the particle size of the active material increases and the particle gaps increase under a high active material ratio, the connectivity between electrolyte particles may deteriorate as a result of the limited amount of solid electrolyte.
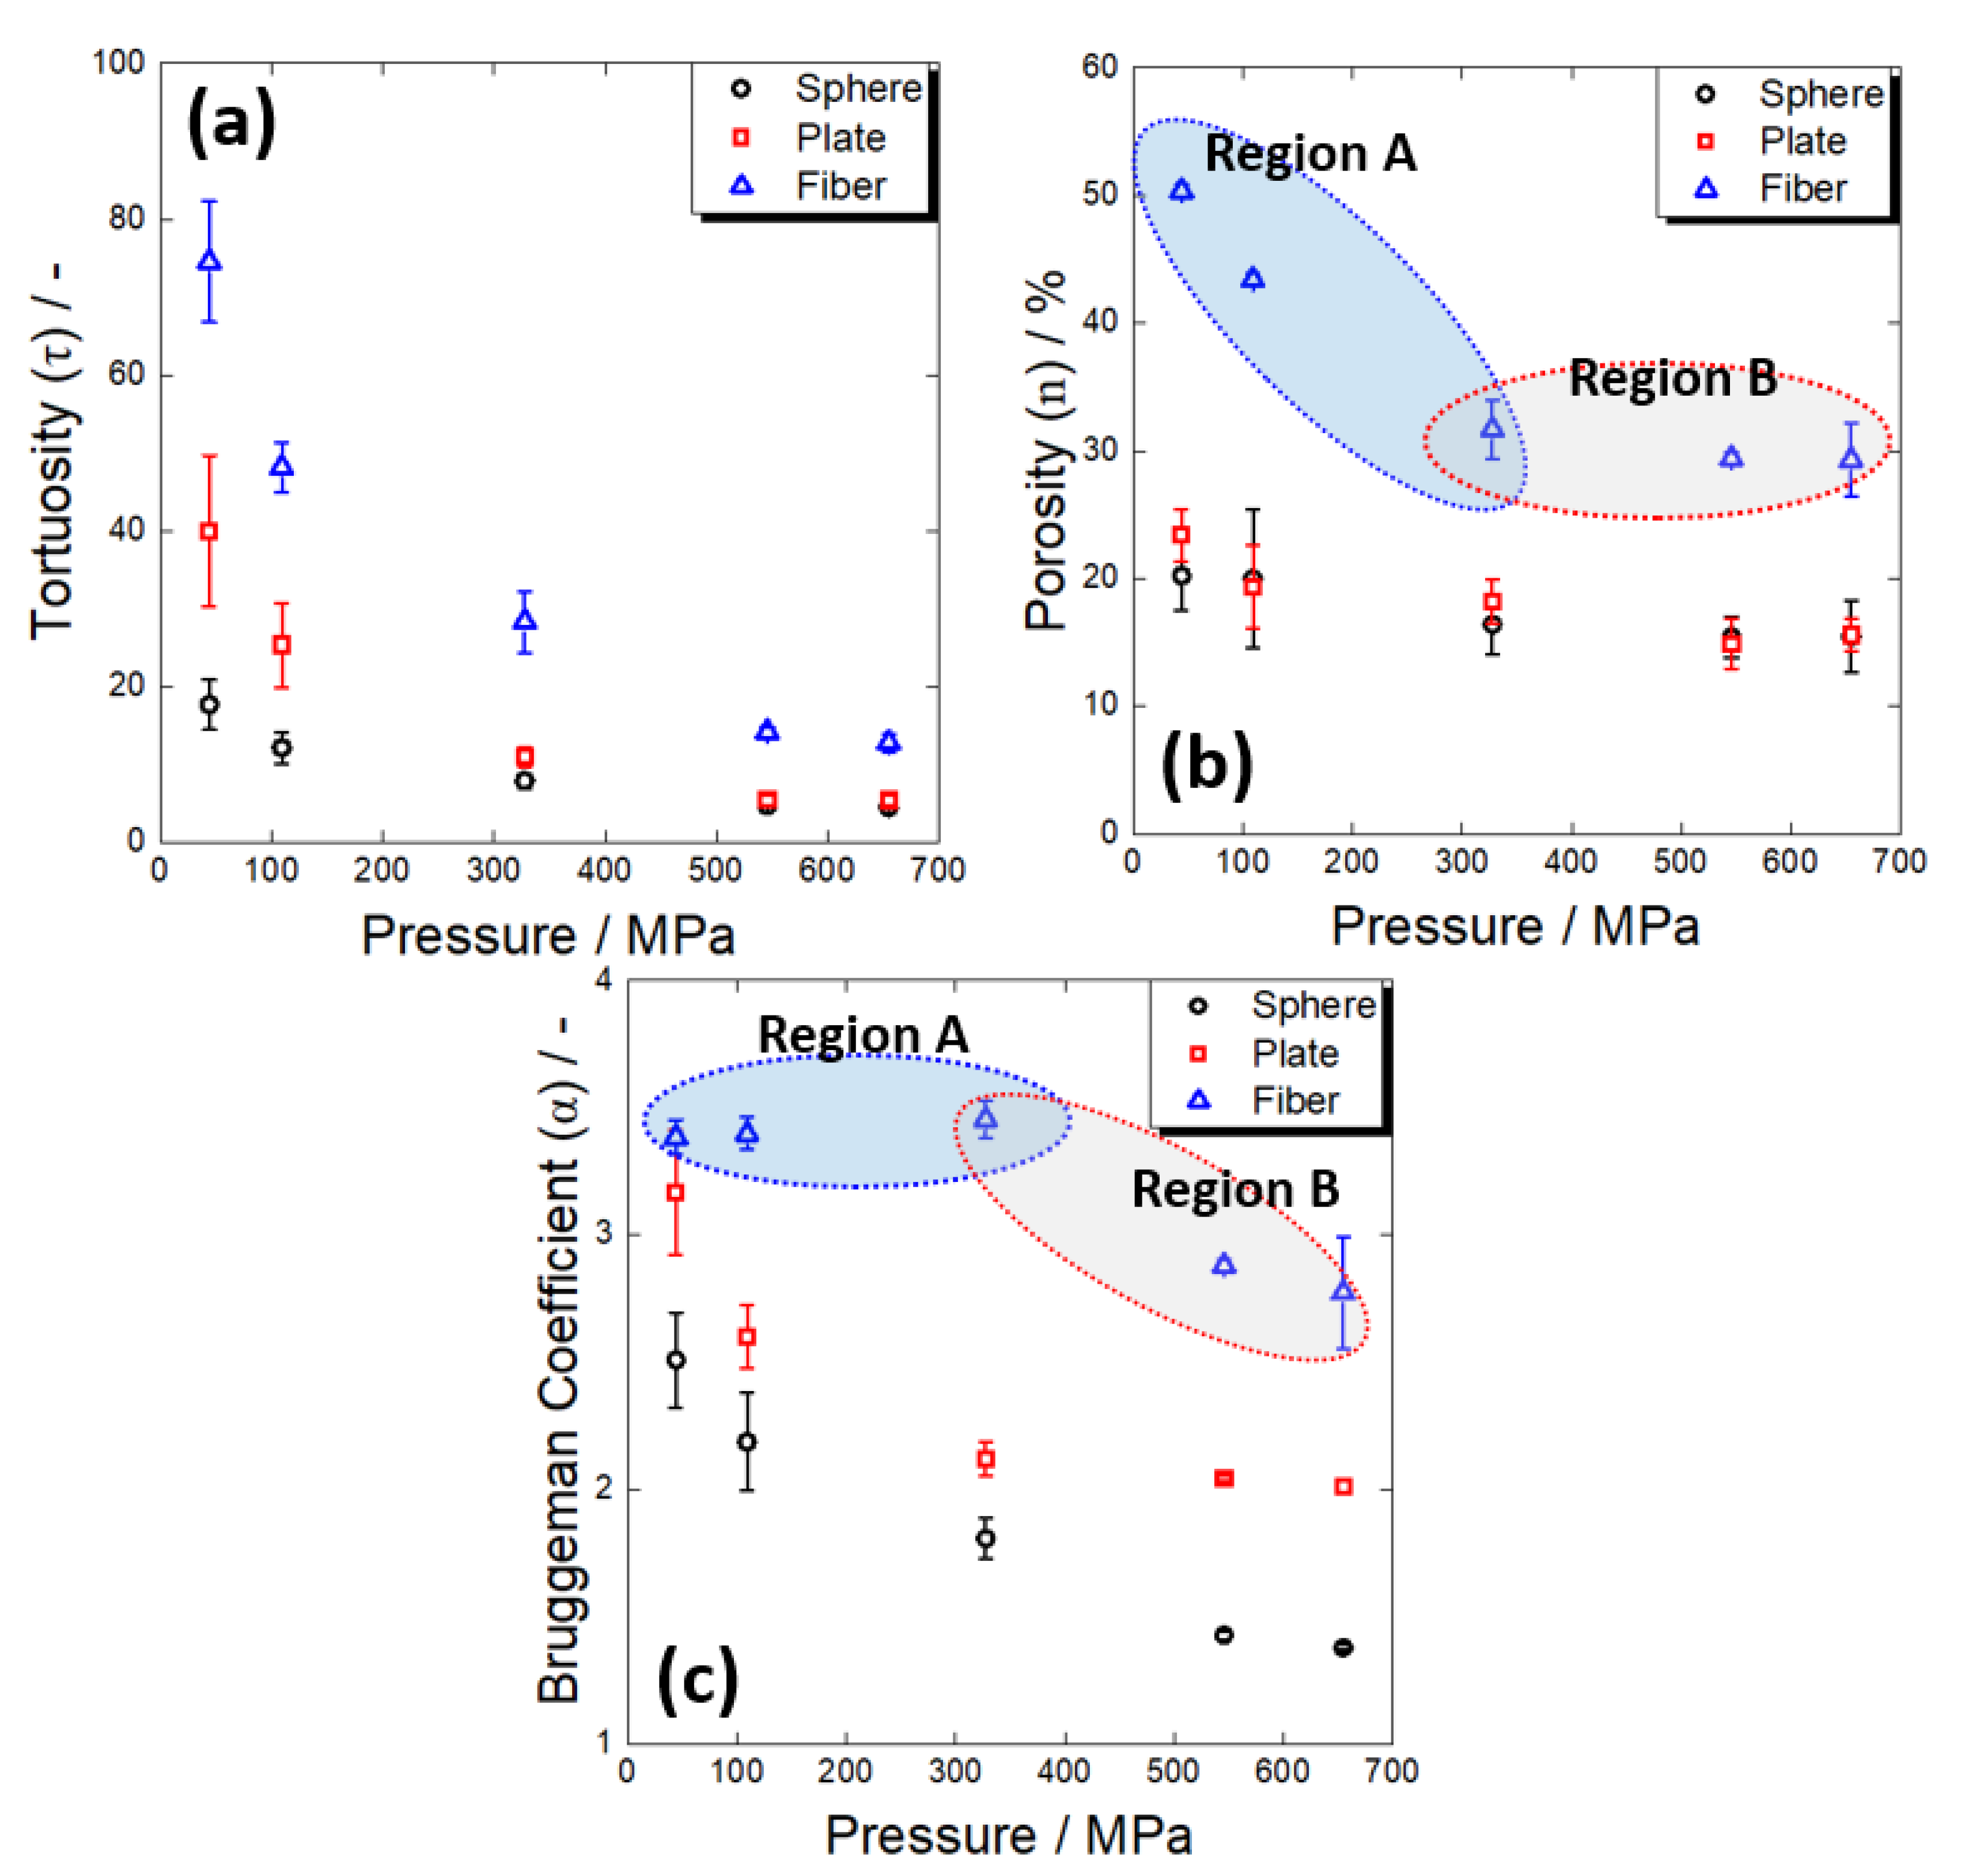
  • Regardless of the material shape, the tortuosity decreased with pressing pressure, and the fibrous material showed a different porosity change pattern to the others. In the electrodes containing the spherical and plate-shaped materials, the porosity change was insignificant as the pressing pressure increased, suggesting that the tortuosity decrease with the pressing pressure was simply due to the improvement in the contact characteristics between the electrolyte particles. In the case of the fibrous material, the porosity considerably changed in the low-pressure region, but there was little change in the high-pressure region. It was conjectured that the electrolyte penetrated the fibrous aggregate and filled the micropores at low pressure, while the tortuosity further decreased at high pressure as the contact characteristics between the electrolyte particles were improved.

Author Contributions

Data curation, S.-Y.P. and J.J.; Formal analysis, S.-Y.P.; Funding acquisition, H.-C.S.; Investigation, S.-Y.P. and J.J.; Methodology, S.-Y.P.; Supervision, H.-C.S.; Validation, S.-Y.P., J.J. and H.-C.S.; Writing—original draft, S.-Y.P.; Writing—review and editing, H.-C.S. All authors have read and agreed to the published version of the manuscript.

Funding

This work was supported by the National Research Foundation (NRF-2018R1A5A1025594) of the Ministry of Science and ICT and “the Competency Development Program for Industry Specialists” of Korean Ministry of Trade, Industry, and Energy (MOTIE), operated by the Korea Institute for Advancement of Technology (KIAT) (Grant No. P0002019, HRD Program for High Value-Added Metallic Material Expert), and was supported by the Materials Technology Institute at Pusan National University.

Institutional Review Board Statement

Not applicable.

Informed Consent Statement

Not applicable.

Data Availability Statement

The data that support the findings of this study are available on request from the corresponding author.

Conflicts of Interest

The authors declare no conflict of interest.

References

  1. Yada, C.; Brasse, C. Better batteries with Solid-state instead of liquid-based electrolytes. ATZelektronik Worldw. 2014, 9, 10–15. [Google Scholar] [CrossRef]
  2. Kato, Y.; Hori, S.; Saito, T.; Suzuki, K.; Hirayama, M.; Mitsui, A.; Yonemura, M.; Iba, H.; Kanno, R. High-power all-solid-state batteries using sulfide superionic conductors. Nat. Energy 2016, 1, 16030. [Google Scholar] [CrossRef]
  3. Li, C.; Wang, Z.-Y.; He, Z.-J.; Li, Y.-J.; Mao, J.; Dai, K.-H.; Yan, C.; Zheng, J.-C. An advance review of solid-state battery: Challenges, progress and prospects. Sustain. Mater. Technol. 2021, 29, e00297. [Google Scholar] [CrossRef]
  4. Dawson, J.A.; Canepa, P.; Famprikis, T.; Masquelier, C.; Islam, M.S. Atomic-scale influence of grain boundaries on Li-ion conduction in solid electrolytes for all-solid-state batteries. J. Am. Chem. Soc. 2018, 140, 362–368. [Google Scholar] [CrossRef] [PubMed]
  5. Chen, R.-J.; Zhang, Y.-B.; Liu, T.; Xu, B.-Q.; Lin, Y.-H.; Nan, C.-W.; Shen, Y. Addressing the interface issues in all-solid-state bulk-type lithium ion battery via an all-composite approach. ACS Appl. Mater. Interfaces 2017, 9, 9654–9661. [Google Scholar] [CrossRef]
  6. Pervez, S.A.; Cambaz, M.A.; Thangadurai, V.; Fichtner, M. Interface in solid-state lithium battery: Challenges, progress, and outlook. ACS Appl. Mater. Interfaces 2019, 11, 22029–22050. [Google Scholar] [CrossRef]
  7. Ding, Z.; Li, J.; Li, J.; An, C. Interfaces: Key issue to be solved for all solid-state lithium battery technologies. J. Electrochem. Soc. 2020, 167, 070541. [Google Scholar] [CrossRef]
  8. Deng, C.; Chen, N.; Hou, C.; Liu, H.; Zhou, Z.; Chen, R. Enhancing Interfacial Contact in Solid-State Batteries with a Gradient Composite Solid Electrolyte. Small 2021, 17, 2006578. [Google Scholar] [CrossRef]
  9. Wang, S.; Fang, R.; Li, Y.; Liu, Y.; Xin, C.; Richter, F.H.; Nan, C.-W. Interfacial challenges for all-solid-state batteries based on sulfide solid electrolytes. J. Mater. 2021, 7, 209–218. [Google Scholar] [CrossRef]
  10. Yu, C.; Zhao, F.; Luo, J.; Zhang, L.; Sun, X. Recent development of lithium argyrodite solid-state electrolytes for solid-state batteries: Synthesis, structure, stability and dynamics. Nano Energy 2021, 83, 105858. [Google Scholar] [CrossRef]
  11. Wu, J.-F.; Pang, W.K.; Peterson, V.K.; Wei, L.; Guo, X. Garnet-type fast Li-ion conductors with high ionic conductivities for all-solid-state batteries. ACS Appl. Mater. Interfaces 2017, 9, 12461–12468. [Google Scholar] [CrossRef] [PubMed] [Green Version]
  12. Chen, H.; Adekoya, D.; Hencz, L.; Ma, J.; Chen, S.; Yan, C.; Zhao, H.; Cui, G.; Zhang, S. Stable seamless interfaces and rapid ionic conductivity of Ca–CeO2/LiTFSI/PEO composite electrolyte for high-rate and high-voltage all-solid-state battery. Adv. Energy Mater. 2020, 10, 2000049. [Google Scholar] [CrossRef]
  13. Luo, S.; Wang, Z.; Fan, A.; Liu, X.; Wang, H.; Ma, W.; Zhu, L.; Zhang, X. A high energy and power all-solid-state lithium battery enabled by modified sulfide electrolyte film. J. Power Sources 2021, 485, 229325. [Google Scholar] [CrossRef]
  14. Newman, J. Optimization of porosity and thickness of a battery electrode by means of a reaction-zone model. J. Electrochem. Soc. 1995, 142, 97. [Google Scholar] [CrossRef]
  15. Patel, K.K.; Paulsen, J.M.; Desilvestro, J. Numerical simulation of porous networks in relation to battery electrodes and separators. J. Power Sources 2003, 122, 144–152. [Google Scholar] [CrossRef]
  16. Kehrwald, D.; Shearing, P.R.; Brandon, N.P.; Sinha, P.K.; Harris, S.J. Local tortuosity inhomogeneities in a lithium battery composite electrode. J. Electrochem. Soc. 2011, 158, A1393. [Google Scholar] [CrossRef]
  17. Bae, C.-J.; Erdonmez, C.K.; Halloran, J.W.; Chiang, Y.-M. Design of battery electrodes with dual-scale porosity to minimize tortuosity and maximize performance. Adv. Mater. 2013, 25, 1254–1258. [Google Scholar] [CrossRef]
  18. Bielefeld, A.; Weber, D.A.; Janek, J. Modeling effective ionic conductivity and binder influence in composite cathodes for all-solid-state batteries. ACS Appl. Mater. Interfaces 2020, 12, 12821–12833. [Google Scholar] [CrossRef]
  19. Wu, J.; Ju, Z.; Zhang, X.; Xu, X.; Takeuchi, K.J.; Marschilok, A.C.; Takeuchi, E.S.; Yu, G. Low-Tortuosity Thick Electrodes with Active Materials Gradient Design for Enhanced Energy Storage. ACS Nano 2022, 16, 4805–4812. [Google Scholar] [CrossRef]
  20. Ebner, M.; Chung, D.-W.; García, R.E.; Wood, V. Tortuosity anisotropy in lithium-ion battery electrodes. Adv. Energy Mater. 2014, 4, 1301278. [Google Scholar] [CrossRef]
  21. Usseglio-Viretta, F.L.E.; Finegan, D.P.; Colclasure, A.M.; Heenan, T.M.M.; Abraham, D.P.; Shearing, P.R.; Smith, K. Quantitative relationships between pore tortuosity, pore topology, and solid particle morphology using a novel discrete particle size algorithm. J. Electrochem. Soc. 2020, 167, 100513. [Google Scholar] [CrossRef]
  22. So, M.; Inoue, G.; Hirate, R.; Nunoshita, K.; Ishikawa, S.; Tsuge, Y. Effect of mold pressure on compaction and ion conductivity of all-solid-state batteries revealed by the discrete element method. J. Power Sources 2021, 508, 230344. [Google Scholar] [CrossRef]
  23. Hlushkou, D.; Reising, A.E.; Kaiser, N.; Spannenberger, S.; Schlabach, S.; Kato, Y.; Roling, B.; Tallarek, U. The influence of void space on ion transport in a composite cathode for all-solid-state batteries. J. Power Sources 2018, 396, 363–370. [Google Scholar] [CrossRef]
  24. Vijayaraghavan, B.; Ely, D.R.; Chiang, Y.-M.; García-García, R.; Garcia, R.E. An analytical method to determine tortuosity in rechargeable battery electrodes. J. Electrochem. Soc. 2012, 159, A548. [Google Scholar] [CrossRef]
  25. Nguyen, T.-T.; Demortière, A.; Fleutot, B.; Delobel, B.; Delacourt, C.; Cooper, S.J. The electrode tortuosity factor: Why the conventional tortuosity factor is not well suited for quantifying transport in porous Li-ion battery electrodes and what to use instead. NPJ Comput. Mater. 2020, 6, 123. [Google Scholar] [CrossRef]
  26. Du, W.; Xue, N.; Shyy, W.; Martins, J.R.R.A. A surrogate-based multi-scale model for mass transport and electrochemical kinetics in lithium-ion battery electrodes. J. Electrochem. Soc. 2014, 161, E3086. [Google Scholar] [CrossRef]
  27. Thorat, I.V.; Stephenson, D.E.; Zacharias, N.A.; Zaghib, K.; Harb, J.N.; Wheeler, D.R. Quantifying tortuosity in porous Li-ion battery materials. J. Power Sources 2009, 188, 592–600. [Google Scholar] [CrossRef]
  28. Cericola, D.; Spahr, M.E. Impedance spectroscopic studies of the porous structure of electrodes containing graphite materials with different particle size and shape. Electrochim. Acta 2016, 191, 558–566. [Google Scholar] [CrossRef]
  29. Malifarge, S.; Delobel, B.; Delacourt, C. Determination of tortuosity using impedance spectra analysis of symmetric cell. J. Electrochem. Soc. 2017, 164, E3329. [Google Scholar] [CrossRef]
  30. Landesfeind, J.; Hattendorff, J.; Ehrl, A.; Wall, W.A.; Gasteiger, H.A. Tortuosity determination of battery electrodes and separators by impedance spectroscopy. J. Electrochem. Soc. 2016, 163, A1373. [Google Scholar] [CrossRef]
  31. Hwang, J.-H.; Kirkpatrick, K.; Mason, T.; Garboczi, E. Experimental limitations in impedance spectroscopy:: Part IV. Electrode contact effects. Solid State Ionics 1997, 98, 93–104. [Google Scholar] [CrossRef]
  32. Nara, H.; Mukoyama, D.; Shimizu, R.; Momma, T.; Osaka, T. Systematic analysis of interfacial resistance between the cathode layer and the current collector in lithium-ion batteries by electrochemical impedance spectroscopy. J. Power Sources 2019, 409, 139–147. [Google Scholar] [CrossRef]
  33. Dhillon, S.; Kant, R. Theory for electrochemical impedance spectroscopy of heterogeneous electrode with distributed capacitance and charge transfer resistance. J. Chem. Sci. 2017, 129, 1277–1292. [Google Scholar] [CrossRef] [Green Version]
  34. Zhang, S.; Xu, K.; Jow, T. EIS study on the formation of solid electrolyte interface in Li-ion battery. Electrochim. Acta 2006, 51, 1636–1640. [Google Scholar] [CrossRef]
  35. Battistel, A.; Fan, M.; Stojadinović, J.; La Mantia, F. Analysis and mitigation of the artefacts in electrochemical impedance spectroscopy due to three-electrode geometry. Electrochim. Acta 2014, 135, 133–138. [Google Scholar] [CrossRef]
  36. Froboese, L.; Van Der Sichel, J.F.; Loellhoeffel, T.; Helmers, L.; Kwade, A. Effect of microstructure on the ionic conductivity of an all solid-state battery electrode. J. Electrochem. Soc. 2019, 166, A318. [Google Scholar] [CrossRef]
  37. Indrikova, M.; Grunwald, S.; Golks, F.; Netz, A.; Westphal, B.; Kwade, A. The morphology of battery electrodes with the focus of the conductive additives paths. J. Electrochem. Soc. 2015, 162, A2021. [Google Scholar] [CrossRef]
  38. Clennell, M.B. Tortuosity: A guide through the maze. Geol. Soc. Lond. Spec. Publ. 1997, 122, 299–344. [Google Scholar] [CrossRef]
  39. Kaiser, N.; Spannenberger, S.; Schmitt, M.; Cronau, M.; Kato, Y.; Roling, B. Ion transport limitations in all-solid-state lithium battery electrodes containing a sulfide-based electrolyte. J. Power Sources 2018, 396, 175–181. [Google Scholar] [CrossRef]
  40. Bruggeman, D.A.G. Berechnung verschiedener physikalischer Konstanten von heterogenen Substanzen. I. Dielektrizitätskonstanten und Leitfähigkeiten der Mischkörper aus isotropen Substanzen. Ann. Phys. 1935, 416, 636–664. [Google Scholar] [CrossRef]
  41. MacMullin, R.B.; Muccini, G.A. Characteristics of porous beds and structures. AIChE J. 1956, 2, 393–403. [Google Scholar] [CrossRef]
  42. Vadakkepatt, A.; Trembacki, B.; Mathur, S.R.; Murthy, J.Y. Bruggeman’s exponents for effective thermal conductivity of lithium-ion battery electrodes. J. Electrochem. Soc. 2015, 163, A119. [Google Scholar] [CrossRef]
  43. Mai, L.; Tian, X.; Xu, X.; Chang, L.; Xu, L. Nanowire electrodes for electrochemical energy storage devices. Chem. Rev. 2014, 114, 11828–11862. [Google Scholar] [CrossRef] [PubMed]
  44. Pouraghajan, F.; Knight, H.; Wray, M.; Mazzeo, B.; Subbaraman, R.; Christensen, J.; Wheeler, D. Quantifying tortuosity of porous Li-ion battery electrodes: Comparing polarization-interrupt and blocking-electrolyte methods. J. Electrochem. Soc. 2018, 165, A2644. [Google Scholar] [CrossRef]
  45. Tu, S.; Lu, Z.; Zheng, M.; Chen, Z.; Wang, X.; Cai, Z.; Chen, C.; Wang, L.; Li, C.; Seh, Z.W. Single-Layer-Particle Electrode Design for Practical Fast-Charging Lithium-ion Batteries. Adv. Mater. 2022, 34, 2202892. [Google Scholar] [CrossRef]
  46. Doux, J.-M.; Yang, Y.; Tan, D.H.S.; Nguyen, H.; Wu, E.A.; Wang, X.; Banerjee, A.; Meng, Y.S. Pressure effects on sulfide electrolytes for all solid-state batteries. J. Mater. Chem. A 2020, 8, 5049–5055. [Google Scholar] [CrossRef]
  47. Parikh, D.; Christensen, T.; Li, J. Correlating the influence of porosity, tortuosity, and mass loading on the energy density of LiNi0.6Mn0.2Co0.2O2 cathodes under extreme fast charging (XFC) conditions. J. Power Sources 2020, 474, 228601. [Google Scholar] [CrossRef]
  48. So, M.; Inoue, G.; Hirate, R.; Nunoshita, K.; Ishikawa, S.; Tsuge, Y. Simulation of fabrication and degradation of all-solid-state batteries with ductile particles. J. Electrochem. Soc. 2021, 168, 030538. [Google Scholar] [CrossRef]
Figure 1. (a) Schematic diagram of an electron-blocking cell used for tortuosity analysis, and (b) hypothetical chronoamperometric curve showing steady-state current (Iss), together with the equations for tortuosity estimation.
Applsci 12 12692 g001
Figure 2. Scanning electron micrographs of different shapes of aluminum oxide (Al2O3) powder. (a) Sphere, (b) plate, and (c) fiber.
Applsci 12 12692 g002
Figure 3. Chronoamperometric curves at (a) low (εSE,1 = 0.32) and (b) high (εSE,2 = 0.72) volume fractions of solid electrolyte.
Applsci 12 12692 g003
Figure 4. (a,b) Tortuosities and (c,d) porosities of the composite electrodes containing different shapes of Al2O3 powders. (a,b) Low electrolyte volume fraction (εSE,1 = 0.32); (c,d) high electrolyte volume fraction (εSE,2 = 0.72).
Applsci 12 12692 g004
Figure 5. Cross-sectional views of the composite electrodes containing (a) plate-shaped and (b) fibrous particles at low volume fraction of solid electrolyte (εSE,1 = 0.32). AM: active material. SE: solid electrolyte.
Applsci 12 12692 g005
Figure 6. Tortuosities of the composite electrodes containing fibrous Al2O3 as a function of volume fraction of solid electrolyte. The black symbols and red dotted line are the experimental results and fitted curve by Bruggeman equation, respectively. Blue dotted circle represents the experimental tortuosity values at low electrolyte volume fraction (or high Al2O3 volume fraction), showing significant deviation from Bruggeman relation.
Applsci 12 12692 g006
Figure 7. Scanning electron micrographs of spherical Al2O3 powders with different average particle sizes. (a) 10 μm, (b) 70 μm, and (c) 100 μm. (d) Particle size analysis data.
Applsci 12 12692 g007
Figure 8. (a) Tortuosities, (b) porosities, and (c) Bruggeman coefficients of the composite electrodes containing spherical Al2O3 powders with different average particle sizes of 10 μm (S10), 70 μm (S70), and 100 μm (S100).
Applsci 12 12692 g008
Figure 9. Variations in (a) tortuosity, (b) porosity, and (c) Bruggeman coefficient of the composite electrodes containing different shapes of Al2O3 powders with pressing pressure. The regions A and B in the figures represent variations for fibrous Al2O3 contacting electrode at low- and high-pressure regions, respectively.
Applsci 12 12692 g009
Publisher’s Note: MDPI stays neutral with regard to jurisdictional claims in published maps and institutional affiliations.

