Article

An Unsupervised Learning Approach for Analyzing Unsafe Pilot Operations Based on Flight Data

1
Guanghan Branch, Civil Aviation Flight University of China, Guanghan 618307, China
2
School of Flight Technology, Civil Aviation Flight University of China, Guanghan 618307, China
3
College of Computer Science, Chongqing University, Chongqing 400044, China
4
Key Laboratory of Dependable Service Computing in Cyber Physical Society, Ministry of Education, Chongqing University, Chongqing 400044, China
*
Author to whom correspondence should be addressed.
Appl. Sci. 2022, 12(24), 12789; https://doi.org/10.3390/app122412789
Submission received: 22 November 2022 / Revised: 11 December 2022 / Accepted: 11 December 2022 / Published: 13 December 2022
(This article belongs to the Section Transportation and Future Mobility)

Abstract

:
Flight safety is a hot topic in the aviation industry. Statistics show that safety incidents during landing are closely related to the flare phase because this critical period requires extensive pilot operations. Many airlines require that pilots should avoid performing any forward stick inputs during the flare. However, our statistical results from about 86,504 flights show that this unsafe pilot operation occasionally happens. Although several case studies were conducted previously, systematic research, especially based on a large volume of flight data, is still missing. This paper aims to fill this gap and provide more insights into the issue of pilots’ unsafe stick operations during the flare phase. Specifically, our work is based on the Quick Access Recorder (QAR) data, which consist of multivariate time-series data from various flight parameters. The raw data were carefully preprocessed, then key features were extracted based on flight expert experience, and a K-means clustering algorithm was utilized to divide the unsafe pilot operations into four categories. Based on the clustering results, we conducted an in-depth analysis to uncover the reasons for different types of unsafe pilot stick operations. In addition, extensive experiments were conducted to further investigate how these unsafe operations are correlated with different factors, including airlines, airports, and pilots. To the best of our knowledge, this is the first systematic study analyzing pilots’ unsafe forward stick operations based on a large volume of flight data. The findings can be used by airlines to design more targeted pilot training programs in the future.

1. Introduction

Flight safety is one of the most important topics in the aviation industry [1]. According to the 2020 EASA (European Union Aviation Safety Agency) annual safety review (EASA Annual Safety Review: 2020, https://www.easa.europa.eu/document-library/general-publications/annual-safety-review-2020, accessed on 22 November 2022), the final approach and landing phases are the most prone to flight safety accidents. As shown in Figure 1, during 2009–2018 and 2019, the total accidents and serious incidents rate accounted for 68 and 74%, respectively, in the approach and landing phases, even though these two phases only occupy 4% of the entire flight time. During these two phases, extensive pilot operations are required to make sure the aircraft is landing steadily, and any pilot misjudgment or inappropriate operation may lead to adverse consequences, such as flight safety incidents or accidents, especially when the weather condition is not ideal [2], or the aircraft is landing at high altitude airports [3].
In general, although the overall occurrence of serious flight safety accidents in the aviation industry is very rare, the possibility of adverse events (e.g., flight exceedances) that may affect flight safety and further lead to severe accidents cannot be ignored. For example, it is not uncommon for the vertical acceleration to be too large at the touchdown moment, which is called the hard landing incident [4,5], and this incident may cause severe damage to the landing gears. Excessive vertical overload not only gives passengers a bad flight experience but also largely increases the airlines’ maintenance costs. Severe incidents may even threaten the lives of passengers. According to [6], the most important reason for the increase in the vertical overload is due to the pilot’s inappropriate applying of forward stick inputs which makes the aircraft nose down before it touches the ground. This operation usually reduces the pitch angle of the aircraft, which will further reduce the lift force the aircraft can gain. If this happens in the flare phase [7], i.e., the few seconds before touchdown, then with a high probability the aircraft will touch ground with an excessive vertical overload, which causes the hard landing safety incident [8,9]. Therefore, we define the event in which a pilot performs this forward stick operation as an adverse event. Actually, from the Airbus A320 Flight Crew Techniques Manual (FCTM), a pilot should avoid applying any nose down inputs during the flare phase to avoid the hard landing or bounced landing risk. However, our statistical results from about 86,504 flights show that this unsafe pilot operation occasionally happens. In view of the above phenomenon and given that all the pilots have undergone professional training, why would they perform such unsafe stick operations in the flare phase? Although the Airbus company conducted two case studies on this topic (A Focus on the Landing Flare, https://safetyfirst.airbus.com/a-focus-on-the-landing-flare/, accessed on 22 November 2022), systematic research, especially based on a large volume of flight data, so as to give more insights and a comprehensive overview of this phenomenon, is still missing.
The Quick Access Recorder (QAR) [10,11] is an airborne flight recorder designed to provide quick and easy access to raw flight data, which can record multivariate time-series flight parameters during the entire flight. Compared to other data recording systems like the DFDR (Digital Flight Data Recorder), black box, etc., the QAR has the advantages of a higher sampling rate, more parameters, and faster data transmission. Recently, the QAR devices have been widely adopted by airlines to improve flight safety [4,12,13,14]. The flight parameters collected by the QAR devices include the state parameters of the aircraft, such as the speed, pitch angle, radio altitude, acceleration, etc. They also contain the parameters of the pilot operations, such as the pitch control, roll control, throttle lever position, etc. Some external environmental parameters, including the wind speed, wind direction, and temperature, are also collected by the QAR device.
Our work is based on a QAR dataset with 86,504 flights from the domestic airlines in China. We mainly aim to fill the aforementioned research gap, give more insights, and establish a comprehensive overview about the unsafe pilot stick operations during the flare phase. Specifically, our work will answer the following key questions: (1) Are there any typical reasons among the pilots who applied forward stick inputs during the flare? (2) What are the key contributing factors related to this unsafe stick operation? and (3) How is this phenomenon related to different airlines, airports, and pilots? To this end, we first carefully preprocessed the raw flight data through data cleaning, parameter transformation, etc. After that, we selected key features that are helpful for explaining this operation based on the experience of flight experts, and then clustered these features through the K-means algorithm [15,16]. From the clustering results, four main categories are summarized, corresponding to four influencing factors, i.e., the headwind influence, high pitch influence, long flare influence, and pilot personal influence. In addition, we also investigate how the above four classes correlate with different airlines, airports, and pilots. From the experimental results, we find that for different airports and pilots, there are significant differences in the occurrence probabilities of different classes. Specifically, for flights related to the headwind influence, coastal airports and inland airports show significant differences. Different pilots show a significant difference in the long flare influence and personal influence, which is consistent with our analysis.
The main contributions of our study are summarized as follows:
  • To the best of our knowledge, this work is the first systematic study analyzing pilots’ unsafe forward stick operations based on a large volume of flight data. The findings from this work can be used by airlines to design more targeted pilot training programs in the future, which has great practical importance for aviation safety.
  • The key features are extracted based on the experience of flight experts, and then the K-means clustering method is used to uncover the reasons for unsafe pilot stick operations. A benefit to the flight expert experience, the obtained results show good explainability.
  • Extensive experiments are conducted to investigate how different classes of the adverse event are correlated with different airlines, airports, and pilots. The results provide new insights into the understanding of unsafe pilot operations during landing.
The rest of this paper is as follows: We review the related works about aviation safety and K-means clustering in Section 2, followed by the methodology illustration in Section 3. Then, Section 4 will show the experimental results with a detailed discussion about the different categories. Finally, this paper is concluded in Section 5.

2. Related Work

Recently, many scholars have utilized QAR data to study aviation safety incidents. The main studies can be divided into two groups: safety incident prediction and flight safety analysis.

2.1. Safety Incident Prediction

The research of flight safety incident prediction mainly aims to establish forecasting models which can be utilized as a warning before a safety incident occurs. For a hard landing, Cao et al. [17] and Hu et al. [8] took advantage of a BP neural network and an SVM to predict the incident, respectively. Because both of them are relatively early works, their prediction accuracy is unsatisfactory. Then, Qiao et al. [18] tried to use the RBF neural network and K-means clustering algorithm to predict a hard landing. With the rise of deep learning and in order to capture time-series features, Tong et al. [9] proposed a model based on the Long Short-Term Memory (LSTM) network to predict a hard landing. The same model was also used to address the landing speed prediction problem [19] and the tail strike risk prediction problem [20]. Kang et al. [21] further proposed a deep sequence-to-sequence model based on LSTM and an attention mechanism to improve the landing speed prediction accuracy. These deep learning-based methods not only take advantage of the information at the feature level but also capture the temporal information from these time-series flight parameters. Hence, the LSTM-based methods have achieved a good prediction performance. Similarly, for the long landing incident, Wang et al. [22] investigated the correlation between different QAR parameters and a long landing through the analysis of variance method and utilized the logical regression and linear regression models for the long landing risk prediction. Recently, Kang et al. [23] utilized a deep sequence-to-sequence model for long landing prediction, which further improved the prediction accuracy by incorporating an attention mechanism. Predicting aviation safety incidents can enable proactive warnings before safety incidents occur, but these methods cannot help uncover the reasons for safety incidents.

2.2. Flight Safety Analysis

Recently, many scholars have tried to explore the reasons for or risks of safety incidents so that the findings can be used to provide more targeted pilot training and improve the safety level of airlines. Specifically, Wang et al. [10] used QAR data to divide the safety incident risk space through the golden section method to find the high-risk subspace where safety incidents occur. Subsequently, they proposed a new algorithm based on the rough set theory and a particle swarm multi-objective optimization algorithm [24] to analyze the flight safety risk. Some scholars divided the safety incident subspace according to the value of each parameter in the QAR and then constructed the state transition function of risk based on the Markov model [25]. Liu et al. [26] studied the risk assessment model of a safety incident and defined the risk as the probability of occurrence and the severity of the incident. Then, they developed a pilot operation quality assessment system based on this model. Moreover, for a hard landing, Li et al. [27] recognized hard landing patterns based on a curve clustering method. In their following work [4], they further validated the proposed method on a larger QAR dataset and gave a corresponding risk analysis model.
To analyze and explain safety incidents, Wang et al. [28] studied the relationship between risk perception and safety incidents. In [29], Lv et al. divided the aircraft landing phase into four sub-phases and extracted the mean, variance, and maximum values of the QAR parameters as featured in each phase, based on which the connection between the overrun risk and these features was investigated. Janakiraman [30] proposed an algorithm named DT-MIL, which combines multiple-instance learning and a recurrent neural network with a GRU (Gated Recurrent Unit) to find abnormal time points leading to safety incidents. In [31], the authors took advantage of reinforcement learning to construct a Markov decision process, with which adverse state transition points were identified as precursors to a safety incident. In addition, Ayra et al. [32] analyzed the contributing factors of runway overrun accidents and made operational recommendations.

2.3. Application of K-Means Clustering

K-means clustering is a classical unsupervised learning method, and it has been widely used in a variety of applications. Recently, Ran et al. [33] investigated the urban road planning problem and proposed a K-means clustering algorithm based on a noise algorithm to capture urban hotspots. Gu et al. [34] investigated the mixed-layer depth (MLD) estimation problem which is important in the area of ocean dynamics and global climate change. They proposed a hybrid approach by combining the K-means clustering algorithm and an artificial neural network (ANN) model and evaluated their approach through a case study of the Indian Ocean data. Abernathy et al. [35] investigated the color quantization problem commonly used in image processing and proposed a partitional color quantization algorithm based on a binary splitting formulation of MacQueen’s online K-means algorithm. Richardo et al. [36] proposed a neutrosophic K-means algorithm by combining a classic K-means method with neutrosophy to analyze the earthquake data in Ecuador. Hutagalung et al. [37] used the K-means clustering algorithm to analyze COVID-19 cases and deaths in Southeast Asia. Ikotun et al. [38] considered automatic K-means clustering where the specification of a cluster number is not required and comprehensively reviewed recently proposed studies related to the improvements in the K-means clustering algorithm with nature-inspired optimization techniques.

2.4. Summary of Existing Studies

For the existing studies related to flight safety incident prediction and risk analysis, most of them only provide a parameter-level explanation, such as locating the high-risk moments of abnormal parameter values. However, they can hardly explain the safety incidents from the physical or operational aspect. As a result, the traditional methods lack practical significance for airlines and pilots. Therefore, this paper aims to fill this gap by conducting comprehensive research on a large volume of flight data and providing explainable results to uncover the reasons for unsafe pilot stick operations during the flare.

3. Methodology

3.1. Problem Statement

There are three key phases during landing of a flight, i.e., final approach phase, flare phase, and landing phase. In detail, when the aircraft descends to an altitude of about 50 feet above the ground, the pilot will apply back stick inputs to increase the aircraft pitch angle and reduce the vertical speed, to ensure a steady touchdown. After this back stick operation is completed, the aircraft enters the flare phase. Usually, at the beginning of the flare, the aircraft speed is still very high, and it does not touch ground immediately. Therefore, the pilot has to maintain the pitch attitude to make the speed continue to decrease in this phase, so that the aircraft will touch the ground at a relatively small vertical speed, as shown in Figure 2. The phase when the aircraft touches the ground and the subsequent movement on the runway until the aircraft ground speed reduces to specific level is called the landing phase.
Adverse event: In this paper, the adverse event is specifically referred to as the events in which the pilot applies forward stick inputs during the flare phase. In this phase, both airspeed and vertical speed of the aircraft gradually decrease, and the lift continues to decrease. In order to make the lift of the aircraft approximately equal to gravity and allow the aircraft to slowly descend close to the ground, the pilot should maintain the pitch attitude of aircraft, help increase the lift to reduce the aircraft’s vertical speed, and finally touch the ground smoothly [39]. It is generally required by airlines that pilots should not apply any forward stick inputs during the flare. However, our statistical results from a large number of flights show that this unsafe pilot stick operation occasionally happens. Specifically, from the QAR data of 86,504 flights covering A320 and A321 models at domestic airports in China from May 2017 to December 2018, we observe a total number of 11,385 flight samples with the adverse event. The above unsafe pilot operation may eventually result in an excessive vertical overload at touchdown and cause serious damage to the aircraft’s landing gears.
In order to uncover the typical reasons for the adverse event, an innovative approach based on unsupervised K-means clustering algorithm is established in this paper. Our approach is divided into three parts. Specifically, we first preprocess the flight data and select key features based on expert experience. Then, the processed data are input into K-means algorithm to automatically classify them into different clusters. Finally, we investigate the classification results to reveal different reasons for the adverse events. We also analyze the performance of different types of adverse events from different airlines, airports, and pilots.

3.2. Data Preprocessing and Feature Selection

In the QAR dataset, the sampling frequency varies from 1 to 8 Hz with respect to different parameters. Table 1 shows 31 commonly used QAR parameters and their sampling frequencies. For airlines, they can use QAR data to find abnormalities in pilot operations, engine conditions, and aircraft performance in time. For researchers, QAR data can be used to investigate safety events to ensure aviation safety. In this paper, the QAR dataset is processed in the following way.
First, all original data need to be uniformly scaled, i.e., features with small values are scaled up while those with large values are scaled down, so that the contributions of different features to the final results are roughly equal. Next, by consulting with flight experts, including experienced pilots, QAR data decoding experts, and airline managers, we choose the following parameters as the basic features: wind speed (WIN_SPD parameter), wind direction (WIN_DIR), height (RADIO_LH) (RADIO_LH and RADIO_RH show very similar values, so we only use one of them), the magnetic heading (HEAD_MAG) of aircraft, and pitch angle (PITCH). Then, these basic features are further processed based on prior knowledge and expert experience.
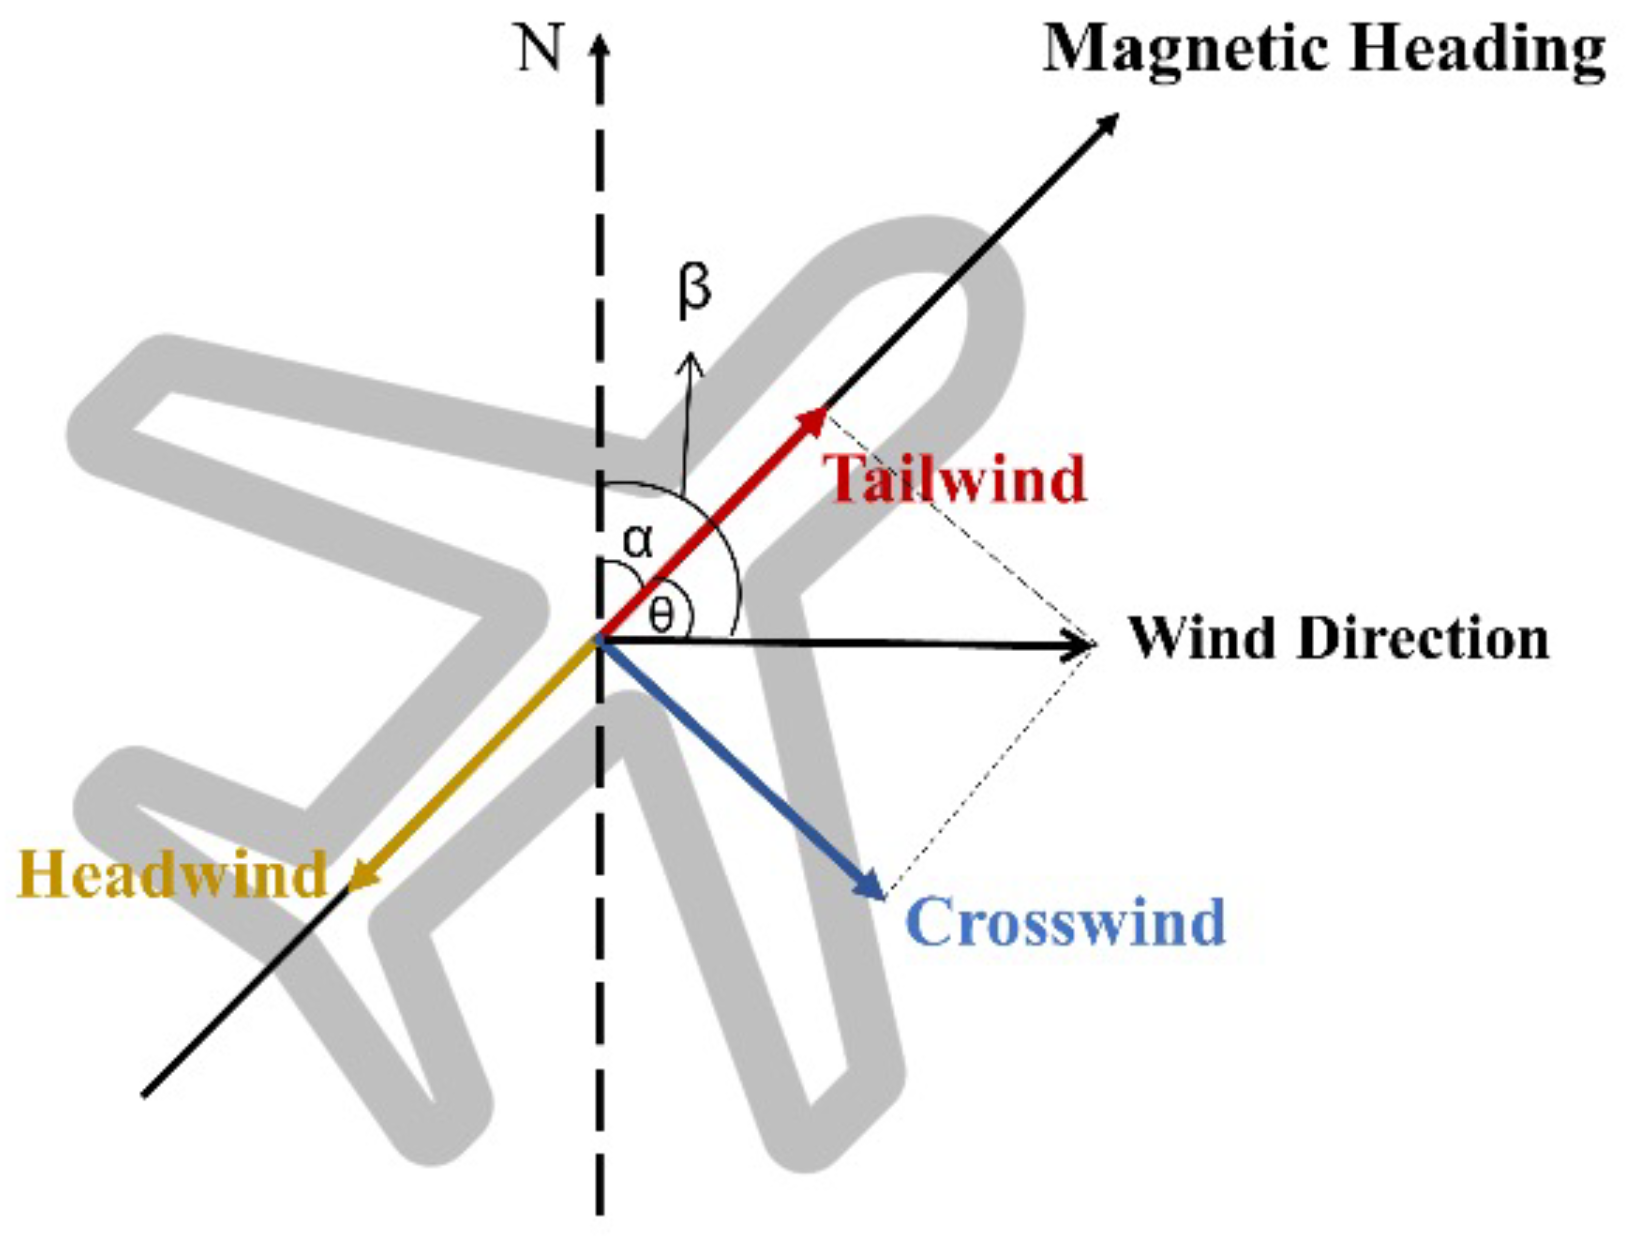
From flight expert experience, we know that the pitch angle of an aircraft is largely impacted by the headwind it encounters. However, because the headwind is not included in the original flight parameters, we should combine the aircraft’s magnetic heading (i.e., the flying direction of the aircraft relative to the north), wind speed, and wind direction to calculate the effect of headwind on the aircraft, as shown in Figure 3. We mainly use the longitudinal component of the wind as our feature, and the calculation formulas are as follows:
θ = α β
W I N a l g = W I N s p d × cos θ
where α represents the wind direction, and b e t a represents the magnetic heading of aircraft, so θ = α β represents the wind direction relative to the aircraft. W I N s p d denotes the absolute wind speed, so the longitudinal component of the wind speed with respect to the aircraft is represented by W I N a l g .
On the other hand, the aircraft pitch control is also closely related to how long the pitch angle keeps changing in the same direction (increasing or decreasing) and how far it has gone. Therefore, we extract cumulative change values of pitch angle and the maximum pitch angle over a period of time, which are calculated as:
Δ P i t c h t = P i t c h t + 1 P i t c h t
P i t c h T o t a l C h a n g e = t = 0 n 1 | Δ P i t c h t |
Finally, we select the radio height values from one second around the moment when the pilot applied forward stick inputs during the flare as features to see whether the aircraft has kept flaring (flying at a relatively fixed and low height) for a while before touchdown. Because the radio height parameter is sampled with 4Hz frequency, four consecutive height values (H1, H2, H3, and H4) will be obtained.

3.3. K-Means Clustering

Clustering is a traditional unsupervised learning method, which divides data samples into subgroups, thus enabling us to uncover and explain the reasons for different types of adverse events. Among the various clustering methods, K-means clustering is most widely used due to its simplicity and high-efficiency characteristics, though it highly relies on the parameter k and cannot handle data with varying densities. According to the characteristics of the QAR data and following our previous work [4], we use the Euclidean distance metric-based K-means clustering algorithm. Its basic idea is to divide the sample set into k clusters according to the distance among samples, so that points within the same cluster are closely connected while the distances between different clusters are as far as possible. Currently, K-means clustering algorithm has been widely used in a variety of applications [34,38], such as urban hotspots detection [33], earthquake analysis [36], COVID-19 disease analysis [37], etc.
Let the QAR data be represented by X with dimensions ( N , d ) , where N and d denote the number of flight records and features, respectively. Let record i be expressed as x i R d , i = 1 , 2 , , N . Firstly, the algorithm randomly generates k cluster centers, and the j-th center is represented as u j ( 0 j k ) , which represents one category. For each x i , we calculate the class that x i should belong to based on the Euclidean distance between x i and the cluster centers. Then, x i is assigned to the closest cluster c i , i.e.,
c i = arg j min | | x i u j | | 2
Then, for each class j, the cluster center is updated in the following way:
u j = i = 1 N 1 { c i = j } x i i = 1 N 1 { c i = j } , j = 1 , 2 , , k
Repeat the above process until the following objective reaches the minimum.
J = j = 1 k i = 1 N | | x i u j | | 2
where J represents sum of squared distances of the clusters.
Moreover, we use the silhouette coefficient [40] to choose the most suitable value of k and evaluate the algorithm. The silhouette coefficient combines the cohesion and separation characteristics of the clusters. Let d i denote the average distance from record i to other records in the same cluster, d i j be the average distance from record i to all records of other cluster j, then the silhouette coefficient s i of record i is defined as:
s i = d i j d i max ( d i , d i j ) ,
Finally, the silhouette coefficients of all records are averaged to obtain the total silhouette coefficient of the clustering result, which is represented as S = i = 1 N s i N , and it satisfies 1 S 1 . Higher silhouette coefficient means better performance.

4. Experiment

In this section, we conduct the experiments based on the QAR dataset to classify the adverse events and analyze their reasons.

4.1. Dataset

The dataset used contains QAR data of 86,504 flights covering A320 and A321 models at domestic airports in China from May 2017 to December 2018. The QAR data include 42 aircraft parameters during entire flight process, covering flights of 73 airports, 2 airlines, 2 aircraft models, and 837 pilots in total (due to privacy concern, the specific airline and pilot information is not released). From the dataset, we find a total number of 11,385 flight samples with the adverse event.
In our experiment, we use the methods as described in Section 3.2 to extract features from the period when the aircraft’s radio altitude is between 10 feet and touchdown, and this phase is the last stage of flare phase with important research significance. The finally obtained features are listed in Table 2.

4.2. Model Hyperparameters

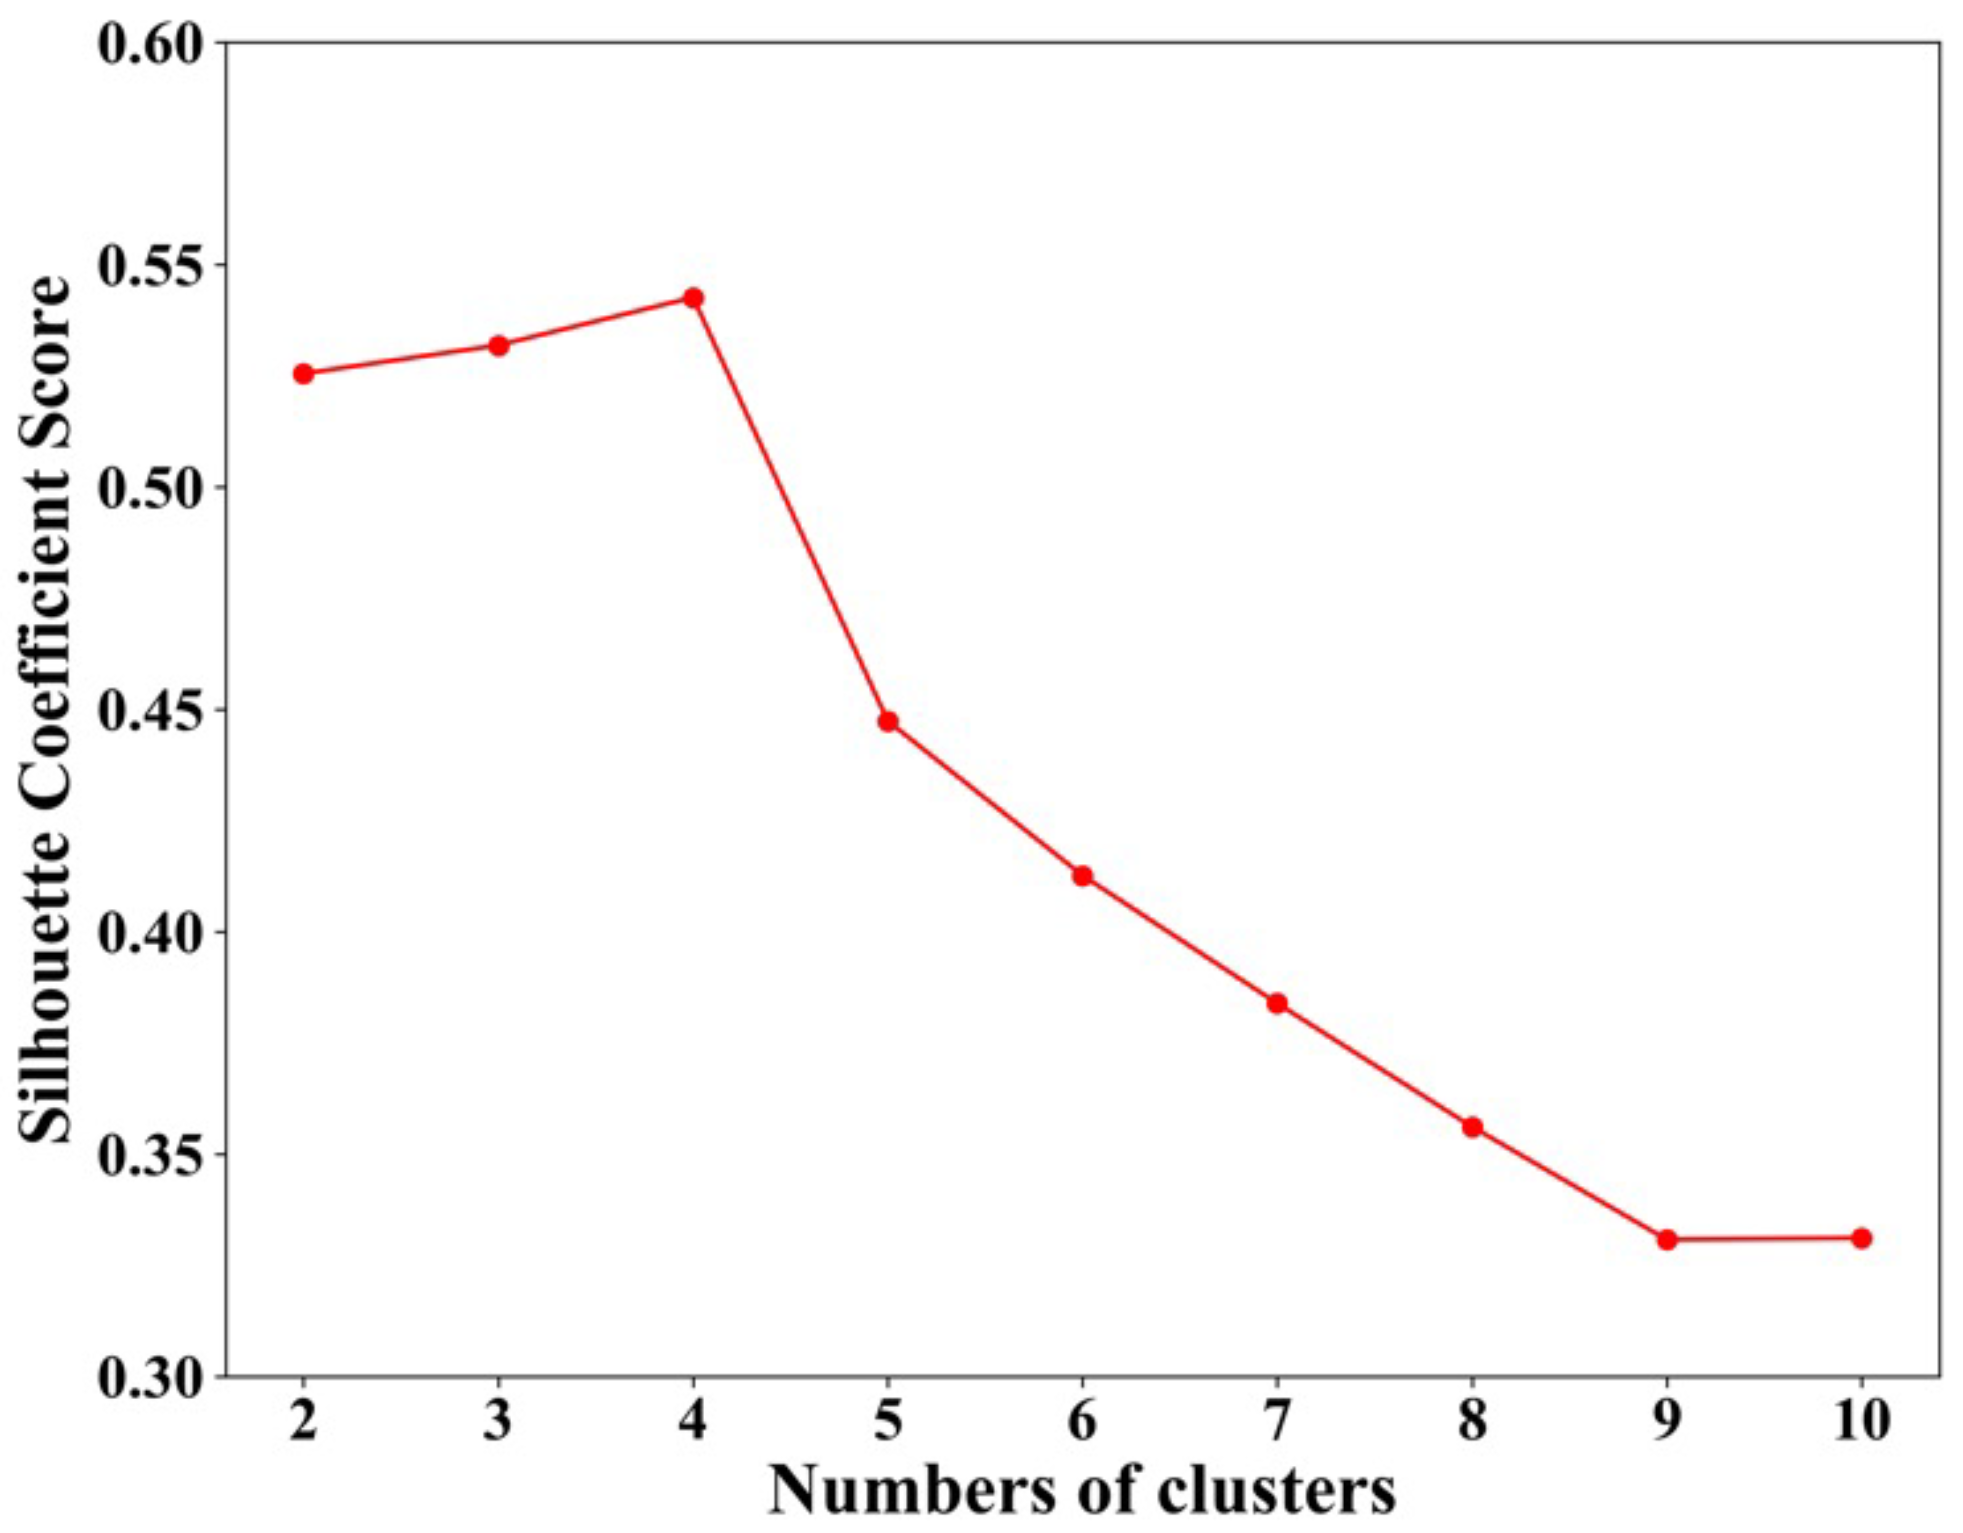
For K-means clustering model, the total number of iterations is 300, the termination parameter is ϵ = 1 × 10 4 , i.e., when the error is less than ϵ , the algorithm will terminate. Finally, the number of clusters is set to k = 4 , because it yields the maximum silhouette coefficient, as shown in Figure 4.

4.3. Experiment Results and Interpretation

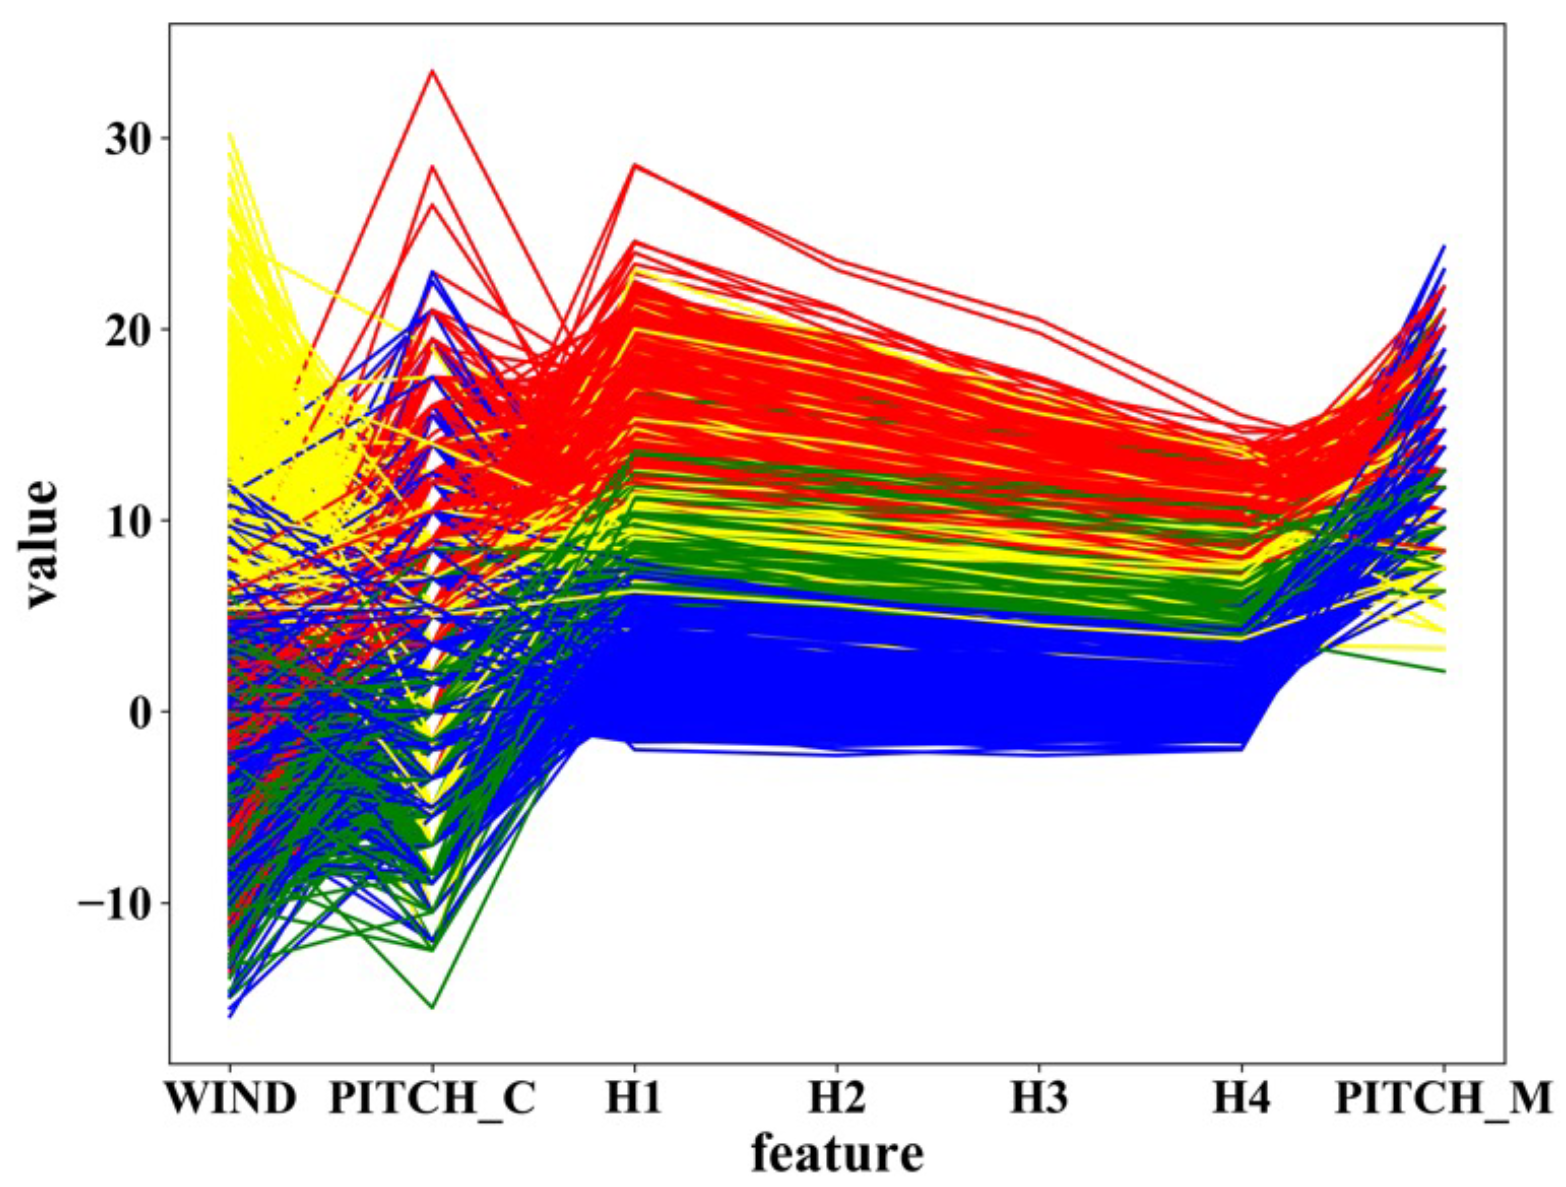
Through the K-means algorithm, the adverse events caused by pilots’ forward stick inputs are divided into four types, and the results are shown in Figure 5, where the x-axis indicates the feature index while the y-axis represents the corresponding feature values. From the clustering results, the reasons for different types of adverse events can be interpreted as follows:
  • The first type (headwind influence): This type is represented by yellow lines. The characteristic of this type is that its headwind parameter values are significantly higher than other types. When the aircraft encounters heavy headwinds during the flare, the wind will have an effect of increasing the aircraft pitch angle in a short period of time. If the pilot is not prepared for this situation, then he may apply the forward stick operation to counteract the wind effect. For this type, the pilot should pay significant attention to the wind conditions during the landing stage.
  • The second type (high pitch influence): This type is represented by red lines. The characteristic of this type is that the cumulative value of the pitch angle change (PITCH_C) and maximum pitch angle of the aircraft (PITCH_M) is very large before the pilot applies the forward stick inputs. Meanwhile, the height is relatively high, and the influence from the wind is insignificant. So, it can be concluded that the aircraft has endured a continuous increasing in the pitch angle, and its pitch angle finally becomes too large. This is usually caused by the pilot’s unawareness of the aircraft status and attitude, i.e., keeping a stable pitch angle with a relatively small vertical speed. As a result, the pilot applies the stick forward operation to directly reduce the pitch angle of the aircraft in order to avoid the tail strike risk. For this type, the pilot should be aware of the pitch attitude of the aircraft, especially when it is close to the ground. If the pitch angle becomes too high and it was not likely to stabilize in time, then the pilot should initiate a go-around.
  • The third type (long flare influence): This type is represented by blue lines, from which we observe that the height parameter almost keeps unchanged at a very low attitude during the one second. In this type, although there are some tail winds (WIND < 0), its impact is insignificant. The result indicates that the aircraft keeps flaring at a relatively low height. Most frequently, this is caused by the pilots excessive applying of back stick inputs, which will quickly reduce the aircraft vertical speed. When the aircraft keeps flaring at a relatively low height due to the pilot’s excessive reduction in the vertical speed, then they may further perform the forward stick operation to make the aircraft touch the ground as soon as possible so as to avoid the runway overrun [21,32] risk. For this type, the pilot should be aware of the vertical speed of the aircraft and avoid reducing the vertical speed too much before entering the flare.
  • The fourth type: This type is represented by green lines. This type of flight does not show a significant low height or large pitch angle, which means the aircraft was not enduring an abnormal situation. For this type, the pilot should get more flight training to improve their landing skills.

4.4. Further Analysis on Impacting Factors

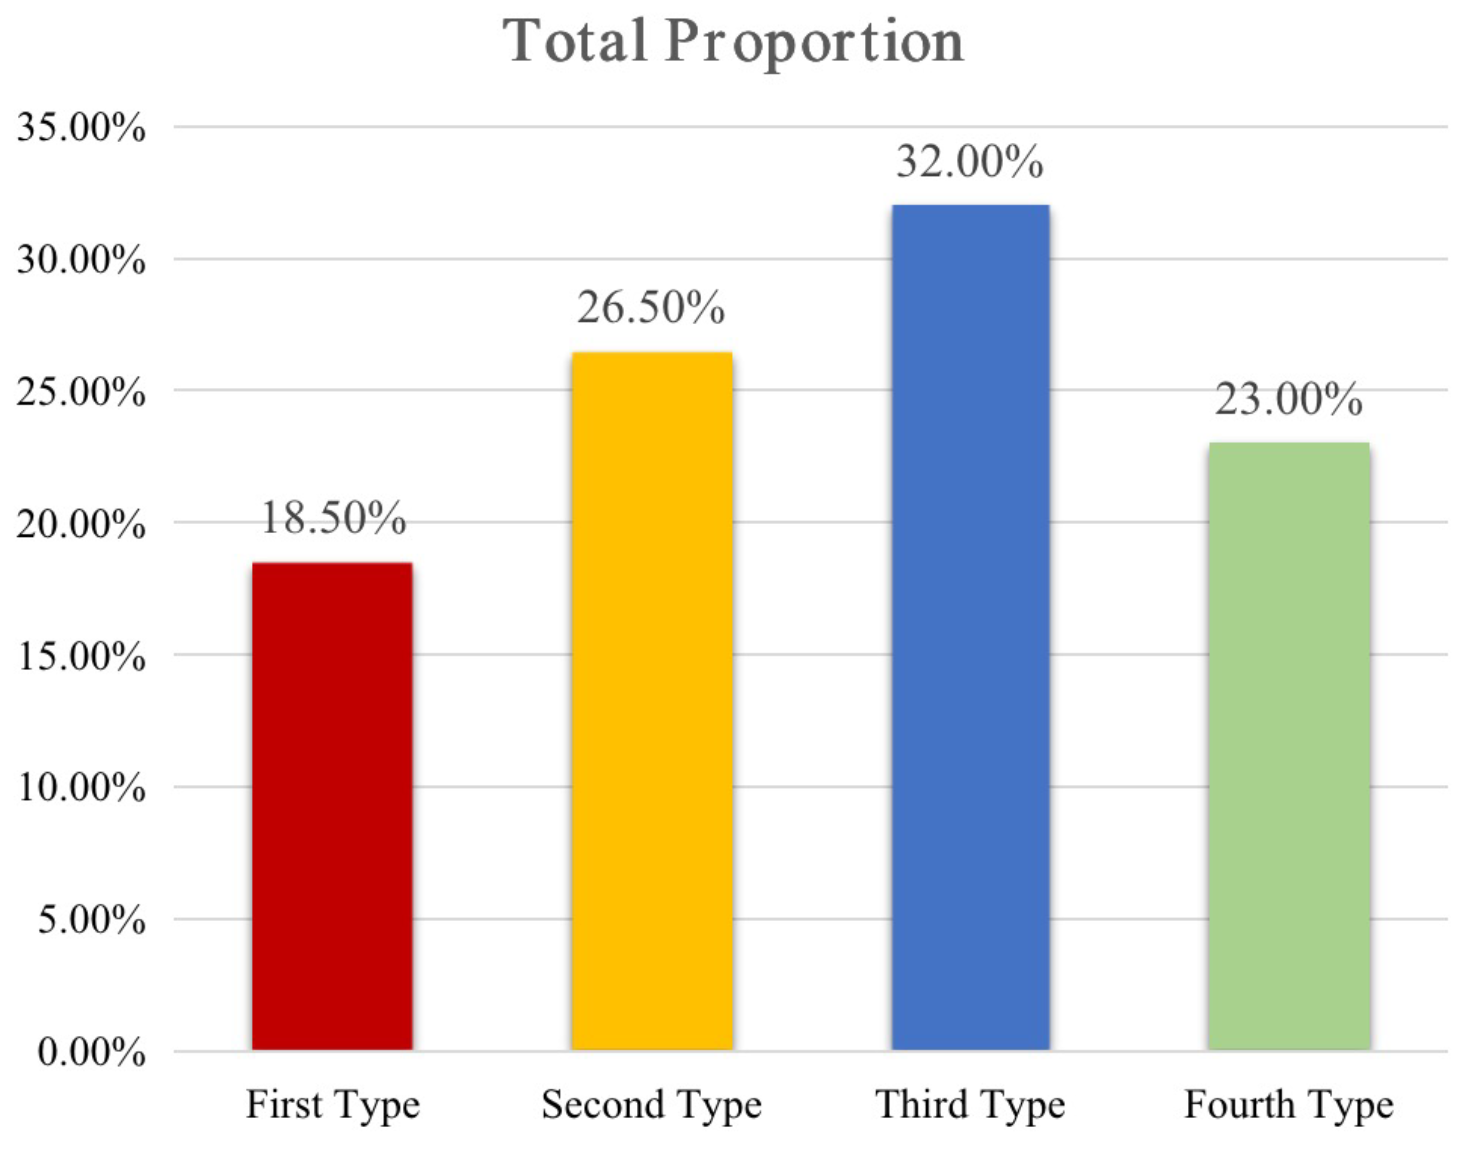
In general, the overall proportions of these four types are shown in Figure 6. It can be seen that among all the types, the third type of adverse event has the largest proportion, and the lowest proportion is the first type. In addition, we also investigate how the different types are correlated with different airlines, airports, and pilots.
Airline impact:Figure 7 shows the distribution of the adverse events with respect to different airlines, from which we see that airline A accounts for about 60% of the overall occurrences. Given that airline A has a total number of 23,445 flights, while airline B has 63,059 flights in total, it is interesting to observe that the occurrence probability of airline A (6807/23,445 ≈ 29%) is about four times that of airline B (4578/63,059 7.3 % ). This result is mainly due to the different pilot training programs of the two airlines. From the results, it can be seen that airline B has more rigorous restrictions on the pilots’ forward stick operations during the flare. We also analyzed the distribution of the four types of adverse events in each of the two airlines. As we can see, airline A has a higher proportion of the third type of events, while the proportion of the first type is relatively lower. According to these results, airlines can train pilots to avoid these adverse events in a more targeted manner.
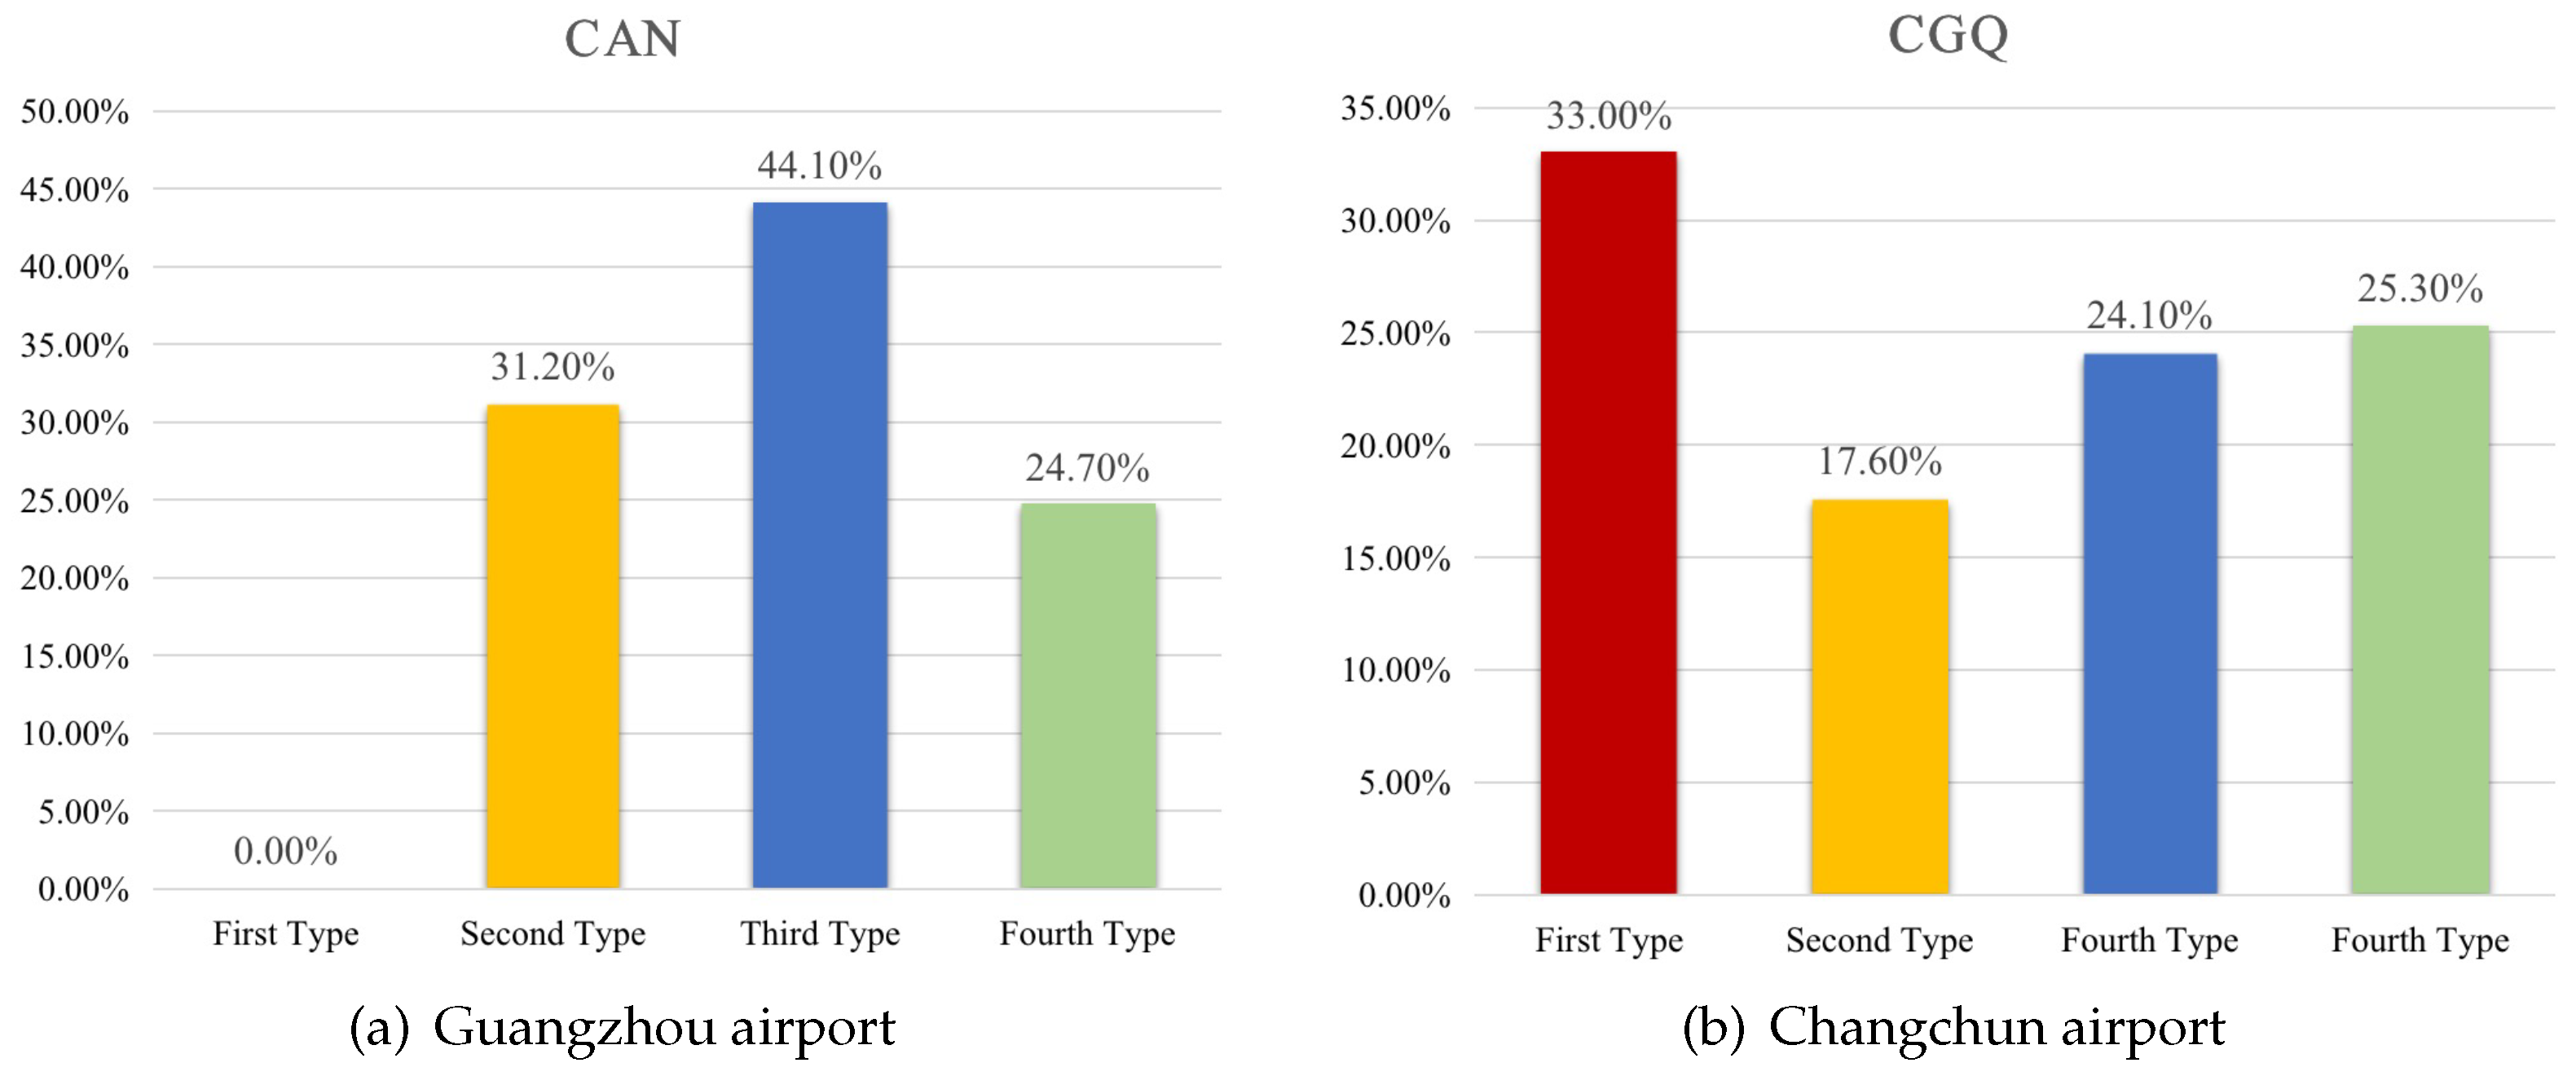
Airport impact: We investigate the adverse event distribution with respect to different airports, and the results indicate a significant difference between the coastal and inland airports, as shown in Figure 8a,b. The left one is an airport from Guangzhou (CAN), a coastal city of China, while the right one is an airport from Changchun (CGQ), a northeastern inland city of China (the difference between coastal and inland airports is widely observed; we only show two representative airports due to the space limit). It can be clearly seen that the inland airport has a significantly higher proportion of the first type of adverse events (caused by the wind influence) than the coastal airport. We think the result is mainly due to the different wind conditions of these two airports. To validate our assumption, we further investigated the monthly wind statistics data of the two airports, which are available from https://www.windfinder.com/windstatistics/, accessed on 22 November 2022. From the statistics, we found that these two airports exhibit significantly different characteristics. Specifically, for the Guangzhou airport, the proportion of east winds is significantly higher than the west winds, while for the Changchun airport, the southwest winds dominate the wind directions. Moreover, the average wind speed of the Changchun airport is stronger than the Guangzhou airport.
Pilot impact: Finally, we analyze the results from different pilots. Because there are hundreds of pilots in our dataset and it is impractical to show all of them, we only chose two representatives, as shown in Figure 9a,b. The most significant difference between the two pilots is observed on the third and fourth adverse event types. The percentage of the fourth type of adverse event for pilot 1 is as high as 51.2%, while that value for pilot 2 is only 5%. The results indicate that for pilot 1, many of the adverse events were due to personal factors, e.g., operational habits. Based on the results, the airlines can train their pilots in a more personalized way.

5. Conclusions

Flight safety plays a vital role in the aviation industry. In this paper, we addressed this issue by investigating pilots’ inappropriate stick operation during the flare phase. Specifically, we extracted key features from flight parameters with expert knowledge and took advantage of the K-means clustering algorithm to uncover the reasons for this adverse event. Based on the clustering results, we summarized the reasons into four types, including the headwind influence, high pitch influence, height influence, and pilot personal influence. In addition, we further analyzed the characteristics of the four types of reasons from different airlines, airports, and pilots. The results in this paper can provide researchers with new insights into this problem.
This study is not immune from its limitations. Firstly, our datasets were only for two different airlines. In the future, we will try to incorporate more airlines in our research. Secondly, the methodology in this paper is based on K-means clustering, which has its own limitations. In the future, we will investigate new clustering algorithms to improve the method performance. Lastly, in this paper, we only conducted a data-level analysis with limited domain knowledge. In the future, we will conduct more in-depth research and incorporate more expert knowledge to increase the generality of our results.
Another important direction worth investigating in the future is applying advanced optimization algorithms to address the flight safety problem, such as the online-learning-based evolutionary many-objective algorithm [41], polyploid memetic algorithm [42], island-based metaheuristic algorithm [43], etc. These algorithms, which are mainly based on heuristics or metaheuristics, have been widely used for challenging decision problems in a variety of domains, such as vehicle routing [44], berth scheduling [43,45], ambulance routing in a disaster response [46], etc.

Author Contributions

Conceptualization, X.L. and Y.Q.; methodology, J.S.; software, H.C.; validation, L.Z. and Q.W.; formal analysis, J.S.; investigation, H.C.; resources, X.L., Y.Q. and L.Z.; data curation, J.S.; writing—original draft preparation, H.C.; writing—review and editing, J.S.; supervision, X.L. and L.Z.; project administration, Y.Q.; funding acquisition, X.L. and L.Z. All authors have read and agreed to the published version of the manuscript.

Funding

This research was funded by the National Natural Science Foundation of China (No. U2133209), the Civil Aviation Flight Technology and Flight Safety Key Laboratory Foundation (No. FZ2020ZZ01), and the Open Fund of the Key Laboratory of Flight Techniques and Flight Safety, CAAC (No. FZ2021KF01), and the APC was funded by the National Natural Science Foundation of China (No. U2133209).

Institutional Review Board Statement

Not applicable.

Informed Consent Statement

Not applicable.

Data Availability Statement

Not applicable.

Acknowledgments

We appreciate Biao Tang and Hao Xie, Xuan Ding, and Dongcheng Chen for their support in the constructive discussions and experience-based feature extraction work.

Conflicts of Interest

The authors declare no conflict of interest. The funders had no role in the design of the study; in the collection, analyses, or interpretation of data; in the writing of the manuscript; or in the decision to publish the results.

Abbreviations

The following abbreviations are used in this manuscript:
MDPIMultidisciplinary Digital Publishing Institute
QARQuick Access Recorder
EASAEuropean Union Aviation Safety Agency
FCTMFlight Crew Techniques Manual
DFDRDigital Flight Data Recorder
LSTMLong Short-Term Memory
GRUGated Recurrent Unit
SOPStandard Operating Procedure

References

  1. Şenol, M.B. Evaluation and prioritization of technical and operational airworthiness factors for flight safety. Aircr. Eng. Aerosp. Technol. 2020, 92, 1049–1061. [Google Scholar] [CrossRef]
  2. Reiche, C.; Cohen, A.P.; Fernando, C. An initial assessment of the potential weather barriers of urban air mobility. IEEE Trans. Intell. Transp. Syst. 2021, 22, 6018–6027. [Google Scholar] [CrossRef]
  3. Shao, Q.; Zhou, Y.; Zhu, P. Spatiotemporal analysis of environmental factors on the birdstrike risk in high plateau airport with multi-scale research. Sustainability 2020, 12, 9357. [Google Scholar] [CrossRef]
  4. Li, X.; Shang, J.; Zheng, L.; Wang, Q.; Sun, H.; Qi, L. CurveCluster+: Curve Clustering for Hard Landing Pattern Recognition and Risk Evaluation Based on Flight Data. IEEE Trans. Intell. Transp. Syst. 2022, 23, 12811–12821. [Google Scholar] [CrossRef]
  5. Kong, Y.; Zhang, X.; Mahadevan, S. Bayesian Deep Learning for Aircraft Hard Landing Safety Assessment. IEEE Trans. Intell. Transp. Syst. 2022, 23, 17062–17076. [Google Scholar] [CrossRef]
  6. Rozelle, R.; Lacagnina, M.; Rosenkrans, W.; Werfelman, L.; Darby, R. Stabilized approach and flare are keys to avoiding hard landings. Flight Saf. Dig. 2004, 23, 1–25. [Google Scholar]
  7. Wang, L.; Ren, Y.; Wu, C. Effects of flare operation on landing safety: A study based on ANOVA of real flight data. Saf. Sci. 2018, 102, 14–25. [Google Scholar] [CrossRef]
  8. Hu, C.; Zhou, S.H.; Xie, Y.; Chang, W.B. The study on hard landing prediction model with optimized parameter SVM method. In Proceedings of the 2016 35th Chinese Control Conference (CCC), Chengdu, China, 27–29 July 2016; pp. 4283–4287. [Google Scholar]
  9. Tong, C.; Yin, X.; Li, J.; Zhu, T.; Lv, R.; Sun, L.; Rodrigues, J.J. An innovative deep architecture for aircraft hard landing prediction based on time-series sensor data. Appl. Soft Comput. 2018, 73, 344–349. [Google Scholar] [CrossRef]
  10. Wang, L.; Wu, C.; Sun, R. An analysis of flight Quick Access Recorder (QAR) data and its applications in preventing landing incidents. Reliab. Eng. Syst. Saf. 2014, 127, 86–96. [Google Scholar] [CrossRef]
  11. Haverdings, H.; Chan, P.W. Quick access recorder data analysis software for windshear and turbulence studies. J. Aircr. 2010, 47, 1443–1447. [Google Scholar] [CrossRef]
  12. Huang, R.; Sun, H.; Wu, C.; Wang, C.; Lu, B. Estimating eddy dissipation rate with QAR flight big data. Appl. Sci. 2019, 9, 5192. [Google Scholar] [CrossRef] [Green Version]
  13. Wu, E.Q.; Tang, Z.R.; Hu, R.; Zhang, M.; Li, G.J.; Zhu, L.M.; Zhou, G.R. Flight situation recognition under different weather conditions. IEEE Trans. Aerosp. Electron. Syst. 2021, 57, 1753–1767. [Google Scholar] [CrossRef]
  14. Guo, Y.; Sun, Y.; He, Y.; Du, F.; Su, S.; Peng, C. A Data-driven Integrated Safety Risk Warning Model based on Deep Learning for Civil Aircraft. IEEE Trans. Aerosp. Electron. Syst. 2022, 1–14. [Google Scholar] [CrossRef]
  15. Hamerly, G.; Elkan, C. Learning the k in k-means. Adv. Neural Inf. Process. Syst. 2004, 16, 281–288. [Google Scholar]
  16. Moshkovitz, M.; Dasgupta, S.; Rashtchian, C.; Frost, N. Explainable k-means and k-medians clustering. In Proceedings of the International Conference on Machine Learning. PMLR, Virtual, 13–18 July 2020; pp. 7055–7065. [Google Scholar]
  17. Haipeng, C.; Ping, S.; Shengguo, H. Study of aircraft hard landing diagnosis based on nerual network. Comput. Meas. Control 2008, 16, 906–908. [Google Scholar]
  18. Qiao, X.; Chang, W.; Zhou, S.; Lu, X. A prediction model of hard landing based on RBF neural network with K-means clustering algorithm. In Proceedings of the 2016 IEEE International Conference on Industrial Engineering and Engineering Management (IEEM), Bali, Indonesia, 4–7 December 2016; pp. 462–465. [Google Scholar]
  19. Tong, C.; Yin, X.; Wang, S.; Zheng, Z. A novel deep learning method for aircraft landing speed prediction based on cloud-based sensor data. Future Gener. Comput. Syst. 2018, 88, 552–558. [Google Scholar] [CrossRef]
  20. Chen, H.; Shang, J.; Zhao, X.; Li, X.; Zheng, L.; Chen, F. A deep learning method for landing pitch prediction based on flight data. In Proceedings of the 2020 IEEE 2nd International Conference on Civil Aviation Safety and Information Technology (ICCASIT), Weihai, China, 14–16 October 2020; pp. 199–204. [Google Scholar]
  21. Kang, Z.; Shang, J.; Feng, Y.; Zheng, L.; Liu, D.; Qiang, B.; Wei, R. A deep sequence-to-sequence method for aircraft landing speed prediction based on QAR data. In Proceedings of the International Conference on Web Information Systems Engineering, Amsterdam, The Netherlands, 20–24 October 2020; pp. 516–530. [Google Scholar]
  22. Wang, L.; Wu, C.; Sun, R. Pilot operating characteristics analysis of long landing based on flight QAR data. In Proceedings of the International Conference on Engineering Psychology and Cognitive Ergonomics, Las Vegas, NV, USA, 21–26 July 2013; pp. 157–166. [Google Scholar]
  23. Kang, Z.; Shang, J.; Feng, Y.; Zheng, L.; Wang, Q.; Sun, H.; Qiang, B.; Liu, Z. A deep sequence-to-sequence method for accurate long landing prediction based on flight data. IET Intell. Transp. Syst. 2021, 15, 1028–1042. [Google Scholar] [CrossRef]
  24. Qi, M.; Shao, X.; Chi, H. Flight operations risk diagnosis method on quick-access-record exceedance. J. Beijing Univ. Aeronaut. Astronaut. 2011, 37, 1207–1210. [Google Scholar]
  25. Wang, W.; Zhang, T.; Wang, L. Markov chain-based flight operations risk analysis. In Proceedings of the 2017 13th International Conference on Natural Computation, Fuzzy Systems and Knowledge Discovery (ICNC-FSKD), Guilin, China, 29–31 July 2017; pp. 2441–2445. [Google Scholar]
  26. Liu, S.; Zhang, Y.; Chen, J. A system for evaluating pilot performance based on flight data. In Proceedings of the International Conference on Engineering Psychology and Cognitive Ergonomics, Las Vegas, NV, USA, 15 July 2018; pp. 605–614. [Google Scholar]
  27. Li, X.; Shang, J.; Zheng, L.; Liu, D.; Qi, L.; Liu, L. CurveCluster: Automated recognition of hard landing patterns based on QAR curve clustering. In Proceedings of the 2019 IEEE SmartWorld, Ubiquitous Intelligence & Computing, Advanced & Trusted Computing, Scalable Computing & Communications, Cloud & Big Data Computing, Internet of People and Smart City Innovation (SmartWorld/SCALCOM/UIC/ATC/CBDCom/IOP/SCI), Leicester, UK, 19–23 August 2019; pp. 602–609. [Google Scholar]
  28. Wang, L.; Zhang, J.; Sun, H.; Ren, Y. Risk cognition variables and flight exceedance behaviors of airline transport pilots. In Proceedings of the International Conference on Engineering Psychology and Cognitive Ergonomics, Las Vegas, NV, USA, 15–20 July 2018; pp. 725–737. [Google Scholar]
  29. Lv, H.; Yu, J.; Zhu, T. A novel method of overrun risk measurement and assessment using large scale QAR data. In Proceedings of the 2018 IEEE Fourth International Conference on Big Data Computing Service and Applications (BigDataService), Bamberg, Germany, 26–29 March 2018; pp. 213–220. [Google Scholar]
  30. Janakiraman, V.M. Explaining aviation safety incidents using deep temporal multiple instance learning. In Proceedings of the 24th ACM SIGKDD International Conference on Knowledge Discovery & Data Mining, London, UK, 19–23 August 2018; pp. 406–415. [Google Scholar]
  31. Janakiraman, V.M.; Matthews, B.; Oza, N. Finding precursors to anomalous drop in airspeed during a flight’s takeoff. In Proceedings of the 23rd ACM SIGKDD International Conference on Knowledge Discovery and Data Mining, Halifax, NS, Canada, 13–17 August 2017; pp. 1843–1852. [Google Scholar]
  32. Ayra, E.S.; Ríos Insua, D.; Cano, J. Bayesian network for managing runway overruns in aviation safety. J. Aerosp. Inf. Syst. 2019, 16, 546–558. [Google Scholar] [CrossRef]
  33. Ran, X.; Zhou, X.; Lei, M.; Tepsan, W.; Deng, W. A Novel K-Means Clustering Algorithm with a Noise Algorithm for Capturing Urban Hotspots. Appl. Sci. 2021, 11, 11202. [Google Scholar] [CrossRef]
  34. Gu, C.; Qi, J.; Zhao, Y.; Yin, W.; Zhu, S. Estimation of the Mixed Layer Depth in the Indian Ocean from Surface Parameters: A Clustering-Neural Network Method. Sensors 2022, 22, 5600. [Google Scholar] [CrossRef] [PubMed]
  35. Abernathy, A.; Celebi, M.E. The incremental online k-means clustering algorithm and its application to color quantization. Expert Syst. Appl. 2022, 207, 117927. [Google Scholar] [CrossRef]
  36. Estupiñán Ricardo, J.; Domínguez Menéndez, J.J.; Barcos Arias, I.F.; Macías Bermúdez, J.M.; Moreno Lemus, N. Neutrosophic K-means for the analysis of earthquake data in Ecuador. Neutrosophic Sets Syst. 2021, 44, 29. [Google Scholar]
  37. Hutagalung, J.; Ginantra, N.L.W.S.R.; Bhawika, G.W.; Parwita, W.G.S.; Wanto, A.; Panjaitan, P.D. Covid-19 cases and deaths in southeast Asia clustering using k-means algorithm. J. Phys. Conf. Ser. 2021, 1783, 012027. [Google Scholar] [CrossRef]
  38. Ikotun, A.M.; Almutari, M.S.; Ezugwu, A.E. K-Means-Based Nature-Inspired Metaheuristic Algorithms for Automatic Data Clustering Problems: Recent Advances and Future Directions. Appl. Sci. 2021, 11, 11246. [Google Scholar] [CrossRef]
  39. Schmidt, L.V. Introduction to Aircraft Flight Dynamics; AIAA: Reston, VA, USA, 1998. [Google Scholar]
  40. Hamerly, G.; Elkan, C. Learning the k in k-means. In Proceedings of the Advances in Neural Information Processing Systems; Thrun, S., Saul, L., Schölkopf, B., Eds.; MIT Press: Cambridge, MA, USA, 2003; Volume 16. [Google Scholar]
  41. Zhao, H.; Zhang, C. An online-learning-based evolutionary many-objective algorithm. Inf. Sci. 2020, 509, 1–21. [Google Scholar] [CrossRef]
  42. Dulebenets, M.A. An Adaptive Polyploid Memetic Algorithm for scheduling trucks at a cross-docking terminal. Inf. Sci. 2021, 565, 390–421. [Google Scholar] [CrossRef]
  43. Kavoosi, M.; Dulebenets, M.A.; Abioye, O.; Pasha, J.; Theophilus, O.; Wang, H.; Kampmann, R.; Mikijeljević, M. Berth scheduling at marine container terminals: A universal island-based metaheuristic approach. Marit. Bus. Rev. 2019, 5, 30–66. [Google Scholar] [CrossRef]
  44. Pasha, J.; Nwodu, A.L.; Fathollahi-Fard, A.M.; Tian, G.; Li, Z.; Wang, H.; Dulebenets, M.A. Exact and metaheuristic algorithms for the vehicle routing problem with a factory-in-a-box in multi-objective settings. Adv. Eng. Inform. 2022, 52, 101623. [Google Scholar] [CrossRef]
  45. Kavoosi, M.; Dulebenets, M.A.; Abioye, O.F.; Pasha, J.; Wang, H.; Chi, H. An augmented self-adaptive parameter control in evolutionary computation: A case study for the berth scheduling problem. Adv. Eng. Inform. 2019, 42, 100972. [Google Scholar] [CrossRef]
  46. Rabbani, M.; Oladzad-Abbasabady, N.; Akbarian-Saravi, N. Ambulance routing in disaster response considering variable patient condition: NSGA-II and MOPSO algorithms. J. Ind. Manag. Optim. 2022, 18, 1035. [Google Scholar] [CrossRef]
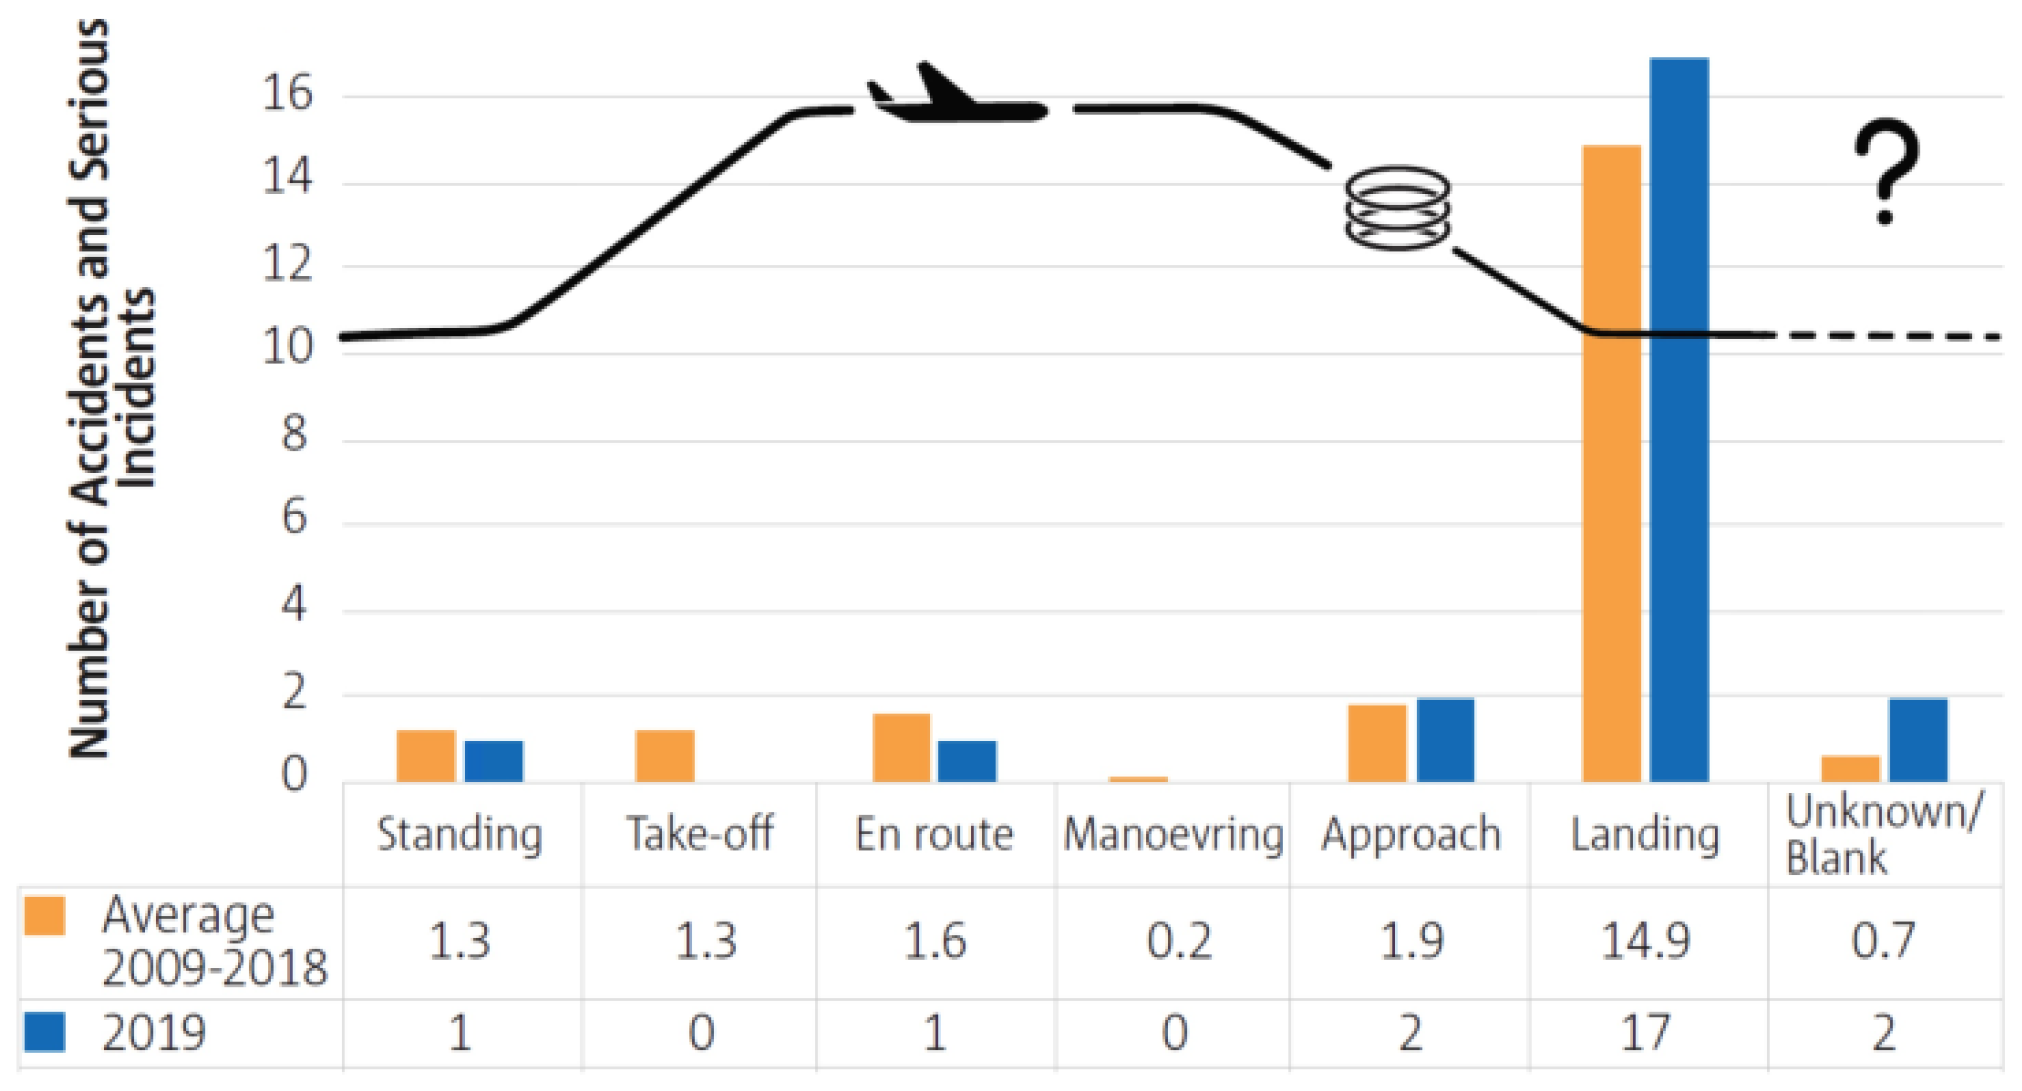
Figure 1. Statistics of serious aircraft incidents from 1959 to 2019.
Applsci 12 12789 g001
Figure 2. Normal pitch control during flare phase.
Applsci 12 12789 g002
Figure 3. The transformation from wind speed and direction parameters to head and cross winds.
Applsci 12 12789 g003
Figure 4. The silhouette coefficient of K-means clustering results with respect to k.
Applsci 12 12789 g004
Figure 5. The K-means clustering results represented by lines with different colors.
Applsci 12 12789 g005
Figure 6. The overall proportions of the four types of adverse events from K-means clustering.
Applsci 12 12789 g006
Figure 7. The distribution of four types of adverse events with respect to different airlines.
Applsci 12 12789 g007
Figure 8. Distributions of four types of adverse events in coastal and inland airports.
Applsci 12 12789 g008
Figure 9. Distributions of four types of adverse events for different pilots.
Applsci 12 12789 g009
Table 1. Description of commonly used QAR parameters.
No.ParameterDescriptionFrequency (Hz)
1ALT_QNHAltitude1
2ALT_STDStandard altitude corrected1
3RADIO_LHLeft radio height4
4RADIO_RHRight radio height4
5LDGLLeft landing gear state4
6LDGRRight landing gear state4
7LDGNOSNose landing gear state4
8IASIndicated airspeed1
9VAPPLanding reference speed1
10GSGround speed1
11VRTGVertical acceleration8
12IVVVertical speed1
13PITCHPitch angle4
14PITCH_CPTCaptain pitch control8
15PITCH_FODeputy captain pitch control8
16GWAircraft gross weight1
17ROLLRoll angel2
18ROLL_CPTCaptain roll control8
19ROLL_FODeputy captain roll control8
20HEAD_MAGMagnetic heading direction1
21WIN_DIRWind direction1
22WIN_SPDWind speed1
23RUDDRudder position2
24N11Engine 1 speed ratio1
25N12Engine 2 speed ratio1
26TLA1Throttle lever 1 position1
27TLA2Throttle lever 2 position1
28FLAP_PLLeft flap actual angle1
29FLAP_PRRight flap actual angle1
30DME1DME 1 distance1
31DME2DME 2 distance1
Table 2. Features extracted from the QAR dataset for K-means clustering.
FeatureDescription
PITCH_CThe cumulative change in pitch angle
PITCH_MThe maximum pitch angle in the flare phase
WINDThe average headwind encountered by the aircraft
H1, H2, H3, H4Four consecutive height values in one second
Publisher’s Note: MDPI stays neutral with regard to jurisdictional claims in published maps and institutional affiliations.