Abstract
Network-constrained spatial flows are usually used to describe movements between two spatial places on a road network. The analysis of the spatial associations between different types of network-constrained spatial flows plays a key role in understanding the spatial relationships among different movements. However, existing studies usually do not consider the effect of distance decay, which may reduce the effectiveness of the detected bivariate spatial flow patterns. Moreover, most existing studies are based on the planar space assumption, which is not suitable for network-constrained spatial flows. To overcome these problems, this study proposed a new statistical method, the Geographically Weighted Network Flow Cross K-function, which improves the Flow Cross K-Function method by taking the distance decay effect and the constraints of road networks into account. Both global and local versions are extended in this study: the global version measures the overall spatial association and the local version identifies the exact locations where a spatial association occurs. The experiments on simulated datasets show that the proposed method can identify predefined bivariate flow patterns. In a case study, the proposed method is also applied to flow data comprising Xiamen taxi and ride-hailing datasets. The results demonstrate that the proposed method effectively identifies the competitive relationships between taxi and ride-hailing services.
1. Introduction
Spatial flows are usually used to reflect the movements among different spatial locations, such as human migration [1,2], daily commuting [3,4,5] and tourism travel [6,7]. Spatial flows can be expressed as origin–destination (OD) flows connecting pairs of endpoints and can be classified as individual flows and aggregated flows based on the spatial form of the endpoints [8]. Individual activities, such as individual home–work commuting [9], are expressed as individual flows, while the movements of groups of geographical objects, such as public transportation spatial flows between different urban subzones [10], are expressed as aggregated flows. In this study, we only focus on individual flows, which can provide more details on movements. Many spatial flow datasets—for example, pedestrian flow datasets and vehicle flow datasets—are constrained by road networks. Network-constrained spatial flow datasets usually contain different types, e.g., yellow taxi flows and green taxi flows [11] and weekday flows and weekend flows [12]. The analysis of the spatial associations between different types of network-constrained flows can facilitate the understanding of the spatial relationships among different movements on a road network. For example, the strong spatial association between weekday flows and weekend flows may reveal entertainment travel, which can provide more information to aid in our understanding of the travel purposes of city residents [12].
Most existing studies focus on detecting the clustering patterns of univariate spatial flows and can be divided into spatial statistical-based [4,13,14,15], hierarchical-based [16,17,18], and density-based [19,20] clustering methods. These methods extend spatial clustering methods for points to a flow context by defining spatial flow distance measurement. For example, Shu et al. [4] firstly defined the flow distance between two spatial flows as the sum of the Euclidean distance between their origin points and the Euclidean distance between their destination points. Then, spatial flows were treated as the study objects and nearby spatial flows were searched by the defined flow distance. Finally, the L-Function [21] was extended to quantify the clustering scale of flows. Although existing clustering methods for univariate spatial flows can detect clustering patterns effectively, these methods cannot measure spatial associations between different spatial flow types.
In recent years, some bivariate flow pattern mining methods have been developed to measure spatial associations between different spatial flow types. The existing methods mainly extend some statistical metrics for points to a flow context (e.g., Flow Cross K-Function, BiFlowLISA, and flow co-location index) by defining distance measures between two spatial flows [11,15,22]. Taking the Flow Cross K-Function as an example, given two different types of spatial flows, A and B, the Flow Cross K-Function uses the number of nearby type B spatial flows of type A as the indicator of the spatial association between type A and type B. The Flow Cross K-Function is comprehensive and effective because this method measures the spatial association not only at the global and local level but also at multiple spatial scales (spatial distance). Moreover, some bivariate flow clustering methods were developed to detect clusters (OD region pairs) of interest comprising two types of spatial flow, e.g., the ratio between the number of type A spatial flows to the number of type B spatial flows in the cluster is abnormally different from the ratio outside the cluster, and both types of flow in the cluster are high-density [23].
Existing bivariate flow pattern mining methods for individual spatial flows usually do not take the effect of distance decay into account, e.g., the Flow Cross K-Function treats closer and farther nearby spatial flows as the same, without considering the distance between the spatial flows and their nearby flows. Actually, the distance between the spatial flows and their nearby flows is important in measuring the strength of the spatial association. For example, the closer the two types of taxi flows are, the more intense the competition is between them. Therefore, the measurement of spatial associations should take the distance decay effect into account [24,25,26,27,28]. Moreover, many types of individual spatial flows are constrained by road networks, e.g., individual home–work commuting flows and taxi flows. The planar space assumption of existing bivariate flow pattern mining methods is not suitable for individual spatial flows in road networks [15,20].
Although the existing methods can detect bivariate flow patterns effectively, two problems still exist: (i) the existing studies pay less attention to the individual network-constrained spatial flows; (ii) the existing studies do not take the effect of distance decay into account when detecting spatial associations between two types of individual network-constrained spatial flows. To overcome these problems, this study developed the Geographically Weighted Cross K-Function for individual network-constrained spatial flows by extending the Cross K-Function [11]. The Cross K-Function [29] was originally proposed to measure pairwise spatial associations between two types of point processes. It has been widely used in many domains, such as ecology [30], crime [31], and biology [32]. To measure spatial associations between types of spatial flows, Tao and Thill (2019) extended the Cross K-Function for points to a spatial flow context and developed a global version and local version of the Flow Cross K-Function [11]. In this study, we also propose two versions of the Geographically Weighted Cross K-Function: the global version is proposed to measure the overall spatial association at multiple scales and the local version is proposed to identify the exact locations where a spatial association arises at multiple scales.
2. Methods
In this study, the network distance is applied as the spatial flow distance measurement, rather than the Euclidean distance, as it is more suitable for network-constrained spatial flows. To take the effect of distance decay into account, we use the Gaussian kernel density function to weigh the distance. The Monte Carlo simulation method is utilized to determine the significant spatial bivariate flow patterns.
2.1. Global Geographically Weighted Flow Cross K-Function
A network-constrained spatial flow fi of type A can be expressed as <NOi, NDi, A>, where NOi and NDi are the network-constrained origin point and network-constrained destination point of fi, respectively. The Euclidean distance is often used to calculate the distance of two spatial flows, which is based on the Euclidean distance between origin points and between destination points. However, the planar space assumption is not suitable for network-constrained spatial flows. To overcome this problem, the network distance, rather than the Euclidean distance, is applied to calculate the distance between origin points and between destination points. In this study, the network-constrained mean distance is utilized as the flow distance measurement:
where NDp (NOi, NDi) and NDp (NDi, NDj) are the shortest path distances between the origin and destination points of network-constrained spatial flows fi and fj, respectively. Given a distance threshold r, if NDf (fi, fj) is less than or equal to r, fi and fj are nearby flows to each other.
Based on the Cross K-Function for points, Tao and Thill (2019) proposed the Flow Cross K-Function by defining flow distance measurement under the assumption of planar space, which can be calculated as follows:
where I(·) is an indicator function; if dij ≤ r (scale), then I = 1; otherwise, I = 0. dij is the Euclidean distance between spatial flows fi and fj; λB is the intensity (number of spatial flows per unit area) of type B over the study area; NA and NB are the number of spatial flows of type A and type B, respectively. Although the Flow Cross K-Function can detect bivariate spatial flow patterns effectively, it may over-detect the bivariate spatial flow patterns of network-constrained spatial flows.
By adopting the network-constrained mean distance and taking the effect of distance decay into account, this study proposes the Geographically Weighted Flow Cross K-Function for the network-constrained spatial flows:
where ndij is the network-constrained mean distance between spatial flows fi and fj, r is the scale, wij is the weight of ndij, rmax is the maximum of all scales. In this study, the Gaussian kernel density function is used to calculate weights. Because different bandwidths of the Gaussian kernel density function can lead to different results, we choose the maximum of all scales (rmax) as the bandwidth to ensure the consistency of results at different scales. The GWFKA,B uses the weighted number of nearby spatial flows with the Gaussian kernel density function, whereas FKA,B uses the number of nearby spatial flows to measure spatial associations (Equation (1)). Using the weighted number of nearby spatial flows can measure spatial associations in more detail. The spatial association captured by the Geographically Weighted Flow Cross K-Function is asymmetrical, which means that the strength of the spatial association between type A and type B (GWFKA,B) can be different from that between type B and type A (GWFKB,A).
2.2. Local Geographically Weighted Flow Cross K-Function
Although the global Geographically Weighted Flow Cross K-Function can measure the overall spatial associations between two types of spatial flows, it cannot capture the spatial variability of spatial associations [17,33,34]. To identify where a strong spatial association occurs, the local version of the Geographically Weighted Flow Cross K-Function was developed in this study. For the type A spatial flow fi, the local Geographically Weighted Flow Cross K-Function, which measures the spatial association between type A and type B at the reference spatial flow fi, is calculated as
Similar to the global version, uses the weighted number of spatial flows of type B near fi as an indicator to show how the strength of the spatial association changes at different spatial locations (spatial flows), which means that the local version can measure the spatial association between two flow types at any reference spatial flow. Moreover, the spatial association detected by the local version can be different from that by the global version, e.g., the local Geographically Weighted Flow Cross K-Function can identify strong spatial associations at some reference spatial flows when the global spatial association is weak.
2.3. Statistical Inference
To determine whether type A flows are statistically significantly associated with type B flows in the whole study area and identify the reference spatial flows at which the spatial association is statistically significant, the values of the Geographically Weighted Flow Cross K-Function of observed spatial flows need to be compared with the expected values under the null hypothesis. There are usually two benchmark null hypotheses for bivariate flow pattern analysis (Tao and Thill, 2019): (i) independence—the two types of spatial flows are generated by a pair of independent univariate processes implemented by the complete spatial randomness (CSR) model; (ii) random labeling—the two types of spatial flows are generated by randomly assigning labels (types) to locations of observed spatial flows. In this study, we choose random labeling as the null hypothesis for bivariate flow pattern analysis for two reasons: (i) the CSR model for spatial flows is complicated to implement because spatial flows also have attributes of length and direction, in addition to origin and destination points; (ii) random labeling can maintain the joint spatial distribution of all types and avoid the impact of edge effects.
After choosing random labeling as the null hypotheses, the Monte Carlo simulation method was applied to obtain the confidence envelopes with the user-specific significance level, e.g., 0.05. Similarly to the Cross K-Function for points [29], the proposed Geographically Weighted Flow Cross K-Function analyzes spatial associations at a multiscale.
3. Experiments Using Simulated Datasets
Three simulated datasets were generated from a real road network of Xiamen Island to test the performance of the proposed method. In simulated dataset 1, we generated 500 type A spatial flows and 1200 type B spatial flows, which were randomly located on the road network (Figure 1a). There was no predefined spatial association between type A and type B in the simulated dataset 1. In simulated dataset 2, we generated 1200 type B spatial flows that were randomly located on the road network, and generated a nearby type A spatial flow for each of the 500 randomly selected type B spatial flows (Figure 1b). We expected that there would exist a spatial association in simulated dataset 2 because there was a type B spatial flow near each type A spatial flow. In simulated dataset 3, we generated three spatial flow clusters with a smaller spatial range for type A (each cluster contained 100 spatial flows) and three spatial flow clusters with a larger spatial range for type B (each cluster contained 300 spatial flows). As shown in Figure 1c, each spatial flow cluster of type A was located inside each spatial flow cluster of type B. The spatial association between type A and type B was weak in simulated dataset 3 because each spatial flow and its nearby spatial flows tended to have the same type.
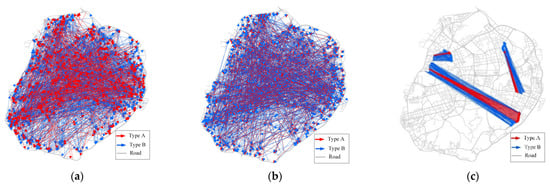
Figure 1.
Spatial distribution of simulated datasets: (a) simulated dataset 1; (b) simulated dataset 2; (c) simulated dataset 3.
The number of Monte Carlo simulations was set to 999, and the significance level α was set to 0.05. Ten network-constrained scales (ranging from 50 m to 500 m with step size 50 m) were selected for the simulated datasets. Figure 2 shows the results of the global Geographically Weighted Flow Cross K-Function. The confidence envelopes in each figure are represented as grey areas, which were calculated using the Monte Carlo simulation method. Figure 2a,b show the results of simulated dataset 1. The values of GWFKA,B(r) and GWFKB,A(r) are within the grey area, which means that there is no spatial association between type A and B. The results of simulated dataset 2 are displayed in Figure 2c,d. The values of GWFKA,B(r) and GWFKB,A(r) are above the upper envelopes across all the scales, indicating that type A and type B are spatially associated with each other. Figure 2e,f show the results of simulated dataset 3. The values of GWFKA,B(r) are lower than the lower envelope, which means that there exists no spatial association between type A and type B. As shown in the figure, only the scale is very large; the values of GWFKB,A(r) are above the upper envelopes. As we can see, the results are consistent with the predefined pattern, which proves the performance of the global Geographically Weighted Flow Cross K-Function.
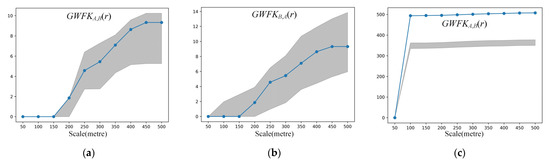
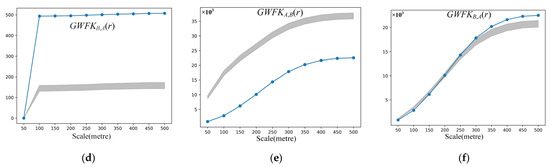
Figure 2.
Results of the simulated datasets: (a,b) simulated dataset 1; (c,d) simulated dataset 2; (e,f) simulated dataset 3.
The local Geographically Weighted Flow Cross K-Function was also applied to the simulated datasets. For simulated datasets 1 and 2, all the local results suggest no spatial flows that exhibit spatial associations with nearby flows. For simulated dataset 3, only some type B flows, which are closer to type A flows, are detected as flows that exhibit spatial associations with nearby type A flows. The number of detected type B flows increases as the scale increases. Figure 3 shows the detected type B flows at scales of 50 m, 150 m, and 300 m. There are no type A flows detected because type A flows are densely distributed.
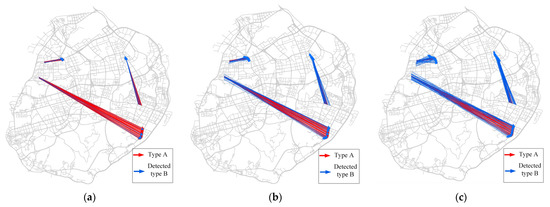
Figure 3.
Results of simulated dataset 3: (a) 50 m; (b) 150 m; (c) 300 m.
To further test the performance of the proposed method, three methods—the Flow Cross K-Function (FK), Geographically Weighted Flow Cross K-Function (PWKF), and Network-Constrained Flow Cross K-Function (NFK)—were also applied to simulated dataset 3. The number of Monte Carlo simulations was set to 999, and the significance level α was set to 0.05. Ten network-constrained scales (ranging from 50 m to 500 m with step size 50 m) were selected for the NFK, whereas ten planar scales (ranging from 50 m to 500 m with step size 50 m) were selected for the NFK. Figure 4a,b show the results for the global version of FK and NFK, respectively. As one can see, the NFK can effectively measure the spatial associations on road networks, whereas FK is not sensitive to the scale. Figure 4d,e show the results the local version of FK and WNFK (scale is 150 m), respectively. The WNFK detected more type B flows that were significantly spatially associated with type A spatial flows than FK did.
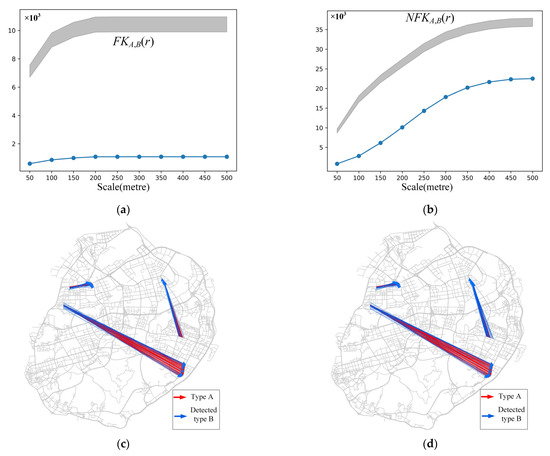
Figure 4.
Results of the four methods: (a) Flow Cross K-Function; (b) Network-Constrained Flow Cross K-Function; (c) Flow Cross K-Function (83 detected type B spatial flows); (d) Geographically Weighted Flow Cross K-Function (115 detected type B spatial flows).
Further, we used simulated dataset 3 to test the effect of the significance level on the proposed method. Ten significance levels (ranging from 0.01 to 0.1 with step size 0.01) were selected for the simulated datasets. The number of type B spatial flows that were significantly spatially associated with nearby type A spatial flows is displayed in Figure 5 (the scale is 300 m). One can see that the number increases as the significance level increases. However, the increase is not significant.
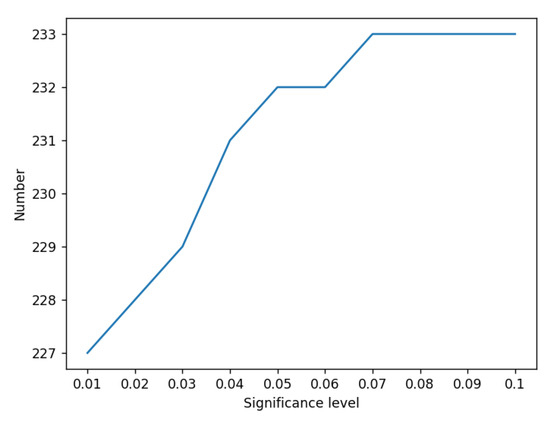
Figure 5.
Results of different significance levels.
4. Case Study: Identifying Competition Patterns between Taxi and Ride-Hailing Services
With the rapid development of mobile Internet technologies, ride-hailing services have become increasingly popular in recent years. The continued growth of ride-hailing usage leads to strong competition between taxi and ride-hailing services. Detecting spatial associations between these two services could promote a better understanding of the competition patterns between different transportation services and can provide a reference for policymakers [35,36].
4.1. Data Description
The taxi and ride-hailing service datasets in Xiamen, Fujian Province, China were used in the case study. There were six districts in the study area (Figure 6). To detect bivariate spatial flow patterns, taxi and ride-hailing service datasets during the morning peak period (8:00–10:00) were collected on 4 June 4 2019 (Tuesday). Figure 7 displays the spatial distribution of these two datasets in the whole study area: the taxi service dataset contains 29,222 spatial flows and the ride-hailing service dataset contains 53,135 spatial flows. As one can see, the spatial distribution of both types of flows is roughly the same; both types are mainly located in the Huli, Siming, Jimei, and Haicang districts. Moreover, a significant number of flows due to ride-hailing are located in the Tongan and Xiangan districts, while only a small fraction of taxi flows is located in these two districts. We selected ten network-constrained scales (range 200 m to 2000 m with step size 200 m) in the case study. The number of Monte Carlo simulations was set to 999, and the significance level α was set to 0.05.
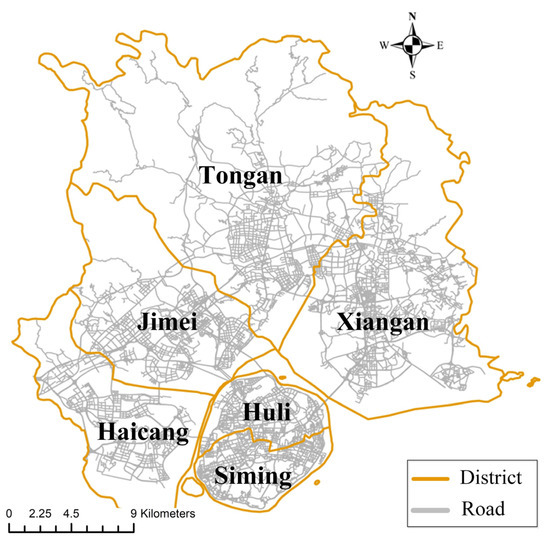
Figure 6.
Study area.
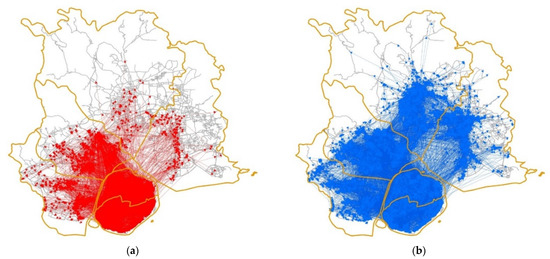
Figure 7.
Spatial distribution of taxi flows and ride-hailing flows: (a) taxi flows; (b) ride-hailing flows.
4.2. Results of Global Version
Figure 6 shows the detected bivariate spatial flow patterns by the global Geographically Weighted Flow Cross K-Function. It can be observed that the values of GWFKtaxi,ride-hailing are below the lower envelope across all the scales, which means that taxis tend to be located far away from ride-hailing (Figure 8a). In Figure 8b, the values of GWFKride-hailing,taxi are below the lower envelope when the scales are smaller than 800 m, which indicates that ride-hailing tends to be dispersed far away from taxis. When the scales increase, the values of GWFKride-hailing,taxi are above the upper envelope, meaning that ride-hailing may face competition from taxis when the scale is greater than 1000 m. The results of the global Geographically Weighted Flow Cross K-Function indicate that the spatial association between taxis and ride-hailing is weak. As one can see, the values of GWFKtaxi,ride-hailing and GWFKride-hailing,taxi usually are below the lower envelope. The reason may be that spatial flows and their nearby flows tend to be of the same type, i.e., both taxis and ride-hailing have their own exclusive markets.
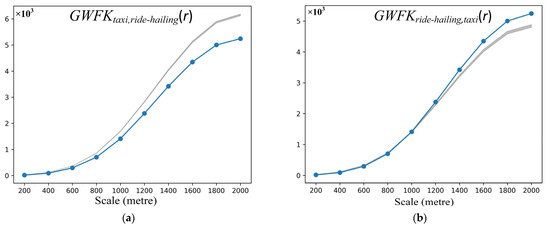
Figure 8.
Results of global geographically weighted Flow Cross K-Function: (a) spatial association between taxi and ride-hailing; (b) spatial association between ride-hailing and taxi.
4.3. Results of Local Version
The local Geographically Weighted Flow Cross K-Function was used to identify where the strong spatial associations occur. Figure 9 shows the percentage of taxi/ride-hailing flows that exhibit strong spatial associations with nearby ride-hailing/taxi flows. Both percentages increase with the increase in scale. When the scale is small, only a few spatial flows of taxis and ride-hailing exhibit strong spatial associations, which might suggest that competition usually exists between services of the same type. The percentage of taxi flows is less sensitive to the scale than ride-hailing flows. Even at a scale of 2000 m, only a fraction (0.08) of the taxi flows is spatially associated with nearby ride-hailing flows, which may indicate that the spatial range of exclusive markets of taxis is relatively large. This suggests that taxis may be competing more with themselves than with ride-hailing.
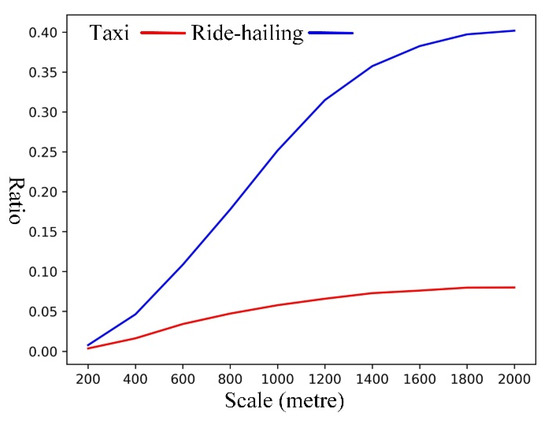
Figure 9.
The percentage of flows that exhibit strong spatial associations.
To further reveal where the competition occurs, the spatial flows of taxis and ride-hailing that exhibit strong spatial associations at a relatively small scale (800 m) are displayed in Figure 10. The local Geographically Weighted Flow Cross K-Function detected some spatial flows (1384 taxi flows and 9599 ride-hailing flows) that were spatially associated with nearby spatial flows of the other type. The detected spatial flows can be seen as ‘outliers’, because these spatial flows do not follow the global trend. Both detected taxi and ride-hailing flows are mainly located in Huli and Siming, meaning that, compared with other districts, competition between taxi services and ride-hailing services is fiercer in the Huli and Siming districts. There are also some detected spatial flows located in the Jimei and Haicang districts. For example, many taxis face competition from ride-hailing around Xiamen North Railway Station.
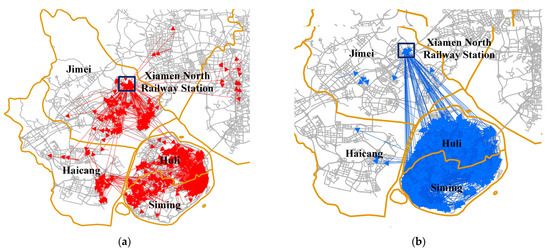
Figure 10.
Results of local Geographically Weighted Flow Cross K-Function at the scale of 800 m: (a) taxi; (b) ride-hailing.
Figure 11 shows the top 200 flows of each type with the highest values of the local Geographically Weighted Flow Cross K-Function at the scale of 800 m. As shown in Figure 9, we roughly identified the origin/destination regions of these flows (the ellipse represents the origin regions and the rectangle represents the destination regions) for the analysis of the detected spatial associations. Origin points in regions 1 and 2 are in residential areas, and destination points in regions 3 and 4 are in workplaces (Guanyinshan International Business Center). These spatial flows may suggest that taxi services are facing competition in the daily commuting market from ride-hailing services. Origin points in regions 5 and 6 are in residential areas, and destination points in regions 7 and 8 are in workplaces, while destination points in regions 8 and 9 are near transportation hubs (Xiamen Railway Station and Dongdu Wharf). These spatial flows may indicate that when city residents travel to transportation hubs, ride-hailing services face competition from taxi services.
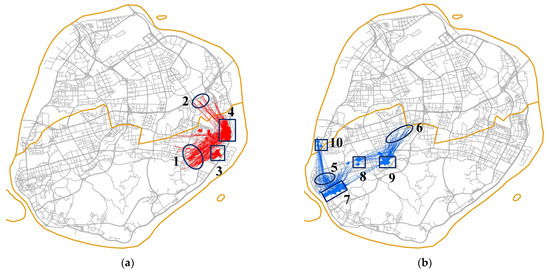
Figure 11.
Example flows that exhibit strong spatial associations: (a) taxi; (b) ride-hailing.
5. Conclusions
In this study, we developed a Geographically Weighted Cross K-Function to identify spatial associations between two types of network-constrained spatial flows. Two versions were developed: the global version measures the overall spatial association and the local version identifies the exact locations where spatial associations occur. To detect bivariate spatial flow patterns on road networks more accurately, we used the network-constrained distance as the distance measurement, rather than the Euclidean distance. To take the effect of distance decay into account, the values of the Flow Cross K-Function were calculated based on the geographically weighted number of nearby flows of the other type. The results of experiments using simulated datasets demonstrated that the proposed method can detect predefined bivariate patterns correctly. The case study showed that the method could identify competition patterns between taxi and ride-hailing services effectively.
It should be noted that the proposed method is only designed to detect spatial associations, and it cannot capture the dynamic patterns of spatial associations. In future work, the Geographically and Temporally Weighted Cross K-Function of spatial flows should be developed to detect the dynamic patterns of spatial associations. Moreover, the time cost of the proposed method is high because the calculation of the network-constrained mean distance is applied as the flow distance measurement, and the Monte Carlo simulation method is used to evaluate the statistical significance of detected spatial associations. A parallel version of the Geographically Weighted Flow Cross K-Function should be developed in the future.
Author Contributions
Conceptualization, W.Z. and H.X.; methodology, W.L.; validation, J.Z., Z.T. and H.X.; formal analysis, Z.T.; investigation, W.Z.; resources, Z.T.; data curation, W.L.; writing—original draft preparation, W.Z.; writing—review and editing, H.X.; visualization, W.L.; supervision, W.L. and H.X.; project administration, H.X.; funding acquisition, H.X. All authors have read and agreed to the published version of the manuscript.
Funding
This research was funded through support from the National Natural Science Foundation of China (NSFC) (No. 41971406 and 42271470), the Guangdong Basic and Applied Basic Research Foundation (No. 2022A1515011586), the Scientific and Technological Plan of Guangdong Province, China (No. 2019B090905005), and the Marine Economy Development Foundation of Guangdong Province (No. GDNRC[2022]21).
Institutional Review Board Statement
Not applicable.
Informed Consent Statement
Not applicable.
Data Availability Statement
Not applicable.
Conflicts of Interest
The authors declare no conflict of interest.
References
- van Tubergen, F.; Maas, I.; Flap, H. The Economic Incorporation of Immigrants in 18 Western Societies: Origin, Destination, and Community Effects. Am. Sociol. Rev. 2004, 69, 704–727. [Google Scholar] [CrossRef]
- Gao, Y.; Li, T.; Wang, S.; Jeong, M.-H.; Soltani, K. A Multidimensional Spatial Scan Statistics Approach to Movement Pattern Comparison. Int. J. Geogr. Inf. Sci. 2018, 32, 1304–1325. [Google Scholar] [CrossRef]
- Sang, S.; O’Kelly, M.; Kwan, M.-P. Examining Commuting Patterns: Results from a Journey-to-Work Model Disaggregated by Gender and Occupation. Urban Stud. 2011, 48, 891–909. [Google Scholar] [CrossRef]
- Shu, H.; Pei, T.; Song, C.; Chen, X.; Guo, S.; Liu, Y.; Chen, J.; Wang, X.; Zhou, C. L-Function of Geographical Flows. Int. J. Geogr. Inf. Sci. 2021, 35, 689–716. [Google Scholar] [CrossRef]
- Guo, B.; Pei, T.; Song, C.; Shu, H.; Wu, M.; Guo, S.; Jiang, J.; Du, P. Trend Surface Analysis of Geographic Flows. Int. J. Geogr. Inf. Sci. 2022, 1–20. [Google Scholar] [CrossRef]
- Xu, Y.; Li, J.; Belyi, A.; Park, S. Characterizing Destination Networks through Mobility Traces of International Tourists—A Case Study Using a Nationwide Mobile Positioning Dataset. Tour. Manag. 2021, 82, 104195. [Google Scholar] [CrossRef]
- Zhang, H.; Zhou, X.; Tang, G.; Zhang, X.; Qin, J.; Xiong, L. Detecting Colocation Flow Patterns in the Geographical Interaction Data. Geogr. Anal. 2022, 54, 84–103. [Google Scholar] [CrossRef]
- Murray, A.T.; Liu, Y.; Rey, S.J.; Anselin, L. Exploring Movement Object Patterns. Ann. Reg. Sci. 2012, 49, 471–484. [Google Scholar] [CrossRef]
- Cai, J.; Kwan, M.-P. Discovering Co-Location Patterns in Multivariate Spatial Flow Data. Int. J. Geogr. Inf. Sci. 2022, 36, 720–748. [Google Scholar] [CrossRef]
- Zhang, X.; Xu, Y.; Tu, W.; Ratti, C. Do Different Datasets Tell the Same Story about Urban Mobility—A Comparative Study of Public Transit and Taxi Usage. J. Transp. Geogr. 2018, 70, 78–90. [Google Scholar] [CrossRef]
- Tao, R.; Thill, J.-C. Flow Cross K-Function: A Bivariate Flow Analytical Method. Int. J. Geogr. Inf. Sci. 2019, 33, 2055–2071. [Google Scholar] [CrossRef]
- Shu, H.; Pei, T.; Song, C.; Chen, J.; Chen, X.; Guo, S.; Liu, Y.; Wang, X.; Wang, X.; Zhou, C. Density-Based Clustering for Bivariate-Flow Data. Int. J. Geogr. Inf. Sci. 2022, 36, 1809–1829. [Google Scholar] [CrossRef]
- Liu, Y.; Tong, D.; Liu, X. Measuring Spatial Autocorrelation of Vectors. Geogr. Anal. 2015, 47, 300–319. [Google Scholar] [CrossRef]
- Tao, R.; Thill, J.-C. Spatial Cluster Detection in Spatial Flow Data. Geogr. Anal. 2016, 48, 355–372. [Google Scholar] [CrossRef]
- Kan, Z.; Kwan, M.-P.; Tang, L. Ripley’s K-Function for Network-Constrained Flow Data. Geogr. Anal. 2022, 54, 769–788. [Google Scholar] [CrossRef]
- Zhu, X.; Guo, D. Mapping Large Spatial Flow Data with Hierarchical Clustering. Trans. GIS 2014, 18, 421–435. [Google Scholar] [CrossRef]
- Yao, X.; Zhu, D.; Gao, Y.; Wu, L.; Zhang, P.; Liu, Y. A Stepwise Spatio-Temporal Flow Clustering Method for Discovering Mobility Trends. IEEE Access 2018, 6, 44666–44675. [Google Scholar] [CrossRef]
- Xiang, Q.; Wu, Q. Tree-Based and Optimum Cut-Based Origin-Destination Flow Clustering. ISPRS Int. J. Geo-Inf. 2019, 8, 477. [Google Scholar] [CrossRef]
- Song, C.; Pei, T.; Shu, H. Identifying Flow Clusters Based on Density Domain Decomposition. IEEE Access 2020, 8, 5236–5243. [Google Scholar] [CrossRef]
- Liu, Q.; Yang, J.; Deng, M.; Song, C.; Liu, W. SNN_flow: A Shared Nearest-Neighbor-Based Clustering Method for Inhomogeneous Origin-Destination Flows. Int. J. Geogr. Inf. Sci. 2022, 36, 253–279. [Google Scholar] [CrossRef]
- Ripley, B.D. Modelling Spatial Patterns. J. R. Stat. Soc. Ser. B Methodol. 1977, 39, 172–192. [Google Scholar] [CrossRef]
- Tao, R.; Thill, J.-C. BiFlowLISA: Measuring Spatial Association for Bivariate Flow Data. Comput. Environ. Urban Syst. 2020, 83, 101519. [Google Scholar] [CrossRef]
- Liu, Q.; Yang, J.; Deng, M.; Liu, W.; Xu, R. BiFlowAMOEBA for the Identification of Arbitrarily Shaped Clusters in Bivariate Flow Data. Int. J. Geogr. Inf. Sci. 2022, 36, 1784–1808. [Google Scholar] [CrossRef]
- Cromley, R.G.; Hanink, D.M.; Bentley, G.C. Geographically Weighted Colocation Quotients: Specification and Application. Prof. Geogr. 2014, 66, 138–148. [Google Scholar] [CrossRef]
- Lu, B.; Charlton, M.; Harris, P.; Fotheringham, A.S. Geographically Weighted Regression with a Non-Euclidean Distance Metric: A Case Study Using Hedonic House Price Data. Int. J. Geogr. Inf. Sci. 2014, 28, 660–681. [Google Scholar] [CrossRef]
- Yu, W.; Ai, T.; He, Y.; Shao, S. Spatial Co-Location Pattern Mining of Facility Points-of-Interest Improved by Network Neighborhood and Distance Decay Effects. Int. J. Geogr. Inf. Sci. 2017, 31, 280–296. [Google Scholar] [CrossRef]
- Wang, F.; Hu, Y.; Wang, S.; Li, X. Local Indicator of Colocation Quotient with a Statistical Significance Test: Examining Spatial Association of Crime and Facilities. Prof. Geogr. 2017, 69, 22–31. [Google Scholar] [CrossRef]
- Li, L.; Cheng, J.; Bannister, J.; Mai, X. Geographically and Temporally Weighted Co-Location Quotient: An Analysis of Spatiotemporal Crime Patterns in Greater Manchester. Int. J. Geogr. Inf. Sci. 2022, 36, 918–942. [Google Scholar] [CrossRef]
- Ripley, B.D. The Second-Order Analysis of Stationary Point Processes. J. Appl. Probab. 1976, 13, 255–266. [Google Scholar] [CrossRef]
- Spooner, P.G.; Lunt, I.D.; Okabe, A.; Shiode, S. Spatial Analysis of Roadside Acacia Populations on a Road Network Using the Network K-Function. Landsc. Ecol. 2004, 19, 491–499. [Google Scholar] [CrossRef]
- Groff, E.R.; Weisburd, D.; Yang, S.-M. Is It Important to Examine Crime Trends at a Local “Micro” Level?: A Longitudinal Analysis of Street to Street Variability in Crime Trajectories. J. Quant. Criminol. 2010, 26, 7–32. [Google Scholar] [CrossRef]
- Wilson, B.S.; Steinberg, S.L.; Liederman, K.; Pfeiffer, J.R.; Surviladze, Z.; Zhang, J.; Samelson, L.E.; Yang, L.-H.; Kotula, P.G.; Oliver, J.M. Markers for Detergent-Resistant Lipid Rafts Occupy Distinct and Dynamic Domains in Native Membranes. Mol. Biol. Cell 2004, 15, 2580–2592. [Google Scholar] [CrossRef] [PubMed]
- Yue, H.; Zhu, X.; Ye, X.; Guo, W. The Local Colocation Patterns of Crime and Land-Use Features in Wuhan, China. ISPRS Int. J. Geo-Inf. 2017, 6, 307. [Google Scholar] [CrossRef]
- Anselin, L.; Li, X. Operational Local Join Count Statistics for Cluster Detection. J. Geogr. Syst. 2019, 21, 189–210. [Google Scholar] [CrossRef]
- Bai, J.; Tang, C.S. Can Two Competing On-Demand Service Platforms Be Profitable? Int. J. Prod. Econ. 2022, 108672. [Google Scholar] [CrossRef]
- Zhong, Y.; Yang, T.; Cao, B.; Cheng, T.C.E. On-Demand Ride-Hailing Platforms in Competition with the Taxi Industry: Pricing Strategies and Government Supervision. Int. J. Prod. Econ. 2022, 243, 108301. [Google Scholar] [CrossRef]


Publisher’s Note: MDPI stays neutral with regard to jurisdictional claims in published maps and institutional affiliations. |
© 2022 by the authors. Licensee MDPI, Basel, Switzerland. This article is an open access article distributed under the terms and conditions of the Creative Commons Attribution (CC BY) license (https://creativecommons.org/licenses/by/4.0/).