Article

Evolution of Performance Indicators in Soccer during the Last Decade

by
José Fernández-Cortés
1,
Miguel Angel Gómez-Ruano
2,
David Mancha-Triguero
3,
Sergio J. Ibáñez
1,* and
Javier García-Rubio
1,*
1
Group for Optimization of Training and Sport Performance (GOERD), Faculty of Sport Science, University of Extremadura, 06006 Badajoz, Spain
2
Department of Social, Physical Activity, Sport and Leisure Sciences, Faculty of Physical Activity and Sport Sciences (INEF), 28040 Madrid, Spain
3
Department of Physical Education and Sport, Cardenal Spínola CEU Andalucía University, 41930 Sevilla, Spain
*
Authors to whom correspondence should be addressed.
Appl. Sci. 2022, 12(24), 12834; https://doi.org/10.3390/app122412834
Submission received: 16 November 2022 / Revised: 7 December 2022 / Accepted: 12 December 2022 / Published: 14 December 2022

Abstract

:
Due to the worldwide negative impact on sport of the COVID-19 pandemic declared by the WHO in 2020, the first aim of this study was to analyze the influence of COVID-19 on performance indicators as a natural experiment, according to the moment in time: pre-COVID, COVID and post-COVID. The second aim was to analyze and ascertain the persistence of the performance indicators (PIs) over the analyzed seasons. To this end, 5320 teams’ match data corresponding to the 2014/2015 to 2020/2021 seasons of the LaLiga (first division of Spanish men’s soccer) were analyzed. All the seasons developed normally except the 2019/2020 season in which there was a three-month hiatus because of the COVID-19 pandemic, representing a natural experiment without spectators. Statistical tests including ANOVA, general multivariate linear analysis with three independent variables (covidtime, venue and result) and an autocorrelation were performed. The results obtained showed that there were significant differences in the PIs regarding the moment in time, the result, the venue, and the pairwise interactions among them. The evolution of the PIs has changed over the years, showing a decrease in the means of most of them, leading to a more passive game with tighter results; differences which could be generated by the change in the rules (from 3 to 5 substitutions), the total or partial absence of spectators, three months of confinement and inactivity, or the accumulation of matches and minutes played by the individual players. The teams’ technical staffs should bear all of these types of situations in mind as the seasons evolve to adapt as quickly as possible to a more effective game style in order to achieve objectives.

1. Introduction

The analysis of performance indicators (PIs) is one of the emerging lines of research in sport sciences [1]. Using notational analysis, different game indicators have been recorded that make it possible to study the performance of the teams and players during the competition. A series of situational variables has been identified that affect performance indicators such as: playing at home [2], being ahead on the scoreboard [3], the partial and final result [4], the quality of the opposition [5], and the competition phase [6], among others.
The events provoked worldwide by COVID-19 have also affected the sport context, making it necessary to study the influence of this variable on PIs. The COVID-19 pandemic declared by the WHO on 11 March 2020 affected everyone’s life both physically and psychologically. This disease, together with the severe measures of confinement in most of the world, brought the suspension of men’s and women’s competitions in all sports. All those who are professionally dedicated to sport, both at the individual and collective level, were affected at the psychological level during and after the pandemic, which caused unprecedented harm [7].
This exceptional circumstance provided a natural experimental situation in the sport context. The return to sport practice at the top level was accomplished without the presence of spectators as a security measure. Studies on the presence of spectators and their influence on the home advantage have a long history [8]. However, the available research investigating how the absence of spectators can affect the behavior of teams and players in their sport performance and the results of the competition is scarce. In particular, the research focused on soccer showed a negative impact when returning to play, due to the accumulation of matches, and the accumulation of minutes played in a short space of time for the players, after several months with minimal training; the teams were also very uncertain as to the psychological status of each player [9]. Then, in order to continue with the competition, it was decided to adopt several measures: to be able to make up to five substitutions in three different blocks during the match, in order to distribute the minutes among all the players on the team, thus obtaining a lower physical load; and it was also decided to have no spectators, so that there would not be large crowds in the same place during a short period of time and so that the numbers of infected people would not soar.
Some studies such as that by Villaseca-Vicuña et al. [10] stated that the compulsory confinement negatively affected women players in terms of their level of well-being, and the technical staffs had to work much more to monitor individual players and teams so that the absence of normality affected them as little as possible, and did not imply a loss of performance.
In addition, the soccer referees have an essential role on the playing field, and when in a situation of having no spectators, they are witness to any inappropriate comment from the players or technical staff. This can change their behavior or way of working and influence their decision making, which would be different with stadiums full of supporters and the noise that entails. All these decisions, together with the severe restrictions that the referees had to adopt following the competition norms, which caused them to be isolated to a large degree without contact with their relatives or friends as they would normally have had, meant that they were influenced and affected when making decisions during their refereeing [11]. The decision making of the referees in matches without spectators was less favorable to the home team [12].
During the 2018–2019 season, there was the inclusion of a regulatory modification that can directly affect the development of the game. This is the VAR (Video Assistant Referee). This tool aims to help the main referee during his intervention to avoid serious and manifest errors during the match. Its application occurs in very specific situations, such as: goals and infractions leading to goals; decisions on penalties and infractions leading to such decisions; direct red cards; mistaken identity. Its application during the 2018 FIFA World Cup has meant a technological revolution in professional soccer, with this technology being implemented in more than one hundred competitions. The influence of the application of this tool is beginning to be studied. Lago-Peñas et al. [13] demonstrated that the VAR system did not substantially modify the form of play in professional soccer. They identified a decrease in the number of offsides, fouls and yellow cards, as well as an increase in the number of minutes added to playing time in the first half and full match, but not in the second half.
Regarding the home advantage, the percentage of points won by the home teams is over 50% in different leagues worldwide [14]. Territoriality has been shown in the protective response that the team presents when playing at home to defend its own territory, consequently increasing its probability of winning more points at home than when playing away [15]. Differences have been found in the different PIs in favor of the home team in the first division of men’s soccer in Spain [2]. These differences are evident in the German league, whether the teams play with or without their fans, and there is also a tendency to play worse at home and better away when spectators are not present [16]. In particular, the teams committed more fouls after the pandemic, the home teams scored more goals in the second half of the matches before the pandemic, and the home advantage decreased, thus the return to competition in the absence of spectators had a considerable effect [17].
Lastly, the different situational variables acquired a great deal of importance during a match and throughout the championship [18]. Thus, the venue and result are variables that directly affect the players. The support of the spectators and a greater effort on the part of the local team when they have an unfavorable result are important for reaching a tie or getting back into the match. Zajonc’s theory of social facilitation (1965) [19] and the theory of territoriality [15] help to justify the importance of the spectators for the home advantage in team sports.
After analyzing the theoretical framework, it is hypothesized that there will be changes in performance indicators depending on the time point analyzed: pre-COVID, COVID and post-COVID. Furthermore, it is hypothesized that, despite the variations that may exist depending on the period of time analyzed, there will be permanent performance indicators. The prior literature that analyzes the evolution of performance indicators in soccer, bearing in mind the influence that COVID may have had, is limited. Thus, the first aim of this research was to analyze the influence of COVID-19 on performance indicators in the Spanish first division of men’s soccer depending on the moment in time: pre-COVID, COVID and post-COVID. The second aim was to analyze and ascertain the persistence of the PIs during the analyzed seasons.

2. Materials and Methods

This is an empirical descriptive study that made a quantitative analysis of the data [20] and used an arbitrary observational code to collect them from previously constructed notational recordings. Moreover, the research is ex post facto and natural as it was carried out in a natural context in which there was no type of intervention in the analyzed events [21].

2.1. Sample

The data sample was composed of 5320 teams’ match data corresponding to seven seasons (2014/2015 to 2020/2021) of the Spanish LaLiga (first division of men’s soccer). All the seasons were developed normally except the 2019/2020 season, in which there was a hiatus of three months due to the COVID-19 pandemic. A total of 2660 matches were included during the seven seasons. In each match, two cases were recorded, corresponding to the information on each of the participating teams. The data were taken from the official Spanish LaLiga website and contrasted with four different official websites to minimize errors.

2.2. Variables

The independent variables were the moment regarding COVID-19 (before, during and after the pandemic), the match venue (home and away) and the result (win, tie and lose).
The dependent variables analyzed were grouped into six categories (see Table 1). All the variables are defined using the FIFA rules (2021).

2.3. Procedure

The coding system was based on the results of seven seasons (data collected from the official website of the LaLiga competition and a reference portal). An intra-observer agreement analysis was performed to guarantee that the data were introduced correctly. The agreement found in all the recorded variables can be considered “almost perfect” [22] as Cohen’s kappa coefficient values of over 0.83 were obtained. Moreover, situational information was also borne in mind such as the COVID moment related to the seasons, considering pre-COVID, COVID and post-COVID.
An analysis was made in the first phase of the research to identify and select the different variables that could affect the result of the match before, during and after the pandemic. An ANOVA was conducted to identify the differences among the seasons, finding that there were none among the first five seasons. The observations were considered as independent sampling units, assuming that the PIs were shown independently through the presence of a situational variable that conditioned the behavior of the teams and players. Thus, a new variable was created called “covidtime” in which it was decided to include the first five seasons (pre-COVID).

2.4. Statistical Analysis

First, a descriptive analysis was performed using Crosstab’s Command to show the distribution of the cases among the different variables. An ANOVA was conducted of the seven seasons to identify if there were differences among them, using Bonferroni’s post-hoc test. Faced with the inexistence of significant differences among the first five seasons, it was decided to group them into a single category (pre-COVID). Second, a general multivariate analysis was carried out considering three independent variables: covidtime, venue and result. The observed power was calculated to determine the possibilities of there being a type II error. The reference values for the observed power in this research were 0–0.2 low; 0.2–0.5 medium; 0.5–0.8 high; and >0.8 very high [23]. Effect sizes were obtained using partial eta squared (ηp2) and were interpreted as: ηp2 < 0.01 trivial, ηp2 = 0.01–0.06 low, ηp2 = 0.06–0.14 moderate and ηp2 > 0.14 high [23]. The level of significance was set at p < 0.05. Finally, an analysis was performed to discover the relationships that existed among the different variables over time, using an autocorrelation [24,25].
IBM SPSS version 26.0 (SPSS Inc., Chicago, IL, USA) was used to analyze the data.

3. Results

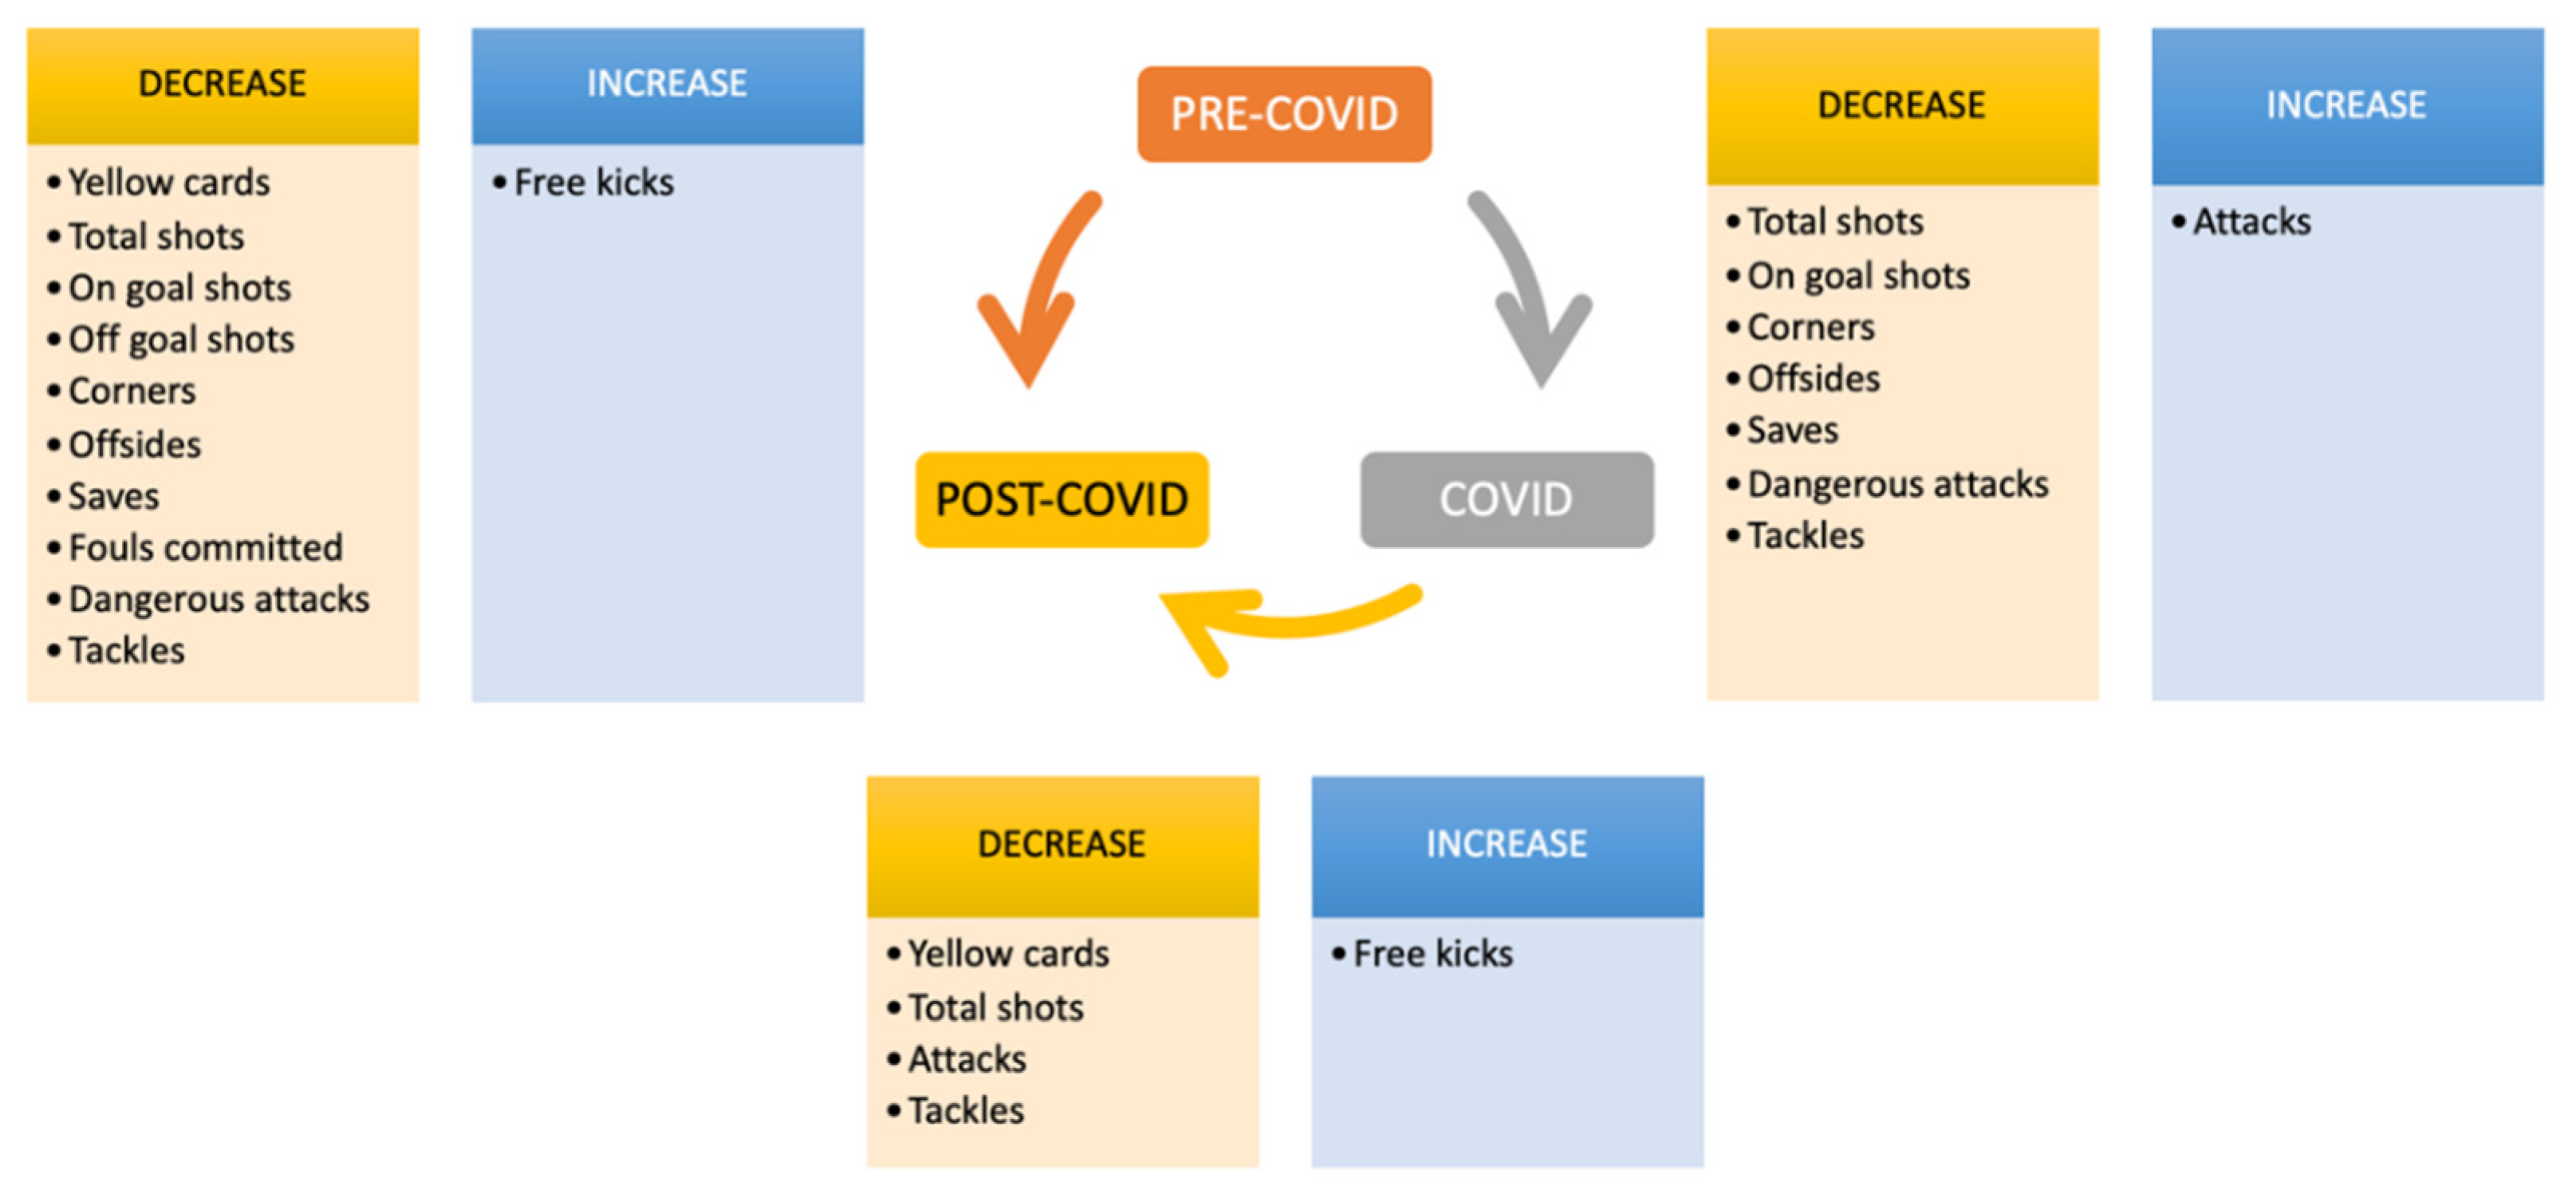
Table 2 shows the descriptive (mean and standard deviation) and inferential results of the influence of COVID on the different PIs. Significant differences were found in eight PIs of the pre-COVID and COVID seasons, with increasing attacks and decreasing total and on-goal shots, corners, offsides, saves, dangerous attacks and tackles. From the COVID season to the post-COVID season the different variables became more stabilized and significant differences were only found in five of them, with increasing free kicks and decreasing yellow cards, total shots, attacks, and tackles. The greatest change was shown in the pre-COVID/post-COVID comparison, with significant differences in eleven variables: increases in free kicks and decreases in yellow cards, total, on- and off-goal shots, corners, offsides, saves and fouls committed, dangerous attacks and tackles.
For the covidtime variable, significant differences were found in 11 of the 15 PIs: yellow cards, total, on-goal and off-goal shots, free kicks, corners, offsides, saves, attacks, dangerous attacks, and tackles.
Figure 1 presents a visualization of the differences found in the three COVID moments analyzed.
Table 3 shows the descriptive (mean and standard deviation) and inferential results of the influence of venue on the different PIs. Significant differences were found in 11 of the 15 indicators: possession, total, on-goal and off-goal shots, corners, offsides, saves, attacks, dangerous attacks, total passes, and tackles.
Table 4 shows the descriptive (mean and standard deviation) and inferential results of the influence of the result on the different PIs, as well as the differences among groups.
For the result variable, differences were found in 12 of the 15 PIs: yellow cards, red cards, total, on-goal and off-goal shots, free kicks, corners, offsides, saves, attacks, dangerous attacks, and total passes.
Table 5 shows the inferential results of the interaction of the independent variables with the PIs. No significant differences were found in the interaction among the three independent variables; thus, the table just presents the differences in the interaction between pairs of variables, only showing the PIs that revealed significant differences.
Regarding the covidtime–venue interaction, significant differences were found in 7 out of the 15 PIs: total, on-goal and off-goal shots, corners, saves, attacks and dangerous attacks. The covidtime–result interaction revealed significant differences in 4 out of the 15 PIs: possession, off-goal shots, dangerous attacks and total passes. The venue–result interaction revealed significant differences in 4 out of the 15 PIs: yellow cards, free kicks, offsides and fouls committed.
In the covidtime–venue interaction, on-goal shots and attacks had a high observed power (0.5–0.8), with the rest of the indicators having a very high observed power (>0.8). In the covidtime–result interaction, the variables of possession, off-goal shots, dangerous attacks and total passes had very high observed power (>0.8). In the venue–result interaction, the variables of yellow card and offsides had a high observed power (0.5–0.8), while for free kicks and fouls committed it was very high (>0.8).
Table 6 presents the results of the autocorrelations of the PIs, showing significant differences in 13 of them, but not in 2.
Figure 2 presents the significant differences existing in the performance indicators over the different seasons. Yellow and red cards, total, on-goal and off-goal shots, free kicks, corners, saves, attacks, dangerous attacks, total passes and tackles have a low autocorrelation, while possession has a high autocorrelation [26]. The means for yellow and red cards, free kicks and tackles increase as the seasons advance, as they have a positive autocorrelation; while in contrast, possession, total, on-goal and off-goal shots, corners, saves, attacks, dangerous attacks, and total passes have a negative autocorrelation, which indicates that their means decrease over the seasons.

4. Discussion

The first aim of this research was to investigate the influence of the time of COVID on the PIs in the first division of Spanish men’s soccer. Differences were found among the three variables (pre-COVID, COVID and post-COVID) with pre-COVID and post-COVID being the two moments that revealed a considerable increase in changes, with differences identified in up to eleven PIs. Furthermore, regarding the second aim to analyze the persistence of the PIs during the seasons studied, they showed a decrease with the passing of the seasons. In this natural experiment, differences were found in the PIs among the three moments in time, showing a modification in the game after the changes in the rules provoked by COVID. Most of the PIs decreased as the seasons advanced, affecting both the game style and the results of the matches, which have been tighter with fewer goals.

4.1. Differences in Pre-COVID–COVID PIs

The results obtained showed increased attacks and decreases in the variables of total and on-goal shots, corners, offsides, saves, dangerous attacks and tackles. The PIs had high or very high observed power, which indicates high reliability in the obtained results. In line with these findings, Villaseca-Vicuña, Pérez-Contreras, Merino-Muñoz, González-Jurado and Aedo-Muñoz [10] indicate that compulsory confinement negatively affected women players in terms of their degree of well-being, and the absence of spectators permitted greater passivity in the teams, which performed fewer offensive and aggressive actions. Wunderlich, Weigelt, Rein and Memmert [8] confirmed that during the pandemic there were fewer shots and thus the home advantage decreased in top leagues such as the German Bundesliga [27]. The game change that occurred from before the pandemic to the COVID season was revealed in a decrease in aggressiveness in the game. The absence of spectators limited the pressure on the players to attack and please the fans, allowing them to play in a more conservative manner. Teams should try to take advantage and optimize their own PIs to the maximum and decrease the means of the rival’s PIs to achieve positive results, and because, as the games are tighter, the goals have more importance.

4.2. Difference of the COVID–Post-COVID PIs

The results obtained showed significant differences during the COVID-19 season and the following one, with an increase in free kicks and a decrease in yellow cards, total shots, attacks and tackles. All the PIs had a very high observed power, and therefore the obtained results had a high level of reliability. In line with these findings, Santana, Bettega and Dellagrana [17] indicated that teams committed more fouls after the pandemic. Although there were more fouls, the incidence of muscular injuries did not significantly change in Italian professional soccer players, which is information that could be crucial to analyzing the type of foul committed, as they presented less aggressiveness [28]. A conservative style of play was maintained, with a change in the dynamics of play, being calmer, with a slower pace and with teams opting for more ball conservation. Knowing this tendency, teams should play more aggressively, given that there is a decrease in yellow cards and more positive results can be achieved without committing serious or very serious fouls.

4.3. Difference in the Pre-COVID–Post-COVID PIs

Considerable changes were evident in the evolution of the pre-COVID to post-COVID seasons, showing up to eleven PIs with significant differences, with an increase in free kicks and a decrease in yellow cards, total, on-goal and off-goal shots, corners, offsides, saves, fouls committed, dangerous attacks and tackles. The observed power of the PIs was high or very high, indicating the high reliability of the results obtained. In line with these findings, various authors have determined that several factors are relevant such as the support of the spectators [29,30], referee bias [31], and the physical and psychological state of the professional players, both once they had contracted the virus and after a few weeks [9]. The change from crowded stadiums (pre-COVID) to empty or half-empty stadiums (post-COVID) was crucial with regard to these PIs, as there was a tendency to play worse at home and better away when there were no spectators [16]. Referee bias has been determinant, because faced with the absence of spectators, any bad behavior or action led to a different referee’s decision compared to the one that would have been made with the presence of spectators, due to not witnessing the event owing to the noise or because of being more stimulated during the match. All these changes, together with the serious restrictions imposed on the referees during the competition so that they did not contract the virus, meant that they could have been unconsciously affected when making decisions [11].
The physical and psychological state of the players were negatively affected once the virus had been contracted and improved with the passing of the weeks. Dauty et al. [32] found that there was no change in performance in a population of adolescents, so age may have affected the recovery of players of a professional age. Game style has changed after the natural experiment of the pandemic. These changes in the game have caused, for the moment, a decrease in the performance indicators related to offensive and aggressive play. The teams attack less and tend to play a more conservative game.

4.4. Differences in PIs Regarding Venue

Differences were found in the results obtained with the home team having more possession and making more shots (total, on-goal and off-goal), corners, offsides, attacks, dangerous attacks and total passes, while the away team performed more saves and tackles. The performance indicators had a very high observed power, indicating that there was a high level of reliability in these findings. In line with these results, the percentage of home advantage was above 50% of the points won at home for the home team in different leagues [14]. Different performance indicators have given the advantage to the home team in the Spanish first division [2,33]. There was a tendency to play worse at home and better away with the absence of spectators, although the percentage of home wins did not vary in Spain and Germany [16]. Visiting teams should opt to try to emulate their play when they are at home, as the improvement achieved in the different performance indicators will bring them closer to winning.

4.5. Difference in the PIs Regarding Result

Significant differences were found in ten performance indicators between winning and tying, with the team that tied showing a higher mean in yellow cards, red cards, off-goal shots, free kicks and fouls committed, while the team that won had higher means in possession, total and on-goal shots, offsides and total passes. The results obtained showed significant differences in nine PIs between winning and losing, with the losing teams recording higher means in infractions (red and yellow cards) free kicks and saves, while the means of the winning teams were higher in possession, total and on-goal shots, offsides and total passes. Significant differences were found in six PIs between tying and losing with a higher mean in the tying teams for possession, total and on-goal shots, and offsides and, in contrast, lower means in red cards and saves. The observed power in the PIs was high and very high, which indicated the high level of reliability of the results obtained. In line with these findings, Gómez-Ruano et al. [34] stated that during a world championship, the winning teams were different from the losing teams in terms of PIs such as crosses, corners against and saves by the goalkeeper in balanced matches, while in unbalanced matches the only PI was crosses. Therefore, teams should train to make the maximum number of shots on goal, keep control of the ball in the rival’s half of the field more than the opponent and make more passes, as these PIs help to achieve victory.

4.6. Difference in PIs among Groups

Regarding covidtime–venue interactions, significant differences were found in total, on-goal and off-goal shots, corners, saves, attacks and dangerous attacks. Differences were identified for the covidtime–result in possession, off-goal shots, dangerous attacks and total passes; and for the venue–result interaction significant differences were found in yellow cards, free kicks, offsides and fouls committed. Over the seasons, the mean for stopped-ball play increased, while offensive situations and the home advantage decreased. In line with these findings, Ibanez, Garcia-Rubio, Gomez and Gonzalez-Espinosa [25] stated that modifications of the rules influence the PIs that the teams record during competition; the changes observed here were established due to a pandemic. Villaseca- Villaseca-Vicuña, Pérez-Contreras, Merino-Muñoz, González-Jurado and Aedo-Muñoz [10] indicated that the absence of spectators permitted greater passivity in teams, with decreases in offensive and aggressive actions. Wunderlich et al. (2021) [8] confirmed that during the pandemic fewer shots were made, and that is why the home advantage was reduced in top-level leagues such as the German Bundesliga [27]. Santana, Bettega and Dellagrana [17] indicated that teams committed more fouls after the pandemic. The change from stadiums full of supporters to ones that were empty or half empty caused a tendency to play worse at home and better away when there were no spectators [16]. Therefore, matches should be prepared and faced similarly when playing at home and away to try to improve the PIs when playing at home, and there is a clear need to train for stopped-ball situations, because free kicks increase, and they should be taken more advantage of given the decrease in offensive situations. Teams should work to be more cautious regarding referees’ decisions and not show abnormal behavior. Additionally, the technical staff should direct the sessions with the players who have contracted COVID to try to decrease recovery time so that they are in an optimal condition for being able to compete.

4.7. Autocorrelations

The results obtained indicated that significant differences existed in 13 of the 15 performance indicators, finding an increase in only four of them, while nine decreased over the seasons. In line with these findings, Ibanez, Garcia-Rubio, Gomez and Gonzalez-Espinosa [25] stated that changes in the rules of basketball have affected the way of playing, thus changing the PIs. This information is useful for coaches to be able to adapt their training to the changes in competition, as over time many PIs decrease. It should therefore be the coaches’ decision to work on an effective game style by increasing these indicators or decreasing those of the opponent.

5. Conclusions

This study analyzed how the worldwide pandemic and attendant situations have affected different PIs and the result in soccer matches.
Significant differences were found to be evolving in PIs over the different seasons—pre-COVID, COVID and post-COVID—due to the absence of spectators, referee bias, accumulation of matches, change in the rules (five substitutions during the match in three different blocks compared to the three allowed before) players’ physical and psychological state, etc.
Thus, the effect of the COVID-19 pandemic on the Spanish first division of men’s soccer generated an adaptation of play on the part of the teams, showing a decrease in offensive actions and a more passive game. Given these findings, teams should adapt their training to the current game demands, in which there are fewer goals. It is essential to work on stopped-ball plays as given the increase in such actions, they acquire considerable importance for the result.

6. Practical Applications and Limitations

The main practical applications that can be found for this research are as follows: (i) knowledge of the match indicators and how they have affected play before, during and after a worldwide pandemic; (ii) evolution of the match indicators over several seasons; (iii) influence of the PIs in the result with the absence or presence of supporters; (iv) knowledge of how a worldwide pandemic can affect teams’ playing styles.
The main limitation in this study is the difference in the number of matches analyzed before, during and after the pandemic, with a higher number of matches before. There is a lack of existing literature on these PIs in different top-level leagues. Due to the congested calendar after the three months of confinement, and the difficulties that this produced (disease or sport injury), there were teams that could not play normally.
One of the prospects that would allow the continuity of this work could be the study of the influence of VAR on performance indicators, as well as the influence of match status before, during and after the pandemic.

Author Contributions

Conceptualization, J.F.-C., J.G.-R. and S.J.I.; methodology, J.F.-C., M.A.G.-R., J.G.-R. and S.J.I.; formal analysis, J.F.-C., J.G.-R., M.A.G.-R., D.M.-T. and S.J.I.; investigation, J.F.-C.; resources, S.J.I.; writing—original draft preparation, J.F.-C. and D.M.-T.; writing—review and editing, M.A.G.-R., J.G.-R. and S.J.I.; visualization, J.F.-C. and D.M.-T.; supervision, J.G.-R. and S.J.I.; project administration, S.J.I.; funding acquisition, S.J.I. All authors have read and agreed to the published version of the manuscript.

Funding

This research received no external funding.

Institutional Review Board Statement

Not applicable.

Informed Consent Statement

Not applicable, as the data are freely available on the official competition websites. Furthermore, there has been no direct contact with the subjects from which the data originate.

Acknowledgments

This study has been partially subsidized by the Aid for Research Groups (GR21149) from the Regional Government of Extremadura (Department of Economy, Science and Digital Agenda), with a contribution from the European Union from the European Funds for Regional Development.

Conflicts of Interest

The authors declare no conflict of interest.

References

  1. Ramos Perez, D.; Castellano, J.; Hernandez-Mendo, A. Relationship between procedure and result indicators during a football season in the five major European leagues. E-Balonmano Com 2021, 17, 59–72. [Google Scholar]
  2. Fernandez-Cortes, J.; Escudero-Tena, A.; Garcia-Rubio, J.; Ibanez, S.J. The Importance of the Match Location in the Spanish la Liga Football League. J. Sport Health Res. 2020, 12, 285–293. [Google Scholar]
  3. Gómez-Ruano, M.A.; Serna, A.D.; Lupo, C.; Sampaio, J.E. Effects of Game Location, Quality of Opposition, and Starting Quarter Score in the Outcome of Elite Water Polo Quarters. J. Strength Cond. Res. 2016, 30, 1014–1020. [Google Scholar] [CrossRef]
  4. Brillinger, D.R. An analysis of Chinese Super League partial results. Sci. China Ser. A-Math. 2009, 52, 1139–1151. [Google Scholar] [CrossRef]
  5. Garcia-Rubio, J.; Angel Gomez, M.; Lago-Penas, C.; Ibanez, S.J. Effect of match venue, scoring first and quality of opposition on match outcome in the UEFA Champions League. Int. J. Perform. Anal. Sport 2015, 15, 527–539. [Google Scholar] [CrossRef]
  6. Gamonales, J.M.; Munoz Jimenez, J.; Mancha-Triguero, D.; Ibanez, S.J. The influence of the competition phase and the result of the match on the competitive demands in football 5-a-side for the visually impaired. Int. J. Perform. Anal. Sport 2021, 21, 1–11. [Google Scholar] [CrossRef]
  7. Park, J.-S.; Lee, E.-H.; Park, N.-R.; Choi, Y.H. Mental Health of Nurses Working at a Government-designated Hospital During a MERS-CoV Outbreak: A Cross-sectional Study. Arch. Psychiatr. Nurs. 2018, 32, 2–6. [Google Scholar] [CrossRef] [PubMed] [Green Version]
  8. Wunderlich, F.; Weigelt, M.; Rein, R.; Memmert, D. How does spectator presence affect football? Home advantage remains in European top-class football matches played without spectators during the COVID-19 pandemic. PLoS ONE 2021, 16, e0248590. [Google Scholar] [CrossRef]
  9. Wagemans, J.; Catteeuw, P.; Vandenhouten, J.; Jansen, J.; de Corte, X.; Ceusters, C.; Vissers, D. The Impact of COVID-19 on Physical Performance and Mental Health-A Retrospective Case Series of Belgian Male Professional Football Players. Front. Sport. Act. Living 2021, 13, 803130. [Google Scholar] [CrossRef]
  10. Villaseca-Vicuña, R.; Pérez-Contreras, J.; Merino-Muñoz, P.; González-Jurado, J.A.; Aedo-Muñoz, E. Effects of COVID-19 confinement measures on training loads and the level of well-being in players from Chile women’s national soccer team. Rev. Fac. Med. 2021, 69, e200. [Google Scholar] [CrossRef]
  11. Webb, T. The future of officiating: Analysing the impact of COVID-19 on referees in world football. Soccer Soc. 2021, 22, 12–18. [Google Scholar] [CrossRef]
  12. Reade, J.J.; Schreyer, D.; Singleton, C. Eliminating supportive crowds reduces referee bias. Econ. Inq. 2022, 60, 1416–1436. [Google Scholar] [CrossRef]
  13. Lago-Peñas, C.; Rey, E.; Kalén, A. How does Video Assistant Referee (VAR) modify the game in elite soccer? Int. J. Perform. Anal. Sport 2019, 19, 646–653. [Google Scholar] [CrossRef]
  14. Pollard, R.; Prieto, J.; Gomez, M.-A. Global differences in home advantage by country, sport and sex. Int. J. Perform. Anal. Sport 2017, 17, 586–599. [Google Scholar] [CrossRef]
  15. Neave, N.; Wolfson, S. Testosterone, territoriality, and the ‘home advantage’. Physiol. Behav. 2003, 78, 269–275. [Google Scholar] [CrossRef]
  16. Jimenez Sanchez, A.; Lavin, J.M. Home advantage in European soccer without crowd. Soccer Soc. 2021, 22, 152–165. [Google Scholar] [CrossRef]
  17. Santana, H.A.P.; Bettega, O.B.; Dellagrana, R.A. An analysis of Bundesliga matches before and after social distancing by COVID-19. Sci. Med. Footb. 2021, 5, 17–21. [Google Scholar] [CrossRef]
  18. Caballero, P.; Garcia-Rubio, J.; Jose Ibanez, S. Influence of situational variables on the U’ 18 soccer performance analysis. Retos-Nuevas Tend. Educ. Fis. Deporte Recreacion 2017, 32, 224–227. [Google Scholar]
  19. Zajonc, R.B. Social Facilitation. Science 1965, 149, 269–274. [Google Scholar] [CrossRef]
  20. Midgley, A.; Chrismas, B. Analysis of quantitative data. In Research Methods in Sports Coaching; Routledge: Abingdon, UK, 2014; pp. 132–146. [Google Scholar]
  21. Montero, I.; Leon, O.G. A guide for naming research studies in Psychology. Int. J. Clin. Health Psychol. 2007, 7, 847–862. [Google Scholar]
  22. Landis, J.R.; Koch, G.G. Measurement of Observer Agreement for Categorical Data. Biometrics 1977, 33, 159–174. [Google Scholar] [CrossRef] [PubMed] [Green Version]
  23. Cohen, J. The analysis of variance and covariance. In Statistical Power Analysis for the Behavioral Sciences; Routledge Academic: New York, NY, USA, 1988; pp. 273–406. [Google Scholar]
  24. Shafizadeh, M.; Taylor, M.; Lago Penas, C. Performance Consistency of International Soccer Teams in Euro 2012: A Time Series Analysis. J. Hum. Kinet. 2013, 38, 213–226. [Google Scholar] [CrossRef] [PubMed] [Green Version]
  25. Ibanez, S.J.; Garcia-Rubio, J.; Gomez, M.-A.; Gonzalez-Espinosa, S. The Impact of Rule Modifications on Elite Basketball Teams’ Performance. J. Hum. Kinet. 2018, 64, 181–193. [Google Scholar] [CrossRef] [PubMed] [Green Version]
  26. Field, A. Discovering Statistics Using SPSS, 3rd ed.; Sage: Londres, UK, 2009. [Google Scholar]
  27. Almeida, C.H.; Leite, W.S. Professional football in times of COVID-19: Did the home advantage effect disappear in European domestic leagues? Biol. Sport 2021, 38, 693–701. [Google Scholar] [CrossRef] [PubMed]
  28. Marotta, N.; Demeco, A.; Moggio, L.; Isabello, L.; Iona, T. Correlation between dynamic knee valgus and quadriceps activation time in female athletes. J. Phys. Educ. Sport 2020, 20, 2508–2512. [Google Scholar]
  29. Taylor, J.B.; Mellalieu, S.D.; James, N.; Shearer, D.A. The influence of match location, quality of opposition, and match status on technical performance in professional association football. J. Sport. Sci. 2008, 26, 885–895. [Google Scholar] [CrossRef]
  30. Anderson, M.; Wolfson, S.; Neave, N.; Moss, M. Perspectives on the home advantage: A comparison of football players, fans and referees. Psychol. Sport Exerc. 2012, 13, 311–316. [Google Scholar] [CrossRef]
  31. Sors, F.; Lourido, D.T.; Parisi, V.; Santoro, I.; Galmonte, A.; Agostini, T.; Murgia, M. Pressing Crowd Noise Impairs the Ability of Anxious Basketball Referees to Discriminate Fouls. Front. Psychol. 2019, 10, 2380. [Google Scholar] [CrossRef]
  32. Dauty, M.; Grondin, J.; Daley, P.; Louguet, B.; Menu, P.; Fouasson-Chailloux, A. Consequences of the SARS-CoV-2 Infection on Anaerobic Performances in Young Elite Soccer Players. Int. J. Environ. Res. Public Health 2022, 19, 6418. [Google Scholar] [CrossRef]
  33. Fernandez-Cortes, J.; Gustavo Mandly, M.; Garcia-Rubio, J.; Ibanez, S.J. Contribution of professional basketball players according to the specific position and the competition phase. E-Balonmano Com 2021, 17, 223–232. [Google Scholar]
  34. Gómez-Ruano, M.A.; Gómez-López, M.T.; Jiménez-Sáiz, S.L. Diferencias entre equipos ganadores y perdedores de fútbol en función del tipo de partido mediante el estudio de indicadores de rendimiento. Rev. Euroam. Cienc. Deporte 2013, 2, 37–41. [Google Scholar]
Figure 1. Influence of COVID on PIs.
Applsci 12 12834 g001
Figure 2. Autocorrelations of the PIs.
Applsci 12 12834 g002
Table 1. Study dependent variables.
CategoriesVariablesDefinition
Disciplinary SanctionsYellow cardsA serious prior infraction that is excessive in the referee’s judgement
Red cardsA very serious prior infraction or aggression that is excessive in the referee’s judgement
ShotsTotal shotsShots on and off goal
On-goal shotsShots to the goal
Off-goal shotsShots that do not enter the goal (including side posts and cross bar)
Violations identifiedFree kicksDirect or indirect free kicks, and from the penalty mark, awarded for infractions committed
OffsideWhen a player is totally or partially in the rival’s half of the field and his head, trunk, leg or foot is totally or partially nearer to the goal line than the ball and the second-last opponent
Fouls committedFoul committed by the opponent
Ball possessionPossessionPercentage of minutes that the teams have control of the ball compared to the total number of minutes
Defensive actionsSaves by goalkeeperDefensive actions from the goalkeeper to avoid the ball entering the goal
Offensive actionsCornersA corner is awarded when the ball crosses the goal line, on the ground or in the air, providing the defender is the last one to touch it and does not put it into his own goal
AttacksControl of the ball in one’s own half of the field
Dangerous attacksControl of the ball in the opponent’s half of the field
Total passesPasses made among the players on the same team
Table 2. Descriptive and inferential results of the influence of COVID on performance indicators.
Pre-COVIDCOVIDPost-COVIDpηp2Observed Power
MSDMSDMSD
Yellow cards2.681.5902.591.522.231.43<0.0010.0130.999*#
Red cards0.120.340.120.350.090.300.1570.0020.387
Possession50.0010.8550.0011.3950.0012.561.0000.0000.050
Total shots12.004.7911.314.5710.684.57<0.0010.0201.000&*#
On-goal shots4.292.443.932.263.712.15<0.0010.0110.998&*
Off-goal shots7.703.637.393.656.973.53<0.0010.0141.000*
Free kicks15.844.5415.544.4116.395.26<.0010.0090.985*#
Corners4.932.764.622.544.372.640.0040.0050.863&*
Offsides2.401.882.121.722.011.620.0230.0030.690&*
Saves2.931.932.691.842.461.76<0.0010.0110.997&*
Fouls committed13.854.2313.754.0713.254.190.1290.0020.424*
Attacks101.5623.41107.6623.66101.6125.52<0.0010.0141.000&#
Dangerous attacks55.1619.1146.4616.8446.6319.050.0010.0060.928&*
Total passes428.80120.27423.08123.11432.73133.450.3220.0010.251
Tackles17.047.0314.964.5814.164.46<0.0010.0411.000&*#
&—Differences Pre-COVID–COVID; *—Differences Pre-COVID–Post-COVID; #—Differences COVID–Post-COVID.
Table 3. Descriptive and inferential results of venue.
HomeAwaypηp2Observed Power
MSDMSD
Yellow cards2.481.572.731.550.3810.0000.141
Red cards0.100.320.120.350.8650.0000.053
Possession51.5911.0748.4111.07<0.0010.0100.997
Total shots13.074.8210.354.27<0.0010.0591.000
On-goal shots4.652.513.672.14<0.0010.0181.000
Off-goal shots8.423.716.693.32<0.0010.0531.000
Free kicks15.764.6415.994.640.2570.0010.205
Corners5.402.834.212.46<0.0010.0281.000
Offsides2.421.872.191.770.0310.0020.58
Saves GK2.531.713.132.03<0.0010.0201.000
Fouls committed13.744.2413.764.170.7540.0000.061
Attacks106.9325.2699.2822.35<0.0010.0301.000
Dangerous attacks55.5419.9146.1216.87<0.0010.0661.000
Total passes438.72128.90417.70121.680.0010.0050.905
Tackles15.005.3215.785.88<0.0010.0060.948
Table 4. Descriptive and inferential results and differences among groups of the results with the performance indicators.
WinTieLosepηp2Observed Power
MSDMSDMSD
Yellow cards2.381.572.771.562.711.550.0070.0040.807&*
Red cards0.070.260.120.330.160.40<0.0010.0140.999&*#
Possession51.1311.1650.0011.0948.8711.160.4790.0010.175&*#
Total shots12.834.6311.444.8410.784.57<0.0010.0110.995&*#
On-goal shots5.442.423.672.033.211.97<0.0010.1351.000&*#
Off-goal shots7.403.447.763.837.573.66<0.0010.0100.992&
Free kicks15.554.4216.164.8116.004.710.0070.0040.809&*
Corners4.822.604.892.914.722.710.0320.0030.650
Offsides2.551.892.321.852.051.710.0070.0040.815&*#
Saves2.671.822.701.853.081.990.0090.0040.793*#
Fouls committed13.554.3113.974.3113.794.020.1520.0020.393&
Attacks102.2824.13104.6924.28102.7624.050.0010.0070.943
Dangerous attacks51.0319.0350.6319.4250.7918.780.0280.0030.665
Total passes444.07143.78421.38122.41417.76106.070.0010.0060.92&*
Tackles15.415.4915.395.0515.356.150.78100.089
&—Differences Win–Tie; *—Differences Win–Lose; #—Differences Tie–Lose.
Table 5. Inferential results of the independent variables and game indicators.
Game Indicators pηp2Observed PowerF
Covidtime–VenueTotal shots<0.0010.0090.9849.830
On-goal shots0.0160.0040.7334.139
Off-goal shots<0.0010.0070.9588.073
Corners<0.0010.0130.99915.246
Saves0.0040.0050.8505.464
Attacks 0.0440.0030.6013.118
Dangerous attacks<0.0010.0161.00018.627
Covidtime–ResultPossession0.0010.0080.9404.457
Off-goal shots0.0150.0050.8153.093
Dangerous attacks0.0120.0060.8343.237
Total passes0.0130.0060.8273.179
Venue–ResultYellow cards0.0130.0040.7564.360
Free kicks<0.0010.0070.9567.997
Offsides0.0230.0030.6923.790
Fouls committed0.0080.0040.8044.870
Table 6. Autocorrelation of the PIs.
AutocorrelationBox-Ljungp
Yellow cards0.09345.681<0.001
Red cards0.04812.257<0.001
Possession−0.5001329.638<0.001
Total shots−0.190192.706<0.001
On-goal shots−0.08336.683<0.001
Off-goal shots-0.162139.625<0.001
Free kicks0.06623.532<0.001
Corners−0.162139.368<0.001
Offsides−0.0080.3070.580
Saves−0.04812.359<0.001
Fouls committed−0.0020.0150.903
Attacks−0.0559.1430.002
Dangerous attacks−0.13051.305<0.001
Total passes−0.243134.590<0.001
Tackles0.18477.282<0.001
Publisher’s Note: MDPI stays neutral with regard to jurisdictional claims in published maps and institutional affiliations.

