
Small Hydropower Plants’ Impacts on the Ecological Status Indicators of Urban Rivers


Abstract
:1. Introduction
2. Materials and Methods
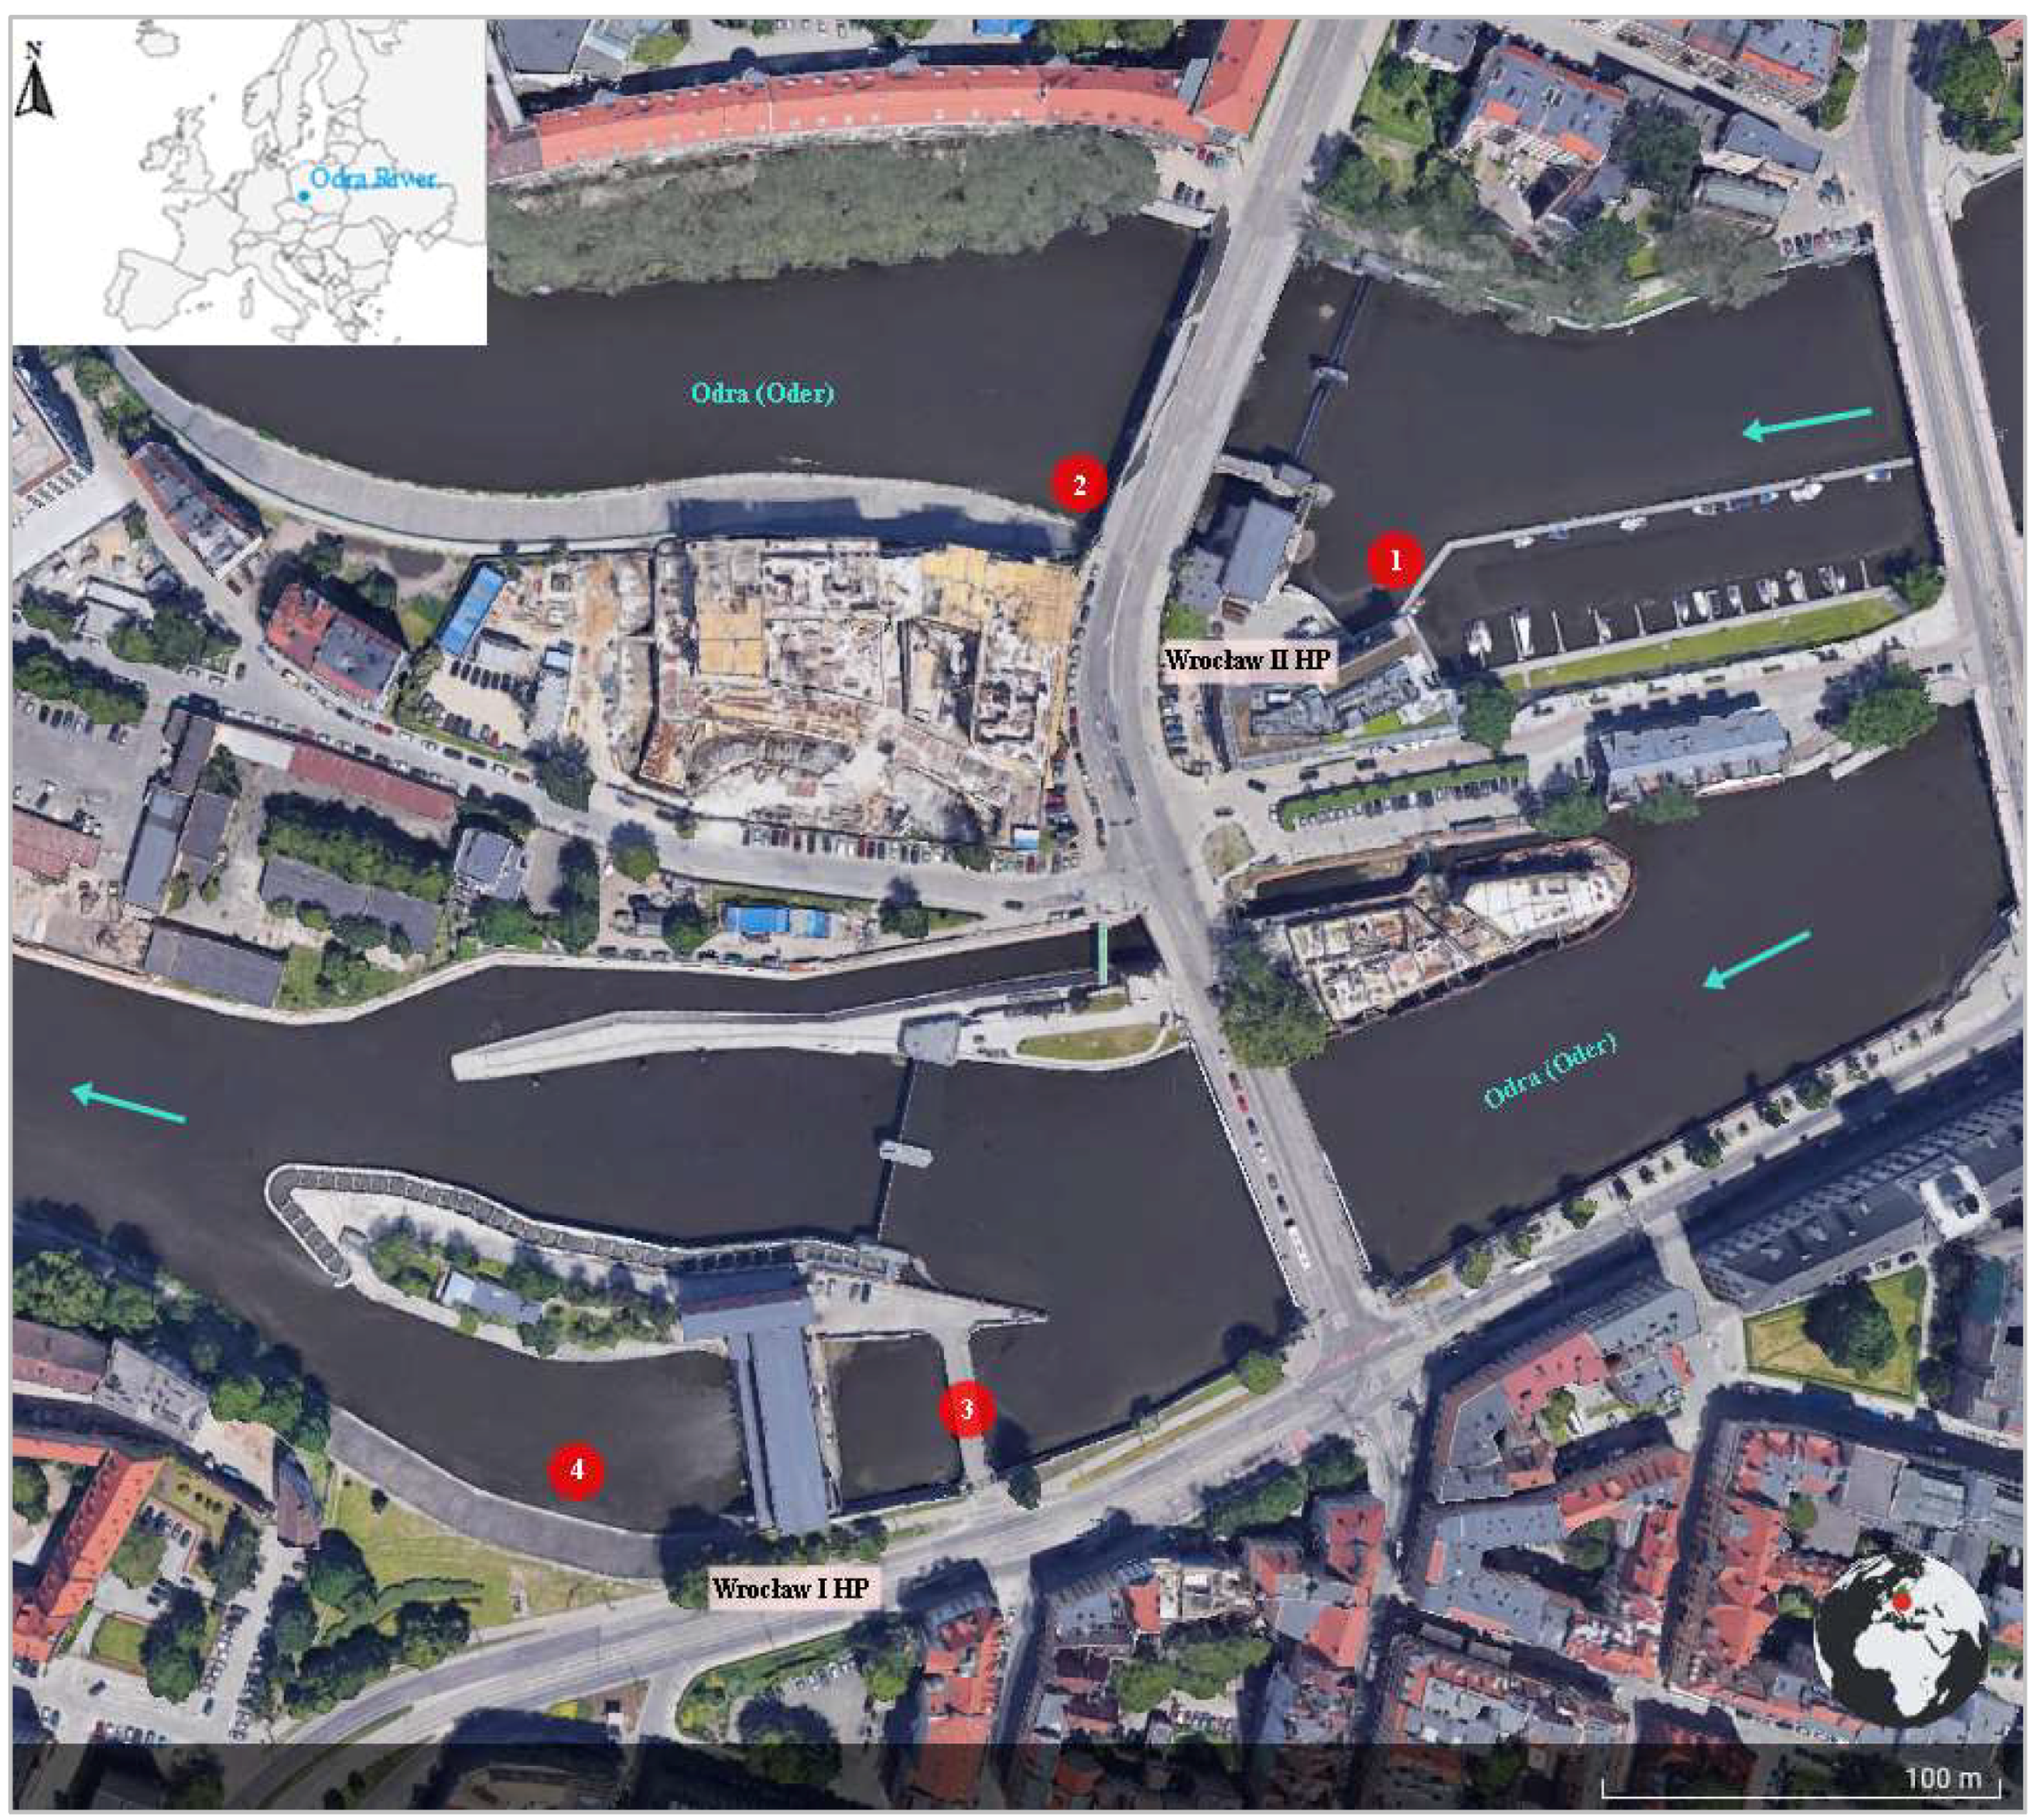
2.1. Study Area
2.2. Field and Laboratory Research
2.3. Data Analysis
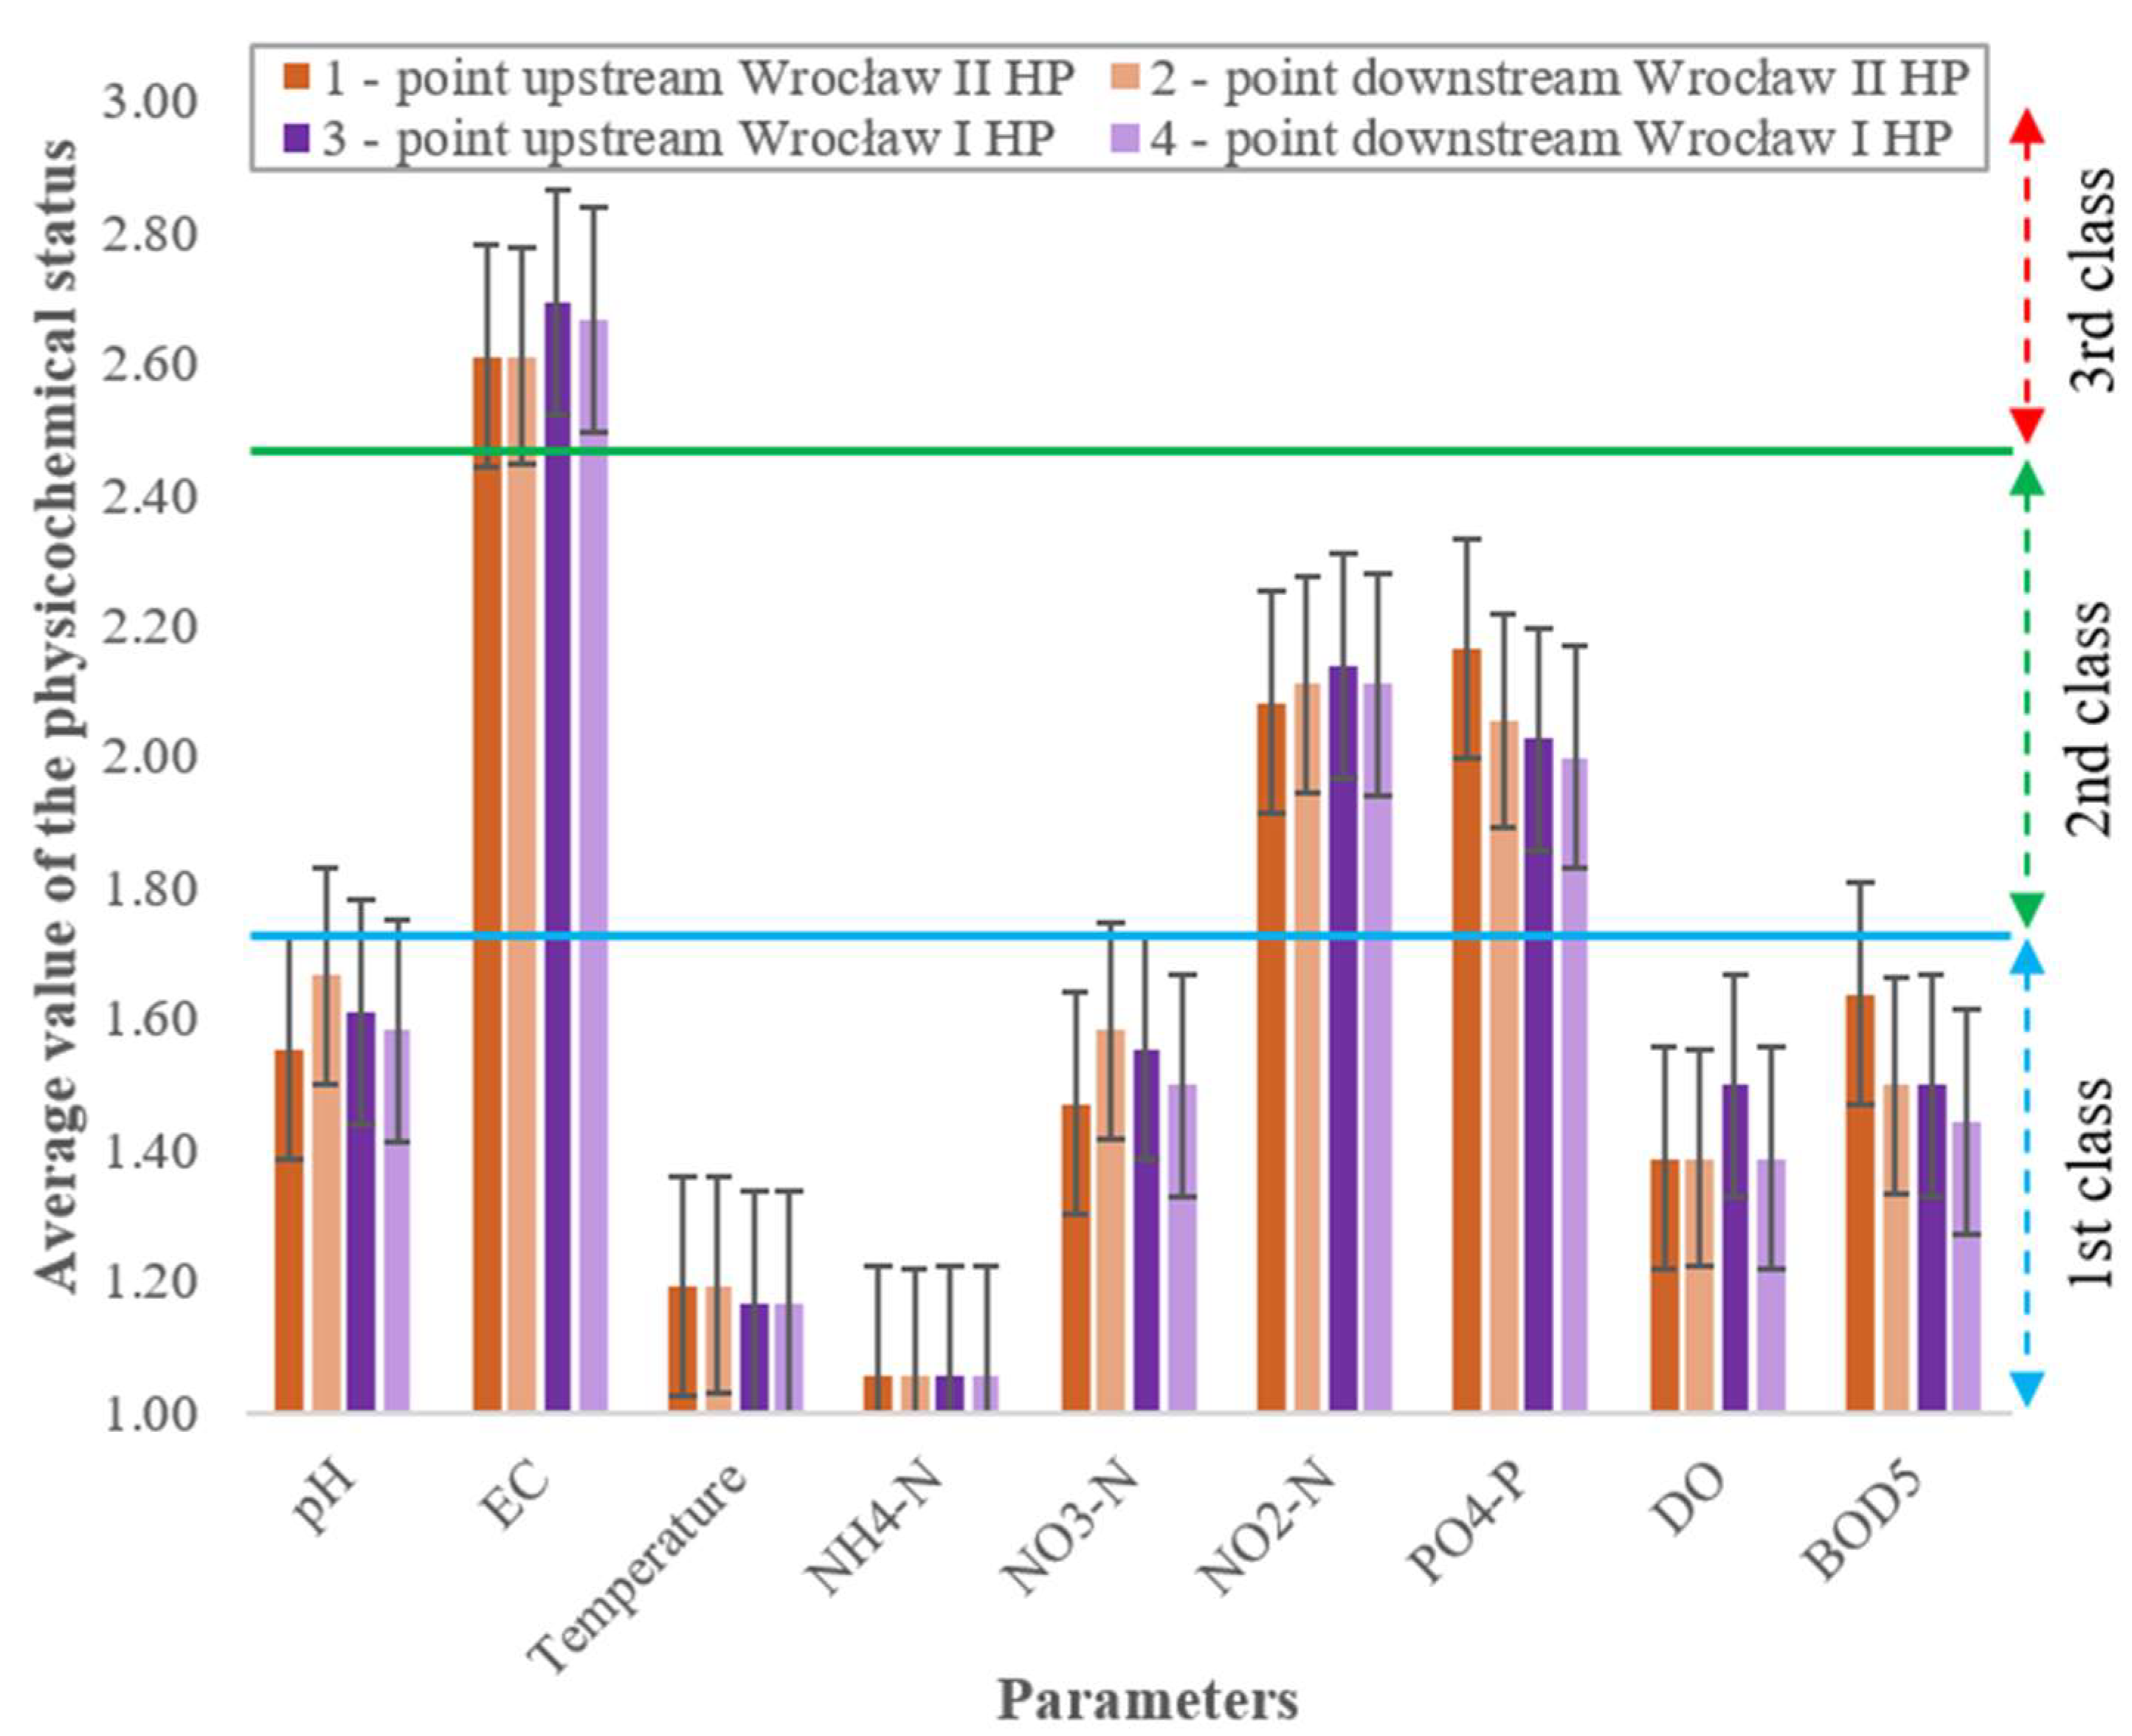
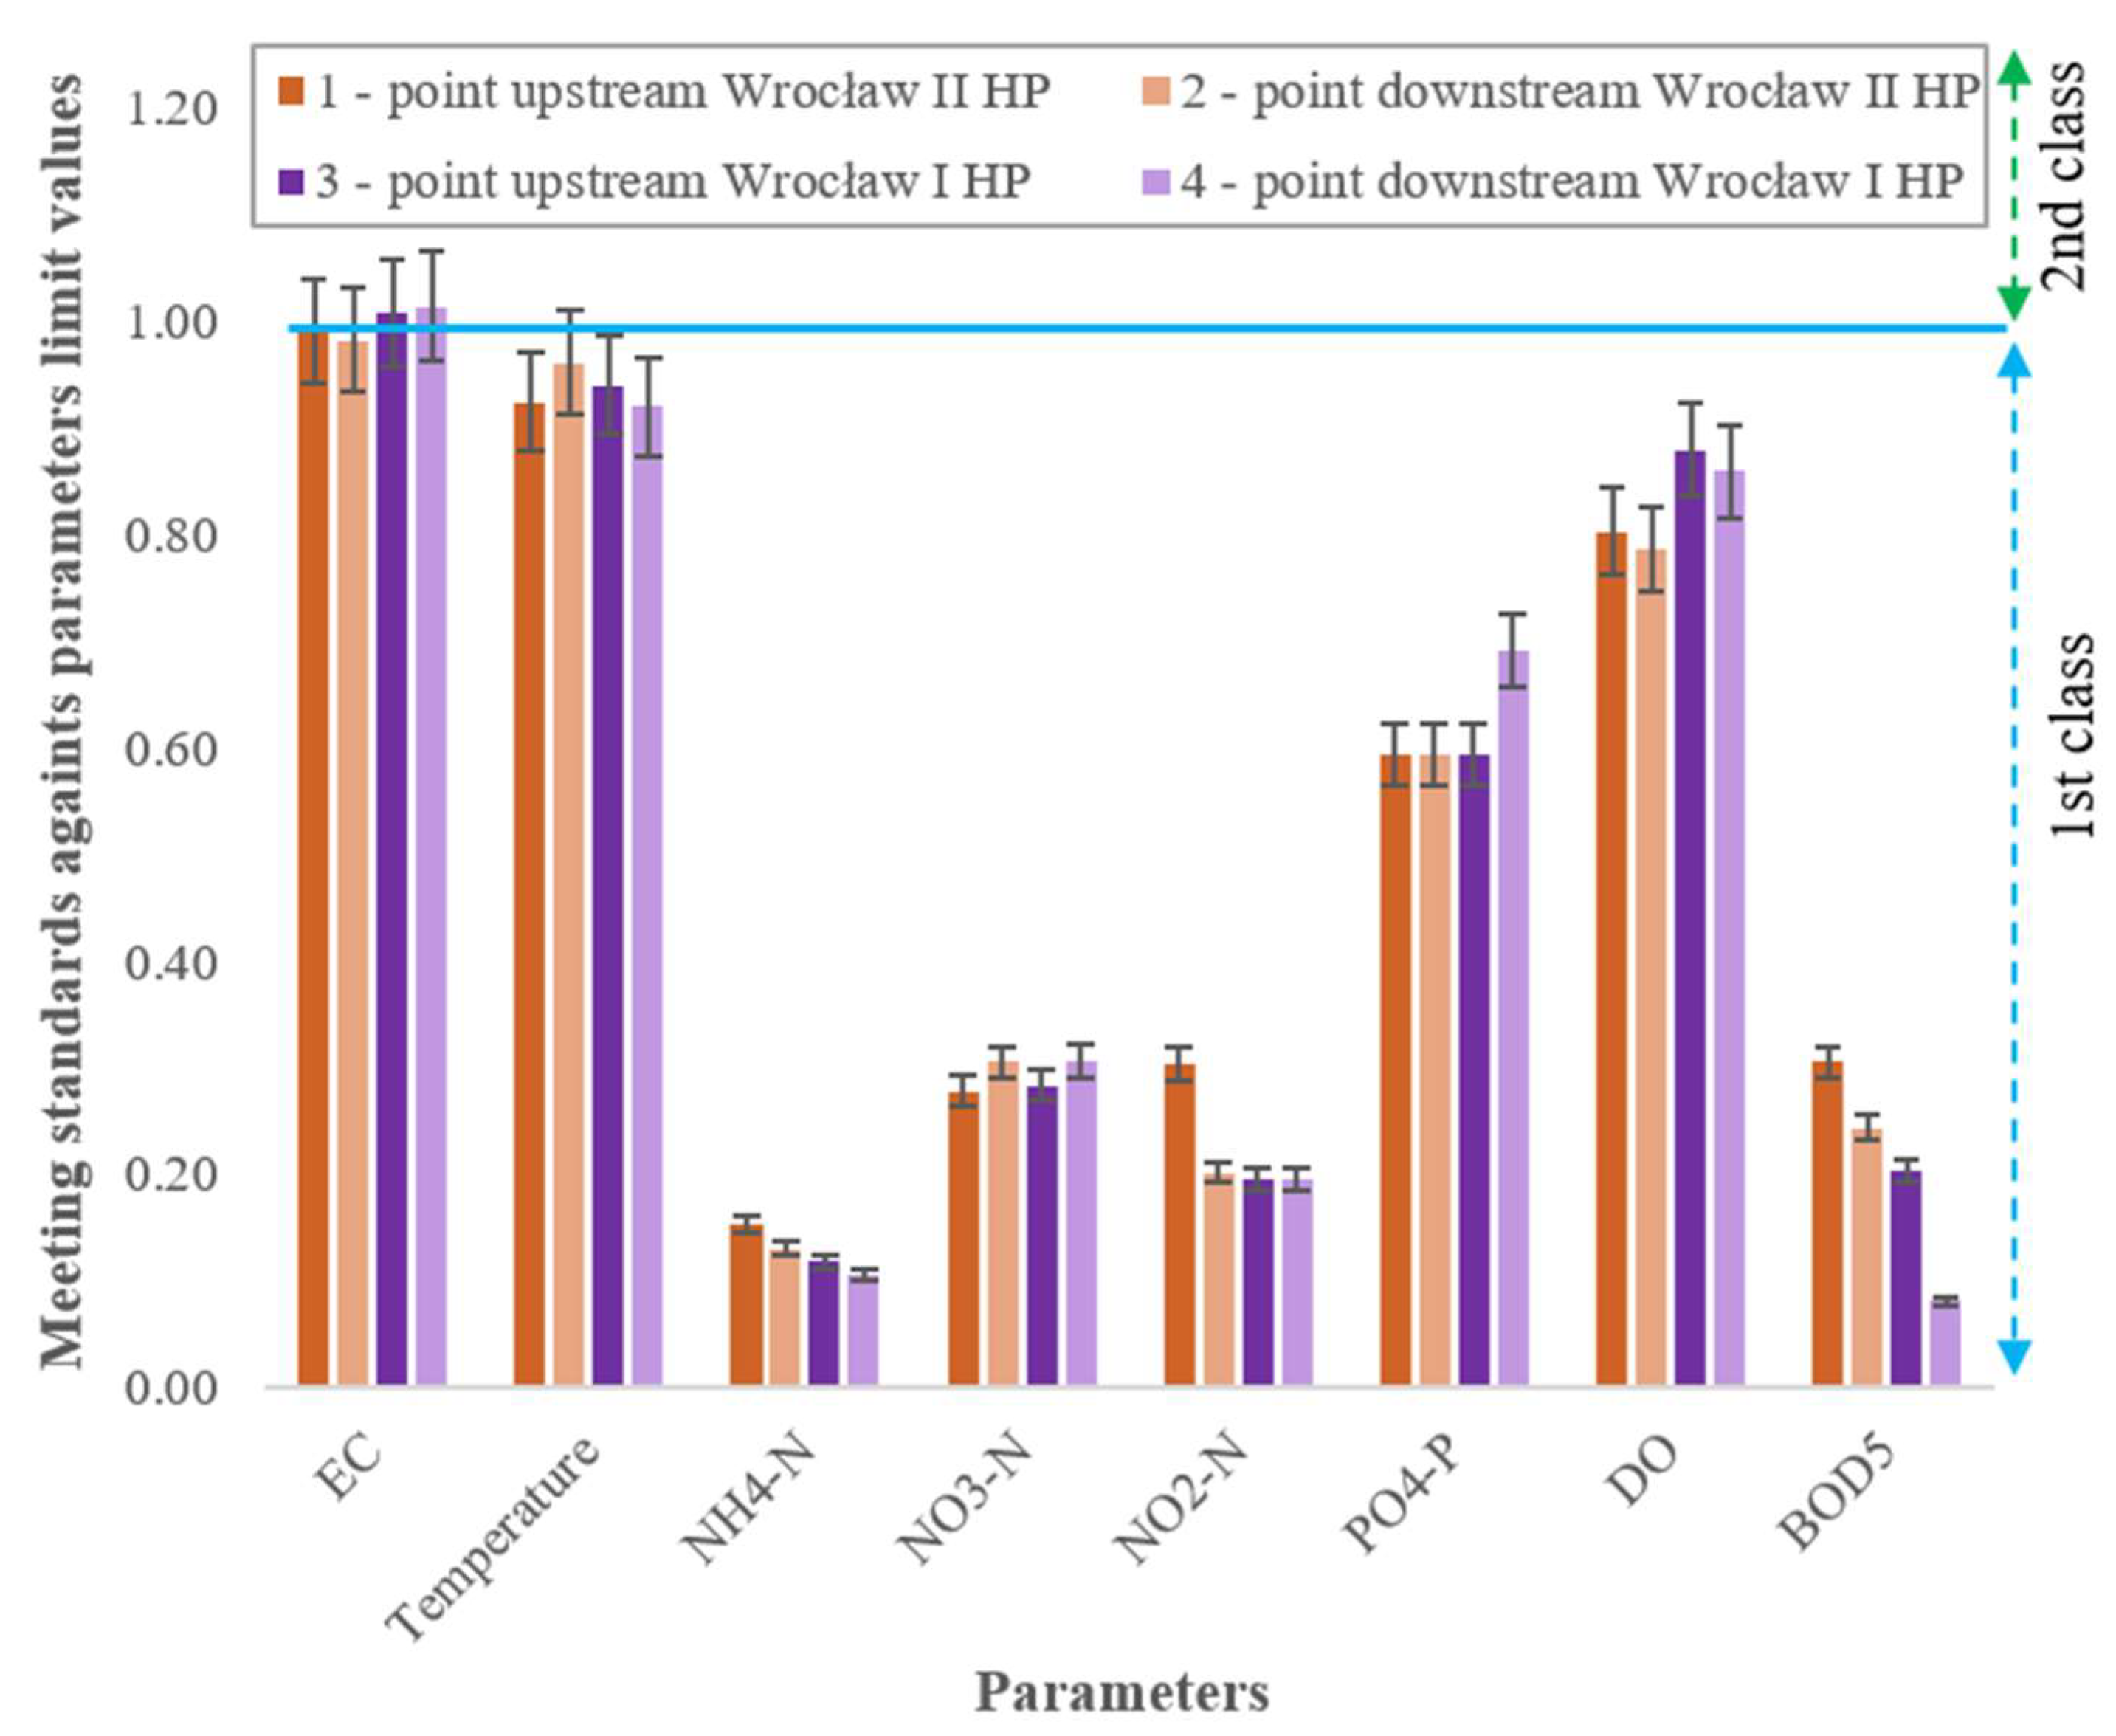
- Assessment of the physicochemical status of elements of water was conducted based on the regulation in force in Poland on the classification of ecological status [34] and implementing the assumptions resulting from the Water Framework Directive concerning the monitoring of surface water bodies [35]. The assessment was carried out for nine physicochemical parameters. For the river type 21, i.e., great lowland river [36], classification details are presented in Table 2. After the evaluation, the results were transformed, i.e., class I—1 point, class II—2 points, class III—3 points, and then the average physicochemical status for each parameter was calculated using the following scale: 1.00–1.66 points—class I, 1.67–2.33 points—class II, and 2.34–3.00 points—class III. The compliance with the standards [34] was also assessed concerning the limit values of the state of the analyzed physicochemical parameters, expressed as the quotient of the average concentration of a given parameter from the research period to the limit value specified in the regulation mentioned above, and then the results were classified according to the following scale: 0.00–1.00 points—very good quality of the physicochemical parameter, 1.01–2.00 points—good quality of the parameter, 2.01–3.00 points—moderate quality of the parameter, 3.01–4.00 points—poor quality of the parameter, and >4.00 points—bad quality of the parameter.
- Determination of the trophic status of water based on the Carlson index (TSIP) [37,38,39,40] and the Trophic Level Index (TLI) [41,42,43] was conducted based on the average concentration of total phosphorus (TP) and, in the case of TLI, total nitrogen (TN = NH4-N + NO3-N + NO2-N) from the analyzed research period (TP and TN in µg/L) for each of the points was taken into account, using the following Formulas (1)–(4) [37,41]:
- Fulfillment of the conditions for the life of salmonids and cyprinids was based on the requirements set out in the Polish regulation on the requirements to be met by inland waters being the living environment of fish in natural conditions [44]. The results for temperature, DO, pH, BOD5, TP, NO2, and NH4-N were taken into account (Table 5).
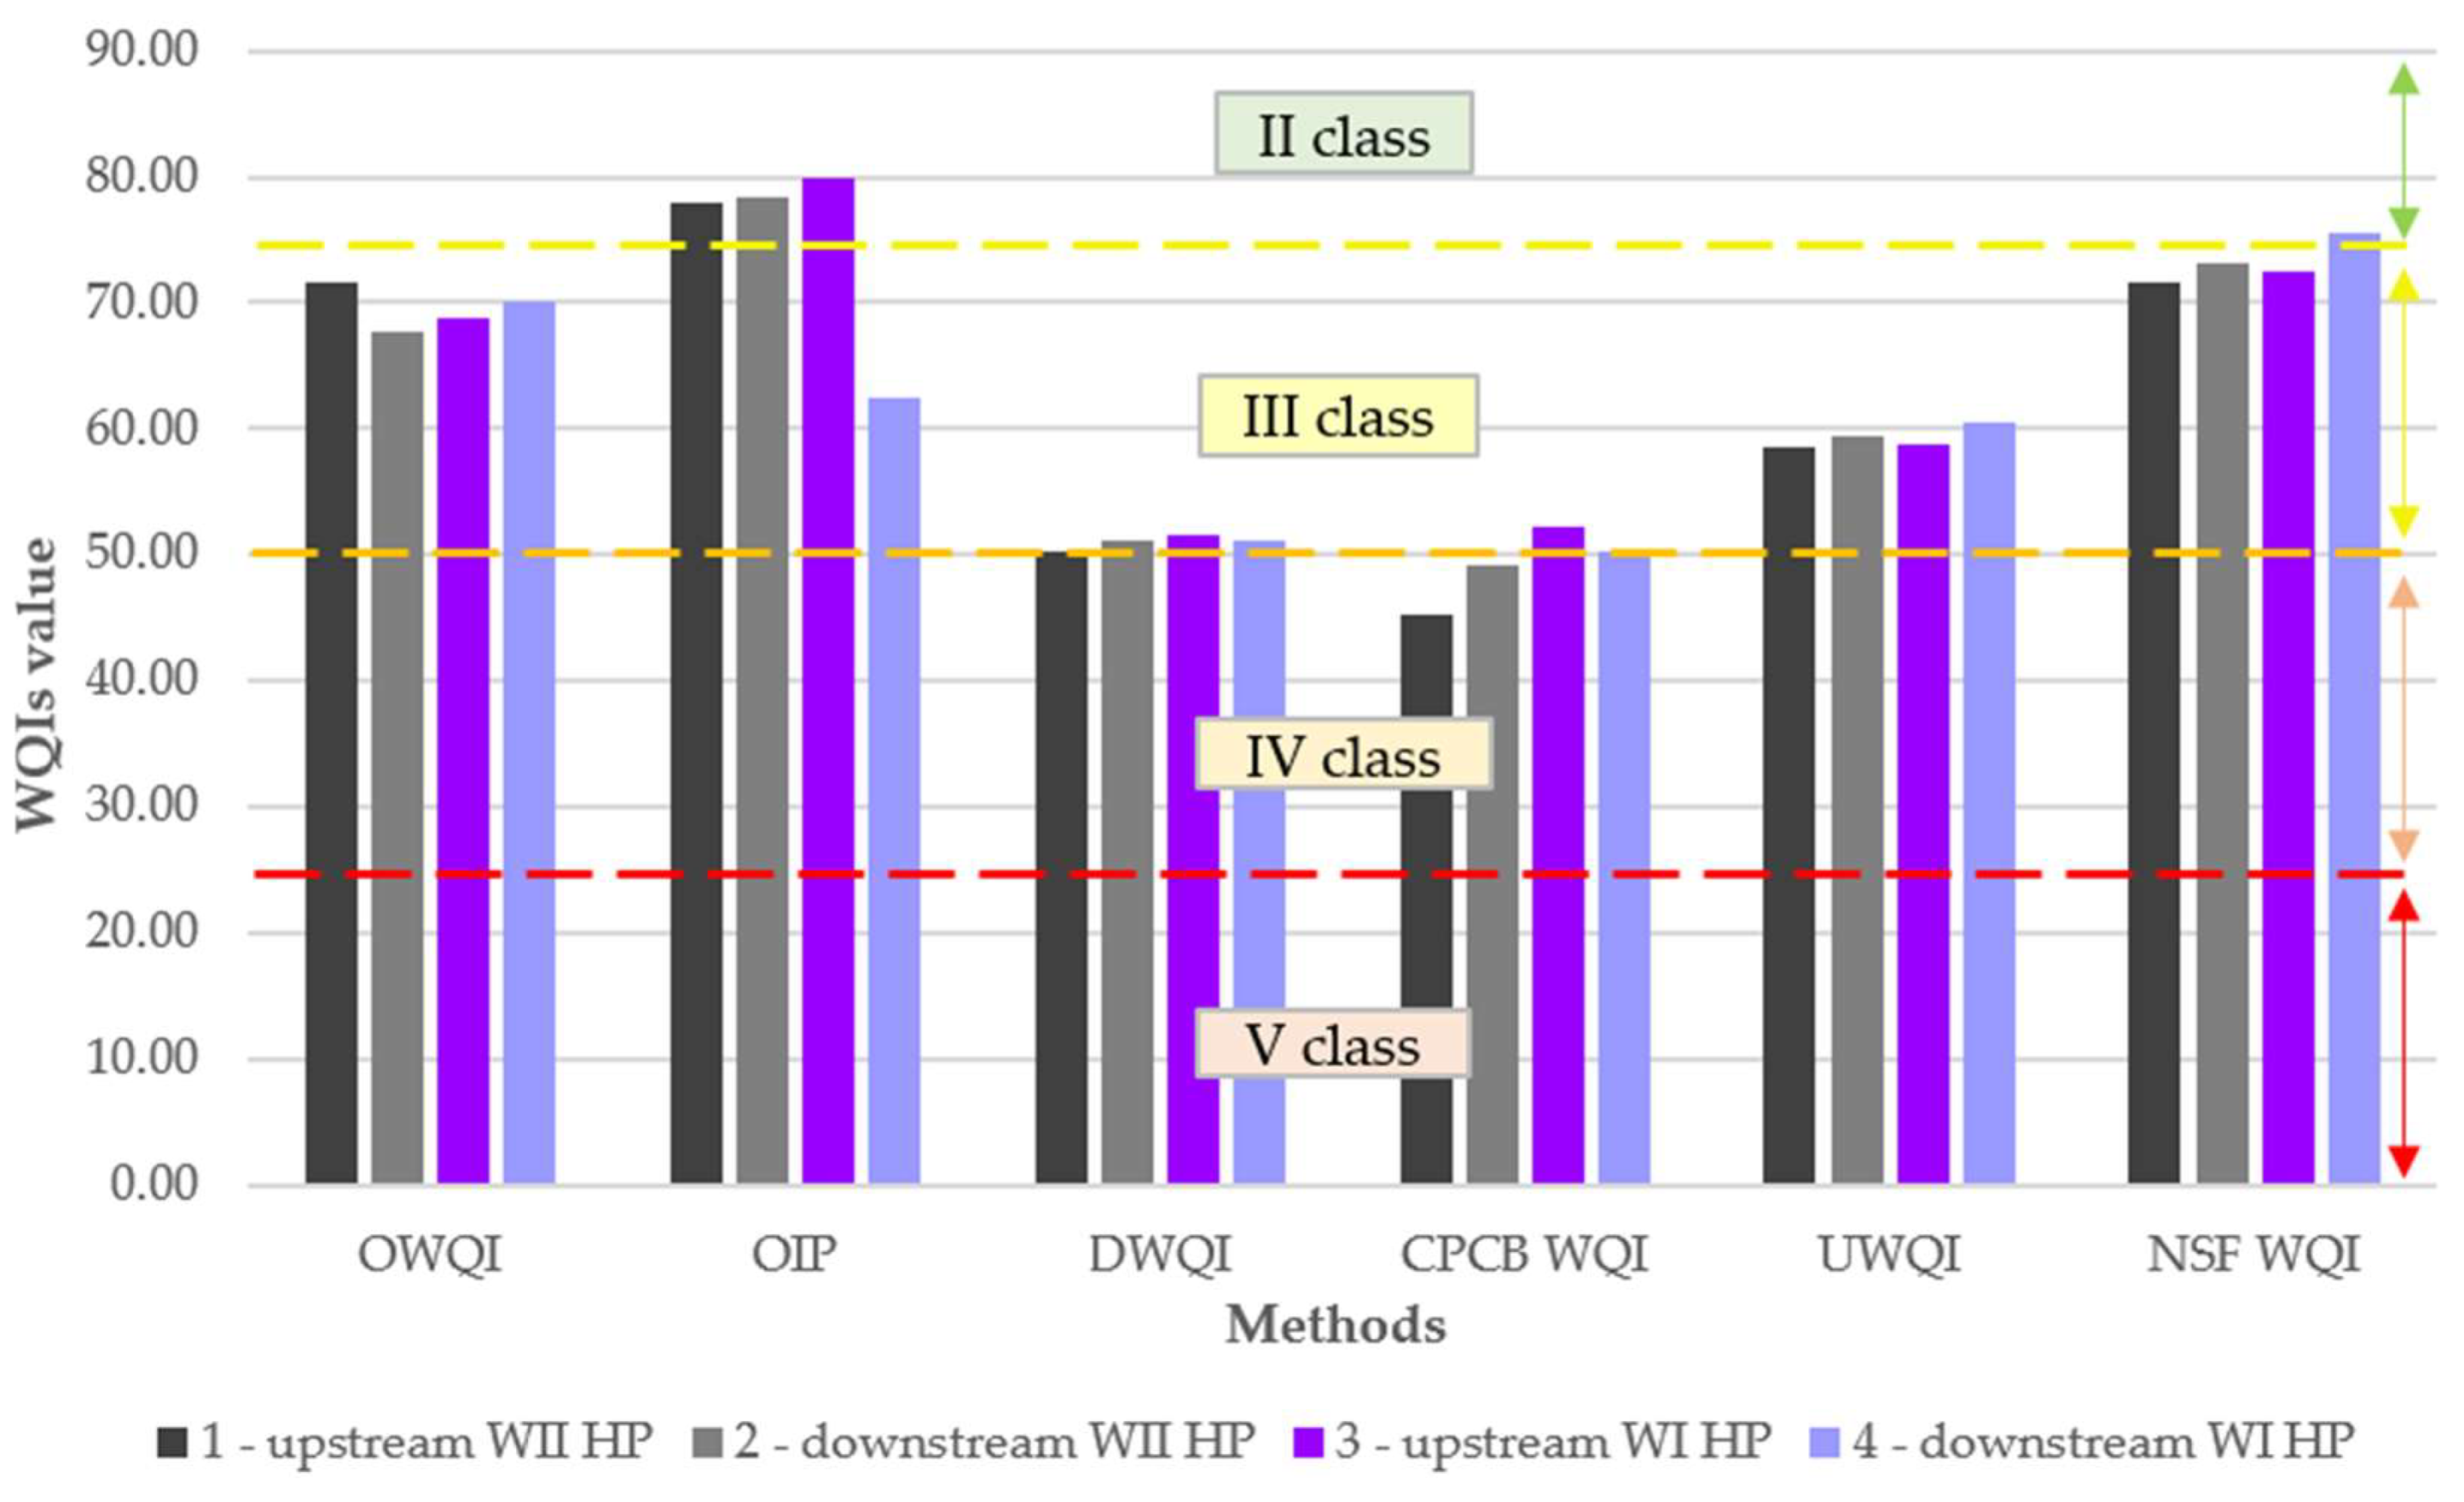
- Assessment of water quality was conducted with the use of water quality indices providing information on both the general water quality and the possibility of using water for various purposes (i.e., water supply, recreation, living conditions for fish fauna, agriculture, and industry), i.e., Oregon Water Quality Index (OWQI) [45], Overall Index of Pollution (OIP) [46], Dinius Water Quality Index (DWQI) [47], Indian Central Control Board Water Quality Index (CPCB WQI) [48], Universal Water Quality Index (UWQI) [49], and The National Sanitation Foundation Water Quality Index (NSF WQI) [50,51,52,53]. The results were obtained by analyzing raw physicochemical data and then calculating the sub-index values for individual parameters based on formulas and determining the final value of the index based on the arithmetic or weighted mean of sub-indexes (detailed specification in Table 6). The final result was expressed on a scale from 0 to 100 points on a 5-point scale, i.e., 0–24.9 points—bad water quality (class V), 25.0–49.9 points—poor water quality (class IV), 50–74.9 points—moderate water quality (class III), 75.0–94.9 points—good water quality (class II), and 95.0–100 points—very good water quality (class I). A detailed description of the research methodology for the mentioned water quality indices (especially in terms of determination of sub-index values and methods of classification of results calculated for these indices) can be found in other articles [33,45,46,47,48,49,50,51,52,53,54].
- This study also analyzed descriptive statistics and checked the obtained results regarding their statistical significance. For this purpose, a non-parametric Wilcoxon rank test was performed for data with a distribution not corresponding to the linear distribution, in which the null hypothesis is that two groups of variables (i.e., in this case, data upstream and downstream of individual hydropower plants) do not differ in the median [55]. The analyses were performed using the SPSS Statistics 26 software.
3. Results
3.1. Descriptive Statistics
3.2. Wilcoxon Rank Test
3.3. Physicochemical Status
3.4. Trophic Status
3.5. Living Conditions for Salmonids and Cyprinids
3.6. Water Quality Indices
4. Discussion
4.1. Descriptive Statistics
4.2. Wilcoxon Rank Test
4.3. Physicochemical Status
4.4. Trophic Status
4.5. Living Conditions for Salmonids and Cyprinids
4.6. Water Quality Indices
5. Conclusions
- Differences in the median values of physicochemical parameters within the hydropower plants were small; they amounted to a maximum of 27.80% (NO3-N at the Wrocław II hydropower plant) and usually did not exceed 10%;
- The changes in concentrations for EC and PO4-P (Wrocław II hydropower plant) and pH (Wrocław I hydropower plant) were found to be statistically significant;
- Water in the area of the Wrocław I and Wrocław II hydropower plants was classified as mesotrophic or eutrophic;
- The conditions for the existence of cyprinids and salmonids were not met, respectively, for two out of seven assessed parameters (BOD5, NO2) and for four out of seven parameters (BOD5, NO2, temperature, DO in three out of four points);
- Hydropower plants, on average, deteriorated the value of water quality indices by 1.35%; the overall water quality ranged from poor to good, and the average water quality was moderate. This water would require treatment before consumption; however, its quality is acceptable for most water sports, and the water quality is suitable for fish less sensitive to pollution and allows normal industrial production not requiring high-quality water. The values of these indices varied depending on the index and sites;
- The authors plan to continue and expand this research on the analysis of the migration of aquatic organisms through water steps with hydropower buildings in urban areas and investigate the exact characteristics of the capacity achieved by these hydropower plants along with hydrological conditions. The scope of these studies should include not only the impact on the water and land environment, but also the impact on hydrological conditions, landscape, water relations within the hydropower plant, and economic and social issues (e.g., the profitability of this type of project, compliance with the international energy and climate policy and sustainable development goals, and the location of hydropower plants).
Author Contributions
Funding
Institutional Review Board Statement
Informed Consent Statement
Data Availability Statement
Conflicts of Interest
Abbreviations
| BOD5 | Five-day biochemical oxygen demand |
| CPCB WQI | Indian Central Pollution Control Board Water Quality Index |
| DO | Dissolved oxygen |
| DWQI | Dinius Water Quality Index |
| EC | Electrical conductivity |
| HP | Hydropower plant |
| NH4 | Ammonia |
| NH4-N | Ammonium nitrogen |
| NO2 | Nitrites |
| NO2-N | Nitrite nitrogen |
| NO3 | Nitrates |
| NO3-N | Nitrate nitrogen |
| NSF WQI | The National Sanitation Foundation Water Quality Index |
| OIP | Overall Index Pollution |
| OWQI | Oregon Water Quality Index |
| PO4-P | Phosphate phosphorus |
| Temp. | Temperature of water |
| TLI | Trophic Level Index |
| TLN | Trophic Level Index for total nitrogen |
| TLP | Trophic Level Index for total phosphorus |
| TN | Total nitrogen |
| TP | Total phosphorus |
| TSIP | Carlson index (Trophic State Index) |
| Turb. | Turbidity |
| UWQI | Universal Water Quality Index |
| WQI | Water Quality Index |
References
- Oki, T.; Kanae, S. Global Hydrological Cycles and World Water Resources. Science 2006, 313, 1068–1072. [Google Scholar] [CrossRef] [PubMed] [Green Version]
- Khatri, N.; Tyagi, S. Influences of natural and anthropogenic factors on surface and groundwater quality in rural and urban areas. Front. Life Sci. 2015, 8, 23–39. [Google Scholar] [CrossRef]
- Ball, P. Water as an Active Constituent in Cell Biology. Chem. Rev. 2008, 108, 74–108. [Google Scholar] [CrossRef] [PubMed]
- Chalov, R.S. Fluvial Processes: Theory and Applications; Springer: Cham, Switzerland, 2021. [Google Scholar]
- Malmqvist, B.; Rundle, S. Threats to the running water ecosystems of the world. Environ. Conserv. 2002, 29, 134–153. [Google Scholar] [CrossRef]
- Pimentel, D.; Houser, J.; Preiss, E.; White, O.; Fang, H.; Mesnick, L.; Barsky, T.; Tariche, S.; Schreck, J.; Alpert, S. Water Resources: Agriculture, the Environment, and Society. BioScience 1997, 47, 97–106. [Google Scholar] [CrossRef]
- Global International Geosphere-Biosphere Programme. Global Freshwater Use 1901–2014; Global International Geosphere-Biosphere Programme: Stockholm, Sweden, 2015. [Google Scholar]
- The World Bank. World Development Indicators—Renewable Freshwater Resources per Capita 1962–2017; The World Bank: Washington, DC, USA, 2021. [Google Scholar]
- FAO. AQUASTAT—Per Capita Renewable Water Resources by Region in 2015; FAO: Rome, Italy, 2016. [Google Scholar]
- Koncagül, E.; Tran, M.; Connor, R. The United Nations World Water Development Report 2020: Water and Climate Change, Facts and Figures; UNESCO World Water Assessment Programme: Perugia, Italy, 2020. [Google Scholar]
- Singh, V.K.; Singal, S.K. Operation of hydro power plants—A review. Renew. Sustain. Energy Rev. 2017, 69, 610–619. [Google Scholar] [CrossRef]
- Kuriqi, A.; Pinheiro, A.N.; Sordo-Ward, A.; Bejarano, M.D.; Garrote, L. Ecological impacts of run-of-river hydropower plants—Current status and future prospects on the brink of energy transition. Renew. Sustain. Energy Rev. 2021, 142, 110833. [Google Scholar] [CrossRef]
- IHA (International Hydropower Association). 2021 Hydropower Status Report; IHA: London, UK, 2021. [Google Scholar]
- IRENA (International Renewable Energy Agency). Renewable Energy Statistics 2021; IRENA: Abu Dhabi, United Arab Emirates, 2021. [Google Scholar]
- Berga, L. The Role of Hydropower in Climate Change Mitigation and Adaptation: A Review. Engineering 2016, 2, 313–318. [Google Scholar] [CrossRef] [Green Version]
- van Soest, H.L.; den Elzen, M.G.J.; van Vuuren, D.P. Net-zero emission targets for major emitting countries consistent with the Paris Agreement. Nat. Commun. 2021, 12, 2140. [Google Scholar] [CrossRef]
- Drouet, L.; Bosetti, V.; Padoan, S.A.; Aleluia Reis, L.; Bertram, C.; Dalla Longa, F.; Després, J.; Emmerling, J.; Fosse, F.; Fragkiadakis, K.; et al. Net zero-emission pathways reduce the physical and economic risks of climate change. Nat. Clim. Chang. 2021, 11, 1070–1076. [Google Scholar] [CrossRef]
- Moran, E.F.; Lopez, M.C.; Moore, N.; Müller, N.; Hyndman, D.W. Sustainable hydropower in the 21st century. Proc. Natl. Acad. Sci. USA 2018, 115, 11891–11898. [Google Scholar] [CrossRef] [PubMed] [Green Version]
- Sibtain, M.; Li, X.; Bashir, H.; Azam, M.I. Hydropower exploitation for Pakistan’s sustainable development: A SWOT analysis considering current situation, challenges, and prospects. Energy Strategy Rev. 2021, 38, 100728. [Google Scholar] [CrossRef]
- Sharma, P.; Sahoo, B.B. An ANFIS-RSM based modeling and multi-objective optimization of syngas powered dual-fuel engine. Int. J. Hydrogen Energy 2022, 47, 19298–19318. [Google Scholar] [CrossRef]
- Ashraf Virk, M.R.; Mysorewala, M.F.; Cheded, L.; Aliyu, A.R. Review of energy harvesting techniques in wireless sensor-based pipeline monitoring networks. Renew. Sustain. Energy Rev. 2022, 157, 112046. [Google Scholar] [CrossRef]
- Vu, D.L.; Le, C.D.; Ahn, K.K. Functionalized graphene oxide/polyvinylidene fluoride composite membrane acting as a triboelectric layer for hydropower energy harvesting. Int. J. Energy Res. 2022, 46, 9549–9559. [Google Scholar] [CrossRef]
- Jiang, D.; Xu, M.; Dong, M.; Guo, F.; Liu, X.; Chen, G.; Wang, Z.L. Water-solid triboelectric nanogenerators: An alternative means for harvesting hydropower. Renew. Sustain. Energy Rev. 2019, 115, 109366. [Google Scholar] [CrossRef]
- Ahmadi, M.H.; Ghazvini, M.; Nazari, M.A.; Ahmadi, M.A.; Pourfayaz, F.; Lorenzini, G.; Ming, T. Renewable energy harvesting with the application of nanotechnology: A review. Int. J. Energy Res. 2019, 43, 1387–1410. [Google Scholar] [CrossRef]
- Kazak, J.; van Hoof, J.; Szewrański, S. Challenges in the wind turbines location process in Central Europe—The use of spatial decision support systems. Renew. Sustain. Energy Rev. 2017, 76, 425–433. [Google Scholar] [CrossRef]
- Statistics Poland. Demographic Yearbook of Poland 2021; Statistical Publishing Establishment: Warszawa, Poland, 2021; p. 530.
- Statistical Office in Wrocław. Dolnośląskie Centre for Regional Surveys; Wrocław in Figures; Statistical Publishing Establishment: Warszawa, Poland, 2021; p. 32.
- Witkowski, A.; Kleszcz, M.; Błachuta, J.; Kotusz, J.; Kusznierz, J.; Napora, K. Ichthyofauna of Wrocław—The Odra River, its tributaries and the selected city reservoirs. Fragm. Faun. 2012, 55, 49–74. [Google Scholar] [CrossRef] [Green Version]
- O’Keeffe, J.; Marcinkowski, P.; Utratna, M.; Piniewski, M.; Kardel, I.; Kundzewicz, Z.W.; Okruszko, T. Modelling Climate Change’s Impact on the Hydrology of Natura 2000 Wetland Habitats in the Vistula and Odra River Basins in Poland. Water 2019, 11, 2191. [Google Scholar] [CrossRef]
- Tomczyk, P.; Willems, P.; Wiatkowski, M. Comparative analysis of changes in hydromorphological conditions upstream and downstream hydropower plants on selected rivers in Poland and Belgium. J. Clean. Prod. 2021, 328, 129524. [Google Scholar] [CrossRef]
- The State Water Holding “Polish Waters”—Regional Water Management Authority RZGW; List of Hydropower Plants in the Area of RZGW Wrocław’s Operation: Wrocław, Poland, 2020.
- Wdowczyk, A.; Szymańska-Pulikowska, A.; Domańska, M. Analysis of the Bacterial Biocenosis of Activated Sludge Treated with Leachate from Municipal Landfills. Int. J. Environ. Res. Public Health 2022, 19, 1801. [Google Scholar] [CrossRef] [PubMed]
- Tomczyk, P.; Wiatkowski, M. Impact of a small hydropower plant on water quality dynamics in a diversion and natural river channel. J. Environ. Qual. 2021, 50, 1156–1170. [Google Scholar] [CrossRef] [PubMed]
- Minister of Infrastructure. Regulation of the Minister of Infrastructure of June 25, 2021 on the classification of ecological status, ecological potential and chemical status, and the method of classification of the state of surface water bodies and the environmental quality standards for priority substances. J. Laws 2021. (In Polish) [Google Scholar]
- The European Parliament and the Council of the European Union. Directive 2000/60/EC of the European Parliament and of the Council of 23 October 2000 Establishing a Framework for Community Action in the Field of Water Policy; The European Parliament and the Council of the European Union: Brussel, Belgium, 2014.
- Kupiec, J.M.; Staniszewski, R.; Jusik, S. Assessment of the impact of land use in an agricultural catchment area on water quality of lowland rivers. PeerJ 2021, 9, e10564. [Google Scholar] [CrossRef]
- Carlson, R.E.; Simpson, J. A Coordinator’s Guide to Volunteer Lake Monitoring Methods; NALMS: Minneapolis, MN, USA, 1996. [Google Scholar]
- Vollenweider, R.A. Material and ideas for a hydrochemistry of water. Mem. Dell’istituto Ital. Idrobiol. 1965, 19, 213–286. (In Italian) [Google Scholar]
- Sakamoto, M. Primary production by phytoplankton community in some Japanese lakes and its dependence on lake depth. Arch. Hydrobiol. 1966, 62, 1–28. [Google Scholar]
- EPA—U.S. Environmental Protection Agency. An Approach to a Relative Trophic Index System for Classifying Lakes and Reservoirs; EPA: Washington, DC, USA, 1974; p. 24.
- Abell, J.M.; van Dam-Bates, P.; Özkundakci, D.; Hamilton, D.P. Reference and current Trophic Level Index of New Zealand lakes: Benchmarks to inform lake management and assessment. N. Z. J. Mar. Freshw. Res. 2020, 54, 636–657. [Google Scholar] [CrossRef]
- Bryers, G.; Bowman, E.; Niwa, H. Protocol for Monitoring Trophic Levels of New Zealand Lakes and Reservoirs Noel Burns of Lakes Consulting Ministry for the Environment Lakes Consulting; Lakes Consulting: Pauanui, New Zealand, 2000. [Google Scholar]
- Ding, Y.; Zhao, J.; Peng, W.; Zhang, J.; Chen, Q.; Fu, Y.; Duan, M. Stochastic trophic level index model: A new method for evaluating eutrophication state. J. Environ. Manag. 2021, 280, 111826. [Google Scholar] [CrossRef]
- Minister of the Environment. Regulation of the Minister of the Environment of October 4, 2002 on the requirements to be met by inland waters that are the environment for fish living in natural conditions. J. Laws 2002. (In Polish) [Google Scholar]
- Cude, C.G. Oregon Water Quality Index: A tool for evaluating water quality management efectiveness’ quality issues by the public and policy makers. JAWRA 2001, 37, 125–137. [Google Scholar] [CrossRef]
- Sarkar, C.; Abbasi, S.A. Qualidex—A new software for generating water quality indices. Environ. Monit. Assess. 2006, 119, 201–231. [Google Scholar] [CrossRef] [PubMed]
- Dinius, S.H. Design of an Index of Water Quality. JAWRA 1987, 23, 833–843. [Google Scholar] [CrossRef]
- Sargaonkar, A.; Deshpande, V. Development of an overall index of pollution for surface water based on a general classification scheme in Indian context. Environ. Monit. Assess. 2003, 89, 43–67. [Google Scholar] [CrossRef] [PubMed]
- Boyacioglu, H. Development of a water quality index based on a European classification scheme. Water SA 2007, 33, 101–106. [Google Scholar] [CrossRef] [Green Version]
- House, M.A. A Water Quality Index for River Management. Water Environ. J. 1989, 3, 336–344. [Google Scholar] [CrossRef]
- Bordalo, A.A.; Nilsumranchit, W.; Chalermwat, K. Water quality and uses of the Bangpakong River (Eastern Thailand). Water Res. 2001, 35, 3635–3642. [Google Scholar] [CrossRef] [PubMed]
- Breabăn, I.G.; Gheţeu, D.; Mădălina, P.A.I.U. Determination of Water Quality Index of Jijia and Miletin Ponds. Bull. University of Agricultural Sciences and Veterinary Medicine Cluj-Napoca. Agriculture 2012, 69, 160–167. [Google Scholar]
- Cymes, I.; Glińska-Lewczuk, K. The use of water quality indices (WQI and SAR) for multipurpose assessment of water in dam reservoirs. J. Elem. 2016, 21, 1211–1224. [Google Scholar] [CrossRef]
- Uddin, M.G.; Nash, S.; Olbert, A.I. A review of water quality index models and their use for assessing surface water quality. Ecol. Indic. 2021, 122, 107218. [Google Scholar] [CrossRef]
- Conover, W.J. Practical Non-Parametric Statistics, 3rd ed.; John Wiley & Sons, Inc.: Hoboken, NJ, USA, 1999. [Google Scholar]
- Schernewski, G.; Stybel, N.; Neumann, T. Zebra Mussel Farming in the Szczecin (Oder) Lagoon: Water-Quality Objectives and Cost-Effectiveness. Ecol. Soc. 2012, 17, 4. [Google Scholar] [CrossRef] [Green Version]
- Valero, E. Characterization of the Water Quality Status on a Stretch of River Lérez around a Small Hydroelectric Power Station. Water 2012, 4, 815–834. [Google Scholar] [CrossRef] [Green Version]
- Fantin-Cruz, I.; Pedrollo, O.; Girard, P.; Zeilhofer, P.; Hamilton, S.K. Effects of a diversion hydropower facility on the hydrological regime of the Correntes River, a tributary to the Pantanal floodplain, Brazil. J. Hydrol. 2015, 531, 810–820. [Google Scholar] [CrossRef]
- Vaikasas, S.; Bastienė, N.; Pliūraitė, V. Impact of small hydropower plants on physicochemical and biotic environments in flatland riverbeds in Lithuania. J. Water Secur. 2015, 1, 1–13. [Google Scholar] [CrossRef] [Green Version]
- Luo, X.; Xiang, X.; Huang, G.; Song, X.; Wang, P.; Fu, K. Bacterial Abundance and Physicochemical Characteristics of Water and Sediment Associated with Hydroelectric Dam on the Lancang River China. Int. J. Environ. Res. Public Health 2019, 16, 2031. [Google Scholar] [CrossRef] [PubMed]
- Xu, T.; Chang, F.; He, X.; Yang, Q.; Ma, W. Influence of Cascade Hydropower Development on Water Quality in the Middle Jinsha River on the Upper Reach of the Yangtze River. Water 2022, 14, 1943. [Google Scholar] [CrossRef]
- Tomczyk, P.; Wiatkowski, M. The Effects of Hydropower Plants on the Physicochemical Parameters of the Bystrzyca River in Poland. Energies 2021, 14, 2075. [Google Scholar] [CrossRef]
- Li, P.; Zhu, D.Z.; Li, R.; Wang, Y.; Crossman, J.A.; Kuhn, W.L. Production of total dissolved gas supersaturation at hydropower facilities and its transport: A review. Water Res. 2022, 223, 119012. [Google Scholar] [CrossRef]
- Rognerud, M.E.; Solemslie, B.W.; Islam, H.; Pollet, B.G. How to Avoid Total Dissolved Gas Supersaturation in Water from Hydropower Plants by Employing Ultrasound. J. Phys. Conf. Ser. 2020, 1608, 012004. [Google Scholar] [CrossRef]
- Stenberg, S.K.; Velle, G.; Pulg, U.; Skoglund, H. Acute effects of gas supersaturation on Atlantic salmon smolt in two Norwegian rivers. Hydrobiologia 2022, 849, 527–538. [Google Scholar] [CrossRef]
- Huang, L.; Fang, H.; Fazeli, M.; Chen, Y.; He, G.; Chen, D. Mobility of phosphorus induced by sediment resuspension in the Three Gorges Reservoir by flume experiment. Chemosphere 2015, 134, 374–379. [Google Scholar] [CrossRef] [PubMed]
- Estigoni, M.V.; Miranda, R.B.; Mauad, F.F. Hydropower reservoir sediment and water quality assessment. Manag. Environ. Qual. Int. J. 2017, 28, 43–56. [Google Scholar] [CrossRef]
- Zhang, S.; Yi, Q.; Buyang, S.; Cui, H.; Zhang, S. Enrichment of bioavailable phosphorus in fine particles when sediment resuspension hinders the ecological restoration of shallow eutrophic lakes. Sci. Total Environ. 2020, 710, 135672. [Google Scholar] [CrossRef] [PubMed]
- Heggenes, J.; Stickler, M.; Alfredsen, K.; Brittain, J.E.; Adeva-Bustos, A.; Huusko, A. Hydropower-driven thermal changes, biological responses and mitigating measures in northern river systems. River Res. Appl. 2021, 37, 743–765. [Google Scholar] [CrossRef]
- Yang, X.; Li, Y.; Wang, B.; Xiao, J.; Yang, M.; Liu, C.Q. Effect of hydraulic load on thermal stratification in karst cascade hydropower reservoirs, Southwest China. J. Hydrol. Reg. Stud. 2020, 32, 100748. [Google Scholar] [CrossRef]
- Winton, R.S.; Teodoru, C.R.; Calamita, E.; Kleinschroth, F.; Banda, K.; Nyambe, I.; Wehrli, B.; Winton, R.S. Anthropogenic influences on Zambian water quality: Hydropower and land-use change. Environ. Sci. Process. Impacts 2021, 23, 981–994. [Google Scholar] [CrossRef]
- Tomczyk, P. Analysis of the Physicochemical Quality of Water Within the Hydropower Plant on the Ślęza River in Wrocław, Poland. Rocz. Ochr. Srodowiska Annu. Set Environ. Prot. 2021, 23, 795–810. [Google Scholar] [CrossRef]
- Grzywna, A.; Bronowicka-Mielniczuk, U. Spatial and Temporal Variability of Water Quality in the Bystrzyca River Basin, Poland. Water 2020, 12, 190. [Google Scholar] [CrossRef] [Green Version]
- Ivarson, M.M.; Trivedi, C.; Vereide, K. Investigations of Rake and Rib Structures in Sand Traps to Prevent Sediment Transport in Hydropower Plants. Energies 2021, 14, 3882. [Google Scholar] [CrossRef]
- Monnin, L.; Ciffroy, P.; Garnier, J.M.; Ambrosi, J.P.; Radakovitch, O. Remobilization of trace metals during laboratory resuspension of contaminated sediments from a dam reservoir. J. Soils Sediments 2018, 18, 2596–2613. [Google Scholar] [CrossRef]
- Richter, W.; Vereide, K.; Mauko, G.; Havrevoll, O.H.; Schneider, J.; Zenz, G. Retrofitting of Pressurized Sand Traps in Hydropower Plants. Water 2021, 13, 2515. [Google Scholar] [CrossRef]
- Ogello, E.; Njiru, J.; Kyule, D.; Mirera, D.; Obiero, K.; Hagiwara, A.; Orina, P.; Munguti, J.; Ochiewo, J.; Musa, S.; et al. State of Aquaculture Report in Kenya 2021; Kenya Marine and Fisheries Research Institute: Nairobi, Kenya, 2021. [Google Scholar]
- Australian and New Zealand Guidelines for Fresh and Marine Water Quality; Australian Water Association: Sydney, Australia; NZ Water & Wastes Association: Wellington, New Zealand, 2018.
- Department of Environment and Natural Resources. Water Quality Guidelines and General Effluent Standards of 2016; Department of Environment and Natural Resources: Quezon, Philippines, 2016.
- Lawson, T.B. Fundamentals of Aquacultural Engineering; Xluwer Academic Publishers: Boston, MA, USA; Dordrecht, The Netherlands; London, UK,, 1995. [Google Scholar] [CrossRef]
- Franklin, P.A. Dissolved oxygen criteria for freshwater fish in New Zealand: A revised approach. N. Z. J. Mar. Freshw. Res. 2013, 48, 112–126. [Google Scholar] [CrossRef]
- Lloyd, R. Pollution and Freshwater Fish, 1st ed.; Fishing News Books Ltd.: London, UK, 1992. [Google Scholar]
- Bergheim, A.; Selmer-Olsen, A.R. River pollution from a large trout farm in Norway. Aquaculture 1978, 14, 267–270. [Google Scholar] [CrossRef]
- Roberts, R.J.; Shepherd, C.J. Handbook of Trout and Salmon Diseases, 1st ed.; Fishing News: London, UK, 1974. [Google Scholar]
- Stiff, M.J.; Cartwright, N.G.; Crane, R.I. Environmental Quality Standards for Dissolved Oxygen, 1st ed.; National Rivers Authority: Bristol, UK, 1992.
- Beamish, F. Respiration of fishes with special emphasis on standard oxygen consumption: III. Influence of oxygen. Can. J. Zool. 2011, 42, 355–366. [Google Scholar] [CrossRef]
- Glińska-Lewczuk, K.; Burandt, P.; Kujawa, R.; Kobus, S.; Obolewski, K.; Dunalska, J.; Grabowska, M.; Lew, S.; Chormański, J. Environmental Factors Structuring Fish Communities in Floodplain Lakes of the Undisturbed System of the Biebrza River. Water 2016, 8, 146. [Google Scholar] [CrossRef] [Green Version]
- Boyd, C.E.; Tucker, C.S.; Somridhivej, B. Alkalinity and Hardness: Critical but Elusive Concepts in Aquaculture. J. World Aquac. Soc. 2016, 47, 6–41. [Google Scholar] [CrossRef]
- Luo, Z.; Hu, S.; Chen, D. The trends of aquacultural nitrogen budget and its environmental implications in China. Sci. Rep. 2018, 8, 10877. [Google Scholar] [CrossRef] [Green Version]
- Sugiura, S.H. Phosphorus, Aquaculture, and the Environment. Rev. Fish. Sci. Aquac. 2018, 26, 515–521. [Google Scholar] [CrossRef]
- Resma, N.S.; Meaze, M.H.; Hossain, S.; Khandaker, M.U.; Karnal, M.; Deb, N. The presence of toxic metals in popular farmed fish species and estimation of health risks through their consumption. Phys. Open 2020, 5, 100052. [Google Scholar] [CrossRef]
- Ling, T.; Soo, C.L.; Heng, T.L.; Nyanti, L.; Sim, S.; Grinang, J. Physicochemical Characteristics of River Water Downstream of a Large Tropical Hydroelectric Dam. J. Chem. 2016, 2016, 7895234. [Google Scholar] [CrossRef] [Green Version]
- de Oliveira, K.L.; Ramos, R.L.; Oliveira, S.C.; Christofaro, C. Water quality index and spatio-temporal perspective of a large Brazilian water reservoir. Water Supply 2021, 21, 971–982. [Google Scholar] [CrossRef]
- Tomczyk, P.; Wiatkowski, M.; Gruss, Ł.; Buta, B.; Kasperek, R.; Głowski, R.; Rembielak, K. Hydropower impact on water quality: A case study on the Michalice Reservoir, Poland. Environ. Eng. Manag. J. 2021, 5, 725–738. [Google Scholar] [CrossRef]

| No. | Parameter | Name of the Method | Measurement Range |
|---|---|---|---|
| 1. | pH | Potentiometric method | 0.00–14.00 |
| 2. | Electrical conductivity (EC) | Conductometric method | 0.1–2000 µS/cm |
| 3. | Temperature of water (Temp.) | Temperature sensor (in situ tests) | −50.0–199.9 °C |
| 4. | Turbidity (Turb.) | Nephelometric method | 0.1–1000 NTU |
| 5. | Ammonium nitrogen (NH4-N) | Spectrophotometric method | 0.001–1000 mg/L |
| 6. | Nitrate nitrogen (NO3-N) | 0.1–7.0 mg/L | |
| 7. | Nitrite nitrogen (NO2-N) | 0.001–1.2 mg/L | |
| 8. | Phosphate phosphorus (PO4-P) | 0.001–0.5 mg/L | |
| 9. | Dissolved oxygen (DO) | Electrochemical sensor | 0.00–20.00 mg/L |
| 10. | Biochemical oxygen demand (BOD5) | Dilution method | 0.1–2000 mg/L |
| Classification | 1st Class (Very Good Status) | 2nd Class (Good Status) | 3rd Class (Below Good Status) | |
|---|---|---|---|---|
| Parameter (Unit) | ||||
| Temperature (°C) | ≤22.0 | 22.1–24.0 | >24.0 | |
| DO (mg/L) | ≥8.2 | 7.4–8.1 | <7.4 | |
| BOD5 (mg/L) | ≤3.0 | 3.1–4.9 | >4.9 | |
| EC (μS/cm) | ≤753 | 754–850 | >850 | |
| pH (-) | 7.7–8.4 | 7.5–8.4 | <7.5, >8.4 | |
| NH4-N (mg/L) | ≤0.760 | 0.761–0.843 | >0.843 | |
| NO3-N (mg/L) | ≤2.0 | 2.1–2.2 | >2.2 | |
| NO2-N (mg/L) | ≤0.01 | 0.02–0.03 | >0.03 | |
| PO4-P (mg/L) | ≤0.065 | 0.066–0.101 | >0.101 | |
| Reference | Vollenweider (1965) [23] | Sakamoto (1966) [24] | EPA Survey (1974) [25] | Carlson and Simpson (1996) [22] | |
|---|---|---|---|---|---|
| Trophic Status | |||||
| Oligotrophic | <10 | <20 | <10 | <6 | |
| Oligo-mesotrophic | 10–20 | - | - | 6–12 | |
| Mesotrophic | 20–50 | 20–50 | 10–20 | 12–24 | |
| Mesoeutrophic | 50–100 | - | - | 24–48 | |
| Eutrophic | >100 | >50 | >20 | 48–96 | |
| Hypertrophic | - | - | - | >96 | |
| TLI Value | Trophic Status | Description |
|---|---|---|
| 0.0–2.0 | Microtrophic | Very clean water, with very low levels of nutrients and algae, often glacial water, very good water quality |
| 2.01–3.0 | Oligotrophic | Low levels of nutrients and algae, clear and blue water, good water quality |
| 3.01–4.0 | Mesotrophic | Average levels of nutrients and algae, moderate water quality |
| 4.01–5.0 | Eutrophic | High amounts of nutrients and algae, cloudy water, poor water quality |
| 5.01–9.0 | Supertrophic | Very large amounts of phosphorus and nitrogen, significant algae blooms, poor water transparency, usually not meeting the standards for recreation, very poor water quality |
| Parameter | Compliance Rate of the Results (Percentile) | A Group of Fish | Requirement |
|---|---|---|---|
| Temperature | 98% | Salmonids | max 21.5 °C and ∆ 1.5 °C |
| Cyprinids | max 28.0 °C and ∆ 3.0 °C | ||
| DO | 100% | Salmonids | min 7 mg/L |
| Cyprinids | min 5 mg/L | ||
| pH | 95% | Salmonids, cyprinids | 6–9 and max ∆ 0.5 |
| BOD5 | 95% | Salmonids | max 3 mg/L |
| Cyprinids | max 6 mg/L | ||
| TP | 95% | Salmonids | max 0.2 mg/L |
| Cyprinids | max 0.4 mg/L | ||
| NO2 | 95% | Salmonids | max 0.01 mg/L |
| Cyprinids | max 0.03 mg/L | ||
| NH4-N | 95% | Salmonids, cyprinids | max 0.78 mg/L |
| Index Name | Data for the Index Calculation | Parameters Taken into Account | Final Index Value | |
|---|---|---|---|---|
| Equation | Explanation of Symbols | |||
| Oregon Water Quality Index (OWQI) [33,45,46,54] | Median value | DO, pH, BOD5, NH4 + NO3, TP, temperature | OWQI—the final index value, SIi—the sub-index value for each parameter, and n—the number of parameters considered in the calculations. | |
| Overall Index of Pollution (OIP) [33,46,54] | Maximum value * | Turbidity, pH, BOD5, NO3 | OIP—the final index value, Pi—the sub-index value for each parameter, and n—the number of parameters considered in the calculations. | |
| Dinius Water Quality Index (DWQI) [33,46,47,54] | Maximum value * | pH, BOD5, temperature, NO3 | DWQI—the final index value, Ii—the sub-index value for each parameter, wi—the weight value of each parameter (pH = 0.226, BOD5 = 0.284, temperature = 0.226, NO3 = 0.264), and n—the number of parameters considered in the calculations. | |
| Indian Central Pollution Control Board Water Quality Index (CPCB WQI) [33,46,48,54] | Maximum value * | pH and BOD5 | CPCB WQI—the final index value. Ii is the sub-index value for each parameter, wi—the weight value for each parameter (pH = 0.537, BOD5 = 0.463), and n—the number of parameters considered in the calculations. | |
| Universal Water Quality Index (UWQI) [33,46,49,54] | 90th percentile ** | DO, pH, BOD5, TP, NO3 | UWQI—the final index value, Ii—the sub-index value for each parameter, wi—the weight value for each parameter (DO = 0.332, pH = 0.085, BOD5 = 0.166, TP = 0.166, NO3 = 0.251), and n—the number of parameters considered in the calculations. | |
| The National Sanitation Foundation Water Quality Index (NSF WQI) [50,51,52,53,54] | Raw data | pH, EC, NO3-N, PO4-P, DO, BOD5 | NSF WQI = | NSF WQI—the final index value, qi—the percentage of samples that fall within the limit values of the parameters, wi—the weight value for each parameter (pH = 0.04, EC = 0.13, NO3-N = 0.11, PO4-P = 0.20, DO = 0.28, BOD5 = 0.24), and n—the number of parameters considered in the calculations. |
| Point | 1 (Median ± SD) | 2 (Median ± SD) | 3 (Median ± SD) | 4 (Median ± SD) | |
|---|---|---|---|---|---|
| Parameter | |||||
| pH | 8.00 ± 0.48 | 7.90 ± 0.50 | 8.00 ± 0.51 | 8.00 ± 0.45 | |
| EC (µS/cm) | 1087 ± 358 | 1103 ± 363 | 1103 ± 359 | 1082 ± 358 | |
| Temp. (°C) | 13.70 ± 7.59 | 13.80 ± 7.47 | 13.70 ± 7.48 | 13.70 ± 7.35 | |
| Turb. (NTU) | 3.70 ± 7.30 | 3.78 ± 9.44 | 3.70 ± 7.02 | 3.40 ± 7.13 | |
| NH4-N (mg/L) | 0.16 ± 0.17 | 0.15 ± 0.17 | 0.14 ± 0.17 | 0.14 ± 0.16 | |
| NO3-N (mg/L) | 1.33 ± 0.91 | 1.70 ± 0.92 | 1.57 ± 0.93 | 1.40 ± 0.93 | |
| NO2-N (mg/L) | 0.026 ± 0.019 | 0.024 ± 0.019 | 0.021 ± 0.020 | 0.021 ± 0.019 | |
| PO4-P (mg/L) | 0.090 ± 0.037 | 0.085 ± 0.037 | 0.080 ± 0.039 | 0.085 ± 0.036 | |
| DO (mg/L) | 9.20 ± 1.89 | 9.10 ± 1.83 | 8.85 ± 2.09 | 9.00 ± 1.90 | |
| BOD5 (mg/L) | 2.50 ± 2.19 | 2.45 ± 1.85 | 2.70 ± 1.72 | 2.80 ± 2.67 | |
| Test Statistics Parameter | Point 1/2 | Point 3/4 | ||
|---|---|---|---|---|
| Z | p | Z | p | |
| pH | −1.118 | 0.264 | −2.138 | 0.033 * |
| EC | −2.763 | 0.006 * | −1.890 | 0.059 |
| Temperature | −0.989 | 0.323 | −1.598 | 0.110 |
| Turbidity | −0.009 | 0.993 | −0.721 | 0.471 |
| NH4-N | −1.580 | 0.114 | −0.055 | 0.956 |
| NO3-N | −1.304 | 0.192 | −1.753 | 0.080 |
| NO2-N | −0.317 | 0.751 | −1.837 | 0.066 |
| PO4-P | −2.032 | 0.042 * | −0.548 | 0.584 |
| DO | −0.039 | 0.969 | −1.924 | 0.054 |
| BOD5 | −1.017 | 0.309 | −0.187 | 0.852 |
| Parameter | Comparison of the Results of Upstream and Downstream HPs (Average Physicochemical Status) | |||||
|---|---|---|---|---|---|---|
| Wrocław II Hydropower Plant (HP) | Wrocław I Hydropower Plant (HP) | |||||
| Improvement | Deterioration | No Changes | Improvement | Deterioration | No Changes | |
| pH | 8.33% | 2.78% | 88.89% | 0.00% | 2.78% | 97.22% |
| EC | 2.78% | 2.78% | 94.44% | 0.00% | 2.78% | 97.22% |
| Temperature | 0.00% | 0.00% | 100.00% | 0.00% | 0.00% | 100.00% |
| NH4-N | 0.00% | 0.00% | 100.00% | 0.00% | 0.00% | 100.00% |
| NO3-N | 11.11% | 0.00% | 88.89% | 8.33% | 11.11% | 80.56% |
| NO2-N | 2.78% | 0.00% | 97.22% | 2.78% | 5.56% | 91.67% |
| PO4-P | 8.33% | 19.44% | 72.22% | 19.44% | 16.67% | 63.89% |
| DO | 5.56% | 8.33% | 86.11% | 2.78% | 11.11% | 86.11% |
| BOD5 | 5.56% | 16.67% | 77.78% | 8.33% | 13.89% | 77.78% |
| Parameter | Comparison of the Results Upstream and Downstream of HPs (Meeting Standards—Limit Values) | |||||
|---|---|---|---|---|---|---|
| Wrocław II Hydropower Plant (HP) | Wrocław I Hydropower Plant (HP) | |||||
| Improvement | Deterioration | No Changes | Improvement | Deterioration | No Changes | |
| EC | 22.22% | 72.22% | 5.56% | 52.78% | 36.11% | 11.11% |
| Temperature | 30.56% | 38.89% | 30.56% | 44.44% | 22.22% | 33.33% |
| NH4-N | 52.78% | 30.56% | 16.67% | 38.89% | 30.56% | 30.56% |
| NO3-N | 44.44% | 55.56% | 0.00% | 58.33% | 36.11% | 5.56% |
| NO2-N | 27.78% | 25.00% | 47.22% | 30.56% | 13.89% | 55.56% |
| PO4-P | 47.22% | 19.44% | 33.33% | 22.22% | 38.89% | 38.89% |
| DO | 47.22% | 38.89% | 13.89% | 58.33% | 27.78% | 13.89% |
| BOD5 | 55.56% | 41.67% | 2.78% | 44.44% | 44.44% | 11.11% |
| Point | Carlson Index (TSIP) | Classification | |||
|---|---|---|---|---|---|
| Vollenweider (1965) [23] | Sakamoto (1966) [24] | EPA Survey (1974) [25] | Carlson and Simpson (1996) [22] | ||
| 1 | 69.47 | Mesotrophic | Eutrophic | Eutrophic | Eutrophic |
| 2 | 68.31 | ||||
| 3 | 68.90 | ||||
| 4 | 68.49 | ||||
| Point | TLIP | TLIN | Trophic Level Index (TLI) | Classification |
|---|---|---|---|---|
| 1 | 5.05 | 5.96 | 5.51 | hypertrophic |
| 2 | 5.11 | 5.86 | 5.48 | |
| 3 | 5.01 | 5.91 | 5.46 | |
| 4 | 5.08 | 5.88 | 5.48 |
| Parameter | Group of Fish | Point | |||
|---|---|---|---|---|---|
| 1 | 2 | 3 | 4 | ||
| Temperature | Salmonids (max value) | − | − | − | − |
| Cyprinids (max value) | + | + | + | + | |
| Salmonids (max ∆) | + | + | |||
| Cyprinids (max ∆) | + | + | + | + | |
| DO | Salmonids | − | − | − | + |
| Cyprinids | + | + | + | + | |
| pH | Salmonids and cyprinids (values) | + | + | + | + |
| Salmonids and cyprinids (max ∆) | + | + | |||
| BOD5 | Salmonids | − | − | − | − |
| Cyprinids | − | − | − | − | |
| TP | Salmonids | + | + | + | + |
| Cyprinids | + | + | + | + | |
| NO2 | Salmonids | − | − | − | − |
| Cyprinids | − | − | − | − | |
| NH4-N | Salmonids and cyprinids | + | + | + | + |
| Reference | Vaikasas et al., 2015 [59] | Luo et al., 2019 [60] | Xu et al., 2022 [61] | Valero, 2012 [57] | Fantin-Cruz et al., 2015 [58] | Tomczyk and Wiatkowski 2021 [62] | This Research | ||
|---|---|---|---|---|---|---|---|---|---|
| Parameter | |||||||||
| pH | 0.17% | 0.93% to 2.16% | −1.25 % to 0.00% | ||||||
| Temperature | 2.73% | −0.10% to 2.14% | 0.00% to 0.73% | ||||||
| EC | −7.50% | −2.02% to −1.17% | −1.90% to 1.47% | ||||||
| Turbidity | −38.00% | −7.14% to 5.95% | −8.11% to 2.16% | ||||||
| DO | −35.09% | 7.12% | 0.56% to 14.04% | −1.09% to 1.69% | |||||
| TP | 0.00% | −26.97% | 366.7% | −85.00% to 0% | −28.00% | −7.22% to -0.19% | −5.56% to 6.25% | ||
| TN | −2.08% | 15.49% | −13.33% | −5.06% to 3.15% | −9.82% to 23.61% | ||||
| NO3-N | −14.00% | −4.97% to 5.50% | −0.83% to 27.82% | ||||||
| NH4-N | −72.72% to 8.33% | −38.89% to 22.86% | −6.25% to 0.00% | ||||||
| Installed capacity | 0.095 −0.6 MW | 0.15 −1.3 MW | 900 MW | 1800 −3000 MW | 11.82 MW | 210 MW | 0.06 −0.385 MW | 1.0 −4.83 MW | |
| Damming height | <5 m | 5–15 m | 105 m | 71–161 m | 70 m | 243 m | 1.8–3.75 m | 5.2 m | |
| Type of hydropower | impoundment (storage) | run-of-river | |||||||
| River | Virvytė, Venta, Obelis, Šušve, Varduva | Lancang | Jinsha | Lérez | Correntes | Bystrzyca | Odra | ||
| Country | Lithuania | China | Spain | Brazil | Poland | ||||
| Trophic Index | Point Location | References | ||
|---|---|---|---|---|
| Vaikasas et al., 2015 [59] | Luo et al., 2019 [60] | |||
| TSIP | Upstream HP | 58.05 | 58.05 | 53.20 |
| Downstream HP | 59.67 | 64.34 | 75.41 | |
| TLIP | Upstream HP | 4.96 | 4.96 | 4.53 |
| Downstream HP | 5.10 | 5.51 | 6.48 | |
| TLIN | Upstream HP | 6.19 | 7.60 | 5.95 |
| Downstream HP | 6.19 | 7.76 | 5.76 | |
| TLI | Upstream HP | 5.57 | 6.28 | 5.24 |
| Downstream HP | 5.64 | 6.64 | 6.12 | |
| Information about hydropower plants | ||||
| Location of hydropower plants | Lithuania | China | ||
| Type of hydropower plants | storage | |||
| Hydropower plants’ capacity | 0.095–0.6 MW | 0.15–1.3 MW | 900 MW | |
| Damming height | <5 m | 5–15 m | 105 m | |
| Percentage Difference in the Values of Water Quality Indices Downstream and Upstream of Hydropower Plants | ||||||||
|---|---|---|---|---|---|---|---|---|
| Reference | Ling et al., 2016 [92] | de Oliveira et al., 2021 [93] | Luo et al., 2019 [60] | Tomczyk et al., 2021 [94] | Tomczyk and Wiatkowski, 2021 [62] | This Research | ||
| WQIs | ||||||||
| ATI | 14.25% | −9.13% | −1.48% | −2.22% | −0.49% | n/a | n/a | |
| OWQI | 24.26% | −39.10% | 5.15% | −69.09% | 2.40% | −5.65% | 2.18% | |
| OIP | 1.62% | −60.35% | n/a | −0.63% | 0.44% | 0.61% | −21.75% | |
| DWQI | 2.55% | −29.41% | n/a | 0.74% | 2.07% | 1.64% | −1.04% | |
| CPCB WQI | 4.93% | −37.38% | n/a | −3.13% | 1.72% | 8.59% | −3.69% | |
| UWQI | n/a | n/a | n/a | 5.40% | 6.21% | 1.35% | 2.96% | |
| Median | 4.93% | −37.38% | 1.83% | −1.42% | 1.90% | 1.35% | −1.04% | |
| Average | 9.52% | −35.07% | 1.83% | −11.49% | 2.06% | 1.31% | −4.27% | |
| Information about hydropower plants | ||||||||
| Installed capacity | 2400 MW | 399 MW | 900 MW | 0.045 MW | 0.07 MW | 1.0 MW | 4.83 MW | |
| Damming height | 205 m | 208 m | 105 m | 2.5 m | 2.2 m | 5.2 m | 5.2 m | |
| Type of hydropower | impoundment (storage) | run-of-river | ||||||
| River | Balui | Jequitinhonha | Lancang | Widawa | Bystrzyca | Odra | ||
| Country | Malaysia | Brazil | China | Poland | ||||
Publisher’s Note: MDPI stays neutral with regard to jurisdictional claims in published maps and institutional affiliations. |
© 2022 by the authors. Licensee MDPI, Basel, Switzerland. This article is an open access article distributed under the terms and conditions of the Creative Commons Attribution (CC BY) license (https://creativecommons.org/licenses/by/4.0/).
Share and Cite
Tomczyk, P.; Wiatkowski, M.; Kuriqi, A. Small Hydropower Plants’ Impacts on the Ecological Status Indicators of Urban Rivers. Appl. Sci. 2022, 12, 12882. https://doi.org/10.3390/app122412882
Tomczyk P, Wiatkowski M, Kuriqi A. Small Hydropower Plants’ Impacts on the Ecological Status Indicators of Urban Rivers. Applied Sciences. 2022; 12(24):12882. https://doi.org/10.3390/app122412882
Chicago/Turabian StyleTomczyk, Paweł, Mirosław Wiatkowski, and Alban Kuriqi. 2022. "Small Hydropower Plants’ Impacts on the Ecological Status Indicators of Urban Rivers" Applied Sciences 12, no. 24: 12882. https://doi.org/10.3390/app122412882