Article

Expanding Moment Magnitude Pools for Earthquake Magnitude Homogenization

Department of Nuclear Power Plant Engineering, KEPCO International Nuclear Graduate School, Ulsan 45014, Republic of Korea
*
Author to whom correspondence should be addressed.
Appl. Sci. 2022, 12(24), 12921; https://doi.org/10.3390/app122412921
Submission received: 14 November 2022 / Revised: 8 December 2022 / Accepted: 14 December 2022 / Published: 15 December 2022
(This article belongs to the Section Earth Sciences)

Abstract

:
A comparison on the influence of different moment magnitude pools on magnitude homogenization regressions was presented. The control moment magnitude pool is composed of earthquake records from GCMT. One version of expanding this base is to add earthquakes with a moment magnitude recorded by seismological agencies related to GCMT. Another approach to expanding the base is to add earthquakes from seismological agencies and projects that show a significant statistical correlation to GCMT via hypothesis testing. These moment magnitude pools were developed for Indonesia and South Korea. Magnitude homogenization was conducted by performing linear least squares regressions between the three moment magnitude pools and commonly used magnitude types from international seismological agencies ISC and NEIC. Magnitude homogenization regressions were also conducted on local Indonesian and South Korean agencies, DJA and KMA, respectively, with their various magnitude types. Most of the moment magnitude pools involving DJA and virtually all South Korean-related agencies ended up being identical, primarily due to the local magnitude types available for DJA, and the low number of earthquakes recorded for South Korea. A majority of the regression parameters for Indonesia and South Korea were statistically similar for surface and body wave magnitude types.

1. Introduction

Studies on earthquake risk and recurrence generally derive components from an earthquake catalog. These catalogs are collections of earthquake events containing at a minimum information regarding earthquake occurrence, hypocenter, magnitude, and magnitude type. One of the drawbacks to such a catalog is the diversity of magnitude types recorded, making it very difficult to make comparisons and to derive consistent parameters from the catalog. Seismologists and earthquake engineers generally develop and apply magnitude homogenization relationships to the catalog so that the magnitude data is unified under one specific magnitude type [1,2,3,4].
A typical magnitude type that modern earthquake risk and recurrence studies utilize is the moment magnitude, MW [5]. Generally, regressions are made between MW from a reliable agency against the remaining magnitude types in the target earthquake catalog, usually surface wave magnitude, MS, body wave magnitude, mb, local magnitude ML, and on occasion to MW from other agencies. The representative MW from these magnitude homogenization regressions are typically called proxy magnitude, MW,proxy. However, most resultant earthquake catalogs do not explicitly indicate which magnitudes are MW,proxy.
Catalogs containing many earthquakes with reliably recorded MWs make magnitude homogenization easier, as the pool of available events for homogenization is wider. However, many catalogs do not have many low MW events as well as regional seismicity limitations. Additionally, a better understanding of MW can help in the seismic risk assessment of regional infrastructure [6]. Some studies have tried to expand the pool of MWs for regression through the identification of similar or reliable sources [3,4,7] while others suggest the regression results from magnitude homogenization help indicate magnitude type similarity [2,3,4,8], although similarity and reliability were variably defined.
This study attempts to compare three approaches in extending the earthquake catalog MW pool and its effects on magnitude homogenization. One of these three approaches can be considered the control, where the MW pool is from a single reliable seismological agency. Another approach is to pool together MW records from agencies associated with the control agency in addition to other relatively reliable sources. The third approach is to develop the MW pool by utilizing statistical hypothesis testing to determine which agencies’ magnitudes are significantly similar to those from control agencies or other related agencies. These three approaches are to be applied to earthquake catalogs of a seismically active region, Indonesia, and a relatively less active region, South Korea. The scope is limited to earthquake records from major global seismological agencies and a local agency to each region. By comparing different regions and focusing on certain sources, the results can help reveal what additional impacts the three approaches have on magnitude homogenization.

2. Materials and Methods

2.1. Earthquake Catalog Construction

Several global sources will be used to construct Indonesian and South Korean earthquake catalogs for examination. The focal earthquake data source is the Global Centroid-Moment-Tensor (GCMT) Project [9]. This catalog contains events with MW from centroid moment tensor solutions and as such is considered the most reliable source of MW records [3,10,11,12]. Records start from 1976. Prior to 2006, GCMT was previously known as the Harvard CMT Project.
Another important seismological agency is the International Seismological Centre (ISC). The ISC houses a global earthquake catalog called the Reviewed ISC Bulletin, containing data from a variety of seismological agencies and projects since 1900 [13,14,15,16]. Each seismological agency or project that submits data to the ISC is identified by a code, for example, the Harvard CMT Project is identified as HRVD. Although several seismological agencies and projects submit MW records to the ISC Bulletin, the ISC itself currently does not record or compute a MW magnitude type in the ISC Bulletin. However, the ISC houses a MW catalog called the ISC-GEM Global Instrumental Earthquake Catalogue (ISC-GEM). This catalog contains three kinds of earthquake events: (i) those published by GCMT, (ii) MW,proxy estimates from re-computed MS and mb records, and (iii) events taken from literature [12,17,18,19].
Another global agency, the United States Geologic Survey National Earthquake Information Center, USGS NEIC, has submitted earthquake records to the ISC Bulletin since 1980 [20,21]. The ISC Bulletin also contains older NEIC data, when it was known as the National Earthquake Information Service, NEIS. The USGS also works with a variety of seismic networks such as the U.S. Geological Survey, GS, Coast and Geodetic Survey of the United States CGS, and the United States Coast and Geodetic Survey, USCGS that also contribute to the ISC Bulletin. For ease of use, recordings from USGS networks will be classified under the heading of NEIC. Unlike the ISC, the NEIC does publish CMT-based MWs in their bulletins [10,11,21,22].
Two local seismological agencies will be used, one for Indonesia and one for South Korea. The Indonesian agency, Badan Meteorologi, Klimatologi dan Geofisika, DJA, which previously went by the identifier of BMKG, offers a variety of magnitude types, in the ISC Bulletin. The South Korean agency, Korea Meteorological Administration, KMA, mostly offers ML although the local magnitude scale calibration had some issues [4,23,24].
A search of the catalogs is limited to a zone that extends 200 km away from each country’s borders and 50 km deep. For Indonesia, this zone is approximated by coordinates 95° E to 141° E and 11° S to 6° N. For South Korea, this zone is approximated by 122° E to 134° E and 31° N to 41° N. Data up to 2020 will be considered. There will be no distinction between main shocks, foreshocks, and aftershocks. With no distinction between dependent events and a compilation from multiple catalogs, there is a potential for duplicates in the resultant catalogs. For this study, two events are classified as duplicates if the time of occurrence is within 30 s of each other and within an epicentral distance of 0.1°. In case of duplicates, data from global catalogs take precedent over local regional catalogs in the order of GCMT, ISC-GEM, ISC, and NEIC [3,11,12], with all magnitude types assigned to the final entry.

2.2. Magnitude Homogenization

The general procedure for magnitude homogenization is to estimate a relationship between a target magnitude type from a pool of other magnitude types. To do so, regressions are made from the compiled earthquake catalogs for MW against other magnitude types. For this study, ordinary least squares regression will be applied, with a parametric form of:
MW,proxy = β1 × M + β0
where β0 is the intercept, β1 is the slope, and M is the magnitude type from an agency of interest.
Although much of the literature purports the advantages of orthogonal type regressions [1,3,25], many of these presentations assume equal measurement variance to perform their regressions as such uncertainty parameters are typically not available in the input magnitudes. Several studies suggest the a priori assumption of equal uncertainties is not true [7,11,26,27]. Moreover, the resultant regressions would suggest the input also be a random variable, which makes use of such regressions impractical. This is not to say that ordinary least squares regression is better, but that the impact of varying MW pools should not be significantly affected by regression type. Interestingly, at least one study on magnitude homogenization comparing linear and orthogonal regressions showed similar results when there were few outliers [4].

2.3. Magnitude Pool Expansion

The target scale for homogenization herein is MW from GCMT, (MW,GCMT) due to reasons stated previously. The magnitude homogenization regressions using the pool of MW,GCMT records from the compiled catalogs are considered the controls in this study. From this, two approaches are used to expand the MW,GCMT pool for magnitude homogenization.
One is to include all relevant sources related to GCMT. These include HRVD and ISC-GEM. However, only ISC-GEM records with a listed MW,GCMT or a MW from a bibliographic source are included. This excludes records where ISC homogenization was applied. Moreover, since bibliographic sources are included, earthquakes from the ISC Event Bibliography (EVBIB) with a recorded MW are also included. Most of the records in EVBIB are in ISC-GEM. This extended MW pool is called MW,GCMT-related.
Another approach is to use statistical hypothesis testing [4,8]. The assumption is if one moment magnitude type from any source is significantly similar enough to the control pool MW,GCMT, then the remaining magnitudes of the same magnitude type from the same source would also be similar to MW,GCMT. Hypothesis testing herein involves applying t-tests to regression parameters β1 and β0 derived from magnitude homogenization with other MW formats. For this study, t-tests are conducted when a magnitude type from a specific agency or project has at least 5 data pairs due to regression calculation issues. For each comparison, a calculated t-statistic, t, is used to estimate a p-value from Student’s t-distribution. This p-value represents the probability that, given a model, results as extreme as the observed results could occur. p-values are compared to a pre-determined threshold, α, where p-values less than or equal to α suggest a rejection of the null hypothesis, H0, and that the differences are statistically significant. Using an α = 0.05, the null hypotheses are H01 = 1 and H00 = 0, which is a one-to-one line in magnitude homogenization space. The t-statistic for H01 = 1 is:
t = β 1 1 SE β 1
where SE1) is the standard error of the estimate of β1 and is taken as:
SE β 1 = MSE i = 1 n x i x ¯ 2
where i is the index, n is the number of data points, xi are the dependent variable, is the mean of the dependent variable, and MSE is the mean squared error taken as:
MSE = i = 1 n y i y ^ i 2 n 2
where yi is the dependent variable and ŷi is the appropriate regression model. However, when applying hypothesis testing for the equivalence of two regressed slopes, that is H01 = βa, the t-statistic becomes:
t = β 1 β a SE β 1 2 + SE β a 2
where βa is the target regressed slope for comparison.
If the null hypothesis for the slope is not rejected, then another t-test is applied to the regressed intercept. The t-statistic for H00 = 0 is:
t = β 0 0 SE β 0
where SE0) is the standard error of the estimate of β0 and is taken as:
SE β 0 = MSE 1 n + x ¯ 2 i = 1 n x i x ¯ 2
Similar to the t-test for two regressed slopes, hypothesis testing between two regressed intercepts has a similar t-statistic as calculated in Equation (5) with the substitution of Equation (7) into Equation (5) for the standard error of the estimate of β0. If both null hypotheses for regressed slope and intercept are not rejected, then there is no significant difference between the relationships or regressions.
However, the ISC-GEM and EVBIB catalogs present special cases to the MW,GCMT pool for hypothesis testing. Data from ISC-GEM could not undergo hypothesis testing as it would be comparing a subset of ISC-GEM data from GCMT sources against the same subset of GCMT data, resulting in β1 = 1, β0 = 0, and SE1) = 0. Therefore, ISC-GEM data is included in the MW pool. Conversely, EVBIB has similar issues with ISC-GEM, but the data in EVBIB is not found in GCMT. This would result in no β1 or β0 from magnitude homogenization. The inclusion of EVBIB is under the assumption that if unedited data from ISC-GEM is reliable and included, then the data from EVBIB, i.e., similar bibliographic sources in ISC-GEM, should also be reliable and thus included in the MW pool for homogenization.
The MW pool from GCMT, ISC-GEM, and EVBIB is used to derive magnitude homogenization regressions with other MW types from other agencies. Those moment magnitude types and sources that do not reject the null hypotheses are added to an extended MW pool called MW,GCMT-hypothesis for magnitude homogenization with other non-moment magnitude types.
The control and expanded catalogs, i.e., MW, MW-related, and MW-hypothesis, are used for estimating regressions involving global agencies ISC and NEIC, as well as local regional agencies DJA and KMA. Although other agencies and projects may be considered in the magnitude expansion approach, they are not explicitly considered for magnitude homogenization herein.

3. Results

Compiled catalogs for both Indonesia and South Korea resulted in magnitude types MW, MWW, MWC, MWB, MWR, MWP, MWppsm, MS, MSZ, MS20, mb, ML, MLv, MD, and M. Note that M is an unknown magnitude type and can be treated as a ML type as noted by ISC [28]. The seismological agencies and projects that supplied these magnitude types are listed in Table 1. Although the search of the global and local catalogs returned several more seismological agencies and magnitude types not mentioned, they were not considered to remain in the scope of this study.

3.1. Indonesia

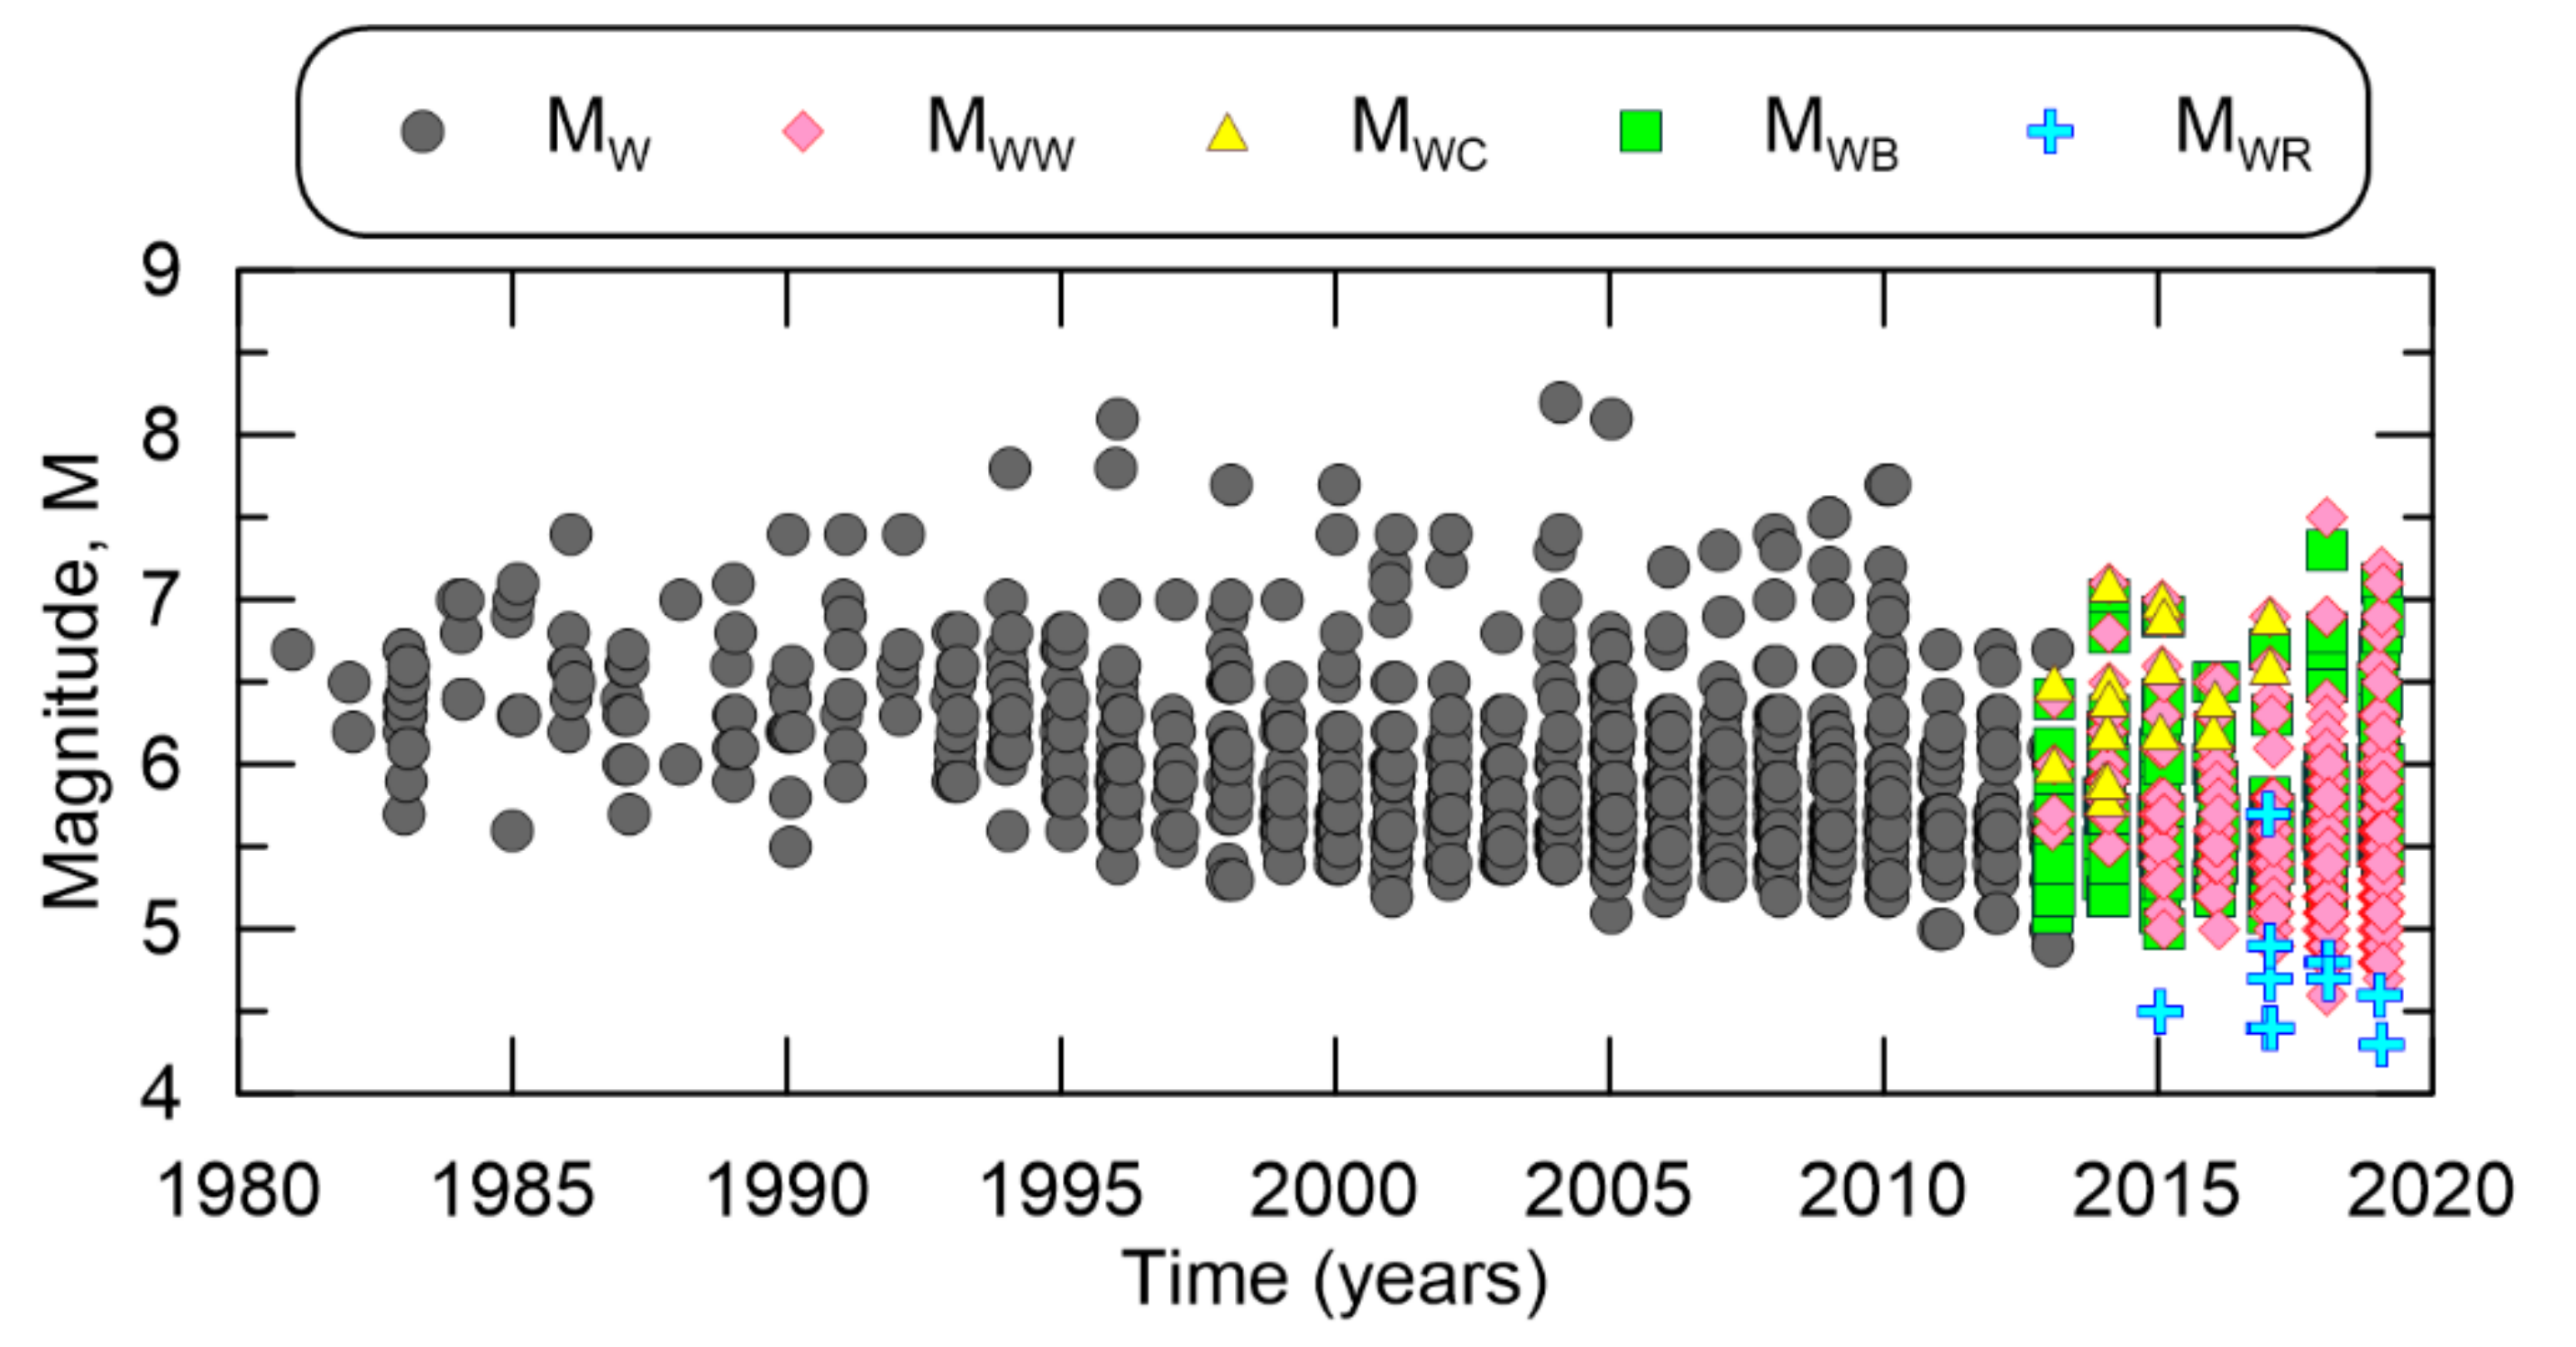
A map showing the epicenters of the search results is shown in Figure 1, demonstrating high seismicity in the region. A total of 105,327 events are in the Indonesian catalog with major contributions from ISC, NEIC, and DJA. Although moment magnitudes from NEIC include MW, MWW, MWC, MWB, MWR, there is an issue of timing. NEIC published MW from 1980 to 2013 and then changed to a combination of MWW, MWC, MWB, and MWR thereafter [22,30]. Indonesian earthquakes with NEIC moment magnitudes are plotted in Figure 2, demonstrating the timeframes when each type is valid. On the other side, Figure 3 shows DJA has an approximate 4-year gap for earthquakes with a recorded MW, from 2007 to 2009 and then from 2013 to 2019, however for MWP, DJA seems to show continuous record-keeping from 2007 to 2019. Additionally plotted in Figure 3 are some of the earthquakes from bibliographic-based sources, namely EVBIB and P&S. EVBIB only goes from 1964 to 1976, while the catalog from P&S spans 1907 to 1987. Note that both EVBIB and P&S are no longer operational, as shown in Table 1.
A tally of the different magnitude types is shown in Table 2. To present a more concise tally, all types of moment magnitude are listed under MW, all surface wave type magnitudes for NEIC are listed under MS, and all local magnitude types for DJA are listed under ML.
The table shows that the initial number of earthquakes recorded under MW,GCMT is 3915. The number of earthquakes in the MW,GCMT-related pool is 3977, with additions of 53, 3, and 6 events from ISC-GEM, EVBIB, and HRVD, respectively. The initial base of the MW,GCMT-hypothesis pool contained 3971 earthquakes from GCMT, ISC-GEM (GCMT and bibliographic sources), and EVBIB as stated previously. After hypothesis testing, the number increased to 4014, with contributions from NEIC, P&S, and MOS, the only sources that did not reject the null hypotheses for both regression slopes and intercepts, with more details shown in Table 3. The table shows that only the MW, MWB, and MWR magnitude types from NEIC had significantly similar slopes and intercepts to a one-to-one line. Test results resulted in 6, 0, 3, 34, and 0 events being added from NEIC MWR, NEIC MWB, NEIC MW, Pacheco and Sykes [29], and MOS, respectively. Note that hypothesis testing suggested HRVD recorded moment magnitude events were significantly different from a one-to-one line.
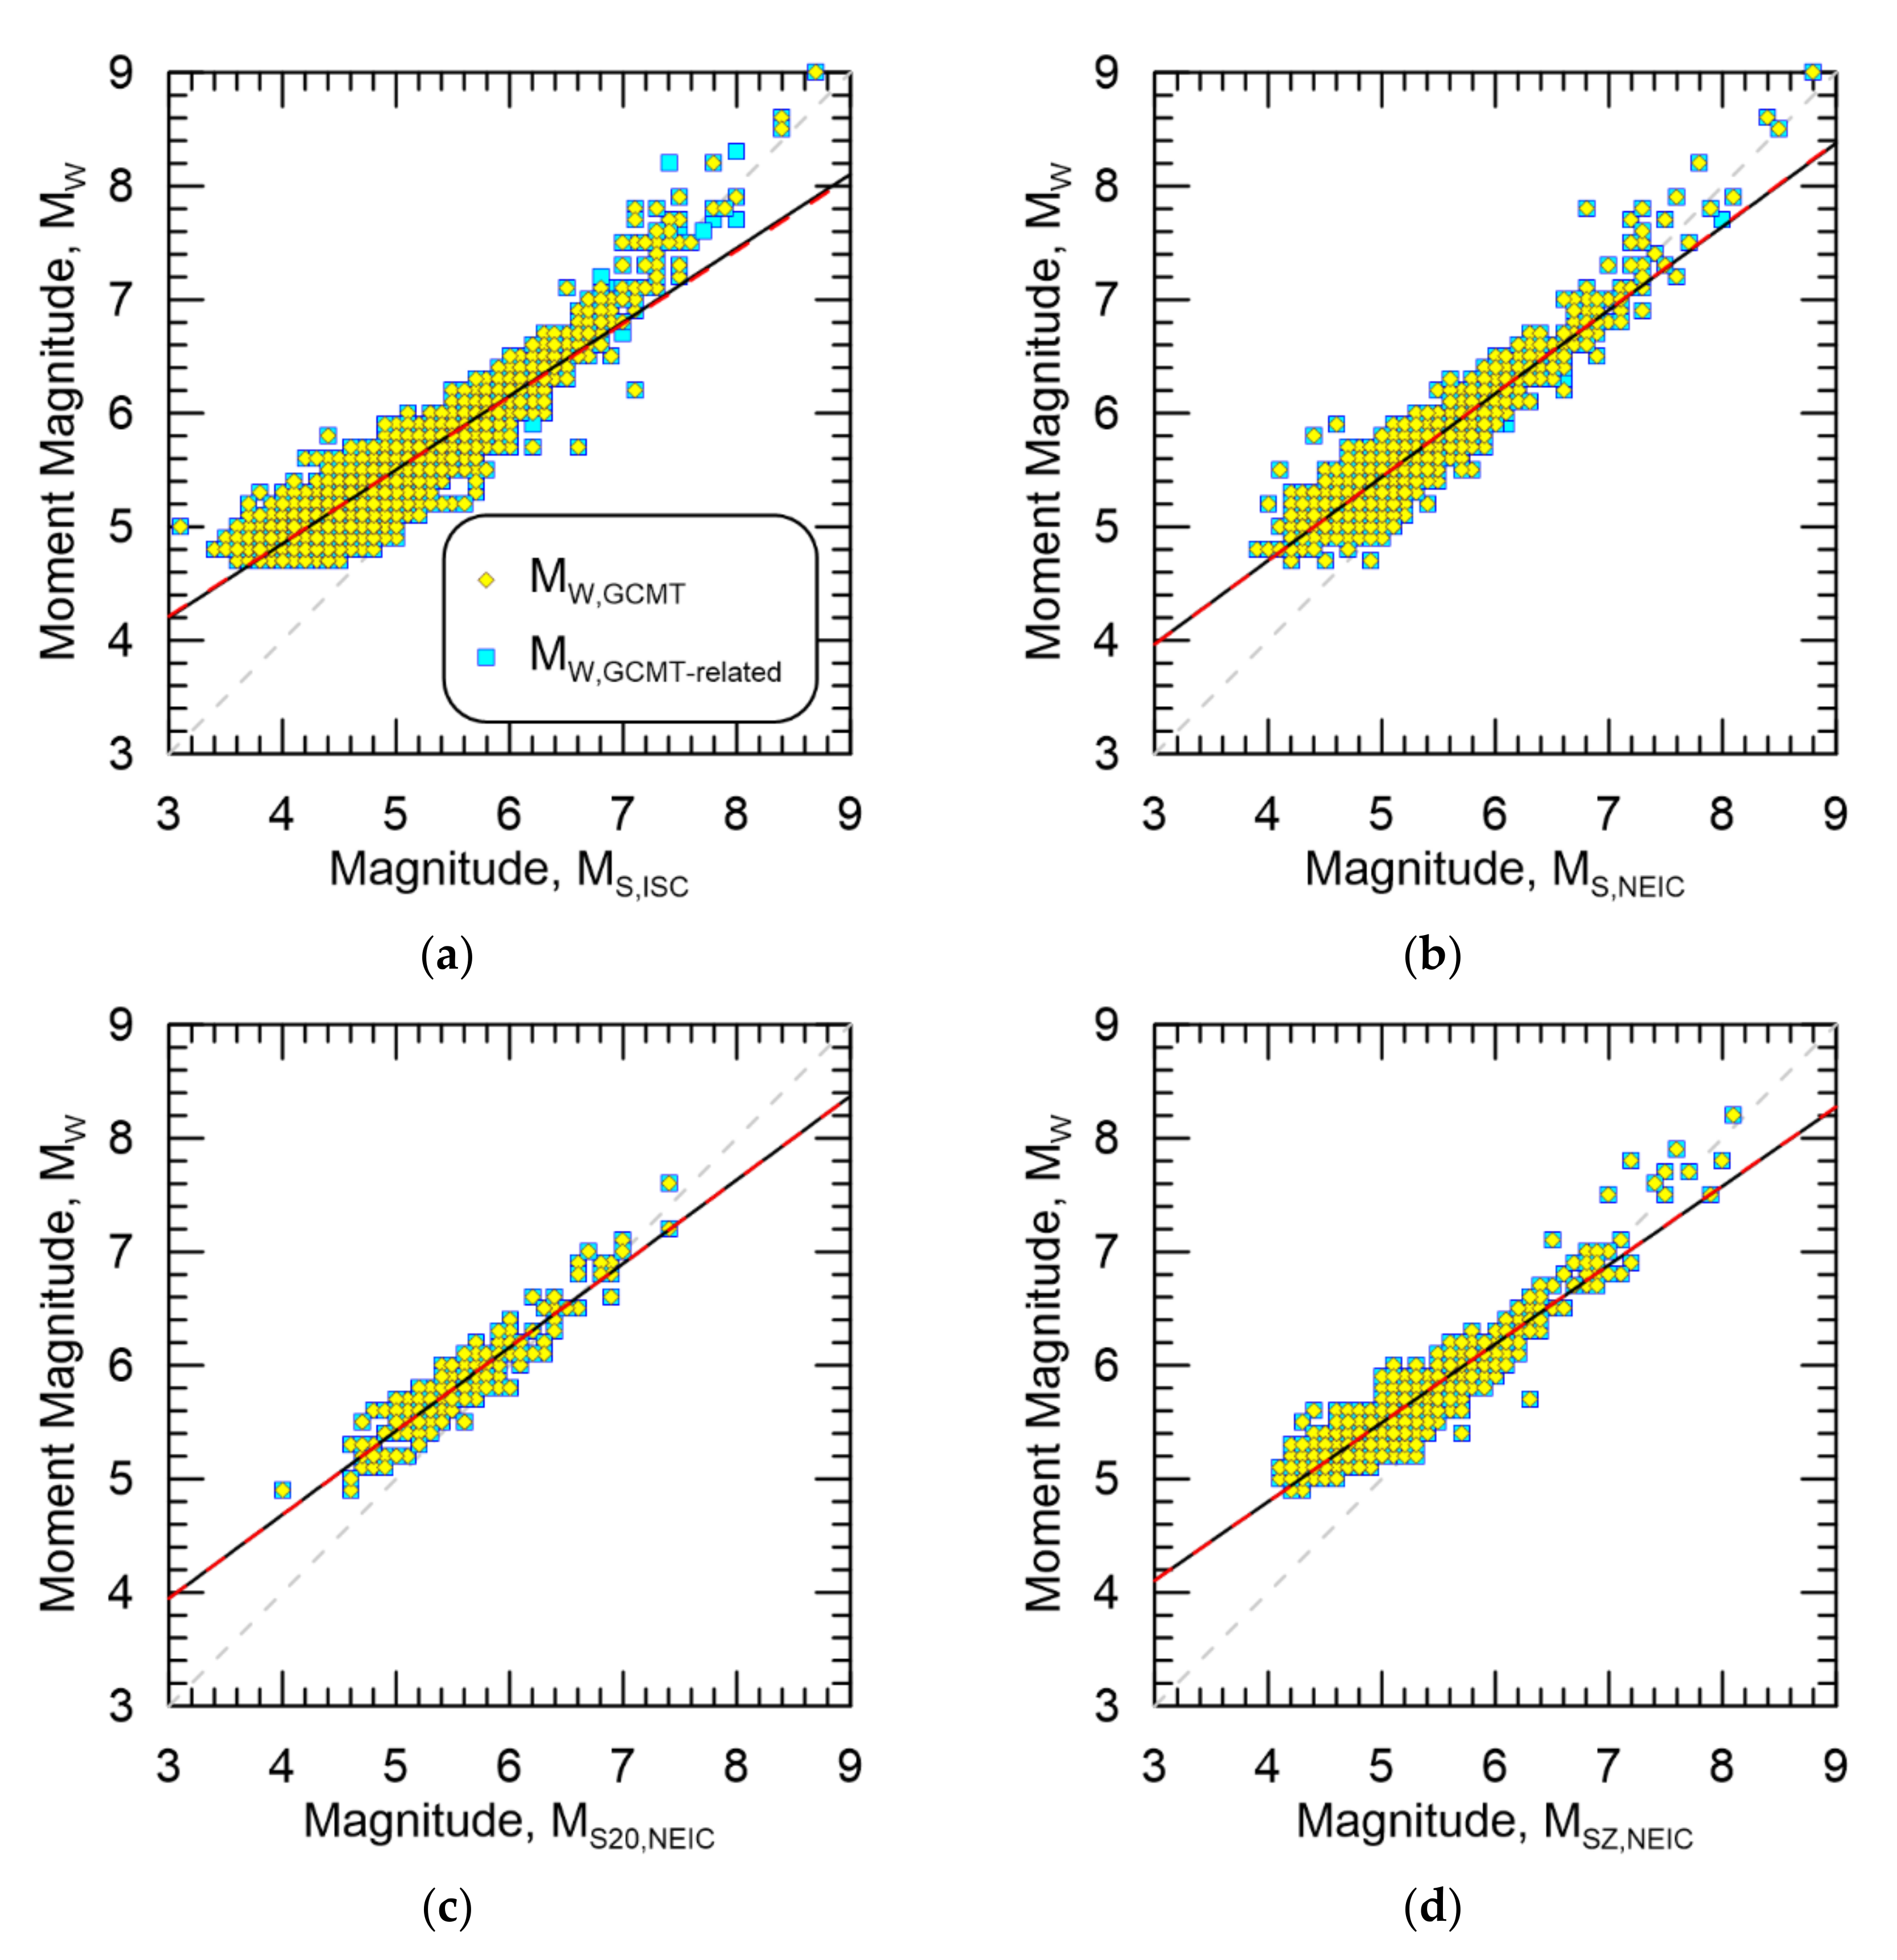
The resultant magnitude homogenization regressions for all surface wave magnitude types considered herein, i.e., MS,ISC, MS,NEIC, MS20,NEIC, MSZ,NEIC, are shown in Table 4. The results show little variation when considering different moment magnitude pools. Moreover, the MW,GCMT, MW,GCMT-related, and MW,GCMT-hypothesis pools ended up being comprised of the same events when paired with MS20,NEIC earthquakes. Although regressions with MS20,NEIC and MSZ,NEIC resulted in the lowest σ, they also used the fewest number of data points in their regressions. Interestingly, the regression results using MS,NEIC and MS20,NEIC were not significantly different, t(1461,0.05) = 1.962, p = 0.956 for the slope and p = 0.477 for the intercept, but were significantly different between MS,NEIC and MSZ,NEIC, t(2005,0.05) = 1.962, p = 0.000 for the slope and p = 0.000 for the intercept. Similar t-test results when either MW,GCMT-related or MW,GCMT-hypothesis are used. This implies that MS,NEIC and MS20,NEIC datasets can be combined to perform magnitude homogenization, a related topic mentioned in a previous study [3].
Hypothesis testing was also conducted on regression parameters across moment magnitude pools. For MS,ISC regression parameters, only results from MW,GCMT and MW,GCMT-hypothesis showed a significant difference with t(7720,0.05) = 1.960, p = 0.002 for the slope and p = 0.003 for the intercept. For MS,NEIC and MSZ,NEIC regression parameters, hypothesis testing found no significant differences across moment magnitude pools. Hypothesis testing was not conducted on regression parameters from MS20,NEIC.
Figure 4a–d show MW,GCMT-related against MS,ISC, MS,NEIC, MS20,NEIC, and MSZ,NEIC, respectively. Additionally shown in the figures are the data from MW,GCMT for comparison. As suggested from the aforementioned regressions results, there are very few differences between the datasets. Figure 5 also shows similar results for MW,GCMT-hypothesis against MS,ISC, MS,NEIC, and MSZ,NEIC. Note that all resultant regressions appear similar to each other.
The resultant magnitude homogenization regressions for all body wave magnitude types considered herein, i.e., mb,ISC, mb,NEIC, mb,DJA, are shown in Table 5. There were significantly more data points for regression across the board and increasing σ as the moment magnitude pool went from MW,GCMT to MW,GCMT-hypothesis.
Hypothesis testing was also conducted on regression parameters across moment magnitude pools. For mb,ISC and mb,DJA regression parameters, hypothesis testing found no significant differences across moment magnitude pools. However, for mb,NEIC regression parameters, all three moment magnitude pools resulted in significantly different parameters. Results from MW,GCMT differed from MW,GCMT-related and MW,GCMT-hypothesis in the intercept with t(7859,0.05) = 1.960, p = 0.02 and t(7868,0.05) = 1.960, p = 0.00, respectively. Results from MW,GCMT-related significantly differed from MW,GCMT-hypothesis with t(7913,0.05) = 1.960, p = 0.00.
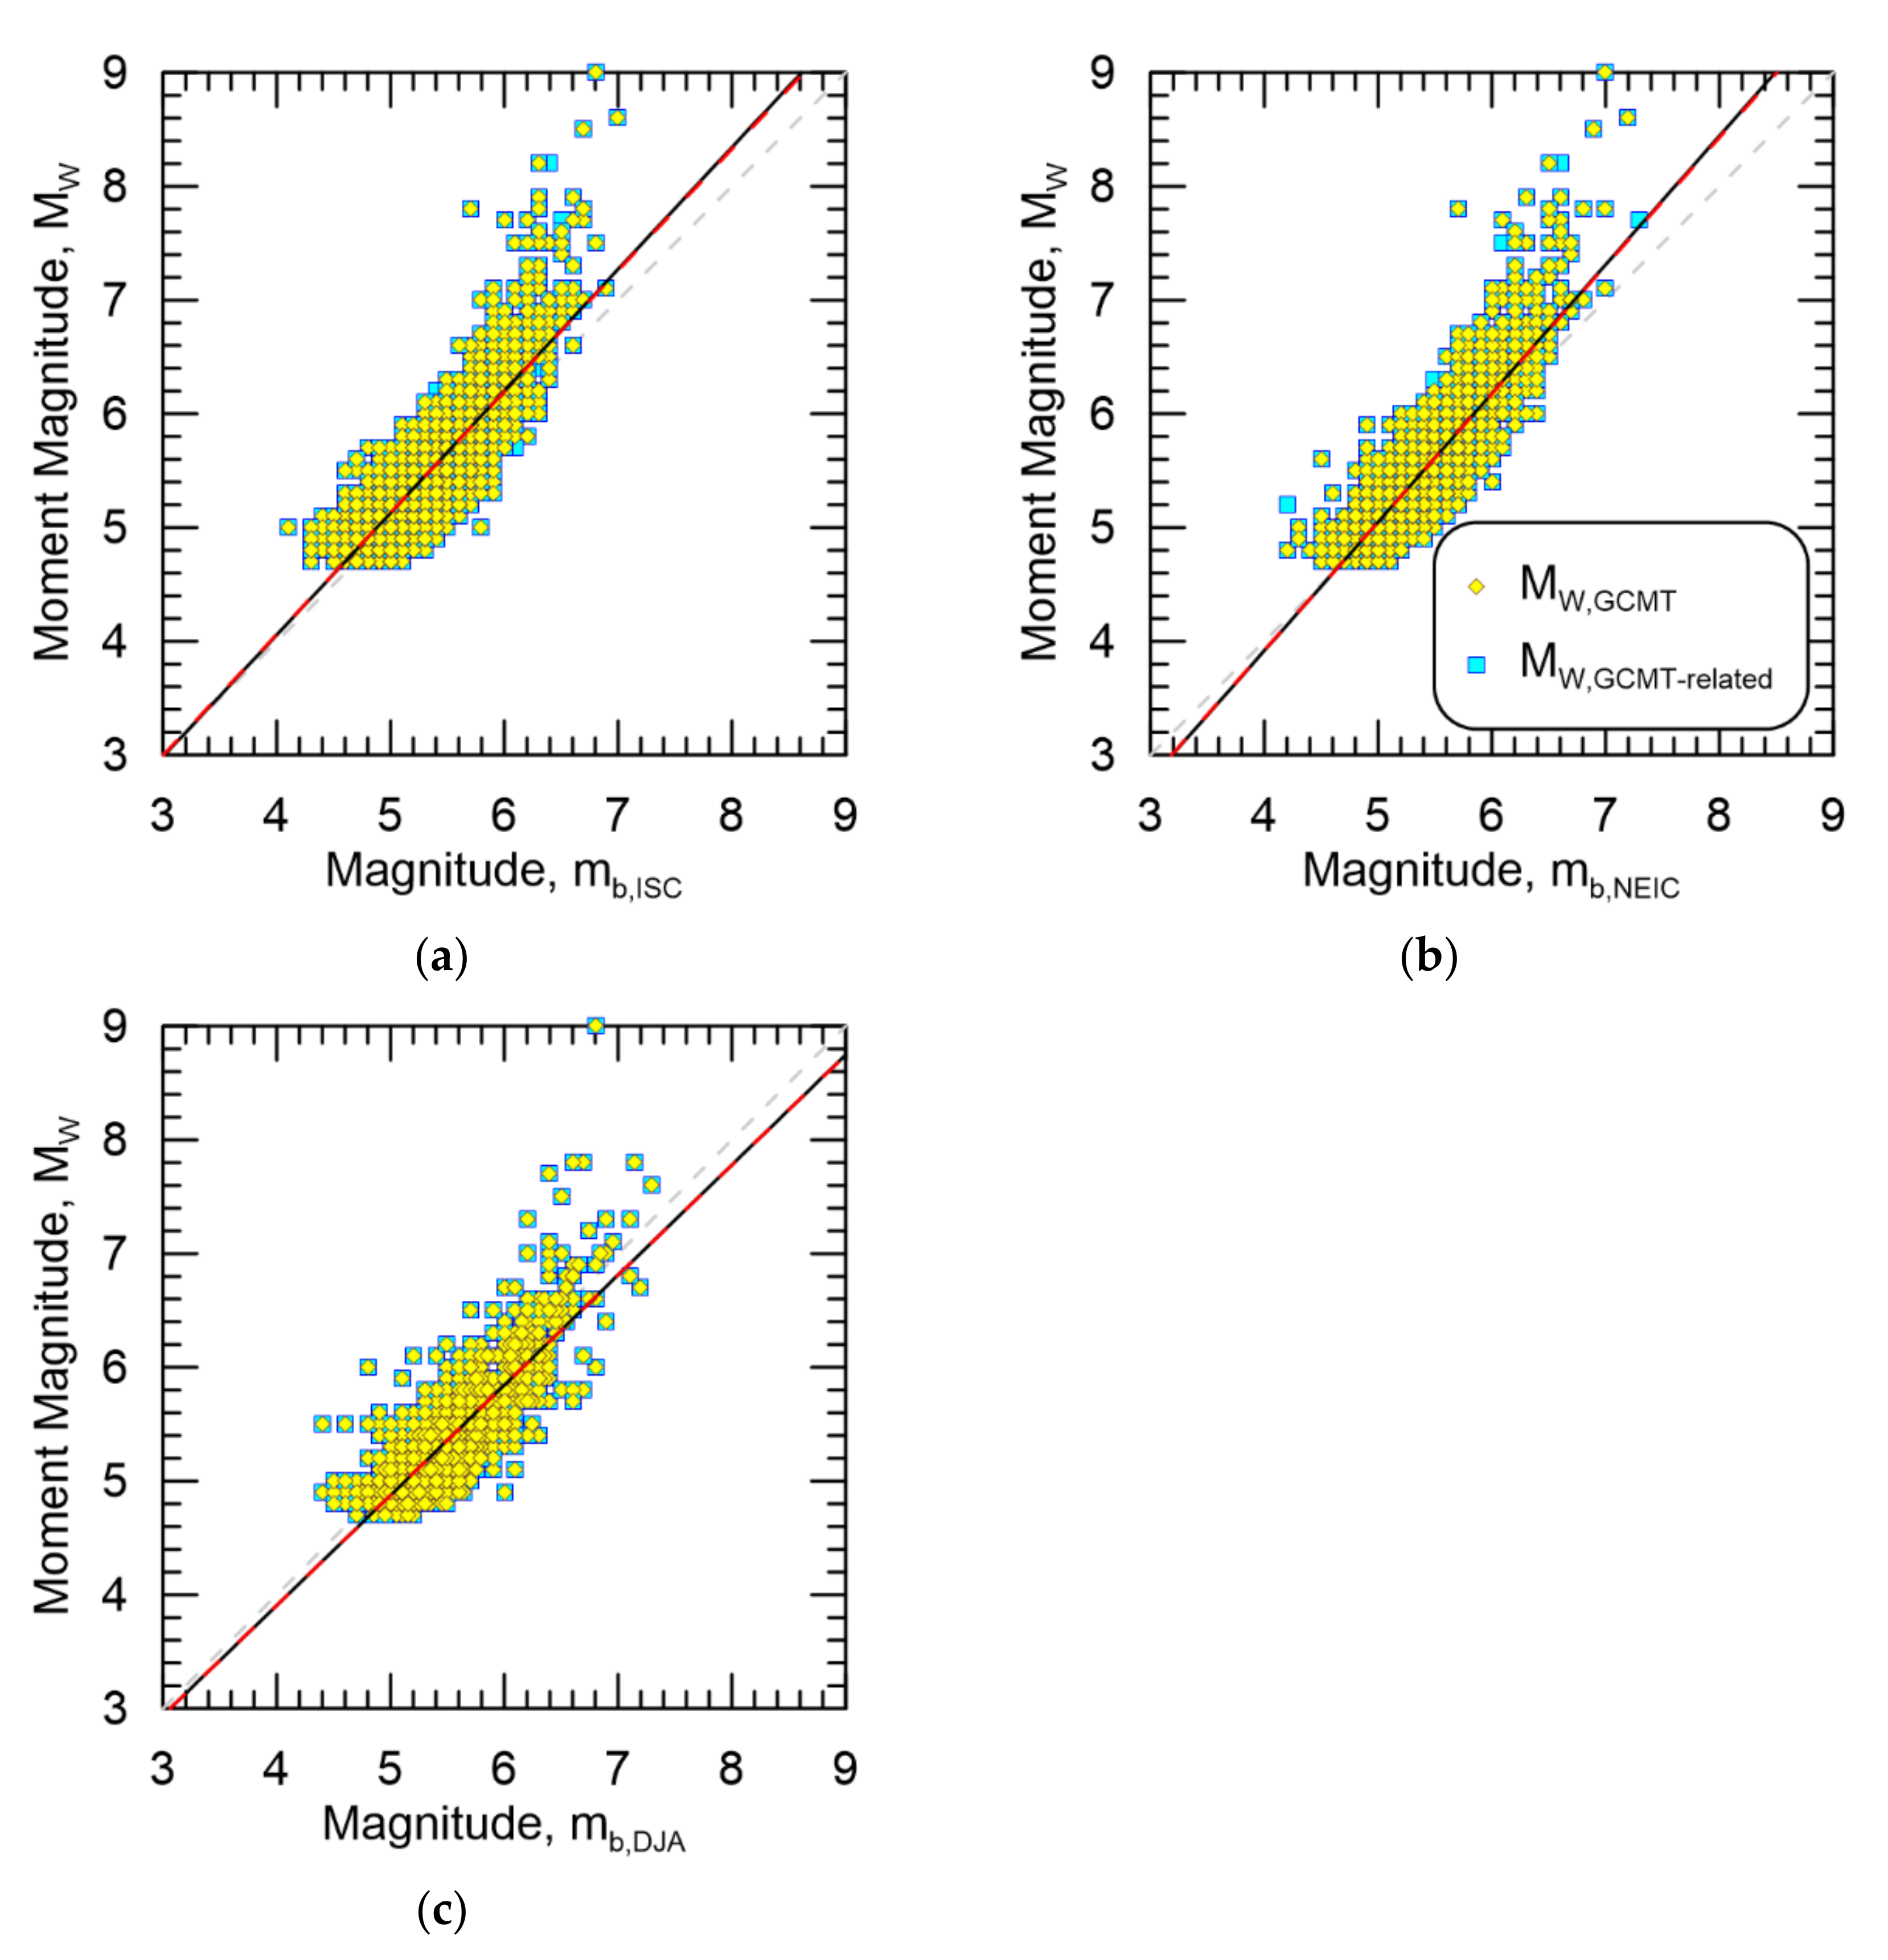
The resultant magnitude homogenization regressions for MW,GCMT-related against mb,ISC, mb,NEIC, and mb,DJA are shown in Figure 6a–c, respectively. Additionally shown in the figures are the data from MW,GCMT for comparison. There is considerable scatter, as evident with the relatively high σs. Even though there appear to be differences in regression results for each magnitude type, the differences appear negligible when plotted.
Conversely, regressions against MW,GCMT-hypothesis for against mb,ISC, mb,NEIC, and mb,DJA are shown in Figure 7a–c, respectively, as well as the data from MW,GCMT for comparison. Again, similar to the results from MW,GCMT-related, the regression models appear virtually identical with considerable scatter in the data across magnitudes. Given these results, it appears that surface wave magnitudes would be better for magnitude homogenization purposes due to the relatively lower σs.
The resultant magnitude homogenization regressions for local magnitude types are shown in Table 6. The results show little variation across the moment magnitude pools. For ML,DJA and MD,DJA, the addition of related and significantly similar catalogs and bibliographic sources did not expand the expand the MW,GCMT pool, essentially saying that DJA did not have additional moment magnitude records outside of GCMT. Although MLv,DJA presented the same moment magnitude events with MW,GCMT and MW,GCMT-related, the pool from MW,GCMT-hypothesis contained an additional 6 events, all low magnitudes from MWR,NEIC. Even so, the regression results do not differ by much.
Since all three moment magnitude pools for ML,DJA and MD,DJA are identical, no hypothesis testing was needed. Still, hypothesis testing conducted on regression parameters from MW,GCMT and MW,GCMT-hypothesis did not reveal any significant differences. This suggests that all three moment magnitude pools resulted in similar magnitude homogenization regression parameters.
The resultant magnitude homogenization regressions for MW,GCMT-related against ML,DJA, MD,DJA, and MLv,DJA are shown in Figure 8a–c, respectively. Since the moment magnitude pools for MW,GCMT-related and MW,GCMT-hypothesis did not differ for ML,DJA and MD,DJA only the results from MW,GCMT-related are plotted for brevity. Additionally, since the moment magnitude pools for MW,GCMT and MW,GCMT-hypothesis are different for MLv,DJA, only the results for MW,GCMT-hypothesis are presented. Data from MW,GCMT are presented in all plots for comparison. As suggested previously, the regressions do not make much of a difference when plotted.

3.2. South Korea

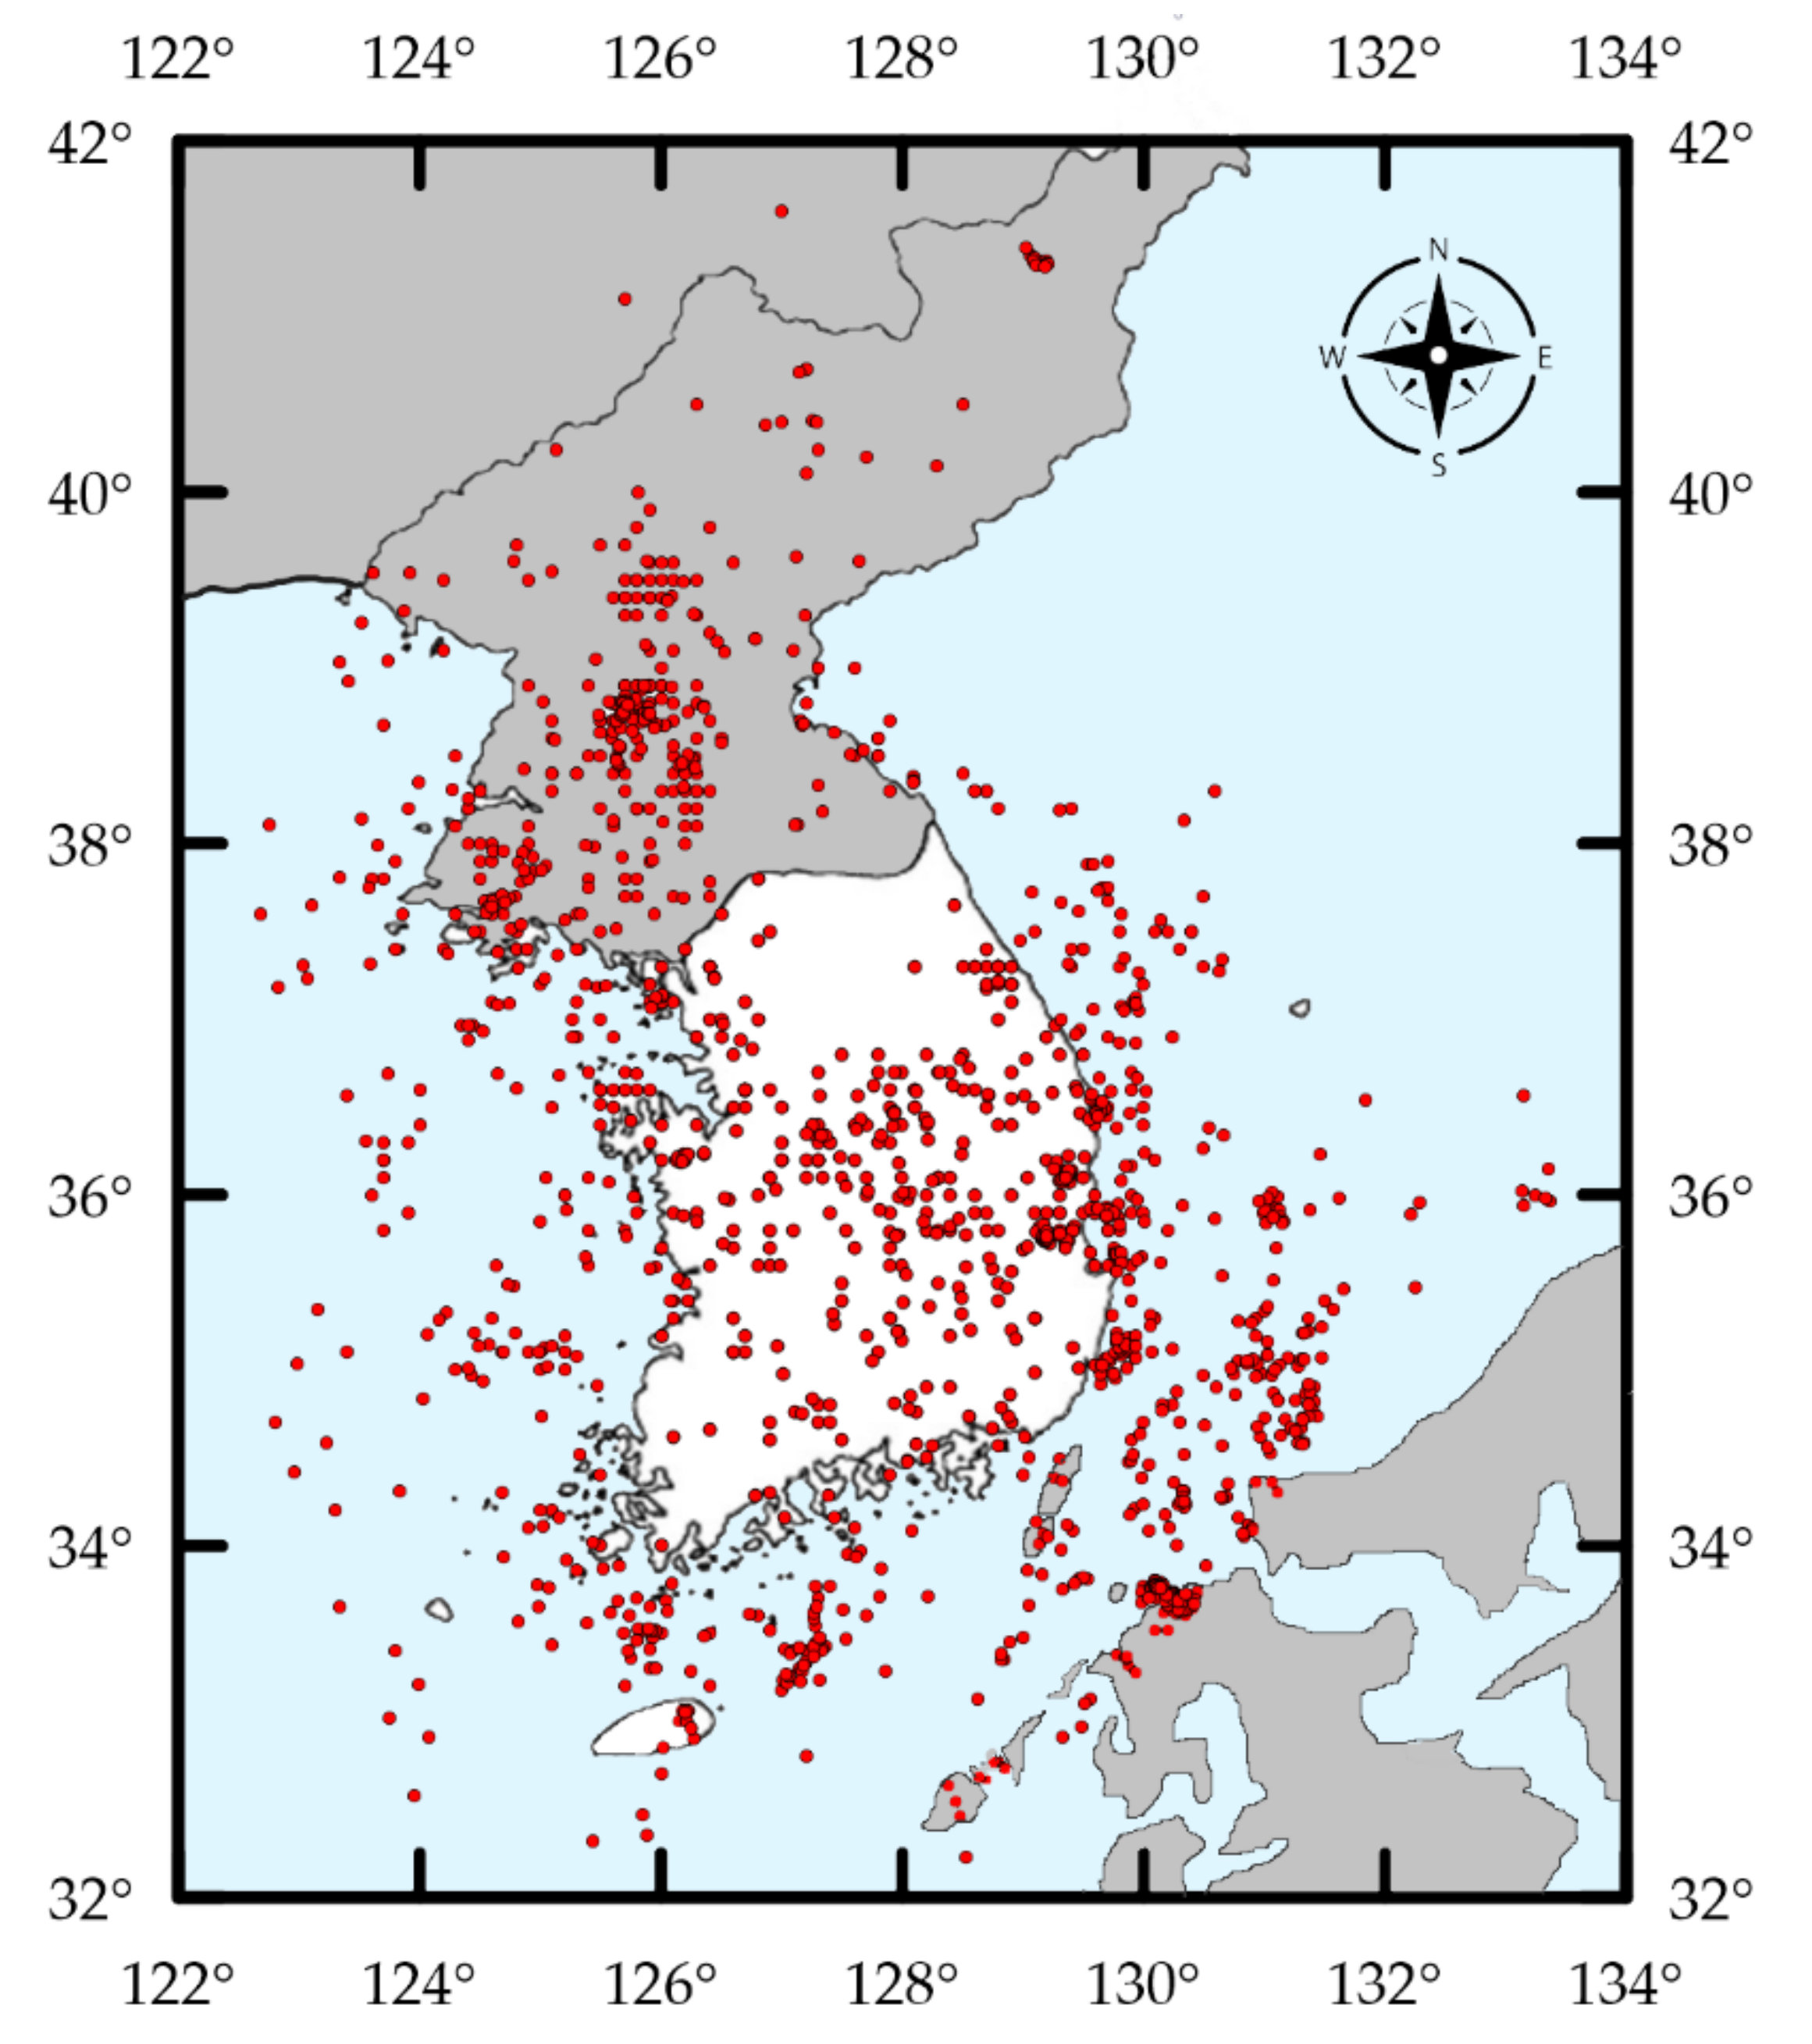
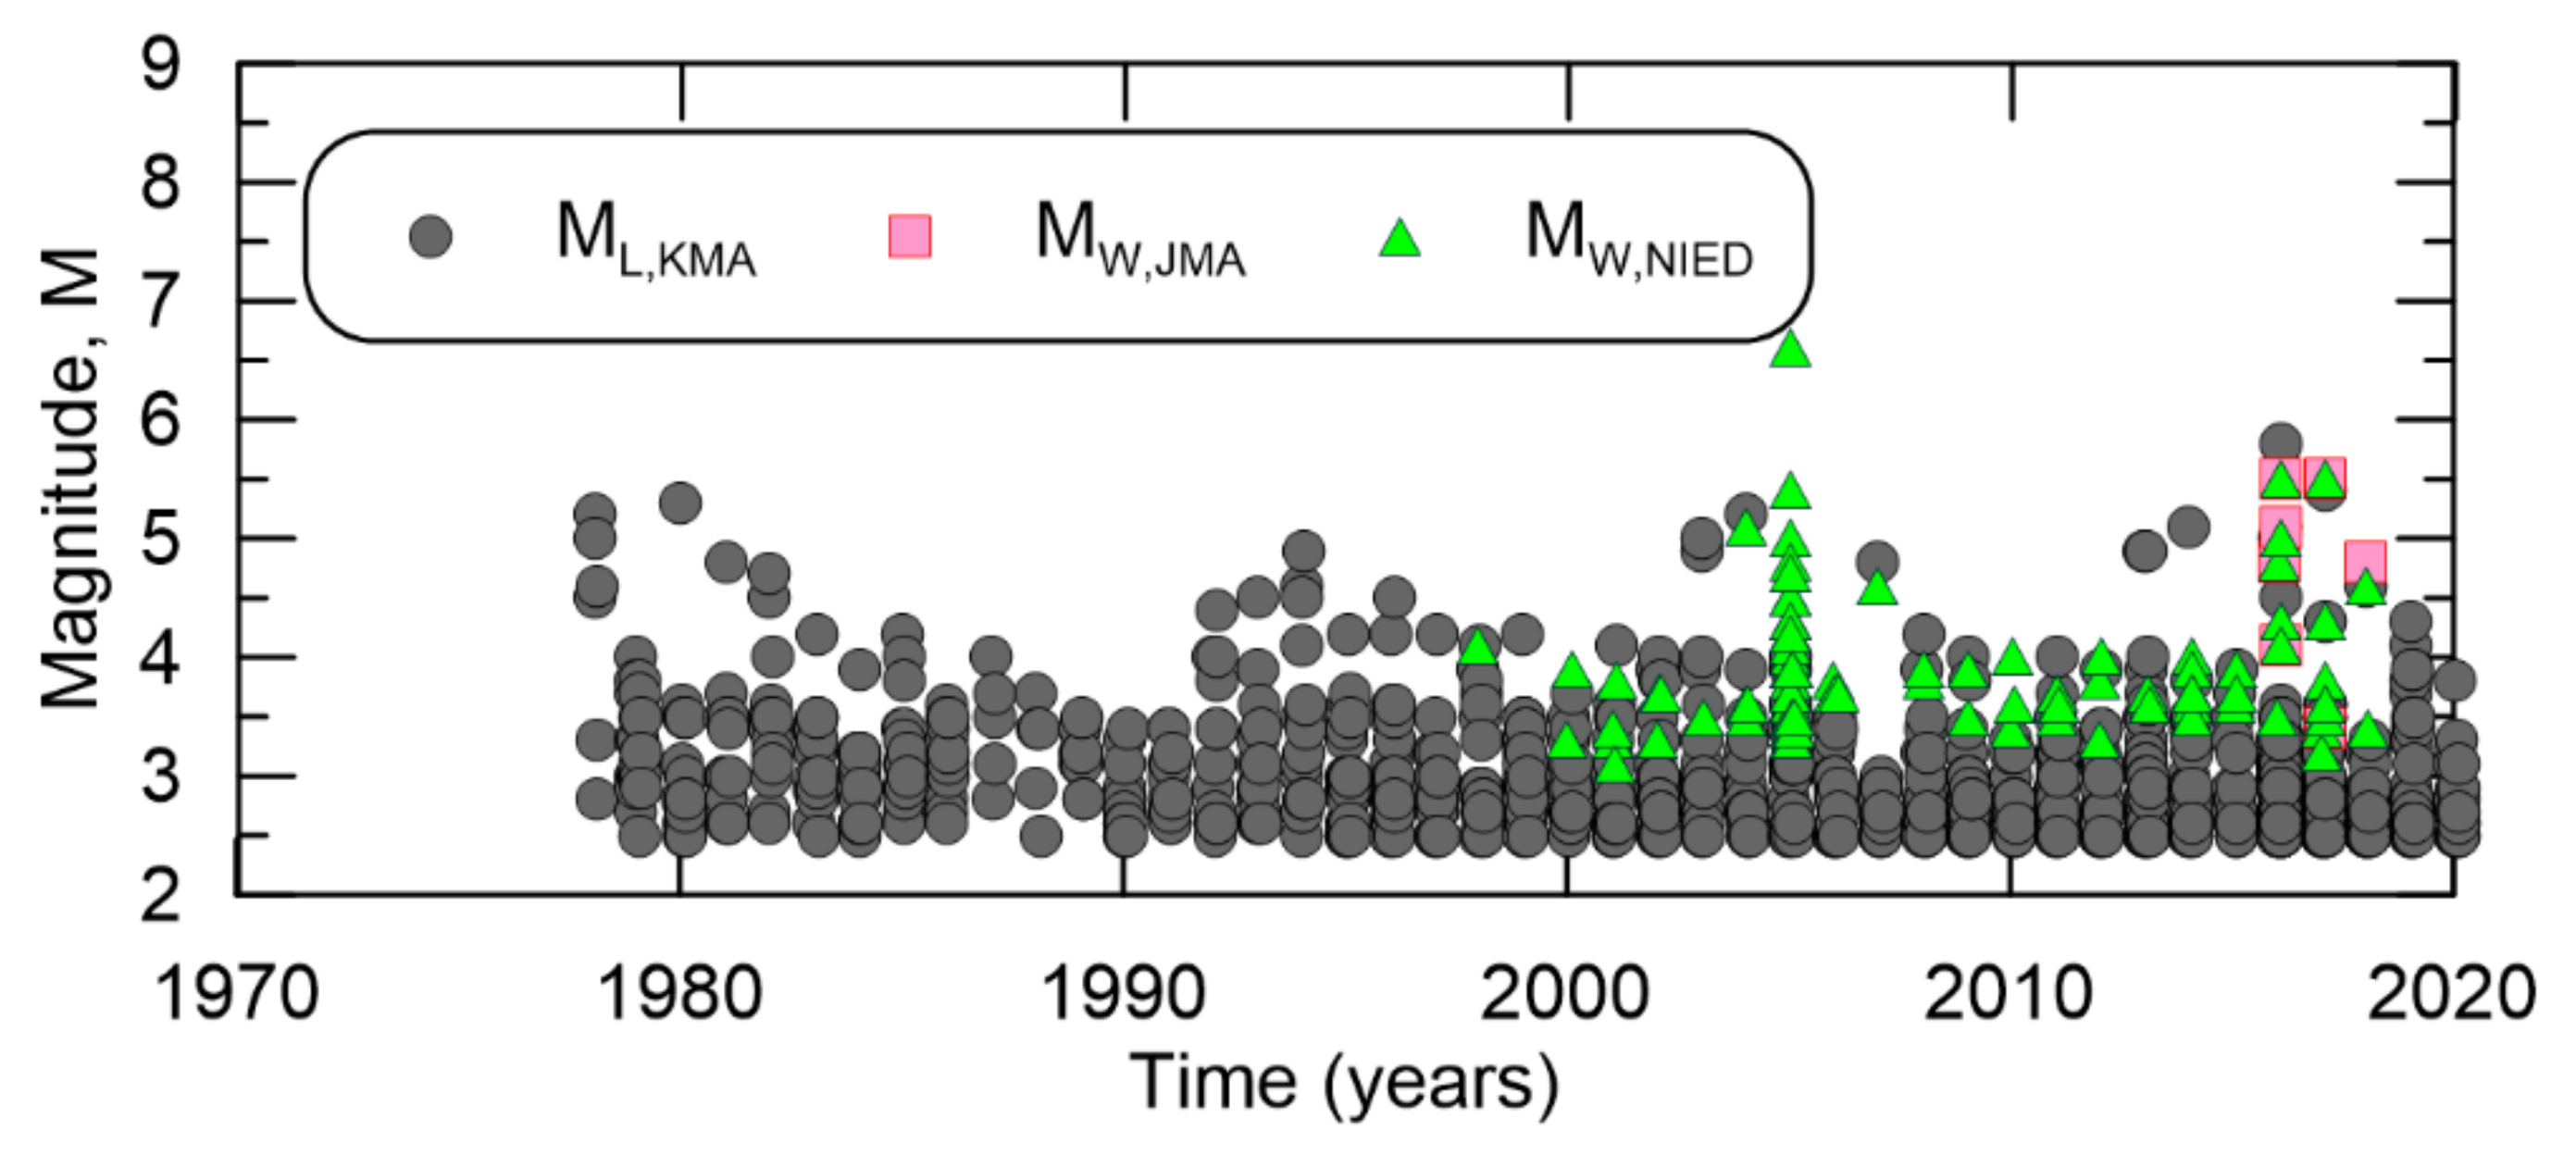
A map showing the epicenters of the search results is shown in Figure 9, suggesting low seismicity in the region. There are a total of 1544 events in the South Korean catalog with major contributions from ISC, KMA, JMA, and NIED. South Korean-related earthquakes with NEIC moment magnitudes are plotted in Figure 10, demonstrating the general sparsity of events available to compile a catalog, especially in comparison to the Indonesian catalog compiled herein. On the other side, Figure 11 shows KMA recorded many low magnitude events in the Korean peninsula since its inception in 1978.
A tally of the different magnitude types is shown in Table 7. To present a more concise tally, all types of moment magnitude are listed under MW and all surface wave type magnitudes for NEIC are listed under MS. Relative to Indonesia, there are significantly fewer earthquakes to consider for catalog development. Understandably, there are no EVBIB events recorded for South Korea. Moreover, relative to international agencies, there are notable record contributions from local and regional Japanese agencies, JMA and NIED.
The table shows the initial number of earthquakes recorded under MW,GCMT is 15. The number of earthquakes in the MW,GCMT-related pool is 17, with additions of 2 and 0 events from ISC-GEM and HRVD, respectively. Although HRVD should not be considered in this study due to the low number of events, it is shown here only for completeness as it is relevant to GCMT-related studies. Note EVBIB did not appear in search results. The initial base of the MW,GCMT-hypothesis pool contained 17 earthquakes from GCMT and ISC-GEM (GCMT and bibliographic sources). After hypothesis testing, the number increased to 20, with contributions from NEIC and JMA, the only sources that did not reject the null hypotheses with more details shown in Table 8. The contributions from HRVD are superseded by records in GCMT. In terms of NEIC moment magnitudes, the table shows that only the MWW and MWR magnitude types had significantly similar slopes and intercepts to a one-to-one line. Note that there are no MWC records in the search results. The test results show two and one events being added from JMA MW and NEIC MWR, respectively.
The resultant magnitude homogenization regressions for all surface wave magnitude types considered herein, i.e., MS,ISC, MS,NEIC, MS20,NEIC, MSZ,NEIC, are shown in Table 9. The results show little variation when considering different moment magnitude pools for MS,ISC and MS,NEIC, where the moment magnitude pools for MS,NEIC did not differ from a GCMT base. Although regressions with MS,NEIC resulted in very low σ, they also used very little data for regression. Unfortunately, there are not enough data pairs for MS20,NEIC and MSZ,NEIC to perform meaningful magnitude homogenization regression.
Hypothesis testing on the regression parameters from each moment magnitude pool using MS,ISC data resulted in no significant differences, suggesting the resultant regression parameters are similar. Hypothesis testing was not conducted on regression parameters for MS,NEIC, MS20,NEIC, and MSZ,NEIC as their moment magnitude pools were identical.
Figure 12a,b show MW,GCMT-related against MS,ISC and MS,NEIC, respectively, while Figure 12c shows MW,GCMT-hypothesis against MS,ISC. Additionally shown in the figures are the data from MW,GCMT for comparison. Regressions for MS20,NEIC and MSZ,NEIC are not shown as there is not enough data to conduct regressions. As suggested from the aforementioned regressions results, there are very few differences between the datasets.
The resultant magnitude homogenization regressions for all body wave magnitude types considered herein, i.e., mb,ISC, mb,NEIC are shown in Table 10. Both mb,ISC and mb,NEIC had identical moment magnitude pools between MW,GCMT and MW,GCMT-related. Regression σs are noticeably high for each regression given the number of data points available. Since MW,GCMT and MW,GCMT-related contained identical records against mb,ISC and mb,NEIC, there was no need to conduct hypothesis testing on their regression parameters. Hypothesis testing conducted on regression parameters derived from MW,GCMT-hypothesis found no significant differences for mb,ISC and mb,NEIC results.
The resultant magnitude homogenization regressions for MW,GCMT-hypothesis against mb,ISC and mb,NEIC are shown in Figure 13a,b, respectively. Additionally shown in the figures are the data from MW,GCMT for comparison. Since regression results using MW,GCMT and MW,GCMT-hypothesis pools are identical, they are not plotted in the figure. Even though there appear to be some differences in regression results for each magnitude type, the differences appear negligible when plotted.
The resultant magnitude homogenization regressions for ML,KMA are shown in Table 11. Moment magnitude pools MW,GCMT and MW,GCMT-related are identical and therefore produced the same regression results. Although, the MW,GCMT-hypothesis pool contains an additional two events, the regression results appear quite different even at a similar σ. Similar to the body wave results, hypothesis testing found no significant differences in regression parameters for ML,KMA.
The resultant magnitude homogenization regressions for MW,GCMT-hypothesis against ML,KMA is shown in Figure 14. Since the moment magnitude pools for MW,GCMT and MW,GCMT-related did not differ, only the results from MW,GCMT are included for brevity. The figure shows the regressions do seem to have a difference, however, the amount of data is limited.

4. Discussion

It is interesting to see that the techniques presented in expanding the pool of available moment magnitudes for magnitude homogenization only increased the pool size by at most 2% for the body and surface wave-related magnitude types and almost no increase for local magnitude types. These increases were primarily seen in the high seismicity study region. For a region of low seismicity such as South Korea, these techniques did not significantly influence regressed parameters.
It should be noted that in a previous study on magnitude homogenization in South Korea [4], the moment magnitude pool expansion technique was slightly biased in that it included data from NIED, which in this study was not directly related to the base MW,GCMT and did not pass hypothesis testing for inclusion. However, other studies suggest that MW from NIED is similar to MW from HRVD and GCMT [3,30,31]. Although the use of literature was accepted in estimating seismic moments and thus moment magnitudes for MW,GCMT-related herein, it is not sure if the use of literature in verifying consistency in agency magnitude types is warranted. For example, MW,HRVD should be similar to MW,GCMT, but hypothesis testing conducted previously demonstrates the linear regression parameters were significantly different.
It is noted that some works use bilinear regressions for their magnitude homogenization, such as the work by Scordilis [2]. Their work applied bilinear regression for MS data. However, their regression combined ISC and NEIC data and the inflection point where the regression is separated into two sections was subjectively chosen. The issue with the bilinear approach is that the standard deviations for each portion are different. Another team also implied this concern in their work [3]. Moreover, accounting for these differences ventures into the realm of nonlinear, or semi-nonlinear regression, which might violate some of the assumptions in hypothesis testing. This is a problem depending on how the resultant earthquake catalog is used and, to our knowledge, no one has provided a robust treatment of bilinear regressions for magnitude homogenization yet. We do not doubt there are better models out there, but these appear out of our scope.
In addition to limitations on linear regression models, there may be limitations due to ergodicity. Indonesia and South Korea do not represent all regions of varying seismicity. Even though the results suggest independence from seismicity, it may not ring true for other regions, especially those that have lower seismicity than South Korea. Moreover, the data for this study was taken from ISC, which did not record many low magnitude events. The verification of low magnitude events could significantly change the results.

5. Conclusions

Both approaches to expand moment magnitude pools for magnitude homogenization only increased the count by 1% with the most at 2%, with several of the expanded pools being identical to the base GCMT catalog. Magnitude homogenization regressions derived from these moment magnitude pools resulted in similar regression parameters. Additional statistical hypothesis testing concluded that for many magnitude types, the regression parameters were essentially the same across the different moment magnitude pools. Since these techniques were applied to both regions of high and low seismicity, it brings into question the effectiveness of the moment magnitude pool expansion techniques described herein.

Author Contributions

Conceptualization, A.R.Y. and E.Y.; methodology, E.Y.; software, A.R.Y. and E.Y.; formal analysis, E.Y.; investigation, E.Y.; resources, A.R.Y.; data curation, A.R.Y. and E.Y.; writing—original draft preparation, E.Y.; writing—review and editing, E.Y.; visualization, A.R.Y. and E.Y.; supervision, E.Y.; project administration, E.Y.; funding acquisition, E.Y. All authors have read and agreed to the published version of the manuscript.

Funding

This work was funded by the 2022 Research Fund of the KEPCO International Nuclear Graduate School (KINGS), Republic of Korea.

Institutional Review Board Statement

Not applicable.

Informed Consent Statement

Not applicable.

Data Availability Statement

Publicly available datasets were analyzed in this study. Any generated data can be found within this article.

Acknowledgments

This work was supported by the 2022 Research Fund of the KEPCO International Nuclear Graduate School (KINGS), Republic of Korea.

Conflicts of Interest

The authors declare no conflict of interest.

References

  1. Das, R.; Wason, H.R.; Sharma, M.L. Global regression relations for conversion of surface wave and body wave magnitudes to moment magnitude. Nat. Haz. 2011, 59, 801–810. [Google Scholar] [CrossRef]
  2. Scordilis, E.M. Empirical global relations converting ms and mb to moment magnitude. J. Seism. 2006, 10, 225–236. [Google Scholar] [CrossRef]
  3. Weatherill, G.A.; Pagani, M.; Garcia, J. Exploring earthquake databases for the creation of magnitude-homogeneous catalogues: Tools for application on a regional and global scale. Geophys. J. Int. 2016, 206, 1652–1676. [Google Scholar] [CrossRef] [Green Version]
  4. Yee, E.; Park, W. Moment Magnitude Homogenization Relations in the South Korean Region from 1900 to 2020. Appl. Sci. 2022, 12, 7215. [Google Scholar] [CrossRef]
  5. Hanks, T.C.; Kanamori, H. A Moment magnitude scale. J. Geophys. Res. 1979, 84, 2348–2350. [Google Scholar] [CrossRef]
  6. Xu, J.G.; Feng, D.C.; Mangalathu, S.; Jeon, J.S. Data-driven rapid damage evaluation for life-cycle seismic assessment of regional reinforced concrete bridges. Earthq. Eng. Struct. Dyn. 2022, 51, 2730–2751. [Google Scholar] [CrossRef]
  7. Gasperini, P.; Lolli, B.; Vannucci, G.; Boschi, E. A comparison of moment magnitude estimates for the European—Mediterranean and Italian regions. Geophys. J. Int. 2012, 190, 1733–1745. [Google Scholar] [CrossRef] [Green Version]
  8. Das, R.; Sharma, M.L.; Wason, H.R.; Choudhury, D. A seismic moment magnitude scale. Bull. Seismol. Soc. Am. 2019, 109, 1542–1555. [Google Scholar] [CrossRef]
  9. Ekström, G.; Nettles, M.; Dziewonski, A.M. The global cmt project 2004–2010: Centroid-moment tensors for 13,017 earthquakes. Phys. Earth Planet. Int. 2012, 200–201, 1–9. [Google Scholar] [CrossRef]
  10. Frohlich, C.; Davis, S.D. How well constrained are well-constrained t, b, and p axes in moment tensor catalogs? J. Geophys. Res. 1999, 104, 4901–4910. [Google Scholar] [CrossRef]
  11. Kagan, Y.Y. Accuracy of modern global earthquake catalogs. Phys. Earth Planet. Inter. 2003, 135, 209. [Google Scholar] [CrossRef]
  12. Di Giacomo, D.; Bondár, I.; Storchak, D.A.; Engdahl, E.R.; Bormann, P.; Harris, J. ISC-GEM: Global instrumental earthquake catalogue (1900–2009), iii. re-computed ms and mb, proxy mw, final magnitude composition and completeness assessment. Phys. Earth Planet. Int. 2015, 239, 33–47. [Google Scholar] [CrossRef]
  13. Di Giacomo, D.; Storchak, D.A. A scheme to set preferred magnitudes in the ISC Bulletin. J. Seism. 2016, 20, 555–567. [Google Scholar] [CrossRef]
  14. Willemann, R.J.; Storchak, D.A. Data Collection at the International Seismological Centre. Seis. Res. Lett. 2001, 72, 440–453. [Google Scholar] [CrossRef] [Green Version]
  15. Storchak, D.A.; Harris, J.; Brown, L.; Lieser, K.; Shumba, B.; Verney, R.; Di Giacomo, D.; Korger, E.I.M. Rebuild of the bulletin of the international seismological centre (isc), part 1: 1964–1979. Geosci. Lett. 2017, 4, 32. [Google Scholar] [CrossRef]
  16. Storchak, D.A.; Harris, J.; Brown, L.; Lieser, K.; Shumba, B.; Di Giacomo, D. Rebuild of the bulletin of the international seismological centre (isc)—Part 2: 1980–2010. Geosci. Lett. 2020, 7, 18. [Google Scholar] [CrossRef]
  17. Di Giacomo, D.; Engdahl, E.R.; Storchak, D.A. The ISC-GEM Earthquake Catalogue (1904–2014): Status after the Extension Project. Earth Syst. Sci. Data 2018, 10, 1877–1899. [Google Scholar] [CrossRef] [Green Version]
  18. Storchak, D.A.; Di Giacomo, D.; Bondár, I.; Engdahl, E.R.; Harris, J.; Lee, W.H.K.; Villaseñor, A.; Bormann, P. Public release of the isc-gem global instrumental earthquake catalogue (1900–2009). Seismol. Res. Lett. 2013, 84, 810–815. [Google Scholar] [CrossRef] [Green Version]
  19. Storchak, D.A.; Di Giacomo, D.; Engdahl, E.R.; Harris, J.; Bondár, I.; Lee, W.H.K.; Bormann, P.; Villaseñor, A. The isc-gem global instrumental earthquake catalogue (1900–2009): Introduction. Phys. Earth Planet. Int. 2015, 239, 48–63. [Google Scholar] [CrossRef]
  20. USGS Earthquake Hazards Program US (Catalog). Available online: https://earthquake.usgs.gov/data/comcat/catalog/us/ (accessed on 29 October 2022).
  21. Sipkin, S.A. Rapid determination of global moment-tensor solutions. Geophys. Res. Lett. 1994, 21, 1667–1670. [Google Scholar] [CrossRef]
  22. USGS Earthquake Hazards Magnitude Types. Available online: https://www.usgs.gov/programs/earthquake-hazards/magnitude-types (accessed on 29 October 2022).
  23. Kim, S.K.; Park, M.A. The Local Magnitude Scale in the Korean Peninsula. Pure Appl. Geophys. 2005, 162, 875–889. [Google Scholar] [CrossRef]
  24. Sheen, D.H.; Kang, T.S.; Rhie, J.K. A Local Magnitude Scale for South Korea. Bull. Seismol. Soc. Am. 2018, 108, 2748–2755. [Google Scholar] [CrossRef]
  25. Pujols, J. Regression between earthquake magnitudes having errors with known variances. J. Seismol. 2016, 20, 1041–1056. [Google Scholar] [CrossRef]
  26. Helffrich, G.R. How good are routinely determined focal mechanisms? Empirical statistics based on a comparison of Harvard, USGS and ERI moment tensors. Geophys. J. Int. 1997, 131, 741–750. [Google Scholar] [CrossRef]
  27. Gasperini, P.; Lolli, B.; Vannucci, G. Body-Wave Magnitude mb is a Good Proxy of Moment Magnitude MW for Small Earthquakes (mb < 4.5−5.0). Seismol. Res. Lett. 2013, 84, 932–937. [Google Scholar]
  28. International Seismological Centre (ISC). Summary of the Bulletin of the International Seismological Centre, January–June 2018. ISC 2020, 55, 188. [Google Scholar]
  29. Pacheco, J.; Sykes, L.R. Seismic moment catalogue of large shallow earthquakes 1900–1989. Bull. Seism. Soc. Am. 1992, 82, 1306–1349. [Google Scholar] [CrossRef]
  30. Di Giacomo, D.; Harris, J.; Storchak, D.A. Complementing regional moment magnitudes to GCMT: A perspective from the rebuilt International Seismological Centre Bulletin. Earth Syst. Sci. Data 2021, 13, 1957–1985. [Google Scholar] [CrossRef]
  31. Kubo, A.; Fukuyama, E.; Kawai, H.; Nonomura, K. NIED seismic moment tensor catalogue for regional earthquakes around Japan: Quality test and application. Tectonophysics 2002, 356, 23–48. [Google Scholar] [CrossRef]
Figure 1. Epicenters of earthquakes in the compiled catalog for Indonesia.
Applsci 12 12921 g001
Figure 2. Moment magnitude types from NEIC and timeframes when they are valid in the Indonesian catalog.
Applsci 12 12921 g002
Figure 3. Moment magnitude types from DJA and bibliographic sources, and timeframes when they are valid in the Indonesian catalog.
Applsci 12 12921 g003
Figure 4. Resultant magnitude homogenization regressions for MW,GCMT-related against (a) MS,ISC, (b) MS,NEIC, (c) MS20,NEIC, (d) MSZ,NEIC. Data from MW,GCMT are also shown. Black line is the regression against MW,GCMT-related while the dashed red line is the regression against MW,GCMT.
Applsci 12 12921 g004
Figure 5. Resultant magnitude homogenization regressions for MW,GCMT-hypothesis against (a) MS,ISC, (b) MS,NEIC, and (c) MSZ,NEIC. Data from MW,GCMT are also shown. Black line is the regression against MW,GCMT-hypothesis while the dashed red line is the regression against MW,GCMT.
Applsci 12 12921 g005
Figure 6. Resultant magnitude homogenization regressions for MW,GCMT-related against (a) mb,ISC, (b) mb,NEIC, and (c) mb,DJA. Data from MW,GCMT are also shown. Black line is the regression against MW,GCMT-related while the dashed red line is the regression against MW,GCMT.
Applsci 12 12921 g006
Figure 7. Resultant magnitude homogenization regressions for MW,GCMT-hypothesis against (a) mb,ISC, (b) mb,NEIC, and (c) mb,DJA. Data from MW,GCMT are also shown. Black line is the regression against MW,GCMT-hypothesis while the dashed red line is the regression against MW,GCMT.
Applsci 12 12921 g007
Figure 8. Resultant magnitude homogenization regressions for MW,GCMT-related against (a) ML,DJA, (b) MD,DJA, and MW,GCMT-hypothesis against (c) MLv,DJA. Data from MW,GCMT are also shown. Black line is the regression against MW,GCMT-related or MW,GCMT-hypothesis while the dashed red line is the regression against MW,GCMT.
Applsci 12 12921 g008
Figure 9. Epicenters of earthquakes in the compiled catalog for South Korea.
Applsci 12 12921 g009
Figure 10. Moment magnitude types from NEIC and timeframes when they are valid in the South Korean catalog.
Applsci 12 12921 g010
Figure 11. Local magnitude from KMA and moment magnitude types from Japanese sources, and timeframes when they are valid in the South Korean catalog.
Applsci 12 12921 g011
Figure 12. Resultant magnitude homogenization regressions for MW,GCMT-related against (a) MS,ISC, (b) MS,NEIC, and MW,GCMT-hypothesis against (c) MS,ISC. Data from MW,GCMT are also shown. Black line is the regression against MW,GCMT-related or MW,GCMT-hypothesis while the dashed red line is the regression against MW,GCMT.
Applsci 12 12921 g012
Figure 13. Resultant magnitude homogenization regressions for MW,GCMT-hypothesis against (a) mb,ISC and (b) mb,NEIC. Data from MW,GCMT are also shown. Black line is the regression against MW,GCMT-hypothesis while the dashed red line is the regression against MW,GCMT.
Applsci 12 12921 g013
Figure 14. Resultant magnitude homogenization regressions for MW,GCMT-hypothesis against ML,KMA. Data from MW,GCMT are also shown. Black line is the regression against MW,GCMT-hypothesis while the dashed red line is the regression against MW,GCMT.
Applsci 12 12921 g014
Table 1. Seismological agencies and projects that provided relevant earthquake data for this study.
CodeAgencyCountryStatus
CGSCoast and Geodetic Survey of the United StatesU.S.A.Inactive
DJABadan Meteorologi, Klimatologi dan GeofisikaIndonesiaActive
EVBIBData from publications listed in the ISC Event BibliographyUnknownInactive
GCMTThe Global CMT ProjectU.S.A.Active
GSU.S. Geological SurveyU.S.A.Active
HRVDHarvard UniversityU.S.A.Inactive
IPGPInstitut de Physique du Globe de ParisFranceActive
ISCInternational Seismological CentreU.K.Active
ISC-GEMGlobal Instrumental Earthquake CatalogueU.K.Active
ISC-PPSMInternational Seismological Centre Probabilistic Point Source ModelU.K.Active
ISSInternational Seismological SummaryU.K.Inactive
JMAJapan Meteorological AgencyJapanActive
KMAKorea Meteorological AdministrationSouth KoreaActive
MOSGeophysical Survey of Russian Academy of SciencesRussiaActive
NEICNational Earthquake Information CenterU.S.A.Active
NEISNational Earthquake Information ServiceU.S.A.Active
NIEDNational Research Institute for Earth Science and Disaster ResilienceJapanActive
P&SPacheco and Sykes catalog [29]UnknownInactive
USCGSUnited States Coast and Geodetic SurveyU.S.A.Active
Table 2. Number of earthquakes by seismological agency and magnitude type for Indonesia.
Number of Events per Magnitude Type
AgencyMW 1MSmbMLMDM
DJA12392711,48630,980 33531249
EVBIB4200000
GCMT391500000
HRVD94400000
IPGP9500000
ISC012,49845,569001
ISC-GEM277900000
ISC-PPSM3100000
NEIC13413538 235,7401200
MOS163127867700167
P&S48330000
1 Includes all recorded moment magnitude types. 2 Includes MSZ and MS20 magnitude types. 3 Includes MLv magnitude type.
Table 3. Hypothesis testing results against a MW pool from GCMT, ISC-GEM, and EVBIB for the Indonesian catalog. Significance level α = 0.05.
AgencyNumber of Data PairsSlope,
β1
Intercept,
β0
Standard Deviation, σt-Statistic
β10
p-Value
β10
Significantly Different?
DJA MW3260.9550.2320.1872.54/2.310.00/0.02Yes
DJA MWP6931.031−0.1890.1911.84/2.060.07/0.04Yes
HRVD9380.9900.0410.0324.84/3.750.00/0.00Yes
IPGP950.9430.3120.0893.03/2.710.00/0.01Yes
ISC-PPSM301.235−1.7600.1462.83/3.350.01/0.00Yes
NEIC MW8110.9910.0710.1231.07/1.420.29/0.16No
NEIC MWW3290.9610.2560.0893.97/4.710.00/0.00Yes
NEIC MWC190.9140.5470.0413.38/3.350.00/0.00Yes
NEIC MWB1600.9920.1380.0990.48/1.400.63/0.16No
NEIC MWR50.8650.7710.0442.15/2.460.12/0.09No
NEIC MW,all11710.9760.1650.1143.99/4.700.00/0.00Yes
MOS160.9290.7630.2660.71/1.060.05/0.31No
P&S140.7991.5760.2621.16/1.210.27/0.25No
Table 4. Magnitude homogenization regression results from all moment magnitude pools for surface wave magnitude types.
Magnitude TypePoolSlope, β1Intercept, β0Correlation, R2Standard
Deviation, σ
Number of Data Pairs
MS,ISCMW,GCMT0.6442.2820.8730.1813820
MW,GCMT-related0.6512.2490.8780.1843873
MW,GCMT-hypothesis0.6612.2020.8870.1853904
MS,NEICMW,GCMT0.7371.7530.8860.1901268
MW,GCMT-related0.7351.7630.8870.1901291
MW,GCMT-hypothesis0.7361.7580.8890.1901295
MS20,NEICMW,GCMT 10.7371.7370.8770.163200
MW,GCMT-related 10.7371.7370.8770.163200
MW,GCMT-hypothesis 10.7371.7370.8770.163200
MSZ,NEICMW,GCMT0.6952.0190.8960.166707
MW,GCMT-related0.6942.0230.8950.166714
MW,GCMT-hypothesis0.6942.0240.8950.166714
1 Pool of MW data did not change for the corresponding magnitude type.
Table 5. Magnitude homogenization regression results from all moment magnitude pools for body wave magnitude types.
Magnitude TypePoolSlope, β1Intercept, β0Correlation, R2Standard
Deviation, σ
Number of Data Pairs
mb,ISCMW,GCMT1.066−0.2030.7350.2593915
MW,GCMT-related1.072−0.2310.7360.2623963
MW,GCMT-hypothesis1.078−0.2630.7380.2633970
mb,NEICMW,GCMT1.127−0.5890.7530.2513909
MW,GCMT-related1.132−0.6100.7540.2533954
MW,GCMT-hypothesis1.141−0.6570.7460.2543963
mb,DJAMW,GCMT0.9680.0360.6820.2681711
MW,GCMT-related0.9680.0350.6810.2681712
MW,GCMT-hypothesis0.9700.0240.6830.2681717
Pool of MW data did not change for the corresponding magnitude type.
Table 6. Magnitude homogenization regression results from all moment magnitude pools for local magnitude types from DJA.
Magnitude TypePoolSlope, β1Intercept, β0Correlation, R2Standard
Deviation, σ
Number of Data Pairs
ML,DJAMW,GCMT 10.5152.5780.3130.389102
MW,GCMT-related 10.5152.5780.3130.389102
MW,GCMT-hypothesis 10.5152.5780.3130.389102
MD,DJAMW,GCMT 11.140−0.4350.4980.335125
MW,GCMT-related 11.140−0.4350.4950.335125
MW,GCMT-hypothesis 11.140−0.4350.4980.335125
MLv,DJAMW,GCMT 10.7681.0760.7440.2221287
MW,GCMT-related 10.7681.0760.7440.2221287
MW,GCMT-hypothesis0.7711.0620.7460.2221293
1 Pool of MW data did not change for the corresponding magnitude type.
Table 7. Number of earthquakes by seismological agency and magnitude type for South Korea.
Number of Events per Magnitude Type
AgencyMW 1MSmbMLMDM
GCMT1500000
HRVD300000
ISC046100000
ISC-GEM1700000
JMA70000479
KMA000105300
NEIC812 271101
NIED13500000
1 Includes all recorded moment magnitude types. 2 Includes MSZ and MS20 magnitude types.
Table 8. Hypothesis testing results against a MW pool from GCMT and ISC-GEM for the South Korean catalog. Significance level α = 0.05.
AgencyNumber of Data PairsSlope,
β1
Intercept,
β0
Standard Deviation, σt-Statistic
β10
p-Value
β10
Significantly Different?
HRVD31.019−0.1440.0560.27/0.350.83/0.79No
JMA51.0000.0000.0710.00/0.001.00/1.00No
NEIC MW31.354−2.0650.01514.05/14.230.05/0.04Yes
NEIC MWW31.053−0.2400.0530.43/0.380.74/0.77No
NEIC MWB1N/AN/AN/AN/A/N/AN/A/N/AN/A
NEIC MWR40.8460.7920.1220.83/0.740.49/0.54No
NEIC MW,all71.039−0.1820.1480.34/0.300.75/0.78No
NIED50.9380.3710.0362.88/3.250.02/0.01Yes
N/A = not applicable.
Table 9. Magnitude homogenization regression results from all moment magnitude pools for surface wave magnitude types.
Magnitude TypePoolSlope, β1Intercept, β0Correlation, R2Standard
Deviation, σ
Number of Data Pairs
MS,ISCMW,GCMT0.6631.9880.8850.16914
MW,GCMT-related0.6242.1610.9190.16416
MW,GCMT-hypothesis0.6132.2210.9230.15718
MS,NEICMW,GCMT 10.6352.3210.9410.0764
MW,GCMT-related 10.6352.3210.9410.0764
MW,GCMT-hypothesis 10.6352.3210.9410.0764
MS20,NEICMW,GCMT 1N/AN/AN/AN/A2
MW,GCMT-related 1N/AN/AN/AN/A2
MW,GCMT-hypothesis 1N/AN/AN/AN/A2
MSZ,NEICMW,GCMT 1N/AN/AN/AN/A1
MW,GCMT-related 1N/AN/AN/AN/A1
MW,GCMT-hypothesis 1N/AN/AN/AN/A1
1 Pool of MW data did not change for the corresponding magnitude type. N/A = not applicable.
Table 10. Magnitude homogenization regression results from all moment magnitude pools for body wave magnitude types.
Magnitude TypePoolSlope, β1Intercept, β0Correlation, R2Standard
Deviation, σ
Number of Data Pairs
mb,ISCMW,GCMT 11.056−0.1390.8760.24615
MW,GCMT-related 11.056−0.1390.8760.24615
MW,GCMT-hypothesis0.9510.3990.7620.25917
mb,NEICMW,GCMT 11.163−0.7480.8020.23515
MW,GCMT-related 11.163−0.7480.8020.23515
MW,GCMT-hypothesis1.0000.1000.7780.25017
1 Pool of MW data did not change for the corresponding magnitude type.
Table 11. Magnitude homogenization regression results from all moment magnitude pools for local magnitude types from DJA.
Magnitude TypePoolSlope, β1Intercept, β0Correlation, R2Standard
Deviation, σ
Number of Data Pairs
ML,KMAMW,GCMT 10.5962.0270.8140.18112
MW,GCMT-related 10.5962.0270.8140.18112
MW,GCMT-hypothesis0.7251.3710.8820.17414
1 Pool of MW data did not change for the corresponding magnitude type.
Publisher’s Note: MDPI stays neutral with regard to jurisdictional claims in published maps and institutional affiliations.