Featured Application
Medical diagnosis and computer-aided diagnosis systems.
Abstract
Breast cancer is one of the most common types of cancer among women. Accurate diagnosis at an early stage can reduce the mortality associated with this disease. Governments and health organizations stress the importance of early detection of breast cancer as it is related to an increase in the number of available treatment options and increased survival. Early detection gives patients the best chance of receiving effective treatment. Different types of images and imaging modalities are used in the detection and diagnosis of breast cancer. One of the imaging types is “infrared thermal” breast imaging, where a screening instrument is used to measure the temperature distribution of breast tissue. Although it has not been used often, compared to mammograms, it showed promising results when used for early detection. It also has many advantages as it is non-invasive, safe, painless, and inexpensive. The literature has indicated that the use of thermal images with deep neural networks improves the accuracy of early diagnosis of breast malformation. Therefore, in this paper, we aim to investigate to what extent convolutional neural networks (CNNs) with attention mechanisms (AMs) can provide satisfactory detection results in thermal breast cancer images. We present a model for breast cancer detection based on deep neural networks with AMs using thermal images from the Database for Research Mastology with Infrared Image (DMR-IR). The model will be evaluated in terms of accuracy, sensitivity and specificity, and will be compared against state-of-the-art breast cancer detection methods. The AMs with the CNN model achieved encouraging test accuracy rates of 99.46%, 99.37%, and 99.30% on the breast thermal dataset. The test accuracy of CNNs without AMs was 92.32%, whereas CNNs with AMs achieved an improvement in accuracy of 7%. Moreover, the proposed models outperformed previous models that were reviewed in the literature.
1. Introduction
Despite diverse detection and prevention methods, human diseases have gradually increased for personal or environmental reasons. Cancer, the most common worldwide disease, is a condition in which cells grow irregularly and affect other body parts. Some of the cancers found are breast, prostate, lung, skin, and pancreas. Cancer causes many deaths globally [1].
Breast cancer is the leading cause of death in women if not diagnosed early. The development of early detection and treatment methods for breast cancer has enhanced the possibility of survival. One of the procedures widely used in medicine to detect breast cancer is screening the patient using various imaging modalities, such as mammography, ultrasound, computed tomography imaging (CT), magnetic resonance imaging (MRI), and thermal imaging screening. These modalities have distinct approaches and tools; results depend on different factors, and using more than one method is recommended to verify the results. Mammography is the most common procedure for breast cancer screening; although it is considered the gold standard, it carries many risks for patients, so in recent years thermal imaging has gained attention because of its low risks, unlike mammography [2]. The use of digital infrared thermal imaging has not yet become the main tool for detecting early breast cancer since it relies on skin lesions and temperature [3]. However, promising results indicate that radiologists can use it with mammography to evaluate the state of the breast for accurate assessment and diagnosis of breast cancer.
Recently, with the advances in machine learning (ML) and deep learning (DL) techniques, the detection and diagnosis of breast cancer using ML and DL are becoming more effective. Moreover, deep attention techniques have attracted more interest in this field [4] because of the promising results achieved when DL algorithms for breast cancer detection were integrated with deep AMs. This directs special attention to prominent areas of the image instead of treating all batches as equally important, which in turn increases the likelihood of improving the performance of the applied techniques.
Although breast cancer detection is advanced, more research is needed to explore different modalities and enhance detection accuracy when using new ML algorithms with deep AMs.
Therefore, this research aims to contribute to the field of breast cancer detection. The main objective of this study is to provide a robust and high-performance model based on DL and AMs to detect breast cancer using thermal imaging, helping physicians in making a more accurate and validated breast cancer tumor diagnosis.
The remaining sections of this paper are organized as follows. Section 2 presents a background overview of the DL methods. Section 3 gives a brief overview of deep AMs. The following section reviews the related literature in breast cancer detection. The proposed method is discussed in Section 5, which includes the experiment design and evaluation methods. Section 6 discusses the experimental results. Finally, Section 7 concludes this paper with the main findings and future directions.
2. Deep Learning and Convolutional Neural Network (CNN)
Machine learning (ML) is a subset of AI that enables systems to learn and improve automatically from the experiment without programming them manually. It is based on a dataset of examples, experiences, or instructions used for training to help analyze and extract meaning from data [5]. The result helps in classification, prediction, and detection, especially in the medical field. However, we can categorize AI innovations into two categories: conventional ML and DL. Conventional ML algorithms are based on system learning through training data in order to develop a trained model. These conventional ML algorithms have enhanced the development of many applications to run automatically and provided many advantages. Yet, the performance of conventional ML algorithms was outperformed by an advanced type of ML algorithms known as DL [6].
DL trains artificial neural networks through learning multiple levels of representation and abstraction that include data such as images, sound, and text [7]. DL algorithms effectively handle large rather than limited data. Different categories of DL techniques have been applied in the literature. One of the main DL algorithms is convolutional neural networks (CNNs).
A CNN is an effective and popular DL approach to image-based classification and recognition work for supervised learning. A CNN consists of several layers stacked on top of each other, including convolution, pooling, and fully connected layers, and each layer has a different task. The CNN is trained by providing the appropriate input, and the parameters are calculated layer by layer to produce a final output. The convolution layer determines the presence of certain features or patterns in the input data. It is possible to use several filters to extract different features. At the same time, the pooling layer reduces the dimensions of the feature maps and network parameters, and in the last stage, the fully connected layer connects neurons with all neurons in the preceding layer, which provides essential results such as the category scores in the case of classification [8].
In general, DL has revolutionized computer vision using superhuman accuracy algorithms in various tasks and areas. Several prominent approaches to image processing and classification have been presented, which have improved performance, especially in the medical field.
3. Deep Attention Mechanisms
Usually, when applied on images, ML algorithms will give equal importance—”attention”—to all patches of an image without giving special attention to prominent areas. By incorporating AMs with ML, the most prominent areas of the image are emphasized, increasing the possibility of improving the performance of the applied techniques. The AMs can highlight the most critical parts of the input information and thus improve its ability to extract the most relevant information for each part of the output and suppress or even ignore completely irrelevant information, resulting in improvements in the quality of the dynamically generated output. AMs were first used for machine translation and then utilized in neural networks. Their use rapidly developed in image processing, answering questions, and machine translation [9]. There are three main types of AMs, which we will briefly discuss.
- Soft Attention: A series of elements are used to calculate categorical distribution. The resulting possibilities reflect the importance of each element and are used as weights to generate context-aware encoding that represents the weighted total of all elements [10]. It identifies how much attention should be spent on each element, considering the interdependency between the deep neural network’s mechanism and the target, by assigning a weight of 0 to 1 to each input element. The attention layers calculate weights using softmax functions, making the overall attentional model deterministic and differentiable. Soft attention has the ability to act both spatially and temporally. The primary function of the spatial context is to extract the features or weight of the most essential features. It adjusts the weights of all samples in sliding time windows for the temporal context, as samples at various periods contribute differently. Soft mechanisms have a high processing cost while being deterministic and differentiable [11].
- Hard Attention: From the input sequence, a subset of elements is chosen. The hard AMs force the model to focus solely on the important elements, ignoring all others, where the weight assigned to an input part is either 0 or 1. As a result, the objective is non-differentiable since the input elements are either observed or not. The procedure entails making a series of decisions on which parts to highlight. For example, in the temporal context, the model attends to a portion of the input to acquire information, deciding where to focus in the following step based on the known information. Based on this information, a neural network may decide. Hard-attention mechanisms are represented by stochastic processes since there is no ground truth to suggest the optimal selection policy. Reinforcement learning approaches are required to train models with hard attention since the model is not differentiable [11]. In fact, various natural language processing tasks rely solely on very sparse tokens from long text input. Hard attention is well-suited for these tasks because it overcomes the weakness of soft attention in long sequences [10]. When compared to soft mechanisms, inference time and computational costs are reduced whenever the complete input is not stored or processed [11].
- Self-Attention: The interdependence between the input elements of the mechanism is measured because it allows the input to interact with the other “self” and decide what it should pay more attention to. The parallel computation capacity for a long input is one of the self-attention layer’s primary benefits over soft and hard mechanisms. This mechanism layer uses simple and readily parallelizable matrix calculations to check the attention of all the identical input elements [11].
4. Related Work
This section presents a review of the current literature on breast cancer diagnosis and classification using thermal imaging.
In the past few years, a significant number of studies have been conducted using ML and DL to diagnose breast cancer in mammography and histopathology imaging.
A hybrid method using a CNN and LSTM was proposed in [12] to classify 7909 histological images extracted from the BreakHis dataset, after features are extracted using a proposed model fed into softmax and SVM for the decision stage. The best precision of 96% was achieved on a 40× dataset, and the best accuracy of 91% on 200×, which was comparable with the most recent findings.
In [13], the authors proposed a new CNN architecture inspired by the U-net structure of the two CBIS-DDSM mass and macrocalcification mammography datasets, in which whole data from both datasets of 692 mass images and 603 macrocalcification images were trained, while 202 and 152 were tested, respectively. The model achieved an accuracy of 94.31%.
A new model called IRRCNN was proposed in [14] based on a CNN to classify breast cancer (benign/malignant) based on 7909 histopathological images extracted from the BreakHis dataset and to verify the performance of the model. For the test, the model achieved 91.4%, compared to the methods applied to the open-source dataset. The BC-DROID model enabled one-step automatic detection and classification using a CNN; in [15] the model was trained on 10,480 complete mammograms extracted from DDSM data, achieving a detection accuracy of 90%, a classification accuracy of 93.5%, and an AUC of 92.315%.
In [16], a gray-level co-occurrence matrix and a gray-level run-length matrix extracted and fed two inputs into a hybrid deep learning model of a CNN and RNN called a CRNN for the detection of mammographic breast cancer; the result and AND operation outputs of the classifier achieved a diagnostic accuracy of 90.59%, which outperformed the traditional models.
The rapid growth in the development of infrared cameras has recently led to an expansion of research to diagnose and classify breast cancer using thermal images. Many studies have been conducted using ML and DL algorithms on thermal images.
The authors of [17] classified 1052 thermogram images from the University Hospital at The Federal University of Pernambuco. They used several models such as the Bayes network, naïve Bayes, SVM, J48 decision tree, multi-layer perceptron (MLP), random forest (RF), random tree (RT), and ELM. The results showed that MLP gave promising results compared to the other classifiers, with an accuracy of 73.38%, a kappa index of 0.6007, a sensitivity of 78%, and a specificity of 88%. The test was also performed using a 10-fold cross-validation method with a kappa index of 0.6402, and the accuracy was increased to 76.01%. The overall efficiency of the system was 83%. In another study [18], the features SSigFS, FStat, and STex were used to improve the performance of ANN, SVM, KNN, and DT classifiers in diagnosing thermal images from the DBT-TU-JU and DMR-IR datasets. The classifiers’ performances in both databases were compared; in DBT-TU-JU, SVM-RBF and ANN achieved the highest accuracy of 84.29%, while in the DMR-IR dataset, ANN and SVM-linear achieved the highest accuracy of 87.50%.
On the other hand, DL algorithms, especially a CNN, have been applied on thermal images and have shown a competitive performance in diagnosing breasts. In one of the studies applying DL on thermal images [19], a CCN was applied for the first time to classify thermal images and was optimized by the Bayes optimization algorithm. It was trained on 1116 images extracted from the DMI dataset and achieved an accuracy of 98.05%. Compared with previous studies using the same dataset, with different features and classifiers, the model achieved a competitive performance on more images.
In another study [20], the authors diagnosed breast cancer from thermal images using a DCNN model. They converted 680 thermal images to grayscale extracted from a Visual lab-IR dataset and then pre-processed, segmented, and classified them. They achieved predictive accuracy of 95.8% with 680 thermograms. This model outperformed the study in [21], which achieved an accuracy of 93.30% with 50 thermograms. In addition, in comparison to a study in 2012 [22] that used the DT and fuzzy classifiers, it achieved the highest average accuracy of 93.30% and a significant improvement was achieved in this study. In [23] the authors investigated the combination of GVF breast segmentation and CNN classification to detect breast cancer. They used 63 breast images obtained from the DMR-IR dataset as normal and abnormal. The model was evaluated using a 2-fold cross-validation approach; it obtained 100% accuracy, sensitivity, and specificity, and achieved a better performance than tree random forest (TRF), MLP, and Bayes Network.
The authors of [24] applied a multi-input classifier model based on CNNs for early detection of breast cancer that combines thermal images of different opinions with the personal and clinical data of 287 patients. They compared the performance of seven models; the results demonstrated that the M.4ncd model had the best accuracy of 97%, AUC ROC of 0.99, a specificity of 100%, and a sensitivity of 83%. Furthermore, the M.4ncd model results were compared with the results of other studies in the literature, and the model outperformed them in AUC ROC and specificity measures.
In [25], CNNs were trained to classify thermal images through static and dynamic protocols. The DMR-IR dataset that was classified through the static protocol contained 300 thermal images. Using the dynamic protocol, 2740 images were classified. The proposed method obtained competitive results in both protocols. The static protocol achieved 98% accuracy for color images and 95% for grayscale, while the dynamic protocol achieved 95% for color images and 92% for grayscale. It outperformed other methods applied to the same dataset.
The reviewed studies using thermal breast cancer images demonstrated that, compared to other image modalities, thermal images achieved good results when used for the detection of breast cancer. Additionally, they were used with both ML and DL methods.
As we have seen, the previous reviewed studies gave equal importance or “attention” to all patches of an image and did not give special attention to prominent areas. These studies were conducted using AMs integrated with DL algorithms.
In [26], the authors introduced a new model of DL for the diagnosis and classification of histopathology images. This consisted of CNN and RNN models and used a parallel structure of two different types of neural networks—a CNN (DenseNet) and an RNN (LSTM)—with AMs conducted on three datasets. They applied the models on three datasets, namely, BACH2018, Bioimaging 2015, and Extended Bioimaging 2015. The accuracy rates achieved on those three datasets were 92%, 96%, and 97.5%, respectively. Similarly, in [27], the BreastNet model was built based on CNNs and AMs to classify 7909 tissue images extracted from the BreakHis dataset. The best results were achieved using 200X images with an accuracy of 98.51%, sensitivity of 98.70%, and F1-score of 98.28%.
In another study [4], the authors introduced a new CNN-based approach that includes two separate attention units to learn a more effective feature for classifying 7909 histopathology images from the BreakHis dataset. The model achieved 98% accuracy when amplifying 100×, which outperformed the latest methods performed on the same dataset by a large margin.
The authors of [28] suggested a CNN-based, fine-grained image model to extract features and a novel AM for localizing objects performed on histology images from Peking Union Hospital and the BACH benchmark dataset from the 2018 Grand Challenge in Breast Cancer Histology images. The performance of the proposed method was compared with five recently reported methods on the histology dataset; results showed that the proposed model in this study achieved an accuracy of 96%, with an improvement of 2% compared to the others.
To identify potential lesion areas from the images and to avoid processing the original image, the authors of [29] proposed a model based on the deep attention network to classify histological images extracted from the BreakHis dataset. The model showed a 98% accuracy rate in four different amplification types, as well as a 50% reduction in training time compared to the POMDP-based approach.
In [30], a novel AM was developed to classify high-resolution histological images of breast tissue using a CNN and BLSTM. The model was trained on the ICIAR 2018 database. The experimental results revealed that the model achieved 85.50% accuracy for classification in four classes and 96.25% in two classes. The model was also compared with and without the AM. Moreover, it was compared with state-of-art methods, and it outperformed other methods when applied with and without the AM.
The authors of [31] improved CNNs by integrating an innovative SE-Attention mechanism to classify 18,157 collected mammograms and built a new benchmarking dataset. The model outperformed other studies with an accuracy of 92.17%.
To improve the performance on the BreakHis dataset, the authors of [32] suggested a tissue image classification framework for breast cancer based on RESNET with a convolutional block attention module (CBAM). The proposed model was used to classify 7909 images; it showed a significant improvement by achieving an accuracy of 92.6%, sensitivity of 94.7%, specificity of 88.9%, F1-score of 94.1%, and AUC of 91.8% for 200× magnification factor. In addition, results of ResNet50 and ResNet-50 with a CBAM at patient-level and image-level were compared to the proposed method and others, showing a significant improvement in accuracy.
In conclusion, Table 1 includes a brief review of related works, and we can infer that DL with deep AMs has not been applied on thermal images for breast cancer diagnosis. On the other hand, based on studies reviewed in the previous subsection, breast cancer detection in thermal images has shown promising accuracy results compared to other modalities. This encourages investigation of the effect of integrating DL methods with AMs in detecting breast cancer in thermal images. Thus, our contribution in this work is exploring and comparing the use of different types of deep attention mechanisms with CNNs in the detection of breast cancer in thermal images. Based on our review of the related works this approach has not been previously used.

Table 1.
Breast cancer detection and classification studies.
5. Materials and Methods
This section describes how we achieved our goals and objectives practically. An experimental research approach was used to answer the following research question: “To what extent can deep learning techniques with deep AMs improve performance for the task of breast cancer detection in thermography images?”
Our proposed method introduces the AMs and the approach of CNNs to improve breast cancer detection and classification using thermal images through five components: preprocessing, feature extraction, BLSTM, AMs, and image classification. Figure 1 illustrates the steps in the proposed methodology. Next, we will provide details on these stages.
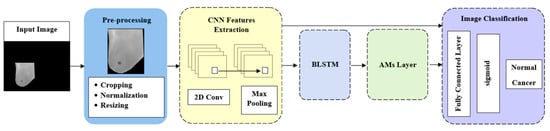
Figure 1.
Model architecture.
5.1. Preprocessing
In this stage, we used segmented grayscale images from DMR-IR datasets that were preprocessed by employing cropping, normalization, and resizing. In post-preprocessing these thermal images were transformed from the original 640 × 480 dimensions into 56 × 56 dimensions, which is the resolution often utilized in CNN applications [25]. In order to minimize overfitting, all images were enhanced in the following stage to provide a more significant size dataset for training
After the dataset was pre-processed, we divided it into training and testing sets using a stratified 10-fold cross-validation technique. The data were divided into ten roughly equal segments, with one subset used as a roughly equivalent test set.
5.2. Feature Extraction
Feature extraction is desirable in pattern recognition that focuses on distinguishing between the normal and the cancerous breast. We used a CNN as a powerful feature extraction ability to extract an efficient feature set of segmented grayscale images. We constructed a stacking of a series layer as follows:
- Image input layer: The image input layer is the connection layer to the network, as it contains the channel size and the input image size. Based on the database containing the grayscale images, the channel size was 1, and the size of the post-processing images was 56 × 56, so the input layer was 56 × 56 × 1.
- Convolution layer: A set of filters in the CNN processed the input image to generate activation maps. By stacking the activation maps along the depth dimension, the layer output was produced. Three parameters determined the convolution layer structure; the first parameter determined the filter size, and the second parameter determined the feature mappings. Then, via a Stride, we slid the filter over the following receptive area of the same input image and repeated the procedure. The same procedure was repeated until we completed the entire image. The input for the following layer will be the output.
- Max pooling layer: After convolution, the spatial volume of the input image was reduced using a pooling layer. It was employed between two convolution layers. Max pooling is a reduced feature map that retains the majority of the dominant features from the previous feature map after redundant data have been eliminated.
- Dropout layer: Overfitting may be avoided by using the dropout technique, which also offers a way of roughly combining many distinct neural network architectures efficiently and exponentially. Dropout refers to units in a neural network that are dropping, both hidden and visible. Dropping a unit out entails removing it temporarily from the network.
5.3. BLSTM Layer
It is commonly acknowledged that an image has spatial characteristics; we used a BLSTM network to learn long-term information from spatial features. To make full use of the past and future context information of a sequence in classification, a bidirectional LSTM was employed to extract temporal features from forward and backward order.
5.4. AMs Layer
Based on the BLSTM output, we produced various attention values that represented the significance of the feature vector. In this layer, we applied three AMs separately, using the same procedures in the previous and subsequent layers, which were as follows: self-attention (SL), soft attention (SF), and hard attention (HD).
- SL layer: Processing sequential data with an attention technique that takes each timestamp’s context into account. In this paper, it is implemented by package keras-self attention with multiplicative type, by using the following equation [33]:
- SF layer: Discredits irrelevant areas by multiplying the corresponding features map with a low weight. Accordingly, a high attention area keeps the original value while low-attention areas get closer to 0 (become dark in the visualization). We use the hidden state from the previous time step to compute a weight for covering each sub-section of an image. We compute a score to measure how much attention as the following equation [34]:We pass to a softmax for normalization to compute the weight .With softmax, adds up to 1, and we use it to compute a weighted average for
- HD layer: This forces the model to focus solely on the important elements, ignoring all others, where the weight assigned to an input part is either 0 or 1. As a result, the objective is non-differentiable since the input elements are either observed or not. To compute HD, using as a sample rate to pick one as the input to the next layer, instead of a weighted average as in SF [34].
5.5. Fully Connected Layer
We combined all the information acquired from the preceding layers across the network to classify the given image. The output was flattened and fed to the fully connected layer from the preceding layers.
5.6. Sigmoid Layer
The output of the fully connected layer was converted into binary (0 or 1) using a sigmoid function, which may then be used to interpret as classification probabilities.
5.7. Classification Layer
This was the last layer in the network. The layer assigned each input to one of the two mutually exclusive classes (normal or cancer) by using the classification probabilities generated by the sigmoid for each input. After training, the trained network performed the test set classification.
Three AM models, SL, HD, and SF with CNN, were developed, which we called CNN-SL, CNN-HD, and CNN-SF. We used a CNN without AMs for comparison and to define the impact of the AMs on the CNN performance. In the CNN model, all layers were applied except the BLSTM and AMs, while in the CNN models with AMs, all layers were applied, as shown in the Figure 1 dataset.
From our review of the research work on breast cancer detection using thermal images, the most-used dataset of thermal images was DMR-IR, consisting of static and dynamic protocols, which is freely available online for researchers in the field [35]. The DMR static protocol recorded only 1 image per patient, consisting of 177 images of healthy patients and 42 images of cancer patients. The dynamic protocol recorded a set of 20 images per patient for 95 healthy patients, for a total of 1900 images, and for the non-healthy cases, there were 42 patients, totaling 840 images. Each patient image had a spatial resolution of 640 × 480 pixels that could be downloaded in JPG or BMP format. The dataset was imbalanced, and we addressed this problem by using popular techniques such as data augmentation and resampling. We augmented the dataset, which is a significant factor of most DL classification models since it improves classification accuracy by decreasing bias because the models have enough data to train on. The augmented techniques used:
- Rotation
- Brightness alteration
Consequently, we had two augmented versions of each original image and the dataset size increased to 4146 images.
5.8. Evaluation Metrics
To evaluate and compare the performance of the different developed models of breast cancer detection using AMs and deep neural networks in thermal breast images, these evaluation metrics were used: accuracy, sensitivity, specificity, precision, and F1-score. The equations for these metrics are given as follows [36]:
where TP, TN, FP, and FN indicate true positive, true negative, false positive, and false negative, respectively.
Accuracy = (TP + TN)/(TP + TN + FP + FN)
Specificity = TN/(TN + FP)
Sensitivity (also known as Recall) = TP/(TP + FN)
Precision = TP/(TP + FP)
F1-score = 2 (Precision × Recall)/(Precision + Recall)
The accuracy is the proportion of the total number of correctly classified cases. It is easy to understand but can be misleading, especially if you have an uneven class distribution. Specificity is the fraction of negative occasions. Precision is the ratio of correctly positively labeled (abnormal) cases to all positively identified cases. Sensitivity (recall) is the proportion of positive (abnormal) cases correctly identified as positive. On the other hand, the F1-score is considered a better indicator of the classifier’s performance than accuracy. It sums up the predictive performance of a model by combining the two competing metrics, precision and recall [36].
The model’s ability to distinguish between classes is measured by the AUC ROC, which typically has a value range between 0.5 and 1. In the medical context, it assesses the model’s diagnostic performance; values closer to 1 indicate good test results, while values closer to 0.5 indicate poor test results [24]. Moreover, the developed model was compared with the state-of-art studies discussed in Section 4, Related Work.
6. Results
We evaluated the developed models and compared them to the methods in the literature. We compared the performances of the developed models using SL, HD, and SF AMs with a CNN on the DMR-IR dataset of thermal images, which resulted in four different models (CNN, CNN-SL, CNN-HD, CNN-SF). To evaluate our proposed approach against other approaches, we compared the achieved results of the four models with the state-of-the-art methods reviewed in the literature review section.
The remaining parts of this section are organized as follows: Section 6.1 will briefly describe the experimental settings. Section 6.2 describes the classification results, and Section 6.3 discusses the comparisons of CNNs with different AMs. Finally, the fourth part will compare the developed models to other DL-based models in the literature.
6.1. Experimental Settings
The proposed models were trained for breast cancer diagnosis on thermal images based on the dynamic protocol from the DMR-IR dataset. The dataset contains 1542 thermal images divided into carcinogenic (762) and non-carcinogenic (780) breasts for 56 patients. The dataset was split into training and testing sets of 1302 and 240 thermal images, respectively. To overcome the problem of the small dataset size, we expanded the training dataset size using image augmentation techniques, namely, rotation and brightness change. We rotated the original images 90 degrees. We adjusted the brightness, a color augmentation technique, of the images so that the resulting image was lighter than the original images. Thus, for each original image we had two versions of augmented images. Table 2 details information about the dataset.
Table 2.
Dataset details.
The training and test datasets were united as inputs (images) and targets (labels), and then we used a 10-fold cross-validation technique for training and testing the models. Following stratified sampling, the source data were split into 10 roughly equal disjointed segments. One subset of the test sets equivalent to 415 thermal images and labels was used to verify the performance of our modes, and the others were training sets equivalent to 3731 thermal images and labels.
Pretraining of these networks used a binary class of the DMR-IR dataset to obtain the initialization parameters of the models. All AMs were trained using the Adam optimizer, and we used the ReLU and sigmoid activation functions. To further improve the accuracy of the image classification results, periodic learning was used. The learning rate of the four models was 0.001. The batch size was set to 64 for the fitting models, and the number of epochs was set to 50.
6.2. Classification Results
Experiments were conducted to classify the thermal images of breast cancer through the proposed models using the CNN model with/without the self, hard, and soft AMs (CNN, CNN-SL, CNN-HD, CNN-SF). We resized all images to 56 × 56 pixels, which is the resolution often utilized in CNN applications [25]. Furthermore, we used stratified 10-fold cross-validation to ensure that each image was evaluated in both the test and training sets. Additionally, it minimized generalization issues introduced by overfitting. The performance of the proposed models was evaluated on the DMR-IR dataset, and the results were compared to determine the most accurate approach. Table 3 shows the accuracy, specificity, sensitivity, AUC ROC, and Cohen’s kappa scores of each model.
Table 3.
Performance of CNN with AMs.
Table 3 shows the average results of the CNN with/without AMs to observe the effect on the performance of the CNN model. The CNN model without the use of AMs achieved the lowest performance among the models; nevertheless, it showed good results. We found that using AMs with the CNN model had a high impact on the improved performance of the CNN in all metrics.
The results also showed a convergence between three AM models with the CNN. The CNN-HD indicated that the use of hard attention with the CNN had a slightly higher effect on metrics such as accuracy, specificity, sensitivity, and F1-score. The CNN-SF performed higher than other models in the precision metric. As we know, recall is a critical measure in medical applications; accordingly, the proposed model results achieved encouraging results.
Furthermore, we offered the results of the average AUC ROC of 10-fold cross-validation, where the AUC score represents the ability of the model to distinguish between classes, in our case, normal and cancer. The CNN models with the three AMs achieved convergence in results, which were about 0.999, while the CNN was 0.851. Figure 2 below plots the ROC curves of four models for each fold and shows the AUC results and average.
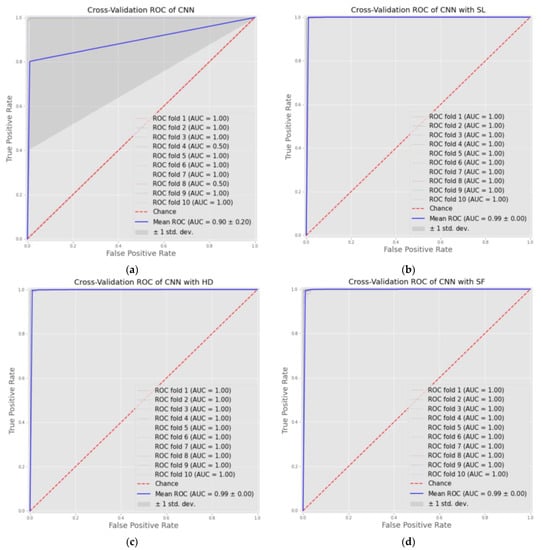
Figure 2.
ROC curves of cross-validation results of four models as: (a) CNN model; (b) CNN-SL model; (c) CNN-HD model; (d) CNN-SF model.
Cohen’s kappa is a robust statistic that can be utilized for intra- and inter-rater reliability evaluation. Similar to correlation coefficients, it can have values between −1 and +1, where 0 denotes the degree of agreement predicted by chance and 1 denotes perfect agreement between the raters. The kappa is a standardized value interpreted in the same way across various studies, such as in all correlation statistics. Cohen recommended using the following scale to interpret the kappa result: values ≤ 0 indicating no agreement, and 0.01–0.20 as none to slight, 0.21–0.40 as fair, 0.41–0.60 as moderate, 0.61–0.80 as substantial, and 0.81–1.00 as almost perfect agreement [37]. The CNN models with the three AMs presented a great performance in this metric, achieving 0.98 for all mechanisms, which represented almost perfect agreement. The result of the CNN alone was 0.69, which represented substantial agreement. We provided aggregate Cohen’s kappa scores of 10-fold cross-validation.
Figure 3 shows the aggregate confusion matrix of 10-fold cross-validation for the four models, CNN, CNN-SL, CNN-HD, and CNN-SF, on the DMR-IR dataset.
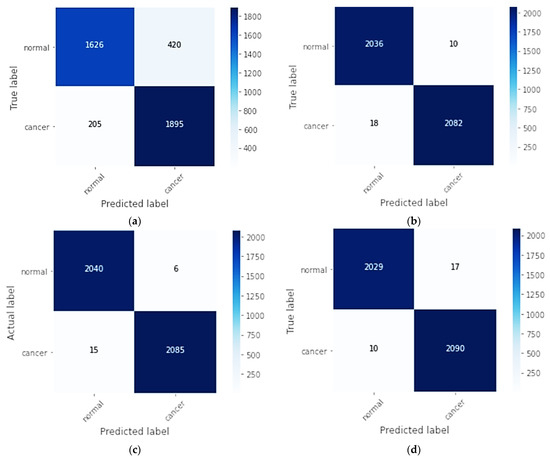
Figure 3.
Aggregate confusion matrix of all folds for each model as: (a) CNN model; (b) CNN-SL model; (c) CNN-HD model; (d) CNN-SF model.
In the aggregation confusion matrix, through 10-fold cross-validation of a true label and a predicted label, each fold had 204 normal and 210 cancer images. For the CNN, the 1626 normal breast class images were correctly classified, with 420 misclassifications, and in the cancer class, the 1895 images were correctly classified, with 205 images misclassified. In contrast, for the CNN-SL, 2036 normal breast class images were correctly classified, and 10 were misclassified, while in the cancer class, 2082 images were classified correctly, with 18 misclassified. For the CNN-HD, 2040 normal breast images were correctly classified with 6 misclassified, and 2085 cancer images were correctly classified, and 15 were misclassified. In the CNN-SF confusion matrix, 2029 images were correctly classified in the normal breast class, whereas 17 were misclassified, and of the cancer images, 2090 were correctly classified, while 10 were mistakenly classified.
The four tables of the classification report are shown in Figure 4, which also shows the classification performances of the CNN, CNN-SL, CNN-HD, and CNN-SF in terms of accuracy, precision, recall, F1-score, and support, where support represents the number of samples.
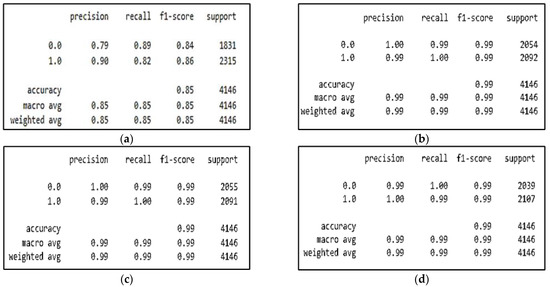
Figure 4.
CNN model with/without AMs experiment results for: (a) CNN model; (b) CNN-SL model; (c) CNN-HD model; (d) CNN-SF model.
To conclude and summarize the results, when looking at Table 3 and Figure 2 and Figure 3, we observed that early diagnosis of breast cancer through thermal images using CNNs with the proposed AMs was shown to be effective. The classification rate of 84.92%, with a low false alarm rate of 15.07% for the CNN represented the highest false alarm among all models owing to the absence of AMs. At the same time, the CNN-SL achieved a classification rate of 99.32% with a low false alarm rate of 0.67%, while the 99.49% classification rate of the CNN-HD with a low false alarm rate of 0.50% represented the lowest false alarm rate among all models. Finally, the CNN-SF had a classification rate of 99.34% with a low false alarm rate of 0.65%. It was evident from the accuracy obtained utilizing the CNN models with/without the three AMs that high results were achieved in all the proposed models. According to the findings, hard attention was the most accurate, followed by self-attention, and soft attention was third, the last CNN model.
6.3. Comparison with Other Models
To evaluate the effectiveness of the proposed approach and the model developed with the latest approaches in the literature, we compared the achieved results with those of other models. Table 4 shows the performance results of the proposed method compared with similar approaches in the literature. Most studies reported the accuracy, and some added additional metrics such as specificity and sensitivity (recall). Few of them reported precision, F1-score, and AUC score. The comparison of our proposed approach with these methods was considered regarding three different themes: (a) comparison with methods using DL on different types of images, (b) comparison with methods using DL on thermal images, and finally (c) comparison with methods using DL and AM on different types of images.
Table 4.
Comparison of the performance results of all models.
6.3.1. Comparison with Methods Using DL on Different Types of Images
Several methods were reviewed in the related work section and different DL methods were applied on different types of breast cancer images. Section (A) of Table 4 shows their performance results. As shown in the table, the achieved accuracy of the different methods was above 90%. They used different types of images: histopathology, mammography, and MRI. The best achieved accuracy of 94.31% in [13] was after using a U-Net CNN on mammography breast images. On the other hand, our CNN approaches to thermal images achieved accuracy rates of 99.34%, 99.49%, and 99.32% for SF, HD, and SL AMs, respectively (see Section (D) of Table 4). In addition, the AMs with the CNN achieved higher scores than [16] in sensitivity and specificity metrics, with 9% and 6%, respectively. In the measure of precision, all proposed models, including the CNN without AMs, achieved results higher than [12]. The CNNs with the three AMs achieved a competitive result with an AUC ROC of 0.999, while the study of mammograms achieved 0.9931 [15], where our result was higher. This proved that the use of a CNN with an AM on thermal images greatly enhanced the detection accuracy.
6.3.2. Comparison with Methods Using DL on Thermal Images
The literature review section discussed a variety of approaches that used different ML and DL techniques for thermal imaging of breast cancer. Section (B) of Table 4 shows the performance results of the used approaches.
Using a CNN, the achieved accuracy in the reviewed studies ranged from 92% to 98.95%. In [19], the highest accuracy of 98.95% was achieved using a CNN improved by the Bayes optimization algorithm. In contrast, our proposed method using SF, HD, and SL AMs with a CNN achieved accuracy rates of 99.34%, 99.49%, and 99.32%, respectively, as shown in Section (D) of Table 4.
Moreover, a study [20] was conducted on the same DMR-IR dataset and achieved a sensitivity of 99.40%, while the CNN-HD and CNN-SL models achieved 99.71% and 99.52%, respectively, with an increase of about 0.31%. In the AUC ROC and specificity metrics, our proposed model showed results that were competitive with [24].
The comparison of the results of our proposed approach with those of CNNs from similar studies using DL showed promising enhancements in the classification and detection of breast cancer in the thermal images. This confirmed the effectiveness of incorporating attention techniques with DL for enhancing the accuracy of breast cancer detection via thermal image.
6.3.3. Comparison with Methods Using DL and AMs on Different Types of Images
Previously, we compared our method with other methods using DL or using different types of images. Since our aim was to investigate the use of AMs with DL on thermal images, we considered and compared the results achieved in other methods that used AMs with DL but on different types of images. We reviewed several methods using an AM with DL on the two types of image modalities, mammography and histopathology.
Section (C) of Table 4 illustrates that those studies achieved an accuracy above 90%. In [4], the CNN model with AMs achieved the highest accuracy of 99.3% based on histopathology images. As we discussed earlier, our proposed models based on CNNs with three AMs (SF, HD, and SL) achieved competitive performance results on thermal images. Our CNN-HD model outperformed the results achieved in [4] with an accuracy of 99.49%.
The AMs used with the CNNs outperformed in outcomes of sensitivity and F1-score metrics for SL (99.52%, 99.32), CNN-HD (99.71%, 99.49), and CNN-SF (99.21%, 99.36). On the other hand, in the study conducted on histopathology images in [27], sensitivity was 98.70% and the F1-score was 98.28%. In addition, the outcomes of the AMs used with the CNNs showed higher results than [32] for the AUC ROC score, with an increase above 0.08.
Finally, we can conclude that, based on the results discussed in this section, our proposed methods achieved a higher performance than previous DL-based studies, whether using different types of images or using AMs. This comparison also proved that incorporating AMs with DL, whether or not CNNs, on thermal images for breast cancer diagnosis, a methodology that had not been explored, offered promising results and is worth further investigation for additional enhancements.
7. Conclusions and Future Work
We proposed three AM models with a CNN for use on thermographic images for breast cancer diagnosis. Our proposal proved that AMs improved the performance of the CNN model. Nevertheless, the CNN provided satisfactory results. Moreover, AMs with a CNN outperformed the models in related studies. The proposed breast cancer diagnostic models achieved the following test accuracy rates: CNN 84.92%, self-attention 99.32%, hard attention 99.49%, and soft attention 99.34%.
A limitation of our study is the limited availability of datasets of thermal breast images. In addition, the dataset size is small, and these issues were addressed in our study using augmentation techniques. Therefore, a future extension of this work would be to experiment with datasets of large sizes by merging multiple datasets and exploring multiple augmentation techniques.
In future work, the proposed models will be tested on different datasets of biomedical images. Moreover, AMs will be applied with pre-trained deep transfer learning models, and their results will be compared to the performance of the CNNs with AMs.
Author Contributions
Conceptualization, D.A.; Methodology, D.A.; Software, A.A.; Investigation, A.A.; Writing—original draft, A.A.; Writing—review & editing, D.A.; Supervision, D.A.; Project administration, D.A.; Funding acquisition, D.A. All authors have read and agreed to the published version of the manuscript.
Funding
This research project was funded by the Research Supporting Program Project Number (RSP2022R281), King Saud University, Riyadh, Saudi Arabia.
Institutional Review Board Statement
Not applicable.
Informed Consent Statement
Not applicable.
Conflicts of Interest
The authors declare no conflict of interest.
References
- Rajinikanth, V.; Kadry, S.; Taniar, D.; Damaševičius, R.; Rauf, H.T. Breast-Cancer Detection Using Thermal Images with Marine-Predators-Algorithm Selected Features. In Proceedings of the 2021 Seventh International Conference on Bio Signals, Images, and Instrumentation (ICBSII), Chennai, India, 25–27 March 2021; pp. 1–6. [Google Scholar]
- Singh, D.; Singh, A.K. Role of Image Thermography in Early Breast Cancer Detection- Past, Present and Future. Comput. Methods Programs Biomed. 2020, 183, 105074. [Google Scholar] [CrossRef] [PubMed]
- Parisky, Y.R.; Skinner, K.A.; Cothren, R.; DeWittey, R.L.; Birbeck, J.S.; Conti, P.S.; Rich, J.K.; Dougherty, W.R. Computerized Thermal Breast Imaging Revisited: An Adjunctive Tool to Mammography. In Proceedings of the 20th Annual International Conference of the IEEE Engineering in Medicine and Biology Society, Hong Kong, China, 1 November 1998; Volume 2, pp. 919–921. [Google Scholar]
- Wu, P.; Qu, H.; Yi, J.; Huang, Q.; Chen, C.; Metaxas, D. Deep Attentive Feature Learning for Histopathology Image Classification. In Proceedings of the 2019 IEEE 16th International Symposium on Biomedical Imaging (ISBI 2019), Venice, Italy, 8–11 April 2019; pp. 1865–1868. [Google Scholar]
- Melekoodappattu, J.G.; Subbian, P.S. Automated Breast Cancer Detection Using Hybrid Extreme Learning Machine Classifier. J. Ambient. Intell. Hum. Comput. 2020. [Google Scholar] [CrossRef]
- Palminteri, S.; Pessiglione, M. Chapter Five—Reinforcement Learning and Tourette Syndrome. In International Review of Neurobiology; Martino, D., Cavanna, A.E., Eds.; Advances in the Neurochemistry and Neuropharmacology of Tourette Syndrome; Academic Press: Cambridge, MA, USA, 2013; Volume 112, pp. 131–153. [Google Scholar]
- Almajalid, R.; Shan, J.; Du, Y.; Zhang, M. Development of a Deep-Learning-Based Method for Breast Ultrasound Image Segmentation. In Proceedings of the 2018 17th IEEE International Conference on Machine Learning and Applications (ICMLA), Orlando, FL, USA, 17–20 December 2018; pp. 1103–1108. [Google Scholar]
- Yamashita, R.; Nishio, M.; Do, R.K.G.; Togashi, K. Convolutional Neural Networks: An Overview and Application in Radiology. Insights Imaging 2018, 9, 611–629. [Google Scholar] [CrossRef] [PubMed]
- Tian, H.; Wang, P.; Tansey, K.; Han, D.; Zhang, J.; Zhang, S.; Li, H. A Deep Learning Framework under Attention Mechanism for Wheat Yield Estimation Using Remotely Sensed Indices in the Guanzhong Plain, PR China. Int. J. Appl. Earth Obs. Geoinf. 2021, 102, 102375. [Google Scholar] [CrossRef]
- Shen, T.; Zhou, T.; Long, G.; Jiang, J.; Wang, S.; Zhang, C. Reinforced Self-Attention Network: A Hybrid of Hard and Soft Attention for Sequence Modeling. In Proceedings of the Twenty-Seventh International Joint Conference on Artificial Intelligence, Stockholm, Sweden, 13–19 July 2018; International Joint Conferences on Artificial Intelligence Organization: Stockholm, Sweden, 2018; pp. 4345–4352. [Google Scholar]
- de Correia, A.S.; Colombini, E.L. Attention, Please! A Survey of Neural Attention Models in Deep Learning. arXiv 2021, arXiv:2103.16775. [Google Scholar] [CrossRef]
- Nahid, A.-A.; Mehrabi, M.A.; Kong, Y. Histopathological Breast Cancer Image Classification by Deep Neural Network Techniques Guided by Local Clustering. Biomed Res. Int. 2018, 2018, 2362108. [Google Scholar] [CrossRef] [PubMed]
- Rashed, E.; El Seoud, M.S.A. Deep Learning Approach for Breast Cancer Diagnosis. In Proceedings of the 2019 8th International Conference on Software and Information Engineering, Cairo, Egypt, 9 April 2019; ACM: Cairo, Egypt, 2019; pp. 243–247. [Google Scholar]
- Arslan, A.K.; Yaşar, Ş.; Çolak, C. Breast Cancer Classification Using a Constructed Convolutional Neural Network on the Basis of the Histopathological Images by an Interactive Web-Based Interface. In Proceedings of the 2019 3rd International Symposium on Multidisciplinary Studies and Innovative Technologies (ISMSIT), Ankara, Turkey, 11–13 October 2019; pp. 1–5. [Google Scholar]
- Platania, R.; Shams, S.; Yang, S.; Zhang, J.; Lee, K.; Park, S.-J. Automated Breast Cancer Diagnosis Using Deep Learning and Region of Interest Detection (BC-DROID). In Proceedings of the 8th ACM International Conference on Bioinformatics, Computational Biology, and Health Informatics, Boston, MA, USA, 20 August 2017; ACM: Boston, MA, USA, 2017; pp. 536–543. [Google Scholar]
- Patil, R.S.; Biradar, N. Automated Mammogram Breast Cancer Detection Using the Optimized Combination of Convolutional and Recurrent Neural Network. Evol. Intel. 2021, 14, 1459–1474. [Google Scholar] [CrossRef]
- Santana, M.A.; Pereira, J.M.S.; Silva, F.L.; Lima, N.M.; Sousa, F.N.; Arruda, G.M.S.; de Lima, R.C.F.; Silva, W.W.A.; Santos, W.P. Breast Cancer Diagnosis Based on Mammary Thermography and Extreme Learning Machines. Res. Biomed. Eng. 2018, 34, 45–53. [Google Scholar] [CrossRef]
- Gogoi, U.R.; Bhowmik, M.K.; Ghosh, A.K.; Bhattacharjee, D.; Majumdar, G. Discriminative Feature Selection for Breast Abnormality Detection and Accurate Classification of Thermograms. In Proceedings of the 2017 International Conference on Innovations in Electronics, Signal Processing and Communication (IESC), Shillong, India, 6–7 April 2017; pp. 39–44. [Google Scholar]
- Ekici, S.; Jawzal, H. Breast Cancer Diagnosis Using Thermography and Convolutional Neural Networks. Med. Hypotheses 2020, 137, 109542. [Google Scholar] [CrossRef] [PubMed]
- Mishra, S.; Prakash, A.; Roy, S.K.; Sharan, P.; Mathur, N. Breast Cancer Detection Using Thermal Images and Deep Learning. In Proceedings of the 2020 7th International Conference on Computing for Sustainable Global Development (INDIACom), Bvicam, New Delhi, 12–14 March 2020; pp. 211–216. [Google Scholar]
- Mambou, S.J.; Maresova, P.; Krejcar, O.; Selamat, A.; Kuca, K. Breast Cancer Detection Using Infrared Thermal Imaging and a Deep Learning Model. Sensors 2018, 18, 2799. [Google Scholar] [CrossRef] [PubMed]
- Mookiah, M.R.K.; Acharya, U.R.; Ng, E.Y.K. Data Mining Technique for Breast Cancer Detection in Thermograms Using Hybrid Feature Extraction Strategy. Quant. InfraRed Thermogr. J. 2012, 9, 151–165. [Google Scholar] [CrossRef]
- Tello-Mijares, S.; Woo, F.; Flores, F. Breast Cancer Identification via Thermography Image Segmentation with a Gradient Vector Flow and a Convolutional Neural Network. J. Healthc. Eng. 2019, 2019, e9807619. [Google Scholar] [CrossRef] [PubMed]
- Sánchez-Cauce, R.; Pérez-Martín, J.; Luque, M. Multi-Input Convolutional Neural Network for Breast Cancer Detection Using Thermal Images and Clinical Data. Comput. Methods Programs Biomed. 2021, 204, 106045. [Google Scholar] [CrossRef] [PubMed]
- de Freitas Oliveira Baffa, M.; Grassano Lattari, L. Convolutional Neural Networks for Static and Dynamic Breast Infrared Imaging Classification. In Proceedings of the 2018 31st SIBGRAPI Conference on Graphics, Patterns and Images (SIBGRAPI), Paraná, Brazil, 29 October–1 November 2018; pp. 174–181. [Google Scholar]
- Yao, H.; Zhang, X.; Zhou, X.; Liu, S. Parallel Structure Deep Neural Network Using CNN and RNN with an Attention Mechanism for Breast Cancer Histology Image Classification. Cancers 2019, 11, 1901. [Google Scholar] [CrossRef] [PubMed]
- Toğaçar, M.; Özkurt, K.B.; Ergen, B.; Cömert, Z. BreastNet: A Novel Convolutional Neural Network Model through Histopathological Images for the Diagnosis of Breast Cancer. Phys. A Stat. Mech. Appl. 2020, 545, 123592. [Google Scholar] [CrossRef]
- Fan, M.; Chakraborti, T.; Chang, E.I.-C.; Xu, Y.; Rittscher, J. Fine-Grained Multi-Instance Classification in Microscopy Through Deep Attention. In Proceedings of the 2020 IEEE 17th International Symposium on Biomedical Imaging (ISBI), Iowa City, IA, USA, 3–7 April 2020; pp. 169–173. [Google Scholar]
- Xu, B.; Liu, J.; Hou, X.; Liu, B.; Garibaldi, J.; Ellis, I.O.; Green, A.; Shen, L.; Qiu, G. Attention by Selection: A Deep Selective Attention Approach to Breast Cancer Classification. IEEE Trans. Med. Imaging 2020, 39, 1930–1941. [Google Scholar] [CrossRef] [PubMed]
- Sanyal, R.; Jethanandani, M.; Sarkar, R. DAN: Breast Cancer Classification from High-Resolution Histology Images Using Deep Attention Network. In Proceedings of the Innovations in Computational Intelligence and Computer Vision; Sharma, M.K., Dhaka, V.S., Perumal, T., Dey, N., Tavares, J.M.R.S., Eds.; Springer: Singapore, 2021; pp. 319–326. [Google Scholar]
- Deng, J.; Ma, Y.; Li, D.; Zhao, J.; Liu, Y.; Zhang, H. Classification of Breast Density Categories Based on SE-Attention Neural Networks. Comput. Methods Programs Biomed. 2020, 193, 105489. [Google Scholar] [CrossRef] [PubMed]
- Zhang, X.; Zhang, Y.; Qian, B.; Liu, X.; Li, X.; Wang, X.; Yin, C.; Lv, X.; Song, L.; Wang, L. Classifying Breast Cancer Histopathological Images Using a Robust Artificial Neural Network Architecture. In Proceedings of the Bioinformatics and Biomedical Engineering; Rojas, I., Valenzuela, O., Rojas, F., Ortuño, F., Eds.; Springer International Publishing: Cham, Switzerland, 2019; pp. 204–215. [Google Scholar]
- CyberZHG. Keras-Self-Attention: Attention Mechanism for Processing Sequential Data That Considers the Context for Each Timestamp; GitHub, Inc.: San Francisco, CA, USA, 2021. [Google Scholar]
- Soft & Hard Attention. Available online: https://jhui.github.io/2017/03/15/Soft-and-hard-attention/ (accessed on 12 December 2022).
- Silva, L.F.; Saade, D.C.M.; Sequeiros, G.O.; Silva, A.C.; Paiva, A.C.; Bravo, R.S.; Conci, A. A New Database for Breast Research with Infrared Image. J. Med. Imaging Health Inform. 2014, 4, 92–100. [Google Scholar] [CrossRef]
- Murugan, R.; Goel, T. E-DiCoNet: Extreme Learning Machine Based Classifier for Diagnosis of COVID-19 Using Deep Convolutional Network. J. Ambient. Intell. Hum. Comput. 2021, 12, 8887–8898. [Google Scholar] [CrossRef]
- McHugh, M.L. Interrater Reliability: The Kappa Statistic. Biochem. Med. 2012, 22, 276–282. [Google Scholar] [CrossRef]


Publisher’s Note: MDPI stays neutral with regard to jurisdictional claims in published maps and institutional affiliations. |
© 2022 by the authors. Licensee MDPI, Basel, Switzerland. This article is an open access article distributed under the terms and conditions of the Creative Commons Attribution (CC BY) license (https://creativecommons.org/licenses/by/4.0/).