Article

Novel Liposomal Formulation with Azelaic Acid: Preparation, Characterization, and Evaluation of Biological Properties

1
Faculty of Medicine and Pharmacy, University of Oradea, P-ta 1 Decembrie 10, 410087 Oradea, Romania
2
Faculty of Environmental Protection, University of Oradea, 26 Gen. Magheru Street, 410087 Oradea, Romania
*
Authors to whom correspondence should be addressed.
Appl. Sci. 2022, 12(24), 13039; https://doi.org/10.3390/app122413039
Submission received: 16 November 2022 / Revised: 12 December 2022 / Accepted: 15 December 2022 / Published: 19 December 2022
(This article belongs to the Special Issue Advances in Natural Bioactive Compounds and Biological Effects II)

Abstract

:
Azelaic acid (AA), as a natural product, was proven to be effective in targeting multiple causes of acne and related dermatological conditions, as it is well tolerated using different classical formulations (gel, cream, etc.). However, its limited aqueous solubility and inadequate penetration across the stratum corneum might be related to different possible side effects such as itching and burning. The aim of our work was to elaborate a novel liposomal formulation based on azelaic acid, with enhanced biocompatibility, bio-availability, antimicrobial, antigenotoxic, and anti-inflammatory properties. The liposomal formulations were prepared by the lipid film hydration method with different concentrations of azelaic acid (15%, 20%, 25%) and characterized in terms of morphological features, physico-chemical properties, antimicrobial, cytotoxic, and in vitro wound healing effect. Successful encapsulation with 80.42% efficiency, with a size of up to 500 nm and good stability, was achieved, as demonstrated by FTIR spectroscopy (Fourier Transform Infrared Spectroscopy), DLS (dynamic light scattering), and zeta-potential measurements. In terms of antibacterial activity, all the liposomal formulations exhibited a better effect compared to free AA solution against Staphylococcus aureus and Enterococcus faecalis. Cytotoxicity assays and an in vitro “scratch” test performed with normal human dermal fibroblasts revealed an accelerating healing effect, while a comet assay evidenced the protective effect of AA liposomal formulations against hydrogen-peroxide-induced DNA damage in fibroblasts. The optimum formulation in terms of both the antimicrobial and wound healing effect was AALipo20% (liposomes with 20% azelaic acid included).

1. Introduction

Azelaic acid (HOOC(CH2)7COOH) is a saturated dicarboxylic acid naturally found in grains like rye, barley, and wheat. In addition, it is produced by the fungus Malassezia furfur, a yeast that lives on the normal skin of mammals.
It has well-known effects, such as being antikeratinizing, antibacterial, anti-inflammatory, being well-tolerated by most people with dermatological diseases, and it can be safely used for years. It prevents acne-causing bacteria from growing on the skin and keeps the pores clean, as it is able to kill bacteria such as Propionibacterium acne and Staphylococcus epidermis by preventing them from producing cellular proteins. The pharmacological applications of azelaic acid (AA) include the treatment of inflammatory acne vulgaris with medium to moderate severity, skin pigmentation, and melasma [1,2,3,4]. It was demonstrated that AA exerts a bacteriostatic effect on both aerobic and anaerobic bacteria including Propionibacterium [5]. Azelaic acid produces a direct anti-inflammatory effect due to its ability to neutralize free oxygen radicals, and hence, acne and rosacea-related inflammation can be treated with topical medication based on azelaic acid applied to the skin [6]. The mechanism of action is based on the indirect activity against tyrosinase by inhibiting the interaction with thioredoxin reductase associated with the plasma membrane [7].
The traditional treatment of acne includes retinoids and retinoid-like drugs, benzoyl peroxide (BPO), antibiotics (clindamycin, erythromycin, alone or combined with BPO), adapalene combined with BPO [8,9,10,11], which are considered first-line treatments. It is well known that antibiotic overuse in the treatment of acne and other skin diseases has led to resistance patterns in Pseudomonas acnes, as both systemic and topical antibiotics are capable of changing the antibiotic-resistance patterns in bacteria [12]. Moreover, antibiotics used in the treatment of acne are also associated with the overgrowth of Streptococcus pyogenes and Staphylococcus aureus in the oral cavity, which in turn, may lead to the development of multiple pathologies [13].
In this context, azelaic acid, as a natural product, was proved to be effective in targeting multiple causes of acne, being well tolerated in numerous clinical trials [7] using different formulations (gel, cream, etc.) with an AA concentration in the range 10–20%. However, its limited aqueous solubility and inadequate penetration across the stratum corneum [14] might be related to different possible side effects such as itching and burning [15].
In order to overcome these limitations, researchers are focused on advanced and innovative formulations described as nanocarriers with versatile delivery systems for the effective management of acne and other cutaneous diseases [16]. Vesicular nanocarriers (liposomes, niosomes, ethosomes, cubosomes, etc.) and polymeric nanocarriers have been developed in order to increase its local efficacy while minimizing its side effects [17,18,19,20,21].
Among these, the advantages of the liposomal formulations are related to their unique composition, as cholesterol is able to reduce vesicle sizes in order to control skin permeation and deposition, along with significantly enhanced drug release [22].
The aim of our work was to elaborate a novel azelaic-acid-based liposomal formulation with enhanced biocompatibility, bio-availability, antimicrobial, antioxidant, antigenotoxic, and anti-inflammatory properties. For this purpose, the liposomes were formulated using the lipid film hydration technique and characterized in terms of physico-chemical and morphological features. The antibacterial effect of liposomal formulations was assessed in comparison to free azelaic acid against the most common Gram+ and Gram- germs. The cytotoxicity and viability assays were also performed for the liposomal formulations containing different concentrations of AA, using normal human dermal fibroblasts (NHDF). The evaluation of the wound healing effect using the “scratch” method was monitored in order to determine the optimum concentration of AA loaded in liposomes. Moreover, the protective effect of AA liposomal formulations against H2O2-induced DNA damage in the fibroblasts was highlighted by a comet assay.

2. Materials and Methods

2.1. Preparation of Liposomal Formulation

The lipid film hydration technique [23] was chosen for liposomes formulation, as described in Figure 1.
Thus, as a first step, the lipid phase containing phosphatidylcholine and cholesterol in a ratio of 3:1 was formulated. For their homogenization and solubilization, the mixture of organic solvents methanol and dichloromethane was used in a ratio of 2:3 (v/v). The lipid phase was subsequently subjected to the removal of organic solvents (37 °C, 110 rpm) so that at the end of the first stage, the lipid film was obtained, and this adhered to the walls of the flask.
The second step consists of the hydration of the lipid film, basically the formation of the oil-in-water (O/W) emulsion by adding the homogeneous mixture of phosphate buffer pH = 7.6 and azelaic acid solution in propylene glycol of different concentrations (15%, 20%, 25%) in ratio 10:1 v/v.
For the homogenization and formation of liposomes with AA of different concentrations, the phase II mixture is sonicated for 30 min, then centrifuged for 30 min at 10,000 rpm in order to obtain liposomes of smaller sizes [24,25].
The liposomes obtained are to be characterized (phase III).

2.2. Physico-Chemical and Morphological Characterization

FTIR spectroscopy was applied in order to demonstrate the successful inclusion of AA in the liposomes. FTIR spectra of the lyophilized liposomes with and without AA incorporated, along with pure AA (powder), were recorded with SHIMADZU FT 8400 S (Shimadzu Co., Kyoto, Japan) FTIR spectrophotometer operating in the range of 400–4000 cm−1, the spectral acquisition conditions being: wavelength resolution 2.00 cm−1, Happ-Genzel apodization, and 3 scans/spectrum.
DLS (dynamic light scattering) and zeta-potential measurements were carried out using ZEN3690 (Malvern Instruments, Malvern, UK) to determine the liposomes size distribution and zeta potential. For this purpose, the lyophilized powder was resuspended in distilled water and sonicated for 10 min before each measurement, to avoid aggregation. Determination of the surface electric charge or zeta potential is important because it indicates the stability of the liposomal emulsion [26,27].
Liposomes were observed using an Olympus CX40 inverted light microscope, through a 40× objective in phase-contrast mode, and the images were captured by a Hitachi CCD camera [28].

2.3. Encapsulation Efficiency Determined by Electrochemical Assay

The determination of azelaic acid encapsulation in liposomes was performed by potentiometric titration with a solution of 0.1 M NaOH as titrant using a pH meter equipped with pH electrode (WTW Inolab pH 7310).

2.4. Antimicrobial Activity against Gram (+) and Gram (−) Strains

The following strains were selected for antimicrobial assay: Staphylococcus aureus ATCC 25923, Enterococcus faecalis ATCC 29212, Escherichia coli ATCC 25922, and Pseudomonas aeruginosa ATCC 27853, along with the antibiotics (micro-compressed) Vancomycin 30 µg, Ampicillin 2 µg, Ceftriaxone 30 µg, and Ceftazidime 30 µg as controls. The diffusion method was employed [29] using three different concentrations of pure azelaic acid AA15% (azelaic acid in concentration 15%), AA20% (azelaic acid in concentration 20%), AA 25% (azelaic acid in concentration 25%), as well as the corresponding liposomal formulations.
The microbial inoculum was prepared in saline solution with a density of 0.5 McFar-land for each bacteria using the McFarland densitometer (Den-siCHEK Plus from bioMerieux, Inc., Durham, NC, USA), spread using a sterile cotton swab evenly over the entire surface of the agar plate to obtain uniform growth. The culture medium was Mueller–Hinton Agar medium. A small hole of 6 mm diameter (the same size as micro-compressed antibiotics) was prepared for each AA concentration and liposomal formulation in Petri dish and filled immediately with equal volumes from each sample. After 24 h incubation at 37 °C, the diameter of the inhibition area was measured. The assay was performed in triplicate and expressed as mean value ± standard deviation.

2.5. Cell Viability

Cell viability was determined using the trypan blue assay, an efficient and economical method for counting and testing cell viability. Normal human dermal fibroblast cells were seeded in 24-well plates at 1 × 10⁵ cells/well and incubated at 37 °C with 5% CO2 for 24 h. The following treatment was applied in each separate plate: AALipo15%, AALipo 20%, AALipo 25%, and blank liposomes. After 24 h, the cells were trypsinized (Trypsin/EDTA solution (0.25 mg/mL), LONZA), neutralized (TNS—Trypsin Neutralization Solution, LONZA), and centrifuged (1000 rpm/5 min). The resultant pellets were suspended in culture medium and cell viability was determined using the EVE Automatic devices (NanoEnTek Inc., Seoul, Republic of Korea) [26,30].
The percentage of cell viability was calculated according to the Formula (1) and the results were expressed as a percentage of the cell viability of the treated cells compared to the control (untreated cells–CTRL). Measurements were performed in triplicate and data were represented as mean ± standard deviation (SD).
Cell   viability   ( % ) = number   of   live   cells number   of   total   cells   ×   100

2.6. Cytotoxicity Assays (MTS Assay)

The MTS assay is based on the reduction of the MTS tetrazolium compound by viable cells (human fibroblasts) to generate a colored formazan dye that is soluble in cell culture media.
To perform the cytotoxicity assay, cells were seeded in sterile 98-well plates at a density of 2 × 10⁵ /mL by adding 50 µL of suspension cell growth medium. After 24 h, the samples (AALipo15%, AA Lipo20%, AALipo25%, and blank Lipo) were applied in volume 50 µL. Blank Lipo represented the positive control for liposomal forms, while untreated cells (containing only cell growth medium) were considered as control (CTRL). Cytotoxicity was determined at T0 h and T24 h.
10 µL MTS (3-(4,5-dimethylthiazol-2-yl)-5-(3-carboxy-methoxyphenyl)-2-(4-sulfophenyl) 2H tetrazolium) solution containing PMS (phenazine) was added in to each well, incubated for 2 h at 37 °C, and then the soluble formazan produced was recorded at 492 nm, with a reference wavelength of 630 nm using a microplate reader (Stat Fax 2100, Palm City, Sunnyvale, CA, USA) [31,32].
Results were expressed as percentage of cell viability compared to control. Tests were performed in triplicate.

2.7. Assessing the Healing Effect of AALipo Using the “Scratch” Method

The scratch method is widely used to model in vivo cell migration, based on quantifying the rate at which cells repopulate an artificial gap or scratch created in a confluent monolayer of cells. The evolution over time was monitored following the applied treatment.
24-well plates were seeded at a cell density of 4 × 10⁵/cm2 and incubated at 37 °C and 5% CO2 until the confluence was reached and there was a formation of a cellular monolayer. The culture medium was Dubelcco’s modified Eagle’s medium containing 10% fetal bovine serum, gentamicin 50 mg/mL, and recombinant fibroblast growth factor hFG (CC-4065) 1 mg/mL. Scratching was done vertically in each well with a sterile 100 µL pipette tip and the cell debris was gently removed and the wells were washed with PBS solution. The treatments were applied by adding 500 µL of each of the studied samples (AALipo15%, AALipo20%, AALipo 25% and blank Lipo) to each well, while the control (CTRL) was considered the same volume of cell growth medium. The test was performed in triplicate, with the evolution of fibroblasts motility and gap closure monitored using the CytoSMART Lux3BR® (Eindhoven, The Netherlands) device at different time points: T0 h, T12 h, T24 h, and T36 h [33].
The percentage of wound closure (W%) was calculated using the formula [26,30]:
W   ( % ) = Average   area   of   wound _ sample   ( µ m 2 )   at   time   t Average   area   of   wound _ sample   ( µ m 2 )   at   time   t = T 0 × 100
The obtained results were statistically interpreted.

2.8. Comet Assay

The protective effect of azelaic acid against DNA damage was assessed using the comet assay. The fibroblast cells were cultivated according to protocols described in the previous paragraph. The experimental design to evidence the protective effects of azelaic acid against DNA damage induced by hydrogen peroxide (H2O2) consisted of the following steps:
(a)
Cells treatment. The fibroblasts were incubated with 75 µM H2O2 for 10 min to induce DNA damage, then a part of cells was washed with HEPES preheated to 37 °C and treated with 10% azelaic acid, and the cells were maintained in incubator (5% CO2, 37 °C) for 60 min (H2O2 + AZE sample). Other parts of cells after treatment with 75 µM H2O2 were used immediately for comet assay and represents the positive control (CTRL +). The negative control (CTRL −) consists of the cells treated with PBS (solvent where azelaic acid was dissolved).
(b)
Comet assay (neutral single cell gel electrophoresis) was performed according to Purcarea et al. [34]. Briefly, the fibroblasts (1.5–2 ×·105 cells) were embedded into 0.7% low-melting-point agarose gel (Thermo Scientific, Waltham, MA, USA) and deposited on microscopic glass slide pre-covered with 1% normal-melting-point agarose, covered with other glass slide and left for 5 min on ice. Then, the slides were immersed in lysis buffer (2.5 M NaCl, 100 mM EDTA, 10 mM Tris-HCl, 1% N-lauroilsarcozine, pH 9.5) with freshly added 0.5% Triton X-100 and 10% DMSO (dimethyl sulfoxide) for 1 h at 4 °C. Subsequently, the slides were washed three times for 5 min/time with electrophoresis buffer (300 mM sodium acetate, 100 mM Tris-HCl, pH 8.3) and then subjected to horizontal electrophoresis (14 V, 0.5 V/cm, 11–12 mA) for 1 h, in the dark at 4 °C. The slides were then washed three times with cold distilled water (neutralization step) and stained with 2 mg/mL ethidium bromide. Cells were visualized using Bio Systems fluorescent microscope equipped with a 546 nm excitation filter and a 590 nm emission filter and images were photographed and processed with Comet Score software (Comet Score 2.0.0.38; TriTek Corp., Sumerdock, VA, USA).

2.9. Statistical Analysis

All values were represented as mean ± (SD) standard deviation and all experiments were performed in triplicate (n = 3). Data were statistically processed usingGraphPadPrism (GraphPad Software, Inc., La Jolla, CA, USA) and one-way analysis of variance, followed by Tukey’s multiple comparison test at p < 0.05, was used to indicate a statistically significant difference.

3. Results and Discussions

3.1. Physico-Chemical and Morphological Characterization

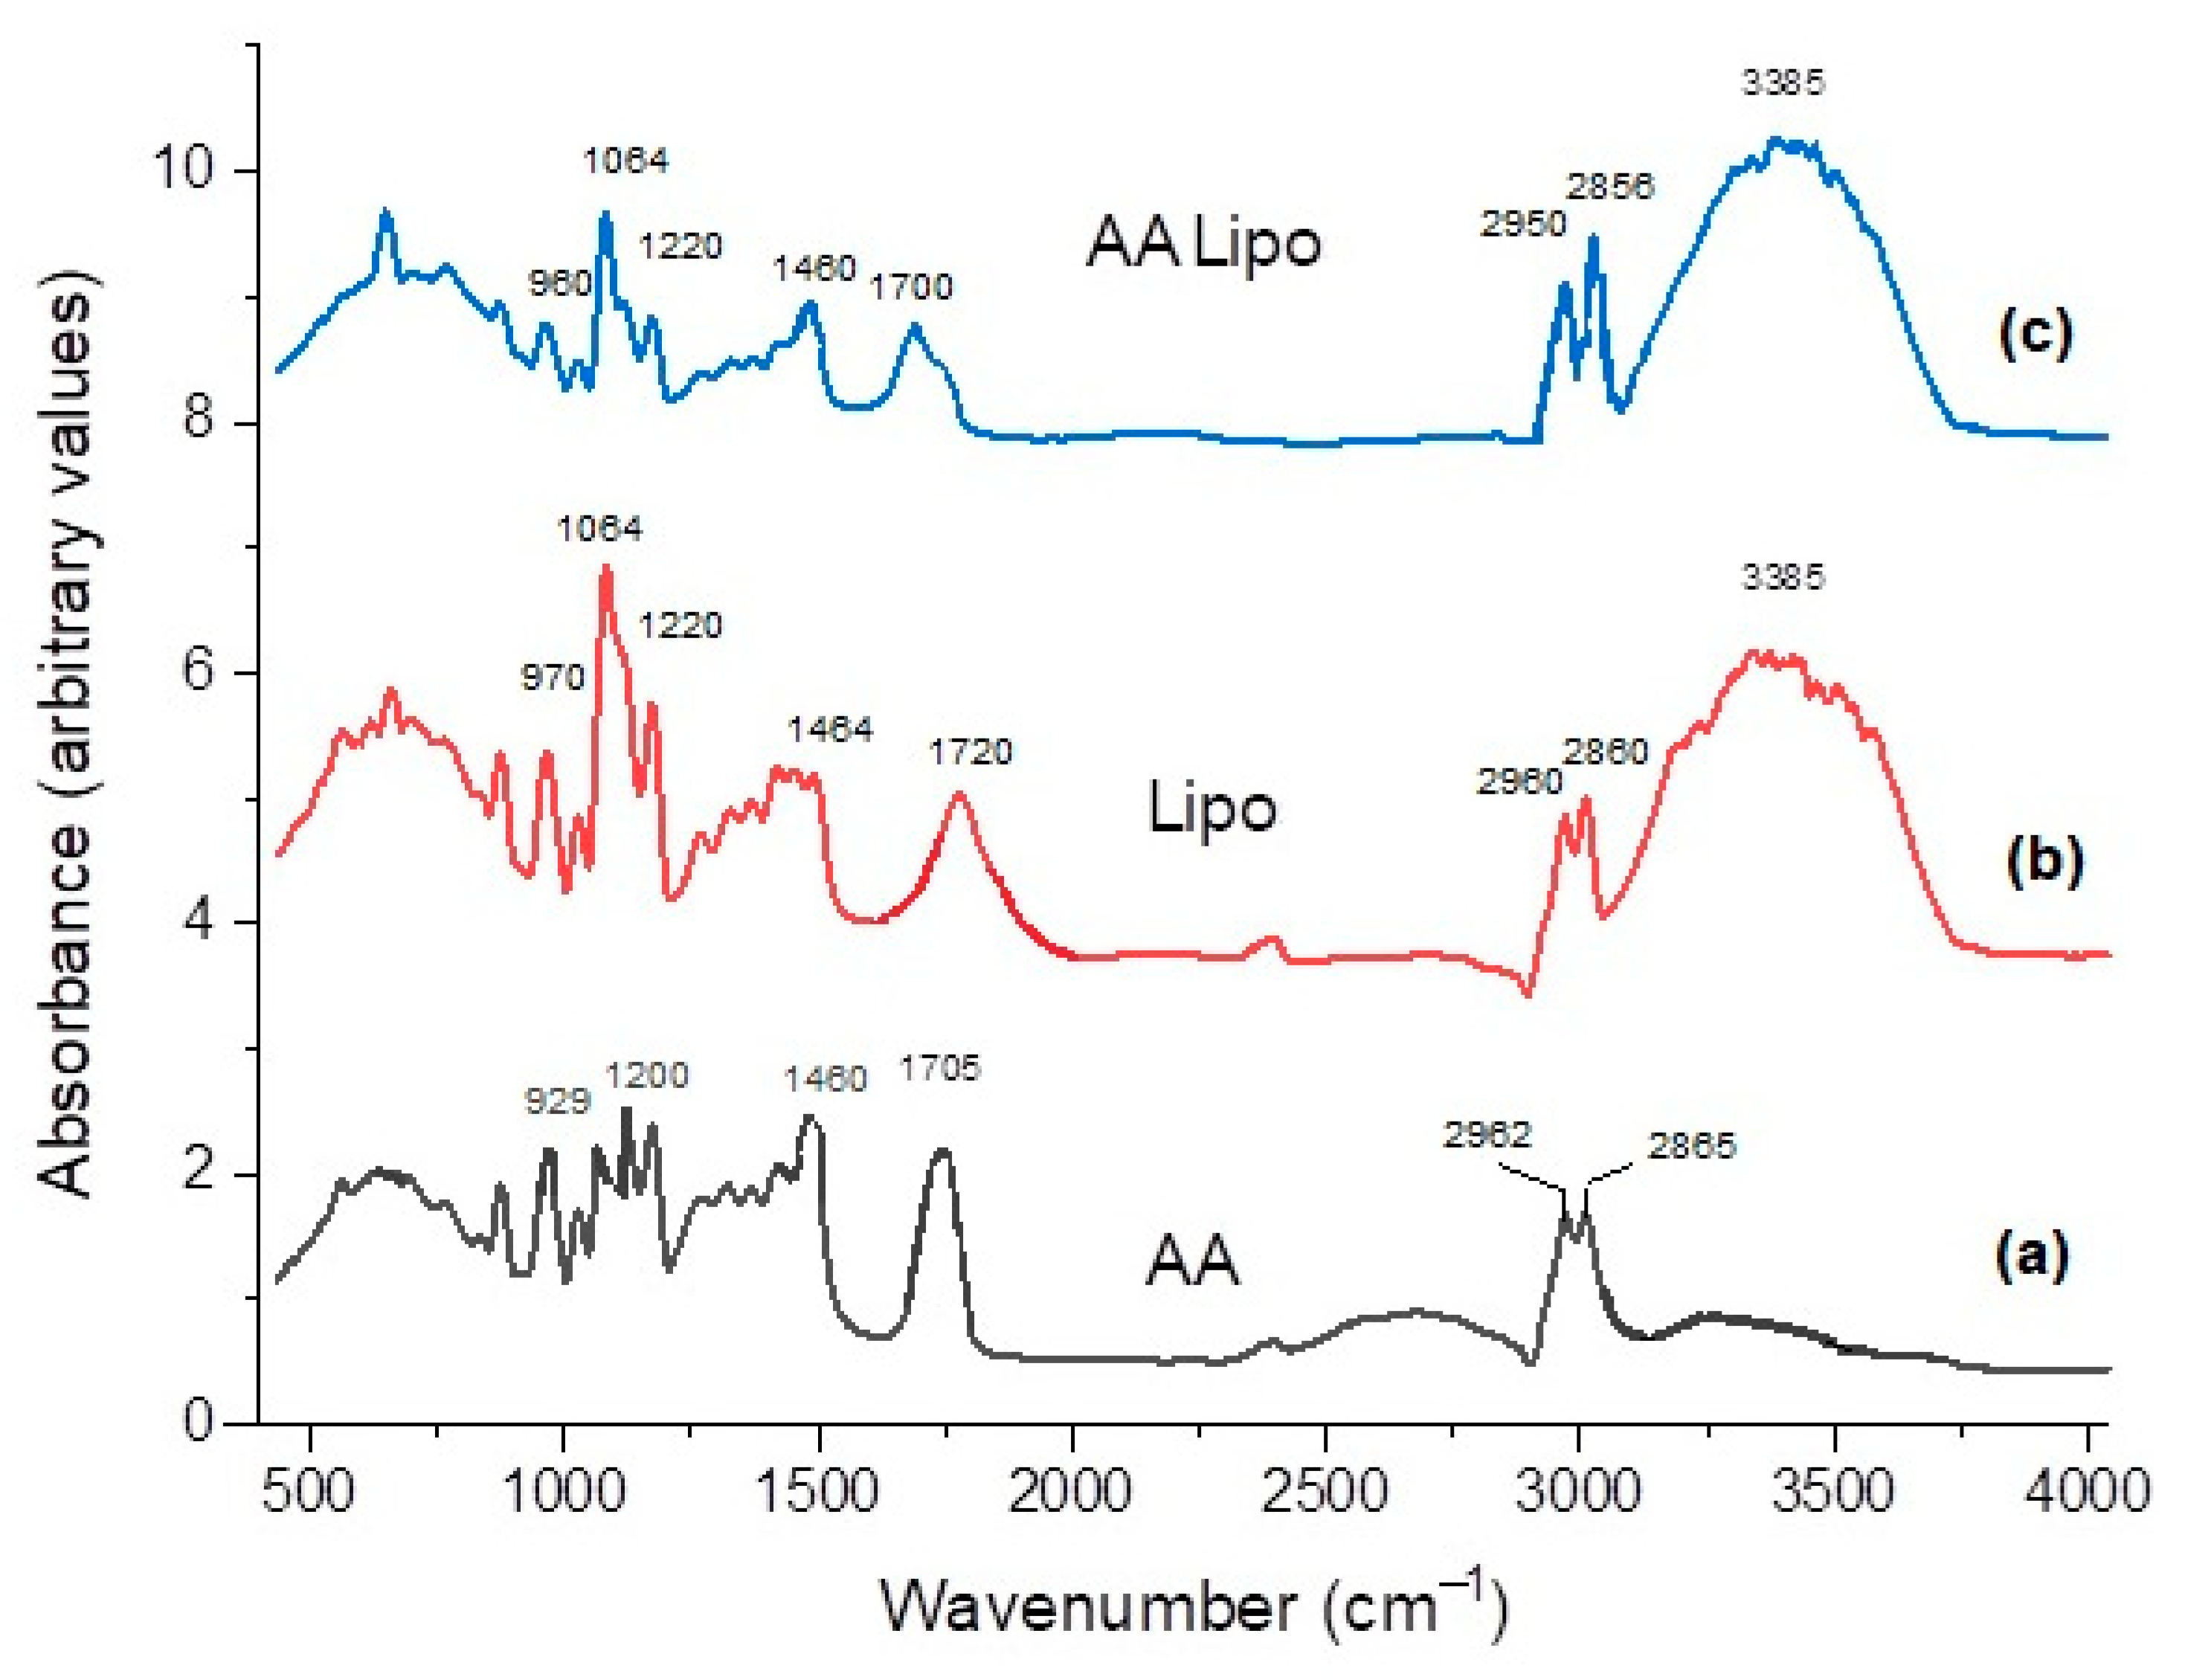
Figure 2 presents the FTIR spectra of liposomes loaded and unloaded with azelaic acid, along with the FTIR spectrum of powder azelaic acid (AA).
Azelaic acid possesses two carboxylate groups with the fingerprints at 724, 929, 1200, 1460, 1705 (very strong), and a pair at 2865/2962 cm−1, with similar FTIR peaks reported by other studies [6,35]. The fingerprints of phosphatidylcholine-based liposomes are visible as prominent bands of phosphate groups P-O-C asymmetric and symmetric stretching bands near 1200 and 1064 cm−1, and the (CH3)3N stretching band at about 970 cm−1, while the band at 1720 cm−1 corresponds to a strong C=O vibration due to the ester groups present in the phospholipid molecule. In the high wavenumber region, CH2 symmetric and asymmetric stretching vibrations are visible at 2860 and 2925 cm−1 [36,37]. The loaded liposomes preserve the characteristic features of AA and blank liposomes, but some peaks are shifted or broadened, such as the 1700 cm−1 and 1064 cm−1 ones, which also decreased in intensity. These findings demonstrate the successful encapsulation of azelaic acid in phosphatidylcholine-based liposomes.

3.2. Microscopic Characterization

As presented in Figure 3, it can be observed that the shape and appearance of the blank liposomes (Figure 3a) are not different from the AA-loaded liposomes (AALipo 15–25%) with different AA concentrations (Figure 3a–c). The spherical shape is characteristic of liposomes formulated by the lipid film hydration method [38].
The images also show the homogeneous dispersion in the field of the microscope, evidencing the stability of the formulation and successful inclusion of AA in the liposomes, the results being comparable to those reported by Gibis et al. [27].

3.3. DLS (Dynamic Light Scattering) and Zeta-Potential Measurements

According to the size distribution diagram (Figure S1), 77.39% of the blank liposomes presented a diameter below 500 nm, while AALipo15%, AALipo20%, and AALipo25% showed 85.39%, 85.73%, and 77.3% size distribution, respectively, below 500 nm, as tabulated in Table 1.
The electric surface charge of the liposomes with or without AA was also determined, and it was noticed that, regardless of the empty or loaded liposomes, the zeta potential value was negative, ranging between −16.6 mV and −20 mV, which denotes a good stability of the formulations.
The stability of liposomal emulsions is a very important feature because a lower stability is associated with a faster release (or even spontaneous release) of the incorporated molecules, and therefore a controlled and targeted release cannot be achieved [27].
Also, the instability of liposomal particles is followed by the phenomenon of aggregation and fusion of the particles, increasing their size, which leads to a shorter lifetime of liposomal transport systems [27,39]. The zeta potential or the electric surface charge of the liposomes is required to be highly negative so that the particles repel each other. According to literature [38], the electrical surface charge of the particles is also influenced by the hydrophilic phase used for the lipid film hydration; in this case, the hydration was carried out using a phosphate buffer (which provides the negative electrical charge).

3.4. Encapsulation Efficiency Determined by Electrochemical Assay

The graphic representation of the first-order derivative of the potentiometric titration curve (Figure 4) led to the determination of the equivalence volume of the 0.1 M NaOH solution required to neutralize the two -COOH groups from the azelaic acid structure. In this acid–base titration, the quantity of azelaic acid which was not incorporated into the liposomes was neutralized by the NaOH titrant, while recording the changes of the pH (potential). The encapsulation efficiency determined by this electrochemical method revealed a percentage of 80.42%, which indicates an efficient incorporation of azelaic acid into the liposomes.

3.5. Antimicrobial Activity against Gram (+) and Gram (−) Strains

Table 2 summarize the antimicrobial activity of pure AA and liposomal formulations with different concentrations of AA.
Based on the results, the first notable observation is expressed as the maximum antibacterial effect of the liposomal formulation AALipo 20% against S. aureus, the effect being even more intense compared to the antibiotic (Vancomycin) or compared to pure AA solutions. The second observation refers to the very good antimicrobial activity of both liposomal formulations and AA solutions (regardless of the concentration) against E. faecalis, while the antibiotic (Ampicillin) shows no effect. On the other hand, only modest results were obtained against the gram (−) strains (E. coli and P. aeruginosa), as neither the AA solutions nor the liposomal formulation presented a superior effect compared to antibiotics.
The antimicrobial assay results indicated that the optimum liposomal formulation is AALipo 20%.
Increasing the AA concentration in the liposomes from 20% to 25% does not have an increased antimicrobial effect. However, for all the tested germs, the liposomal formulations exhibited a better effect compared to the free AA solution, except for P. aeruginosa.
According to literature, the top ten bacteria present in sebaceous sites are Pseudomonas acnes, S. epidermidis, Corynebacterium tuberculostearicum, Staphylococcus capitis, Corynebacterium simulans, Staphylococcus mitis, Staphylococcus hominis, Corynebacterium aurimucosum, Corynebacterium kroppenstedtii, and Corynebacterium amycolatum [40]. Altering the skin microbiome with a topical antibiotic treatment can have significant effects on the cutaneous host defense, and some skin bacteria (such as Micrococcus luteus) have been found to enhance S. aureus pathogenesis [41,42]. In this context, it is important to know the relative effects of antimicrobial agents on human microbiota in order to understand their potential to foster resistance and alter the microbiome composition. The first observation that AA may exert a bacteriostatic effect on aerobic and anaerobic bacteria (including Propionibacterium) appeared in 1983 as a comment in a clinical report [43]. Three years later, a clinical trial noted a 224-fold reduction in the population of Micrococcaceae and 30-fold decrease in the density of Propionibacterium sp. on the skin following the application of a 20% azelaic acid cream (compared to no effect from tetracycline) [44].
Azelaic acid inhibits the synthesis of cellular protein in aerobic and anaerobic micro-organisms, such as P. acnes, and does not induce bacterial resistance [45]. In the microbiome of healthy skin, S. epidermidis may limit the overcolonization of P. acnes strains and reduce P. acnes-induced IL-6 and TNF-α production by keratinocytes.
On the other hand, P. acnes may limit the proliferation of S. aureus and S. pyogenes by promoting triglyceride hydrolysis and propionic acid secretion. As a result, an acidic pH is maintained in the pilosebaceous follicle. A change of the microbiome composition may lead to a disturbed skin barrier and inflammation.
Studying cutaneous samples, Hall et al. observed that when P. acnes was present, Pseudomonas species typically were not, and vice versa [46].
Interestingly, antibiotic treatment for acne that decreases P. acnes colonization on the skin may also result in Gram-negative folliculitis caused by Pseudomonas [46].
Megyeri et al. recently proposed that P. acnes strains may be implicated in antimicrobial defense pathways by triggering a local increase in the autophagic activity of keratinocytes [47]. However, it is generally accepted that advanced formulations of AA (hydrogel, micro- or nano-emulsions, etc.) possess enhanced pharmaceutical bio-availability compared to conventional cream based on AA [48].

3.6. Cell Viability and Cytotoxicity (MTS Assay) of Normal Human Dermal Fibroblast Culture under Different Treatments with Liposomal Formulations

The percentage of cell viability based on trypan blue exclusion upon different treatment with liposomal formulations is presented in Table 3.
The MTS assay was employed to evaluate the potential cytotoxicity of both empty liposomes (Lipo) and different liposomal formulations with AA, in comparison to the untreated “wound” (CTRL sample) using NHDF cells (Figure 5).
Our results showed that in the case of AA, there is a concentration-dependent decrease in cell viability. At the highest concentration tested (25%), a significant decrease of cell viability (p < 0.05) can be observed compared to the CTRL sample (Figure 5). Cell viability is significantly increased (p < 0.01) when the cells are treated with liposomes compared to the control sample. On the other hand, if azelaic acid is included in the liposomes, significant decreases in cell viability are observed compared to the Lipo sample, except for the AALipo20% sample. In contrast, the samples containing AA in the liposomes show no statistical significance in comparison to the CTRL, indicating that these formulas are not toxic to fibroblasts.
The obtained results are in concordance with recently reported data in literature, according to which AA in liposomal form or combined with different vegetable oils is non-toxic. According to Lacatusu et al. [49], the use of liposomes with a natural content based on phospholipids combined with AA led to obtaining a non-toxic preparation that allows the gradual release of the incorporated active principles, along with increasing in the viability and proliferation of the fibroblast-type cells [49].

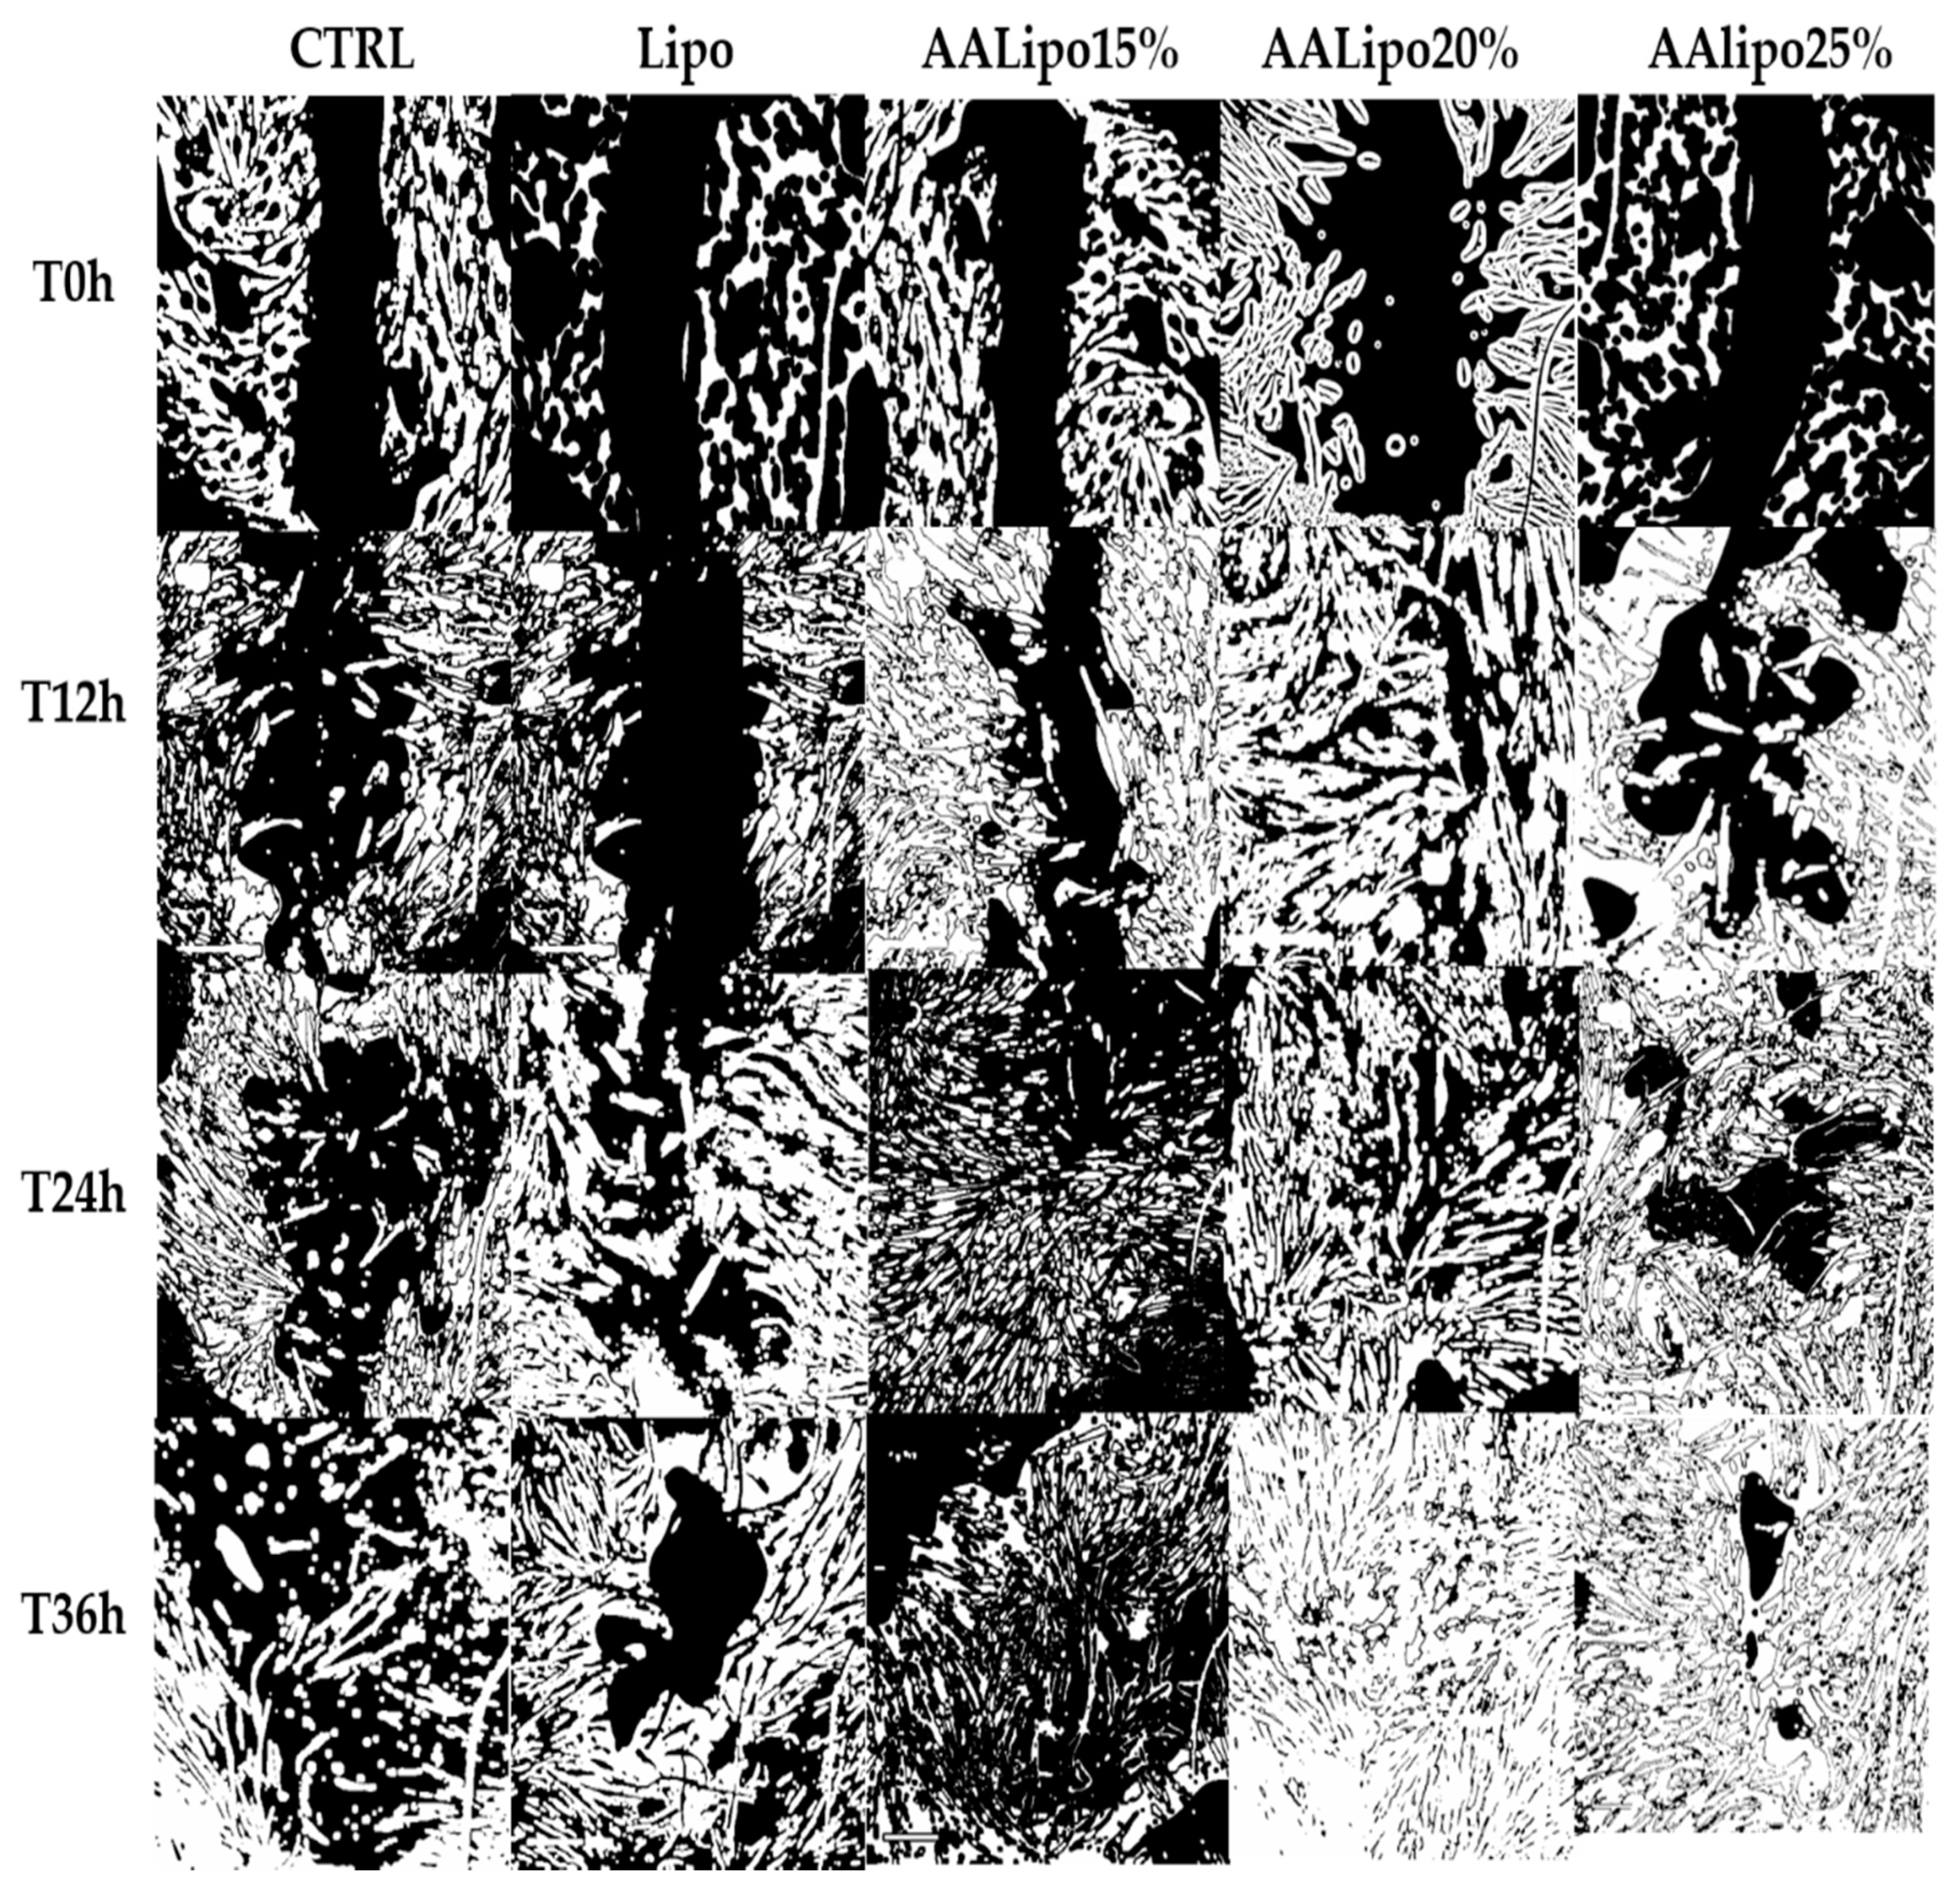
3.7. Assessing the Healing Effect of AALipo by “Scratch” Method

The collective migration of human dermal fibroblasts and the “wound closure” phenomenon under the effect of liposomal formulations with and without AA was monitored for 36 h, as shown in Figure 6. At the end of the interval, it can be noticed that there was a complete coverage of the gap created in the fibroblasts layer when AALipo20% was applied, while the control sample (no treatment) indicated a very poor healing effect. The quantitative results are presented comparatively in Figure 7, assessing the wound healing process in the presence of liposomal formulations compared to control, according to formula (2). The statistical interpretation revealed a significant difference between the samples even after the first 12 h. Increasing the concentration of AA in the liposomes from 20% to 25% does not have an increased effect in terms of fibroblast migration and gap coverage.
When comparing with similar works reported in literature, we noticed a study conducted in 2019 by Apriani et al. [19] using an ethosomal formulation to deliver azelaic acid. Ethosomes are deformable and elastic carriers and the authors highlighted that ethanol contained in vesicles is responsible for the temporary disorganization of the lipid structure of the stratum corneum, increasing the permeability of AA in the cytoplasm of P. acne. In this study, azelaic-acid-based ethosomes were made up of 35% (w/w) ethanol and included in a cream formulation, which showed better antibacterial activity when compared to commercial Zelface® cream.
Burchacka et al. [48] elaborated a method to prepare an azelaic acid liposomal gel formulation based on phospholipon 50 IP, methyl parahydroxybenzoate, prophyl parahydroxybenzoate, prophylene glycol, and 10%AA as organic phase. They found that the new formulation presented a high accumulation of an active substance in the stratum corneum in comparison to a reference formula represented by commercially available cream with 20% of azelaic acid. However, this study was limited only to physico-chemical and antibacterial characterization, with a focus on the trans-dermal permeation of azelaic acid and in vitro release, while the biocompatibility and cytotoxicity assays were completely missing.

3.8. Comet Assay

The comet assay is based on the separation from the double helix strand of DNA loops containing strand breaks and fragments that become free to migrate out of the nucleus towards the anode when alkaline electrophoresis is applied. Following the implementation of the comet assay, a variety of descriptors are evaluated, of which the most frequently and recommended for the evaluation and interpretation of the results is % DNA fragments in the head and tail. The neutral comet assay is a simple way to quantitatively evaluate DNA damage and visualize fragmented strands. Figure 8 shows the effect of the liposomal formulation on DNA damage in fibroblasts upon treatment with H2O2, while the quantitative analysis of the extent of the DNA damage, monitored as % DNA fragmentation in head and tail, is presented in Figure 9.
A quantitative analysis of the neutral comet assay showed a significant increase in the % DNA in the tail after a 75 µM H2O2 treatment compared to control (Figure 9), as reactive hydroxyl radicals produced from H2O2 by the Fenton reaction can bind to DNA at metal-binding sites and induce strand breaks associated with DNA damage, mutations, and genetic instability indicating DNA damage [50,51]. Our results indicate that liposomal formulations containing 20% azelaic acid exhibited a protective effect against H2O2-induced damage, highlighted by a significant decrease in the percent of DNA fragments in the tails.

4. Conclusions

Following the lipid film hydration method applied in this study, we can conclude that liposomes with azelaic acid of different concentrations (AALipo15%, AALipo20%, AALipo25%) were successfully formulated, highlighting the characteristic spherical shape and encapsulation efficiency between 77.3–85.73%, framed with a size of up to 500 nm and good stability, as demonstrated by FTIR spectroscopy, DLS, and zeta-potential measurements.
The antimicrobial activity of AA was tested in comparison with the corresponding liposomal formulation in the same concentrations, against Gram-positive and Gram-negative bacteria, demonstrating that the liposomal formulation confers a superior antibacterial effect regardless of concentration, compared to free AA.
The non-toxic effect of the new liposomal formulation was demonstrated by an MTS assay, while the in vitro wound healing effect was assessed by the “scratch assay” performed on human dermal fibroblasts. Moreover, by using a comet assay, the protective effect of the new liposomal formulation was demonstrated against H2O2- induced cellular DNA damage. After corroborating the results, we can state that the optimal liposomal formulation in terms of antimicrobial effect, wound, and protective effect is AALipo20%.
Along with their safety considerations, these findings represent a good premise in order to develop further topical formulations as a dermato-cosmetic product with superior therapeutic potential, designed for the advanced treatment of complex skin disorders.

Supplementary Materials

The following supporting information can be downloaded at: https://www.mdpi.com/article/10.3390/app122413039/s1, Figure S1: Particle size distribution diagram: (a) blank liposomes; (b) liposomes loaded with 15% AA; (c) liposomes loaded with 20% AA; (d) liposomes loaded with 25% AA.

Author Contributions

Conceptualization, P.M.P., S.C. and S.I.V.; methodology, F.M., L.F., F.B., V.L., D.C.Z. and A.A.; software, L.F. and F.B.; investigation, F.M., D.C.Z. and A.A.; writing—original draft preparation, S.C., L.F., F.M. and P.M.P.; writing—review and editing, S.C. and S.I.V.; supervision, S.C.; project administration, S.C. and P.M.P.; funding acquisition, S.C. and F.M.. All authors have read and agreed to the published version of the manuscript.

Funding

This research received no external funding.

Institutional Review Board Statement

Not applicable.

Informed Consent Statement

Not applicable.

Data Availability Statement

Not applicable.

Acknowledgments

The research was supported by the University of Oradea, within the Grants Competition “Scientific Research of Excellence Related to Priority Areas with Capitalization through Technology Transfer INO-TRANSFER-UO”, Project No. 246/08.11.2022.

Conflicts of Interest

The authors declare no conflict of interest.

References

  1. Gollnick, H. A New Therapeutic Agent: Azelaic Acid in Acne Treatment. J. Dermatol. Treat. 1990, 1, S23–S28. [Google Scholar] [CrossRef]
  2. Pérez-Bernal, A.; Muñoz-Pérez, M.A.; Camacho, F. Management of Facial Hyperpigmentation. Am. J. Clin. Dermatol. 2000, 1, 261–268. [Google Scholar] [CrossRef] [PubMed]
  3. Vashi, N.A.; Kundu, R.V. Facial Hyperpigmentation: Causes and Treatment. Br. J. Dermatol. 2013, 169 (Suppl. S3), 41–56. [Google Scholar] [CrossRef] [PubMed]
  4. Rendon, M.; Berneburg, M.; Arellano, I.; Picardo, M. Treatment of Melasma. J. Am. Acad. Dermatol. 2006, 54, S272–S281. [Google Scholar] [CrossRef] [PubMed]
  5. Holland, K.; Bojar, R. Antimicrobial Effects of Azelaic Acid. J. Dermatol. Treat. 1993, 4, S8–S11. [Google Scholar] [CrossRef]
  6. Kumar, A.; Rao, R.; Yadav, P. Azelaic Acid: A Promising Agent for Dermatological Applications. Curr. Drug Ther. 2020, 15, 181–193. [Google Scholar]
  7. Sieber, M.A.; Hegel, J.K.E. Azelaic Acid: Properties and Mode of Action. Ski. Pharmacol. Physiol. 2014, 27 (Suppl. S1), 9–17. [Google Scholar] [CrossRef]
  8. Williams, H.C.; Dellavalle, R.P.; Garner, S. Acne Vulgaris. Lancet 2012, 379, 361–372. [Google Scholar] [CrossRef]
  9. Dréno, B. What Is New in the Pathophysiology of Acne, an Overview. J. Eur. Acad. Dermatol. Venereol. 2017, 31 (Suppl. S5), 8–12. [Google Scholar] [CrossRef] [Green Version]
  10. Otlewska, A.; Baran, W.; Batycka-Baran, A. Adverse Events Related to Topical Drug Treatments for Acne Vulgaris. Expert Opin. Drug Saf. 2020, 19, 513–521. [Google Scholar] [CrossRef]
  11. Thiboutot, D.M.; Weiss, J.; Bucko, A.; Eichenfield, L.; Jones, T.; Clark, S.; Liu, Y.; Graeber, M.; Kang, S. Adapalene-BPO Study Group Adapalene-Benzoyl Peroxide, a Fixed-Dose Combination for the Treatment of Acne Vulgaris: Results of a Multicenter, Randomized Double-Blind, Controlled Study. J. Am. Acad. Dermatol. 2007, 57, 791–799. [Google Scholar] [CrossRef] [PubMed]
  12. Rosen, T. Antibiotic Resistance: An Editorial Review with Recommendations. J. Drugs Dermatol. 2011, 10, 724–733. [Google Scholar]
  13. Thompson, K.G.; Rainer, B.M.; Antonescu, C.; Florea, L.; Mongodin, E.F.; Kang, S.; Chien, A.L. Minocycline and Its Impact on Microbial Dysbiosis in the Skin and Gastrointestinal Tract of Acne Patients. Ann. Dermatol. 2020, 32, 21–30. [Google Scholar] [CrossRef] [PubMed]
  14. Tomić, I.; Juretić, M.; Jug, M.; Pepić, I.; Cetina Čižmek, B.; Filipović-Grčić, J. Preparation of in Situ Hydrogels Loaded with Azelaic Acid Nanocrystals and Their Dermal Application Performance Study. Int. J. Pharm. 2019, 563, 249–258. [Google Scholar] [CrossRef] [PubMed]
  15. Kosmadaki, M.; Katsambas, A. Topical Treatments for Acne. Clin. Dermatol. 2017, 35, 173–178. [Google Scholar] [CrossRef]
  16. Patel, R.; Prabhu, P. Nanocarriers as Versatile Delivery Systems for Effective Management of Acne. Int. J. Pharm. 2020, 579, 119140. [Google Scholar] [CrossRef]
  17. Mancuso, A.; Cristiano, M.C.; Fresta, M.; Paolino, D. The Challenge of Nanovesicles for Selective Topical Delivery for Acne Treatment: Enhancing Absorption Whilst Avoiding Toxicity. Int. J. Nanomed. 2020, 15, 9197–9210. [Google Scholar] [CrossRef]
  18. Reis, C.P.; Gomes, A.; Rijo, P.; Candeias, S.; Pinto, P.; Baptista, M.; Martinho, N.; Ascensão, L. Development and Evaluation of a Novel Topical Treatment for Acne with Azelaic Acid-Loaded Nanoparticles. Microsc. Microanal. 2013, 19, 1141–1150. [Google Scholar] [CrossRef]
  19. Apriani, E.F.; Rosana, Y.; Iskandarsyah, I. Formulation, Characterization, and in Vitro Testing of Azelaic Acid Ethosome-Based Cream against Propionibacterium Acnes for the Treatment of Acne. J. Adv. Pharm. Technol. Res. 2019, 10, 75–80. [Google Scholar] [CrossRef]
  20. Kumar, A.; Rao, R. Enhancing Efficacy and Safety of Azelaic Acid via Encapsulation in Cyclodextrin Nanosponges: Development, Characterization and Evaluation. Polym. Bull. 2021, 78, 1–28. [Google Scholar] [CrossRef]
  21. Cavalu, S.; Simon, V.; Goller, G.; Akin, I. Bioactivity and antimicrobial properties of PMMAAg2O acrylic bone cement collagen coated. Dig. J. Nanomater. Biostructures 2011, 6, 779–790. [Google Scholar]
  22. Briuglia, M.-L.; Rotella, C.; McFarlane, A.; Lamprou, D.A. Influence of Cholesterol on Liposome Stability and on in Vitro Drug Release. Drug Deliv. Transl. Res. 2015, 5, 231–242. [Google Scholar] [CrossRef] [PubMed] [Green Version]
  23. Mohammadabadi, M.R.; Mozafari, M.R. Enhanced Efficacy and Bioavailability of Thymoquinone Using Nanoliposomal Dosage Form. J. Drug Deliv. Sci. Technol. 2018, 47, 445–453. [Google Scholar] [CrossRef]
  24. Miere (Groza), F.; Vicas, S.I.; Timar, A.V.; Ganea, M.; Zdrinca, M.; Cavalu, S.; Fritea, L.; Vicas, L.; Muresan, M.; Pallag, A.; et al. Preparation and Characterization of Two Different Liposomal Formulations with Bioactive Natural Extract for Multiple Applications. Processes 2021, 9, 432. [Google Scholar] [CrossRef]
  25. Luminita, F.; Cavalu, S.; Miere, F.; Vicaş, S. Formulation, Characterization, and Advantages of Using Liposomes in Multiple Therapies. Pharmacophore 2020, 11, 1–12. [Google Scholar]
  26. Miere, F.; Teuşdea, A.; Vasile, L.; Cavalu, S.; Luminita, F.; Dobjanschi, L.; Zdrânca, M.; Zdrânca, M.; Ganea, M.; Priscilla, P.; et al. Evaluation of In Vitro Wound-Healing Potential, Antioxidant Capacity, and Antimicrobial Activity of Stellaria Media (L.) Vill. Appl. Sci. 2021, 11, 11526. [Google Scholar] [CrossRef]
  27. Gopi, S.; Balakrishnan, P. Evaluation and Clinical Comparison Studies on Liposomal and Non-Liposomal Ascorbic Acid (Vitamin C) and Their Enhanced Bioavailability. J. Liposome Res. 2021, 31, 356–364. [Google Scholar] [CrossRef]
  28. Gibis, M.; Ruedt, C.; Weiss, J. In Vitro Release of Grape-Seed Polyphenols Encapsulated from Uncoated and Chitosan-Coated Liposomes. Food Res. Int. 2016, 88, 105–113. [Google Scholar] [CrossRef]
  29. Tucaliuc, D.; Alexa, O.; Tuchiluş, C.G.; Ursu, R.G.; Tucaliuc, E.S.; Iancu, L.S. Analysis of Antibiotic Resistance Pattern of S. Aureus Strains Isolated from the Orthopedics-Traumatology Section of “Sf. Spiridon” Clinical Emergency Hospital, Iaşi. Rev. Med. Chir. Soc. Med. Nat. Iasi 2014, 118, 780–787. [Google Scholar]
  30. Mintas, I.; Antonescu, A.; Miere, F.; Luminita, F.; Teuşdea, A.; Vicas, L.; Vicaş, S.; Ilarie, B.; Domuța, M.; Zdrîncă, M.; et al. Evaluation of Wound Healing Potential of Novel Hydrogel Based on Ocimum Basilicum and Trifolium Pratense Extracts. Processes 2021, 9, 2096. [Google Scholar] [CrossRef]
  31. Malich, G.; Markovic, B.; Winder, C. The Sensitivity and Specificity of the MTS Tetrazolium Assay for Detecting the in Vitro Cytotoxicity of 20 Chemicals Using Human Cell Lines. Toxicology 1997, 124, 179–192. [Google Scholar] [CrossRef] [PubMed]
  32. Kabakov, A.E.; Kudryavtsev, V.A.; Gabai, V.L. Determination of Cell Survival or Death. Methods Mol. Biol. 2011, 787, 231–244. [Google Scholar] [CrossRef] [PubMed]
  33. Sharma, P.; Lam, V.K.; Raub, C.B.; Chung, B.M. Tracking Single Cells Motility on Different Substrates. Methods Protoc. 2020, 3, E56. [Google Scholar] [CrossRef] [PubMed]
  34. Purcarea, C.; Laslo, V.; Memete, A.R.; Agud, E.; Miere (Groza), F.; Vicas, S.I. Antigenotoxic and Antimutagenic Potentials of Proline in Allium Cepa Exposed to the Toxicity of Cadmium. Agriculture 2022, 12, 1568. [Google Scholar] [CrossRef]
  35. Hsieh, P.-W.; Al-Suwayeh, S.A.; Fang, C.-L.; Lin, C.-F.; Chen, C.-C.; Fang, J.-Y. The Co-Drug of Conjugated Hydroquinone and Azelaic Acid to Enhance Topical Skin Targeting and Decrease Penetration through the Skin. Eur. J. Pharm. Biopharm. 2012, 81, 369–378. [Google Scholar] [CrossRef]
  36. Whittinghill, J.; Proctor, A. Determination of Phospholipids in Vegetable Oil by Fourier Transform Infrared Spectroscopy. J. Am. Oil Chem. Soc. 1998, 75, 1281–1289. [Google Scholar] [CrossRef]
  37. Pan, L.; Zhang, S.; Gu, K.; Zhang, N. Preparation of Astaxanthin-Loaded Liposomes: Characterization, Storage Stability and Antioxidant Activity. CyTA-J. Food 2018, 16, 607–618. [Google Scholar] [CrossRef] [Green Version]
  38. Wu, B.-Q.; He, Y.-J.; Yin, Z.-N.; Zhang, Z.-R.; Deng, L. Preparation and Characterization of Clopidogrel Bisulfate Liposomes. Sichuan Da Xue Xue Bao Yi Xue Ban 2021, 52, 630–636. [Google Scholar] [CrossRef]
  39. Yu, J.Y.; Chuesiang, P.; Shin, G.H.; Park, H.J. Post-Processing Techniques for the Improvement of Liposome Stability. Pharmaceutics 2021, 13, 1023. [Google Scholar] [CrossRef]
  40. Byrd, A.L.; Belkaid, Y.; Segre, J.A. The Human Skin Microbiome. Nat. Rev. Microbiol. 2018, 16, 143–155. [Google Scholar] [CrossRef]
  41. SanMiguel, A.J.; Meisel, J.S.; Horwinski, J.; Zheng, Q.; Grice, E.A. Topical Antimicrobial Treatments Can Elicit Shifts to Resident Skin Bacterial Communities and Reduce Colonization by Staphylococcus Aureus Competitors. Antimicrob. Agents Chemother. 2017, 61, e00774-17. [Google Scholar] [CrossRef] [PubMed] [Green Version]
  42. Boldock, E.; Surewaard, B.G.J.; Shamarina, D.; Na, M.; Fei, Y.; Ali, A.; Williams, A.; Pollitt, E.J.G.; Szkuta, P.; Morris, P.; et al. Human Skin Commensals Augment Staphylococcus Aureus Pathogenesis. Nat. Microbiol. 2018, 3, 881–890. [Google Scholar] [CrossRef] [PubMed] [Green Version]
  43. Nazzaro-Porro, M.; Passi, S.; Picardo, M.; Breathnach, A.; Clayton, R.; Zina, G. Beneficial Effect of 15% Azelaic Acid Cream on Acne Vulgaris. Br. J. Dermatol. 1983, 109, 45–48. [Google Scholar] [CrossRef] [PubMed]
  44. Bladon, P.T.; Burke, B.M.; Cunliffe, W.J.; Forster, R.A.; Holland, K.T.; King, K. Topical Azelaic Acid and the Treatment of Acne: A Clinical and Laboratory Comparison with Oral Tetracycline. Br. J. Dermatol. 1986, 114, 493–499. [Google Scholar] [CrossRef]
  45. Gollnick, H.P.; Bettoli, V.; Lambert, J.; Araviiskaia, E.; Binic, I.; Dessinioti, C.; Galadari, I.; Ganceviciene, R.; Ilter, N.; Kaegi, M.; et al. A Consensus-Based Practical and Daily Guide for the Treatment of Acne Patients. J. Eur. Acad. Dermatol. Venereol. 2016, 30, 1480–1490. [Google Scholar] [CrossRef]
  46. Hall, J.B.; Cong, Z.; Imamura-Kawasawa, Y.; Kidd, B.A.; Dudley, J.T.; Thiboutot, D.M.; Nelson, A.M. Isolation and Identification of the Follicular Microbiome: Implications for Acne Research. J. Invest. Dermatol. 2018, 138, 2033–2040. [Google Scholar] [CrossRef] [Green Version]
  47. Megyeri, K.; Orosz, L.; Bolla, S.; Erdei, L.; Rázga, Z.; Seprényi, G.; Urbán, E.; Szabó, K.; Kemény, L. Propionibacterium Acnes Induces Autophagy in Keratinocytes: Involvement of Multiple Mechanisms. J. Invest. Dermatol. 2018, 138, 750–759. [Google Scholar] [CrossRef] [Green Version]
  48. Burchacka, E.; Potaczek, P.; Paduszyński, P.; Karłowicz-Bodalska, K.; Han, T.; Han, S. New Effective Azelaic Acid Liposomal Gel Formulation of Enhanced Pharmaceutical Bioavailability. Biomed. Pharm. 2016, 83, 771–775. [Google Scholar] [CrossRef]
  49. Lacatusu, I.; Istrati, D.; Bordei, N.; Popescu, M.; Seciu, A.M.; Panteli, L.M.; Badea, N. Synergism of Plant Extract and Vegetable Oils-Based Lipid Nanocarriers: Emerging Trends in Development of Advanced Cosmetic Prototype Products. Mater. Sci. Eng. C Mater. Biol. Appl. 2020, 108, 110412. [Google Scholar] [CrossRef]
  50. Hajiaghaalipour, F.; Kanthimathi, M.S.; Sanusi, J.; Rajarajeswaran, J. White Tea (Camellia Sinensis) Inhibits Proliferation of the Colon Cancer Cell Line, HT-29, Activates Caspases and Protects DNA of Normal Cells against Oxidative Damage. Food Chem. 2014, 169, 401–410. [Google Scholar] [CrossRef] [Green Version]
  51. Cavalu, S.; Damian, G.; Dansoreanu, M. EPR study of non-covalent spin labeled serum albumin and hemoglobin. Biophys. Chem. 2002, 99, 181–188. [Google Scholar] [CrossRef] [PubMed]
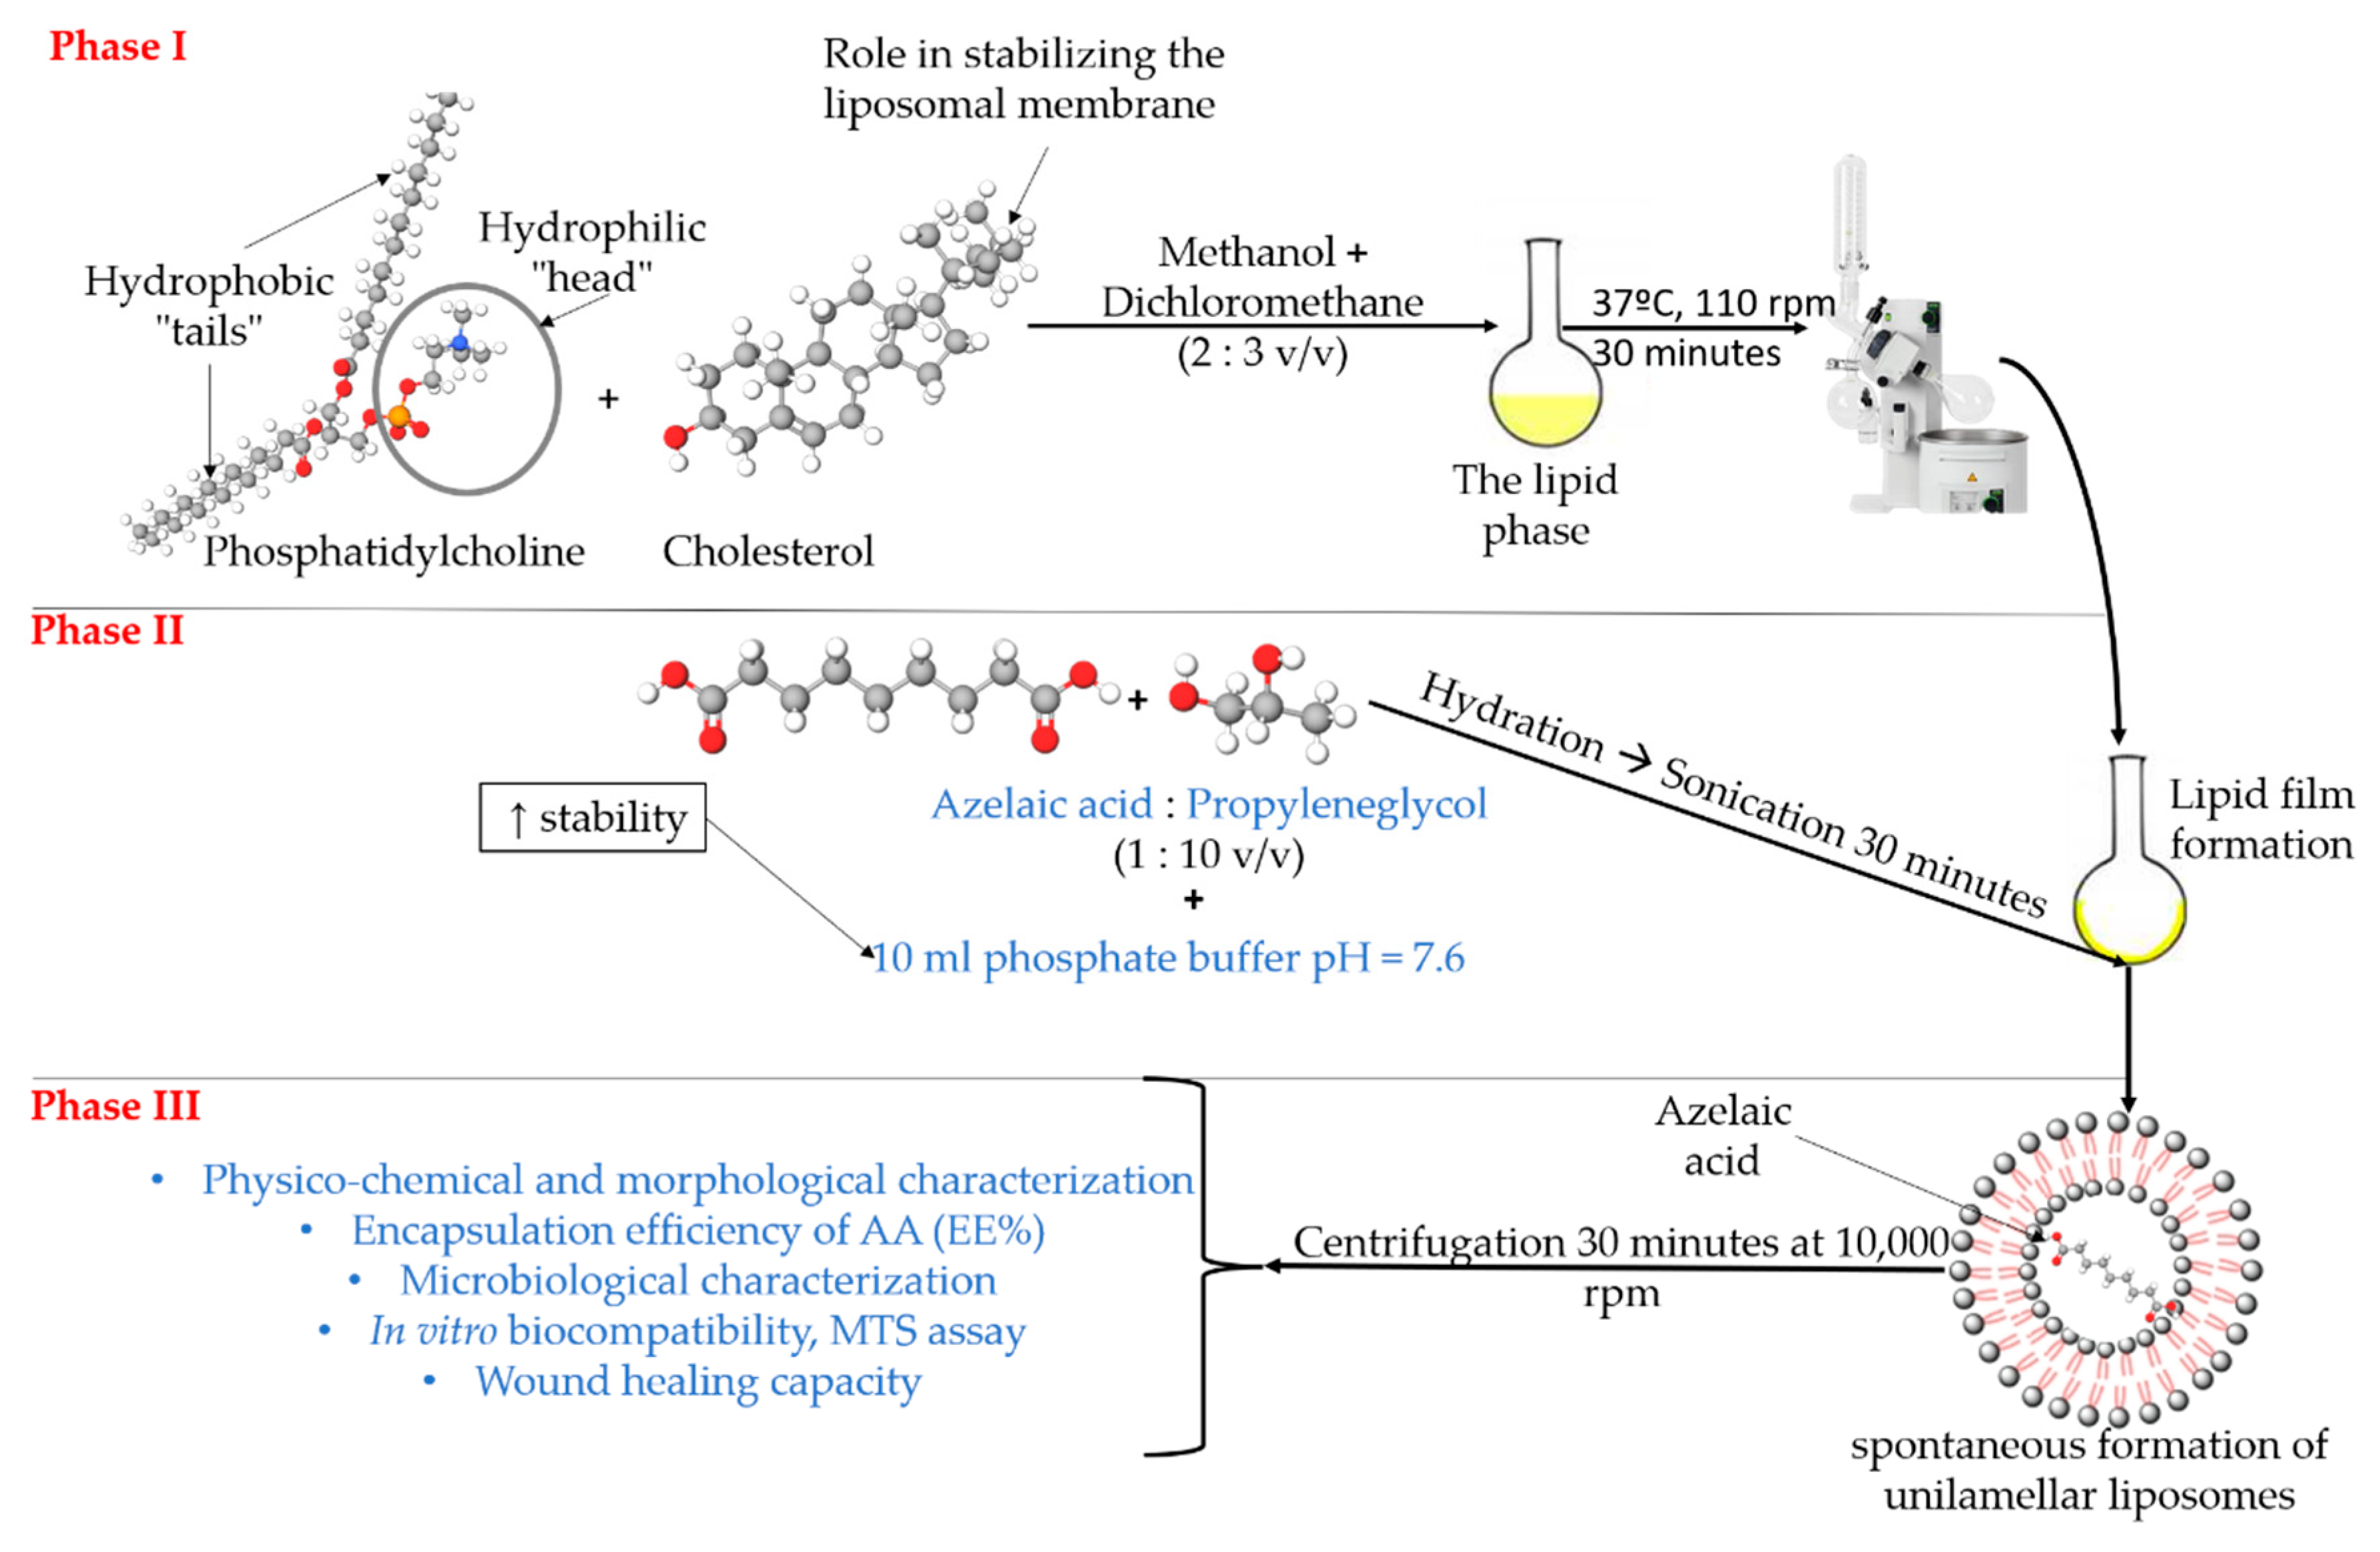
Figure 1. Preparation of phosphatidylcholine liposomes, loaded with azelaic acid.
Applsci 12 13039 g001
Figure 2. FTIR spectra of powder azelaic acid (a), blank liposomes (b), and azelaic-acid-loaded liposomes (c).
Applsci 12 13039 g002
Figure 3. Inverted light microscopy in phase-contrast mode of: (a) blank liposomes; (b) loaded liposomes with 15% AA; (c) loaded liposomes with 20% AA; (d) loaded liposomes with 25% AA. White arrows indicate homogeneous dispersion of spherical, stable liposomes with and without AA included.
Applsci 12 13039 g003
Figure 4. Potentiometric titration with NaOH of azelaic acid and the corresponding first derivative.
Applsci 12 13039 g004
Figure 5. Cytotoxicity assay of different concentration of azelaic acid and liposomes loaded with azelaic acid (AALipo15%, AALipo20%, AALipo25%) compared to the untreated sample (CTRL) and the positive control (Lipo) with respect to human dermal fibroblasts. All values were expressed as mean ± SD. Samples (Lipo, AA15%, AA20%, and AA25%) were compared with CTRL (# p < 0.01, ## p < 0.05), and liposomes loaded with different doses of azelaic acid were compared with Lipo sample (* p < 0.01, ** p < 0.05).
Applsci 12 13039 g005
Figure 6. Evolution of wound healing by “scratch” method and fibroblast migration until complete coverage of the gap, influenced by different treatments: CTRL—no treatment; Lipo—blank liposomes; AALipo15%, AALipo20% and AALipo25%—liposomes loaded with AA in concentrations 15%, 20%, and 25% respectively.
Applsci 12 13039 g006
Figure 7. Quantitative measurements of “wound closure” at different time points (12, 24, and 36 h) with respect to each liposomal treatment. +++ (p < 0.001); ++++ (p < 0.0001)—significant difference compare to control at 12 h, ** (p < 0.01); **** (p < 0.0001)—significant difference compared to control at 24 h; #### (p < 0.0001)—significant difference compare to control at 36 h; ns—no significant difference.
Applsci 12 13039 g007
Figure 8. Comet assay applied for three different treatments: (a) control fibroblasts (no treatment); (b) fibroblasts treated with H2O2 for 10 min; (c) fibroblasts exposure to H2O2 for 10 min, and then treated with AALipo20% for 60 min.
Applsci 12 13039 g008
Figure 9. The percentage of DNA in head and tail in control sample (CTRL, cells without treatment), in CTRL + (cells treated with 75 µM H2O2), and H2O2 + AALipo20%. Results are expressed as mean ± SD and significant differences shown when compared with % DNA in the head (*** p < 0.0001) and tail (### p < 0.0001) of the control, CTRL.
Applsci 12 13039 g009
Table 1. DLS results (size distribution and zeta potential) and EE% of AA in liposomal formulas (AALipo15%, AALipo20%, AALipo25%).
FormulationSize Percentage Up to 500 nmZeta Potential (mV)EE%
AA
Lipo77.39%−16.60 a
AALipo15%85.39%−17.0277.3
AALipo20%85.73%−19.8585.73
AALipo25%77.3%−20.0079.25
Table 2. Antimicrobial activity of AA and AALipo formulations against gram (+) (Staphylococcus aureus and Enterococcus faecalis) and gram (−) strains (Escherichia coli and Pseudomonas aeruginosa) expressed as diameter of inhibition zone.
BacteriaS. aureusE. fecalisE. coliP. aeruginosa
Samples Inhibition Zone ± SD (mm)
AA15%20 ± 0.1220 ± 0.1113 ± 0.119 ± 0.30
AA20%23 ± 0.1521 ± 0.1515 ± 0.1510 ± 0.12
AA25%22 ± 0.2020 ± 0.1120 ± 0.1211 ± 0.30
AALipo15%22 ± 0.1422 ± 0.1018 ± 0.209 ± 0.11
AALipo20%26 ± 0.2024 ± 0.1319 ± 0.1410 ± 0.20
AALipo25%20 ± 0.3020 ± 0.2016 ± 0.1211 ± 0.12
Van 30 µg18 ± 0.40---
Amp 2 µg-0--
Ctx 30 µg--33 ± 0.40-
Ctz 30 µg---24 ± 0.30
Legend: AA15%—Azelaic acid solution 15%, AA20%—Azelaic acid solution 20%, AA25%—Azelaic acid solution 25%, AALipo15%—liposomes loaded with AA in a concentration of 15%, AALipo20%—liposomes loaded with AA in a concentration of 20%, AALipo25%—liposomes loaded with AA in a concentration of 25%, Van—Vancomycin, Amp—Ampicillin, Ctx—Ceftriaxone, Ctz—Ceftazidime.
Table 3. Effect of different liposomal formulations on cell viability.
Samples% Cell Viability
CTRL93.25 ± 5.21
Lipo94.15 ± 3.50
AALipo15%93.35 ± 4.90
AALipo20%94.11 ± 8.11
AALipo25%94.48 ± 5.24
Lipo—blank liposomes; AALipo15%, 20%, 25%—liposomes loaded with AA in concentration of 15%, 20% and 25% respectively; CTRL—no treatment.
Publisher’s Note: MDPI stays neutral with regard to jurisdictional claims in published maps and institutional affiliations.