Article

The Influence of Interlock Loss between Rebar and Concrete on Bond Performance of RC Member

1
Department of Civil and Environmental Engineering, Tokyo Institute of Technology, 2-12-1 Ookayama, Meguro-ku, Tokyo 152-8552, Japan
2
Maeda Corporation, Toride 302-0021, Japan
3
Nikken Sekkei Civil Engineering Ltd., Tokyo 112-0004, Japan
*
Author to whom correspondence should be addressed.
Appl. Sci. 2022, 12(3), 1079; https://doi.org/10.3390/app12031079
Submission received: 16 December 2021 / Revised: 14 January 2022 / Accepted: 17 January 2022 / Published: 20 January 2022
(This article belongs to the Section Civil Engineering)

Abstract

:
Rebar corrosion, which causes section loss of rebar, is one of the serious deterioration factors for RC structures. Section loss affects not only stiffness or load capacity but also interlock condition between lugs on deformed rebar and surrounding concrete. Interlock is a dominant factor of bond between rebar and concrete and interlock effects on structural behavior of RC member can be significant. This research focused on the influence of interlock loss on the structural behavior and bond performance of RC member from experimental and analytical investigations. The static loading test for the six beams and FE analysis were conducted for the investigation on the effects of residual interlock, with or without confinement effects from stirrups. In order to evaluate interlock effects precisely, a rebar shape including lugs was reproduced by fine hexahedron elements in the FE analysis. The authors also conducted FE analytical case studies for investigating the effects of non-uniform lug loss or partially interlocking condition due to section loss of rebar. Through these investigations, it was seen that interlock could work and keep sound bond as long as contact between a lug and concrete was maintained even when the rebar lug was flattened due to section loss. Furthermore, under the situation with non-uniform distribution of section loss, pull-out behavior of rebar was prevented by interlocking of parts in a member even when other regions completely lost their interlock due to serious section loss.

1. Introduction

Rebar corrosion is one of the typical causes of deterioration in reinforced concrete structures. It is caused by various factors such as chloride attack and carbonation and can lead to serious degradation of structural performance such as load-bearing capacity or ductility [1,2,3,4]. Therefore, it is necessary to develop a method to evaluate current and future structural performance of reinforce concrete structures with rebar corrosion for infrastructure management. Rebar corrosion causes rebar shape changes, and corrosion products generate expansion stress and cause cracks around rebars. When the corrosion cracks reach concrete surface, deterioration factors can easily ingress and corrosion is accelerated. Finally, rebar corrosion leads to spalling of cover concrete [5,6]. During this process, bond between the rebar and the concrete deteriorates, and it affects load-bearing mechanisms.
It is known that bond deterioration impairs the stress transfer between rebar and concrete, causing a decrease in flexural capacity, stiffness, and crack dispersibility [7,8,9,10]. On the other hand, as long as anchorage of the main rebar is kept sound, bond deterioration can improve shear capacity by the formation of a tied arch mechanism [11,12].
Bond consists of three main components: mechanical interlock, chemical adhesion, and friction resistance. Among these, mechanical interlock, which is caused by the bearing pressure between lug and concrete, is highly effective [13,14]. In order to obtain strong mechanical interlock, deformed bars with lugs are generally used. Many researchers have investigated the effects of bond deterioration due to rebar corrosion [15,16,17,18,19]. These investigations primarily focused on the pull-out behavior of rebar or the response as a RC member with corrosion. However, these discussions cannot evaluate the change in the contribution of the bond constituting components mentioned above and corrosion cracks. A bond deterioration mechanism is complex; interlock condition changes due to section loss, chemical bond and friction resistance are lost, and the cracks around rebar reduce the bearing strength of concrete [7,20,21].
For an accurate understanding of the phenomenon, it is necessary to separate out multiple factors of bond deterioration. Thus, the authors focused on the interlock, which is a dominant factor in bond components, without corrosion cracks in this research. The aim of this study is to evaluate the influence of changing the interlock condition on the load-bearing mechanism and bond performance of RC beams through the experiment and finite element (FE) analysis. After conducting loading tests on the beams with different interlock conditions, they are analyzed by the FE model that reproduces the shape of rebar using solid elements precisely. This FE model applied very fine mesh, in which mortal and coarse aggregate was modeled individually. These models were verified by reproduction analysis of beam tests and pull-out tests of rebar from concrete. Then, the analytical case studies simulating non-uniform or partial shape change in cross sections and in axial direction were conducted.

2. Outline of the Loading Experiment for Beams with Different Interlock Conditions
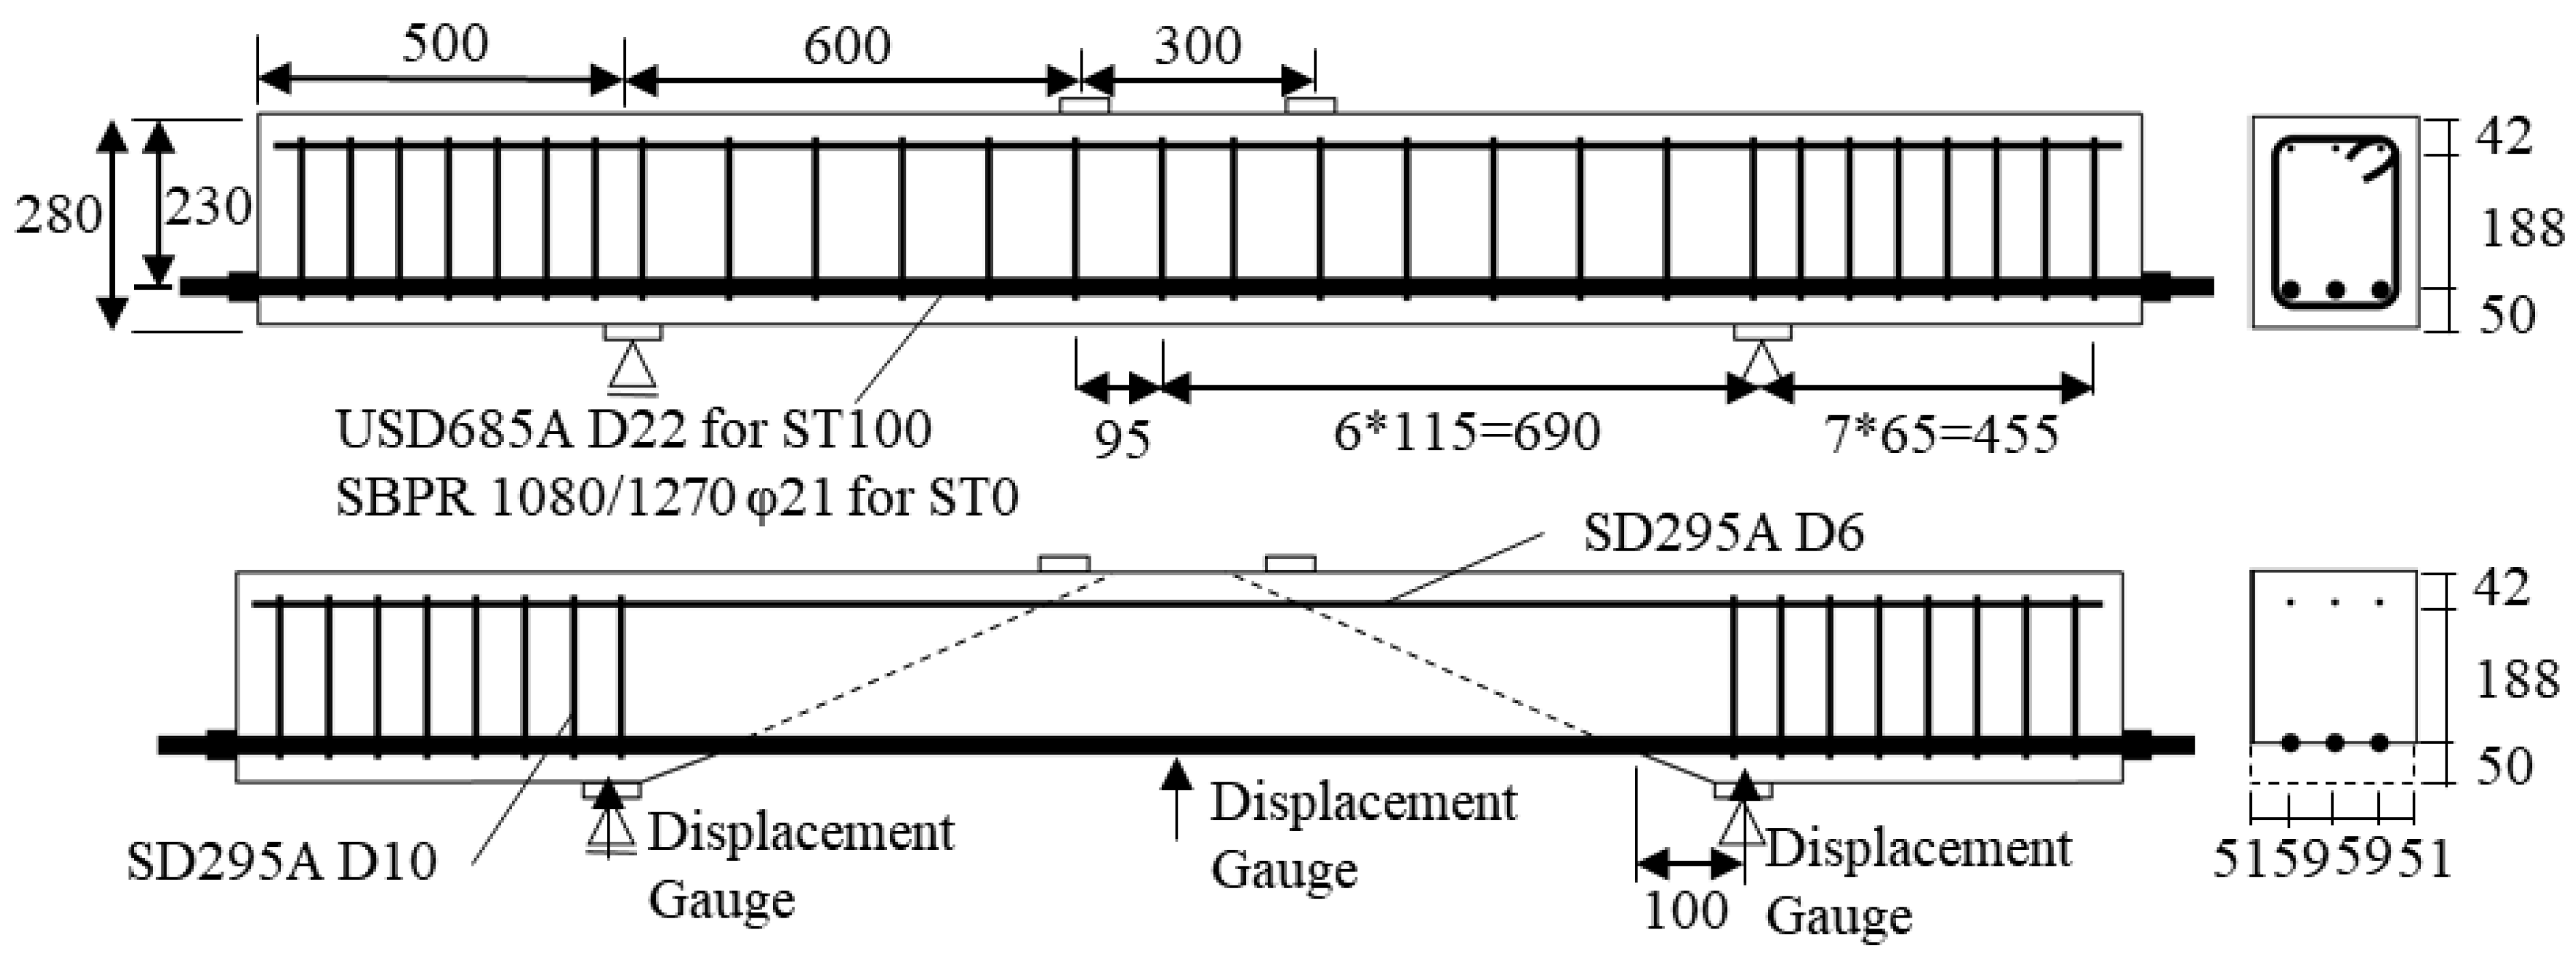
In order to confirm the effect of interlock on the bond performance of the RC beam, a static loading test was conducted. The interlock area of specimens was set to the values of 0%, 50%, and 100%.

2.1. Specimens

Table 1 shows the list for the specimens of six RC beams. In this test, the authors focused on the interlock effects on the load-carrying mechanism in the bond components. For this purpose, the interlock area was controlled, although chemical adhesion and friction resistance were kept intact in all cases.
The specimen with 50% interlock area had no cover concrete in the loading span, and the concrete was in contact with only the top half surface of the main rebars, and the bottom half side was exposed. The specimen with interlock area of 0% used a round PC rod. Two series of specimens, the ST series with stirrup and the PL series without stirrup, were set for beams with three different interlock areas. The geometry and the rebar arrangement of the specimens are shown in Figure 1. For the main rebars of the specimens, high strength threaded rebars were used in the cases of 100% and 50% interlock area cases, and smooth round PC rod was used in the case of the 0% interlock area. In the all cases, a D10 bar whose yield strength was 305 MPa was used for the stirrup and compression bars. Beam specimens were designed for failing in shear with tensile rebar ratio of 1.95%, effective height of 230 mm, shear span of 600 mm, beam width of 220 mm, and anchorage length of 500 mm. To secure solid anchorage at the beam extremities, the main rebars were fixed by attaching nuts at the beam ends.
The six beam specimens were casted at the same time using ready-mixed concrete with the mix proportions given in Table 2. The specimens were cured under sealed condition for 10 to 12 days until the loading test. Table 3 lists the mechanical properties of the concrete obtained from compression tests on cylinder specimens, with 39.7 MPa of compressive strength. Table 3 also shows the main rebar property: 710 MPa for threaded bar and 1189 MPa for PC rod of yielding strength.

2.2. Loading Test

A four-point static loading test was performed using a universal testing machine with the loading speed of 1 kN/s. Crack propagation was checked and marked by visual inspection every 20 kN of load increasing. Total load, vertical deflection of the beam, and strain of the main rebar were measured. The vertical deflection of the test specimen was taken as the difference from the displacement at center and supporting points. Rebar strain was measured by strain gauges attached on the main rebars. The orange parts in Figure 2 indicate the strain measurement positions.

3. Experimental Results and Discussion

3.1. Load–Deflection Relationship and Crack Distribution

The load–deflection relationship of each specimen is shown in Figure 3, and Figure 4 shows the crack pattern of each specimen after failure. The thick lines in the crack pattern show the dominant crack at failure. The shaded region in the PL-50 case indicates the concrete crushed region at failure. Dotted line and orange marks represent rebar arrangement and the strain measurement points of rebar, respectively.
In both the PL series and the ST series, as the interlock area between the rebar and concrete decreased from 100% to 50% and 0%, the stiffness of the beam decreased after the formation of a flexural crack. Initial stiffness in elastic range of the PL-50 and ST-50 specimens was lower than that of the specimens with 100% and 0% interlock area, on account of the smaller cross section of the beam due to the absence of cover concrete.
The maximum loads for the PL series were 264 kN, 285 kN, and 280 kN for PL-100, PL-50, and PL-0, respectively. Although the maximum load of PL-50 was close to that of PL-100, load reduction of PL-50 was due to crushing at the top of the concrete at the center of the span instead of shear failure as in PL-100. This is because the tied arch formed in PL-50 and thus shear capacity increased. The failure of PL-0 was caused by crushing of the concrete around the anchoring nuts.
The maximum loads of ST-100 and ST-50 were 466 kN and 368 kN, respectively, showing a different tendency from those of the PL series. Comparing ST-100 and ST-50, the two specimens showed similar crack propagation, and the both failed in shear, although the maximum load of ST-50 was approximately 20% lower than that of ST-100. In the ST-0 case, crack pattern, failure mode, and maximum load were similar to those of PL-0. In PL-0 and ST-0, the stiffness of beam declined markedly after cracking and the dispersibility of cracks was reduced. In these beams, because the bond was uniformly low, the stress on the anchoring parts was increased, and it ultimately caused anchorage failure.
The difference in interlock area of the specimens also affected the dispersibility of flexural cracks. The number of flexural cracks was eight and seven for ST-100 and PL-100, respectively, but only three cracks were formed in the span center in ST-0 and PL-0. Effects of stirrup placement were evident in the behavior of PL-50 and ST-50. In PL series without stirrups, the number of flexural cracks was reduced from seven in PL-100 to four in PL-50, while the number of cracks in ST-50 with stirrup was eight, the same number as in ST-100. Placing of stirrups also affected crack location. Cracks were basically formed on or near the stirrup in ST series while cracks were located randomly in the PL series.

3.2. Strain Distribution of Main Rebar

Figure 5 shows the strain distribution of the main rebar along the axial direction in each specimen of the PL series, and Figure 6 shows that in the ST series. In order to compare the specimens between threaded bar and PC rod with different strength, the vertical axis shows the ratio of measured strain to yielding strain of each main rebar. All beam specimens failed before the yielding of the main rebar. In the both PL-100 and ST-100, tensile strain was highest at the center of the beam and decreased closer to the supporting points, maintaining the correlation with the flexure moment distribution. Some unevenness can be observed in PL-100, and it is caused by cracks on strain gauges and cracks along the rebar as shown in Figure 5. In the PL-0 and ST-0 specimens, the strain distribution remained in an arch shape until 100kN, but the strain along the rebar became almost the same value after 150 kN due to chemical bond loss. This was consistent with the result that PL-0 and ST-0 shared the same failure mode. In the cases of 100% and 0% interlocking, the strain distribution trend was the same regardless of placing stirrups. On the other hand, the axial strain distribution clearly differed between ST-50 and PL-50. In ST-50, the axial strain distribution was a similar arch shape to that in ST-100 until beam failure. On the other hand, in PL-50 the strains at each measured point, except for the supporting points (RS1 and RS7), were almost identical past 150 kN. In the visual inspection after 150 kN, the detachment of the main rebar from the upper concrete was observed. The failure mode and the crack distribution in PL-50 also supported that the bond was lost at 150 kN, whereas in ST-50 sound bond was maintained until failure.

3.3. Summary of Experimental Results

In the case of ST-50, post-cracking stiffness decreased, but the reduction degree was slight, and crack behavior, strain distribution, and failure mode were similar to that of the ST-100. Even though the underside of the rebar was exposed and the half of interlock area was not available, no large bond loss was deemed to occur. On the other hand, in the PL-50 the smaller number of cracks and uniform strain distribution as shown in the result of the PL-0 clearly indicated bond loss. The detachment of main rebar suggested the interlock loss was caused by contact loss between lug and concrete. However, in the case of the ST-50, the main rebar kept contact with upper concrete because of the suppression of relative displacement between the main rebar and concrete by stirrups. Therefore, interlock was maintained.
Stirrups affected crack location through the confinement effects on the main rebar. Crack location was concentrated around stirrups because interlock between the main rebar and stirrup remained solid, and it kept local bond between concrete and main rebar.
In total, a sound bond could be maintained as long as contact between lugs and concrete was kept even if the interlock area was half. It was also confirmed that stirrups contributed to keep contact and bond between the concrete and main rebar.

4. FE Analysis for Reproduction on Beam Loading Experiment

Based on the experimental results, a reproduction analysis for the loading test was conducted using the finite element method. In the experiment, a uniformly half interlocking area and stirrup contribution were investigated. The purpose of the analysis in this section was to provide more detailed insight into what occurred in the experiments. Interlock loss condition by corrosion should have non-uniformity in the cross section and the axial direction of rebar, and it was investigated by FE analytical case study in the following section. Since RC structures in general use shear reinforcement, the beams with stirrup were set to be the target of FE analysis.

4.1. Outline of Analysis Model

Figure 7 shows the outline of the analysis models. Considering the symmetry of the beam, a quarter-cut model was used for analysis. To more precisely grasp the phenomena caused by differences in interlock conditions, the shapes of the threaded rebar and the anchoring nuts at beam end were reproduced using steel solid elements. Two-dimensional joint element was placed at the boundary between the steel element for main rebar and the concrete element. Thus, chemical adhesion and frictional resistance on smooth surface between steel and concrete were considered in the property of joint element. As the effect of interlock can be directly reproduced by normal stress between the concrete element and lug shaped steel element, it was possible to separate out the interlock effects from other bond components which are reproduced by the joint element.
In the previous researches, FE analytical models for bond between rebar and concrete could be divided mainly into two approaches: induction of bond-slip behavior between rebar and concrete [22,23,24,25], and averaged stress and averaged strain behavior as reinforcement concrete [26,27,28]. The both approaches were developed based on pull-out behavior of rebar from concrete, and stress transfer behavior between rebar and concrete was modeled including multiple bond factors: interlock, chemical adhesion, and friction. In this study, the authors reproduced interlock effects explicitly by reproducing the geometry of rebar, not an embedded truss or beam rebar model or a distributed fiber model for rebar.

4.2. FE Analytical System “COM3” and Its Constitutive Laws

The three-dimensional nonlinear finite element analytical system “COM3” was used for the analysis [28]. This system introduced a six-directional fixed smeared crack model, and its applicability to various reinforced concrete structures as well as composite structures with steel-concrete boundary has been verified in the past researches [21,28,29,30,31,32]. The summary of constitutive laws of compression, tension, cracked shear, and joint element are shown in Figure 8.

4.2.1. Model of Concrete and Rebar

An elasto-plastic and continuum fracture model [28,33] was applied for the concrete compression. Compressive stiffness was modeled by multiple springs and cumulative plastic damage due to micro crack or local crush was expressed by decrease of springs, namely stiffness reduction. Under this concept, the constitutive law of concrete in compression was given by Equation (1)
σ c = K c E 0 ( ε ε p )
where σ c is normalized compressive stress, E 0 is initial tangent elastic modulus, ε is compressive strain, ε p is plastic compressive strain, and K c is failure parameter. K c means the residual ratio of springs keeping the load bearing function, namely stiffness ratio to sound elastic modulus. K c and ε p , which are residual strain in an actual situation, are given Equations (2) and (3) in normal strength concrete under one axial stress field, respectively.
K c = exp [ 0.73 ( ε m a x ) { 1 exp ( 1.25 ε m a x ) } ]
ε p = ε m a x ( 20 / 7 )   { 1   exp ( 0.35 ε m a x ) }
where ε m a x is maximum compressive strain in stress hysteresis. This compression model can be expanded to the three-dimensional constitutive law by equivalent stress and strain composed with average stress and deviatoric stress in a solid element.
The tension model of concrete based on averaged stress and averaged strain relationship [34]. This model had good agreement with the smeared crack model by Vecchio and Collins [35], and tension softening behavior was separately considered by RC zone which was affected by bond between rebar and concrete and plain concrete zone based on the zoning method [30]. In the RC zone, concrete has resistance against tensile stress even after cracking because rebar stress can be transferred by bond known as tension stiffening. Concrete tensile model after crack with tension stiffening can be given by Equation (4).
σ c = f t ( ε t u / ε t ) c  
where σ c is averaged tensile stress, ε t u cracking strain, ε t averaged tensile strain, and c is stiffening parameter which represents the bond condition. Based on the previous research, ε t u   and   c were set to 0.0002   and   0.4 for the RC zone, respectively [26]. In plain concrete, tension softening behavior should be determined by fracture energy and reference length on which the average stress–strain relationship was defined. Stiffening parameter of plain concrete can be given by Equation (5) [26].
  σ c   d ε t = G f / l r
where G f is fracture energy of concrete and l r is reference length of finite element. Reference length was equal to the element dimension. Parameter c , which reproduced tension softening behavior, was determined on the reference length, thus average stress–strain relationship was dependent on the element size.
Shear model of cracked concrete was based on the contact density function model [36]. Equation (6) shows the relationship between shear stress τ and shear strain γ by shear stiffness G .
τ = G γ  
Shear stiffness G of cracked concrete is described as shown in Equations (7) and (8).
1 / G = 1 / G st + 1 / G c
G s t = τ s t γ = f s t β 2 1 + β 2 ,   β = γ ε t
where G s t is intrinsic shear stiffness, G c is shear stiffness of uncracked concrete, ε t is tensile strain normal to crack surface, and f s t is intrinsic shear strength. This shear model can describe shear stiffness by the ratio of averaged shear strain to averaged tensile strain without crack spacing or crack width. When cracks close, cracked concrete should have high shear stiffness and that phenomenon can be considered by taking uncracked shear stiffness into account. Because the value of G c is significantly higher than G s t , the value of G s t becomes dominant with high tensile strain normal to crack surface.
For the rebar model, COM3 applies a tri-linear stress–strain relationship considering elastic modulus, yield strength, yield plateau strain, and tensile rupture strain.

4.2.2. Joint Model between Steel and Concrete

For reproducing the mechanical behavior of chemical adhesion and friction resistance between steel and concrete, the FE model in this study applies a 2D joint element. In general, the steel–concrete interface shows contact friction behavior in shear with initial adhesive strength [29,37]. Thus, the authors applied the Mohr-Coulomb friction law in the shear direction on the contact surface with initial adhesive strength in the both normal and shear direction [38]. Recovery of chemical adhesion was not considered when joint surface contacted again. In other words, after stress in the joint element in shear or open direction exceeded its chemical adhesion strength, no normal stress was considered, and shear stress followed only the Mohr-Coulomb friction law. The friction coefficient μ of 0.4 in the Mohr-Coulomb friction law was applied in this study according to the past research focusing on a smooth interface between steel and concrete [37].

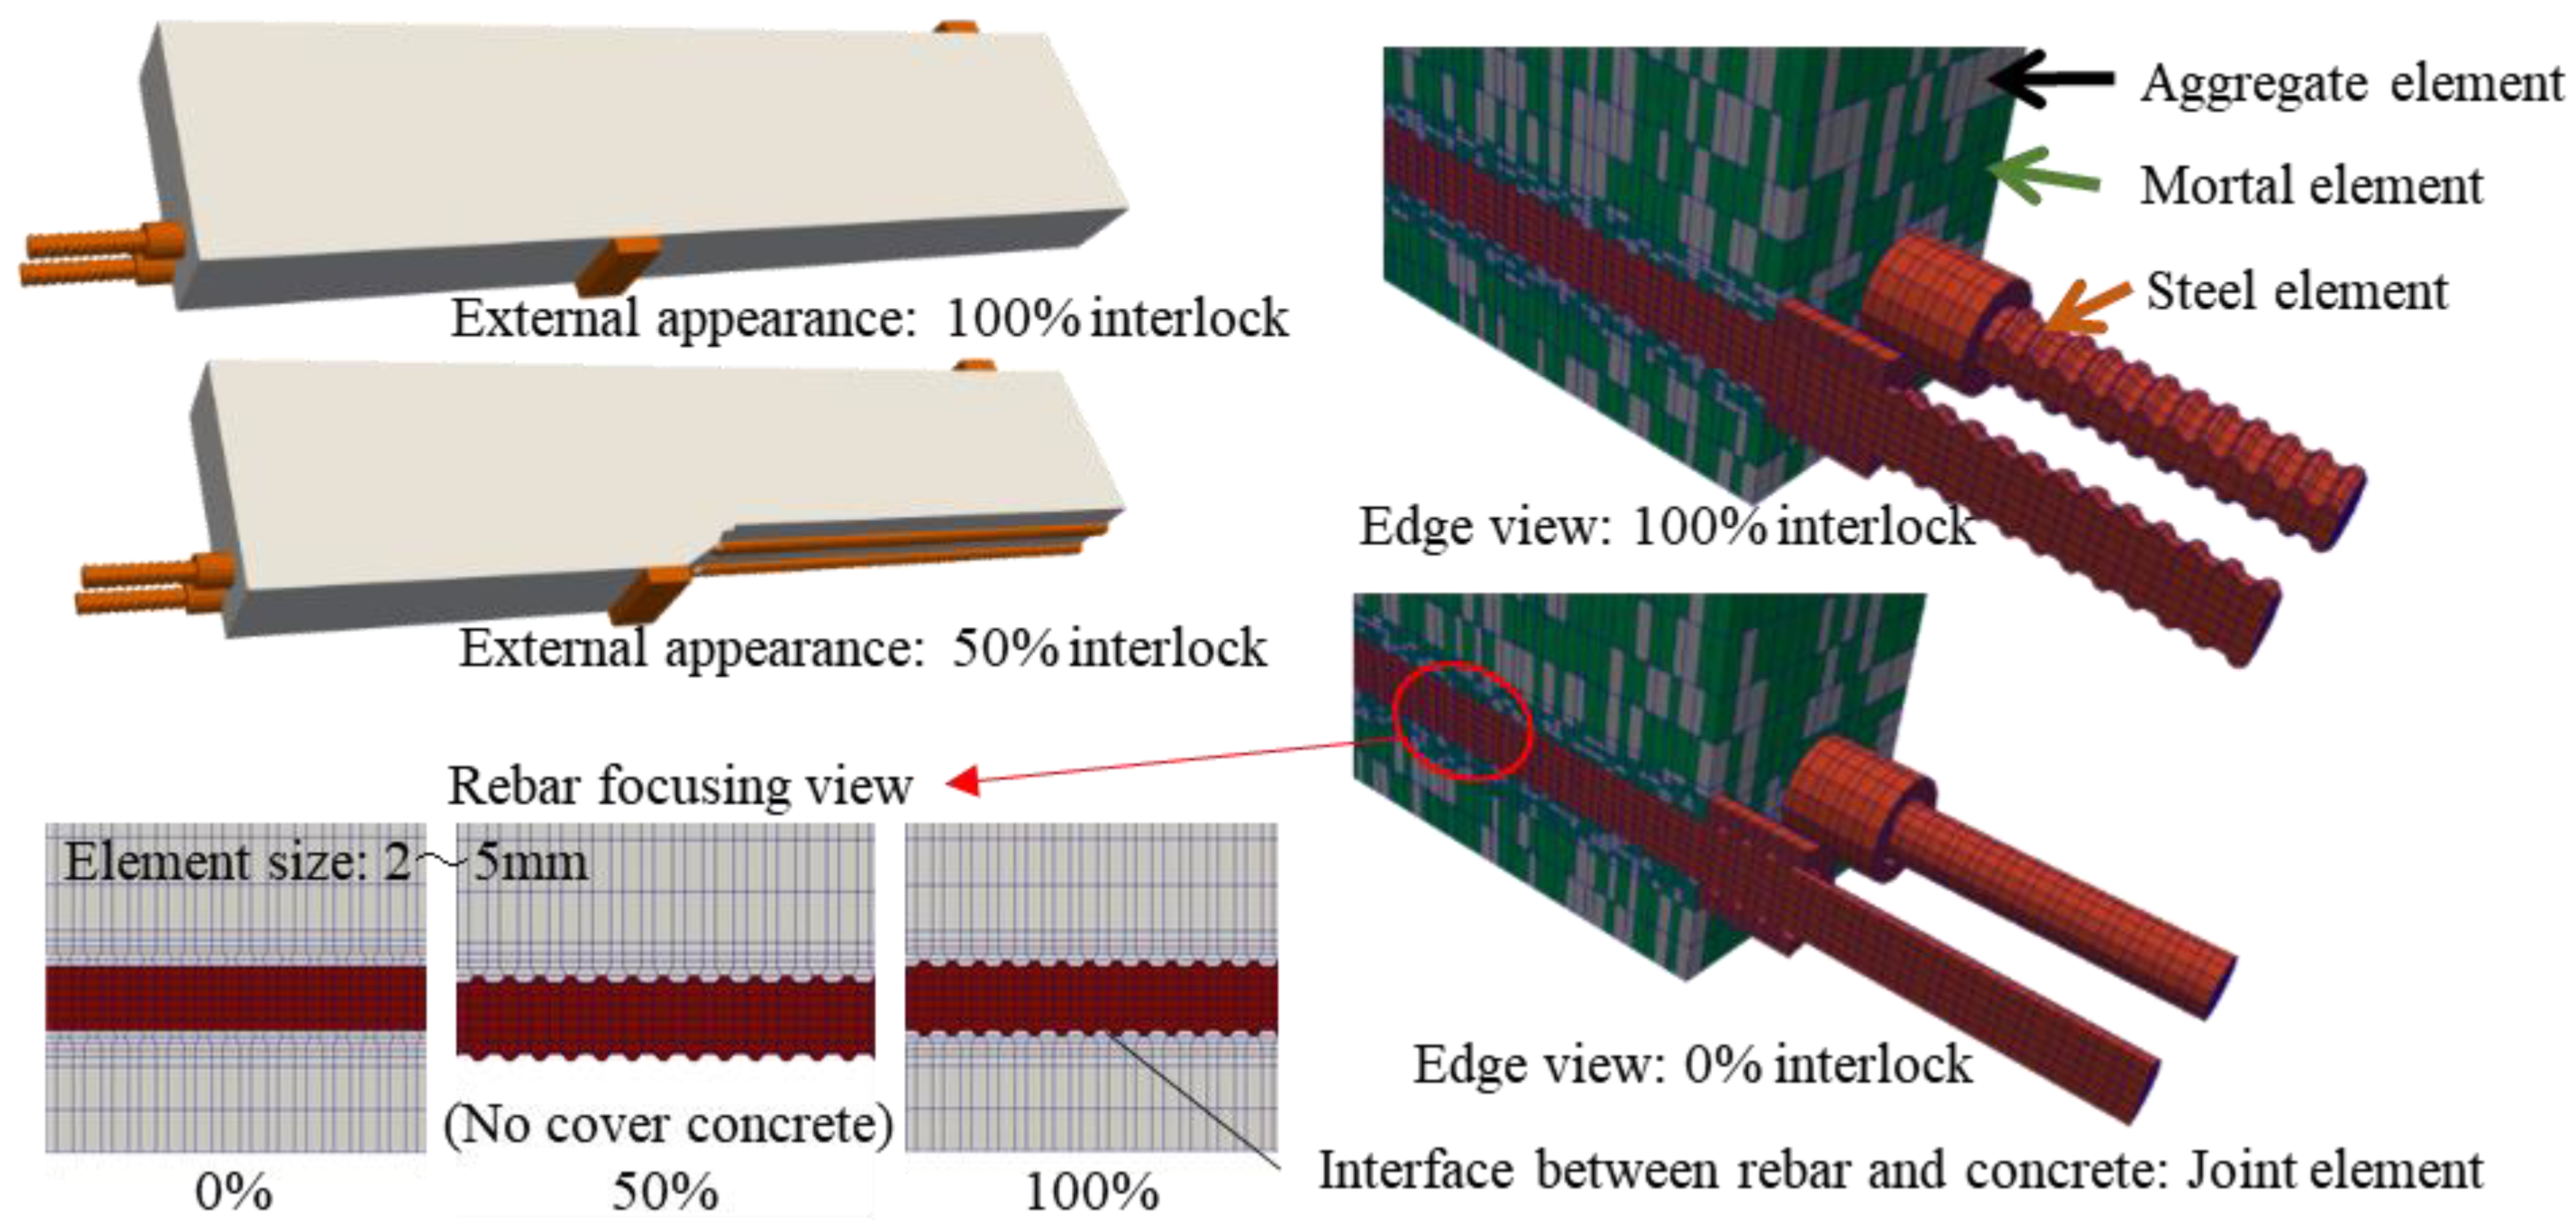
4.3. Segregated Modeling of Mortal and Course Aggregate Due to Fine Mesh Size

In order to clearly reproduce mechanical interlock between rebar lug and concrete, the authors reproduced the shape of threaded bars by hexahedral elements. To achieve that, a small mesh size of 2 mm minimum was set. This mesh size deviated from the applicability of the original concrete model that described the averaged behavior of concrete as the composite material of aggregate and cement paste. Thus, the aggregate and mortar parts of the concrete elements were segregated into concrete elements in order to reproduce the actual condition as closely as possible while there was room for consideration of equivalent softening behavior in homogenized concrete model. Comparison between the homogenized concrete modeling and segregated modeling in the structural behavior of beam is shown in Figure A1 in Appendix A.
In the experiment, the volume ratio of coarse aggregate in the concrete was 36%. Based on that, 36% of concrete elements were randomly set to the aggregate element, and the other concrete elements were set to the mortar elements as shown in Figure 8. Table 4 lists the material property values applied in the aggregate and mortar elements. Because limestone was used as the coarse aggregate in the experiment, the general values of compressive strength (140 MPa) and tensile strength (10 MPa) of limestone aggregate were used for the aggregate elements [34]. Since the fracture of aggregate was brittle, the parameters were set so that tensile bearing stress after occurrence of crack drops sharply with large stiffening parameter while concrete constitutive law was applied for aggregate elements. For the elastic modulus of the aggregate element, the estimated value obtained from the density of aggregate with Equation (9) was used [39].
E a g = ( 2.35 γ a g 5.78 ) × 10 5
where E a g is the elastic modulus ( MPa ) and γ a g is the density of aggregate ( g / cm 3 ). The calculated elastic modulus of course aggregate had almost same value as that of general limestone aggregate [40].
The compressive strength and tensile strength taken from the concrete material test results shown in Table 3 were applied for the element properties of the mortar element because the strength of mortal was dominant for concrete failure in normal strength concrete. Elastic modulus of mortal was lower than that of concrete in general and Hashin-Hansen’s equation for two-phase composite materials, shown in Equation (10), was used for determining the elastic modulus of mortal [41,42].
E c = E m ( 1 V g ) E m + ( 1 + V g ) E g ( 1 + V g ) E m + ( 1 V g ) E g
where E c ,   E m ,   E g is the elastic modulus of concrete, mortar, and coarse aggregate, respectively, and V g is the volume ratio of coarse aggregate in concrete. The elastic modulus of mortal element E m could be obtained by Equation (10) from the measured elastic modulus of the concrete E c and the elastic modulus of the aggregate E g estimated by Equation (9) in this study. Strictly speaking, it was necessary to consider the influences of the interfacial transition zone between the aggregate and mortar elements, and the contact conditions between aggregate elements according to the aggregate diameter and the aggregate shape. However, in this analytical model, these influences were considered to be small because the damage was concentrated on the mortar elements, which had a lower elastic modulus and strength than aggregates.

4.4. Validation of Each Element Model

In order to check the validity of the parameters in the FE model, such as the reproduction of rebar shape by hexahedron elements, the parameters applied for the joint element between steel and concrete, and the parameters of aggregate and mortar elements, a pull-out test of rebar embedded in concrete was reproduced by FE analysis.
The pull-out test was based on JSCE-G 503-2013 (test for bond strength between concrete and steel reinforcement by pull-out test). Figure 9 shows the outline of the pull-out test. The specimens for the pull-out test were the concrete cubes of 132 mm of each side with a rebar embedded in the center. The length of one side was six times the diameter of the rebar. An unbonded zone of twice the rebar diameter in length was provided on the pull-out side. The relative displacement between the rebar and the concrete cube was measured as the pull-out displacement at a bottom of the specimens. The pull-out test was conducted on a total of four specimens, consisting of two specimens with reinforcement of the screw bar, and two specimens with round PC rod. The properties of steel bars were same as the beam loading test.
Figure 10 shows the reproduction analysis model. As with the beam model, it consisted of a mortar element, aggregate element, and steel element. Two-dimensional joint elements were placed at the boundaries around the steel element.
Figure 11 shows the comparison of the test results and analytical results in the load–pull-out displacement relationship. In both the threaded bar and round PC rod cases, the analysis was able to reproduce the behavior until the applied load reached the bond strength. In this pull-out test, displacement measurement around and after failure did not have high reliability. This was because the specimens bounced or split at failure, thus affecting measurement of displacement gauge fixed on the concrete cube surfaces. Thus, there was slight difference in softening behavior between experiment and analysis, especially after rebar slipping due to bond fracture for round bar. However, it was enough to evaluate the structural behavior of the RC member with interlock and bond performance until bond fracture, which is the focus of this study. Dynamic analysis considering local contingency of slipping can improve slip behavior reproduction between smooth surface due to bond fracture [29].
From these results, the authors concluded that those models, such as the material properties of the aggregate and mortar elements, and the stiffness, chemical adhesion strength, friction coefficient of the joint element, were valid enough to reproduce the beam tests.

4.5. Results of Reproduction Analysis of Beam Loading Test and Discussion

Figure 12 shows comparison between the analytical and experimental load–deflection relationship and the primary principal strain distribution. For the ST-100, the analysis was able to reproduce initial stiffness, load capacity, strain distribution of main rebar, and crack distribution observed in the experiment. For the ST-50, analytical stiffness value was lower than the experimental value at approximately 250 kN, and shear failure occurred at higher load than that in the experiment. As the analytical model uses a smeared reinforcement model for the shear reinforcement, the confinement effect by stirrups for main rebar cannot be considered directly. In this analysis, among the joint elements in the ST-50 model, a large value was applied for the chemical adhesive strength at the locations of the stirrup in the experiment to reproduce the confinement effect by the stirrup. However, as the load increased, the stress in the direction for the detachment was concentrated around the joint elements which have high adhesive strength, and at a load of approximately 250 kN the rebar detachment occurred. The shear capacity of beam increased, and as a result, the maximum load is considered to have been higher than that recorded in the experiment. ST-50 in analysis failed in shear, but the angle of the shear cracks was steep, and the crack shape was similar to those of PL-50 in the experiment. If interlock between the top concrete and the lugs on the rebar can be maintained by the discrete representation of the stirrups mechanically, the detachment can be prevented, and the accuracy can be improved.
The analytical result of the ST-0 showed different behavior from the experiment; a decrease in load occurred at a load of approximately 110 kN, and later the load increased again. In the analysis, slip between rebar and concrete occurred at the load of approximately 110 kN, and slip occurred instantaneously in most surface of the rebars. On the other hand, in the experiment, slip between rebar and concrete occurred locally and it was intermittent as the load increased, which may have caused the difference in the load–deflection curves. In the load–deflection curve obtained from the ST-0 experiment, the slope of the curve began to decrease from approximately 120 kN. Slipping sound was intermittently heard from approximately 100 kN during the loading test, presumably indicating that the rebar began to slip. The load at which slip of the rebar started is consistent between experiment and analysis. The strain distribution of the ST-0 clearly showed a decrease in the number of cracks and the concentration of strain in the concrete at the anchoring parts at the beam ends compared with the sound case, reproducing the crack behavior and the failure mode in the experiment. Although there was a difference in stiffness after rebar slip, the maximum load was almost the same as that in the experiment. Rebar slipping is a dynamic phenomenon of intermittent local slipping, and it is difficult to track it in static analysis. The authors believed that the reproduction accuracy of the ST-0 can be improved by introducing dynamic analysis, setting parameters non-uniformly for the joint elements, or by introducing viscous behavior.
However, as long as a member uses a deformed bar, this beam model can be considered to have enough accuracy. That was because stress transfer by lug can be reproduced well and this model gives safe side evaluation for low bond conditions, e.g., round PC rod.

5. Analytical Case Study Assuming Lug Loss Due to Rebar Corrosion

5.1. Analysis Cases

An analysis reproducing the different interlocking conditions that are expected to occur due to rebar corrosion was conducted. The shape of the threaded rebar, geometry of beam, rebar arrangement, and the loading conditions were the same as the reproduction FE analysis for the ST series in Section 4. The analysis cases shown in Table 5 were set up focusing on three points: lug height loss, non-uniform lug loss region on cross section of rebar, and non-uniform lug loss region in axial direction of rebar. In those case studies, the influence of corrosion cracking was not considered. Strictly speaking, when the corrosion gel is infiltrated into corrosion crack, a low-density area is generated on the corroded part. However, this case study focuses on the interlock condition to deepen the understanding of bond deterioration, the same as discussed in the previous section.

5.1.1. Lug Height Loss

As the corrosion of the rebar progresses, rebar lugs are gradually flattened. However, because the surface of the bar is uneven, the bar surface never becomes as smooth as round PC rods due to corrosion. The degree of lug interlocking is affected by the reduction of contact area between the lugs and the surrounding concrete. Thus, beams with different lug height were analyzed using the cases of 75% (LugH-75%), 50% (LugH-50%), and 25% (LugH-25%). The height of the lug in the sound case was 2.0 mm, which was the same as that of the threaded rebars used in the experiment.

5.1.2. Non-Uniform Lug Loss Region on Cross Section of Rebar

Since the deterioration factors that cause rebar corrosion ingress from surface of RC member, rebar corrosion starts from the region close to the concrete surface [43]. Three cases were analyzed: The case in which only the lugs on the bottom side of all main rebars were lost (Bottom-0%), the case in which the lugs on the bottom side of all main rebars were lost as well as the lugs on the lateral sides of the outer two main rebars (Outer-0%), and the case in which the lugs on the outer two main rebars were lost (Side-0%). Interlock remaining part of Bottom-0% was the same as ST-50 that appeared in the previous sections, and the only difference is whether cover concrete exists or not.

5.1.3. Non-Uniform Lug Loss in Axial Direction

Since non-uniformity of corrosion also appears in the axial direction of the rebar [32], the beams with alternating regions of lost lugs and sound lugs were analyzed. Three cases were set up, and the intervals of lug lost and sound lug region were 1 cm (LugInt-1 cm), 3.5 cm (LugInt-3.5 cm), and 7 cm (LugInt-7 cm), respectively. The residual rate of lug as a whole beam was 50% in all cases.

5.2. Investigation on the Effect of Lug Height Loss

Figure 13 shows the load–deflection curves and strain distribution for the analysis cases focusing on the effect of lug height loss. In the case of the LugH-75% and LugH-50%, load–deflection curve, maximum load, main rebar strain distribution, and crack distribution were nearly same as those of the sound case, while stiffness reduced slightly with lug height decreasing. Until lug height reduction reached to 50%, lug height had almost no influence on the structural behavior of the member. In the LugH-25%, stiffness after flexural cracking was low, the crack concentrated in the center of the span, and the beam failed in crushing at the compression side, not by shear crack opening. This is due to bond loss and the fact that the small lug height of 0.5 mm resulted in reduced stress transfer between the lugs and the concrete. The strain distribution of LugH-25% indicates that the concrete surrounding rebars were damaged locally, which was not seen in the other cases.
For a more detailed study on the lug height effect on the bond, the authors conducted a rebar pull-out test which used threaded rebars with different lug heights. This followed the pull-out test sequence described in Section 4 and all lugs of embedded rebar were grinded manually before concrete casting. The same three cases with reduced lug height as in the analytical cases were set at 75%, 50%, and 25% of original height. Figure 14 shows the test results of the cases with sound rebar, grinded rebar, and PC rod. It is noted that Figure 15 shows one of the test results with two specimens for each case and they had small scatter, as shown in Figure 11. Pull-out behavior showed the same trend as member analysis, where the cases with lug height reduced to 75% and 50% showed almost the same pull-out stiffness compared with the sound case, but the rebar with 25% lug height had low pull-out stiffness. Bond strengths became smaller in correlation with lug height reduction because the contact area between lug and concrete became smaller. However, in the beam analysis, these difference in bond strength did not affect the structural behavior because the external force to cause local bond fracture on rebars was larger than that to cause the whole beam failure.
Based on these results, stress transfer in a member can be maintained up to a certain lug height loss while bearing pressure increases as the contact area between concrete and rebar is reduced by lug height reduction. When lug loss ratio exceeds a certain level, the concrete at the interlocking surface breaks down locally. If lug height is uniformly decreased, local bond fracture propagates one after another, and unity between rebar and concrete is lost entirely.

5.3. Investigation on the Effect of Non-Uniform Lug Loss Region on Cross Section of Rebar

Figure 15 shows the load–deflection curves and strain distribution obtained by the FE analysis. In the following figures showing load–deflection curves, the result of sound case (ST-100) is included for comparison. In the case of Side-0%, where two of the three main rebars were perfectly round, stiffness decreased after the onset of flexural cracks, and cracks were localized, as well as strain being concentrated at the beam ends, indicating bond loss. On the other hand, in the cases of Bottom-0% and Outer-0%, the load–deflection curves and the strain distributions were almost identical to those of the sound case, so the bond of the entire beam can be almost the same condition as the sound one. In the Bottom-0% case, lug loss region was the same as the ST-50, and the difference between the two cases was whether cover concrete was present or not. However, the two cases clearly differed in behavior. In the ST-50 case of analysis, the main rebar detachment from the upper concrete caused interlock loss, while in the Bottom-0%, the concrete under the rebar pushed up the rebar to concrete so that contact between the lugs and the concrete was maintained, resulting in a sound bond. Although the sound interlock area was 1/2 for the Bottom-0% and 1/3 for the Outer-0%, behaviors of these beams were almost same as the sound interlock case. As long as some interlocking region remains on every main rebar, tensile stress can be transferred to the rebars, and they can work as tensile members, as is expected in design.

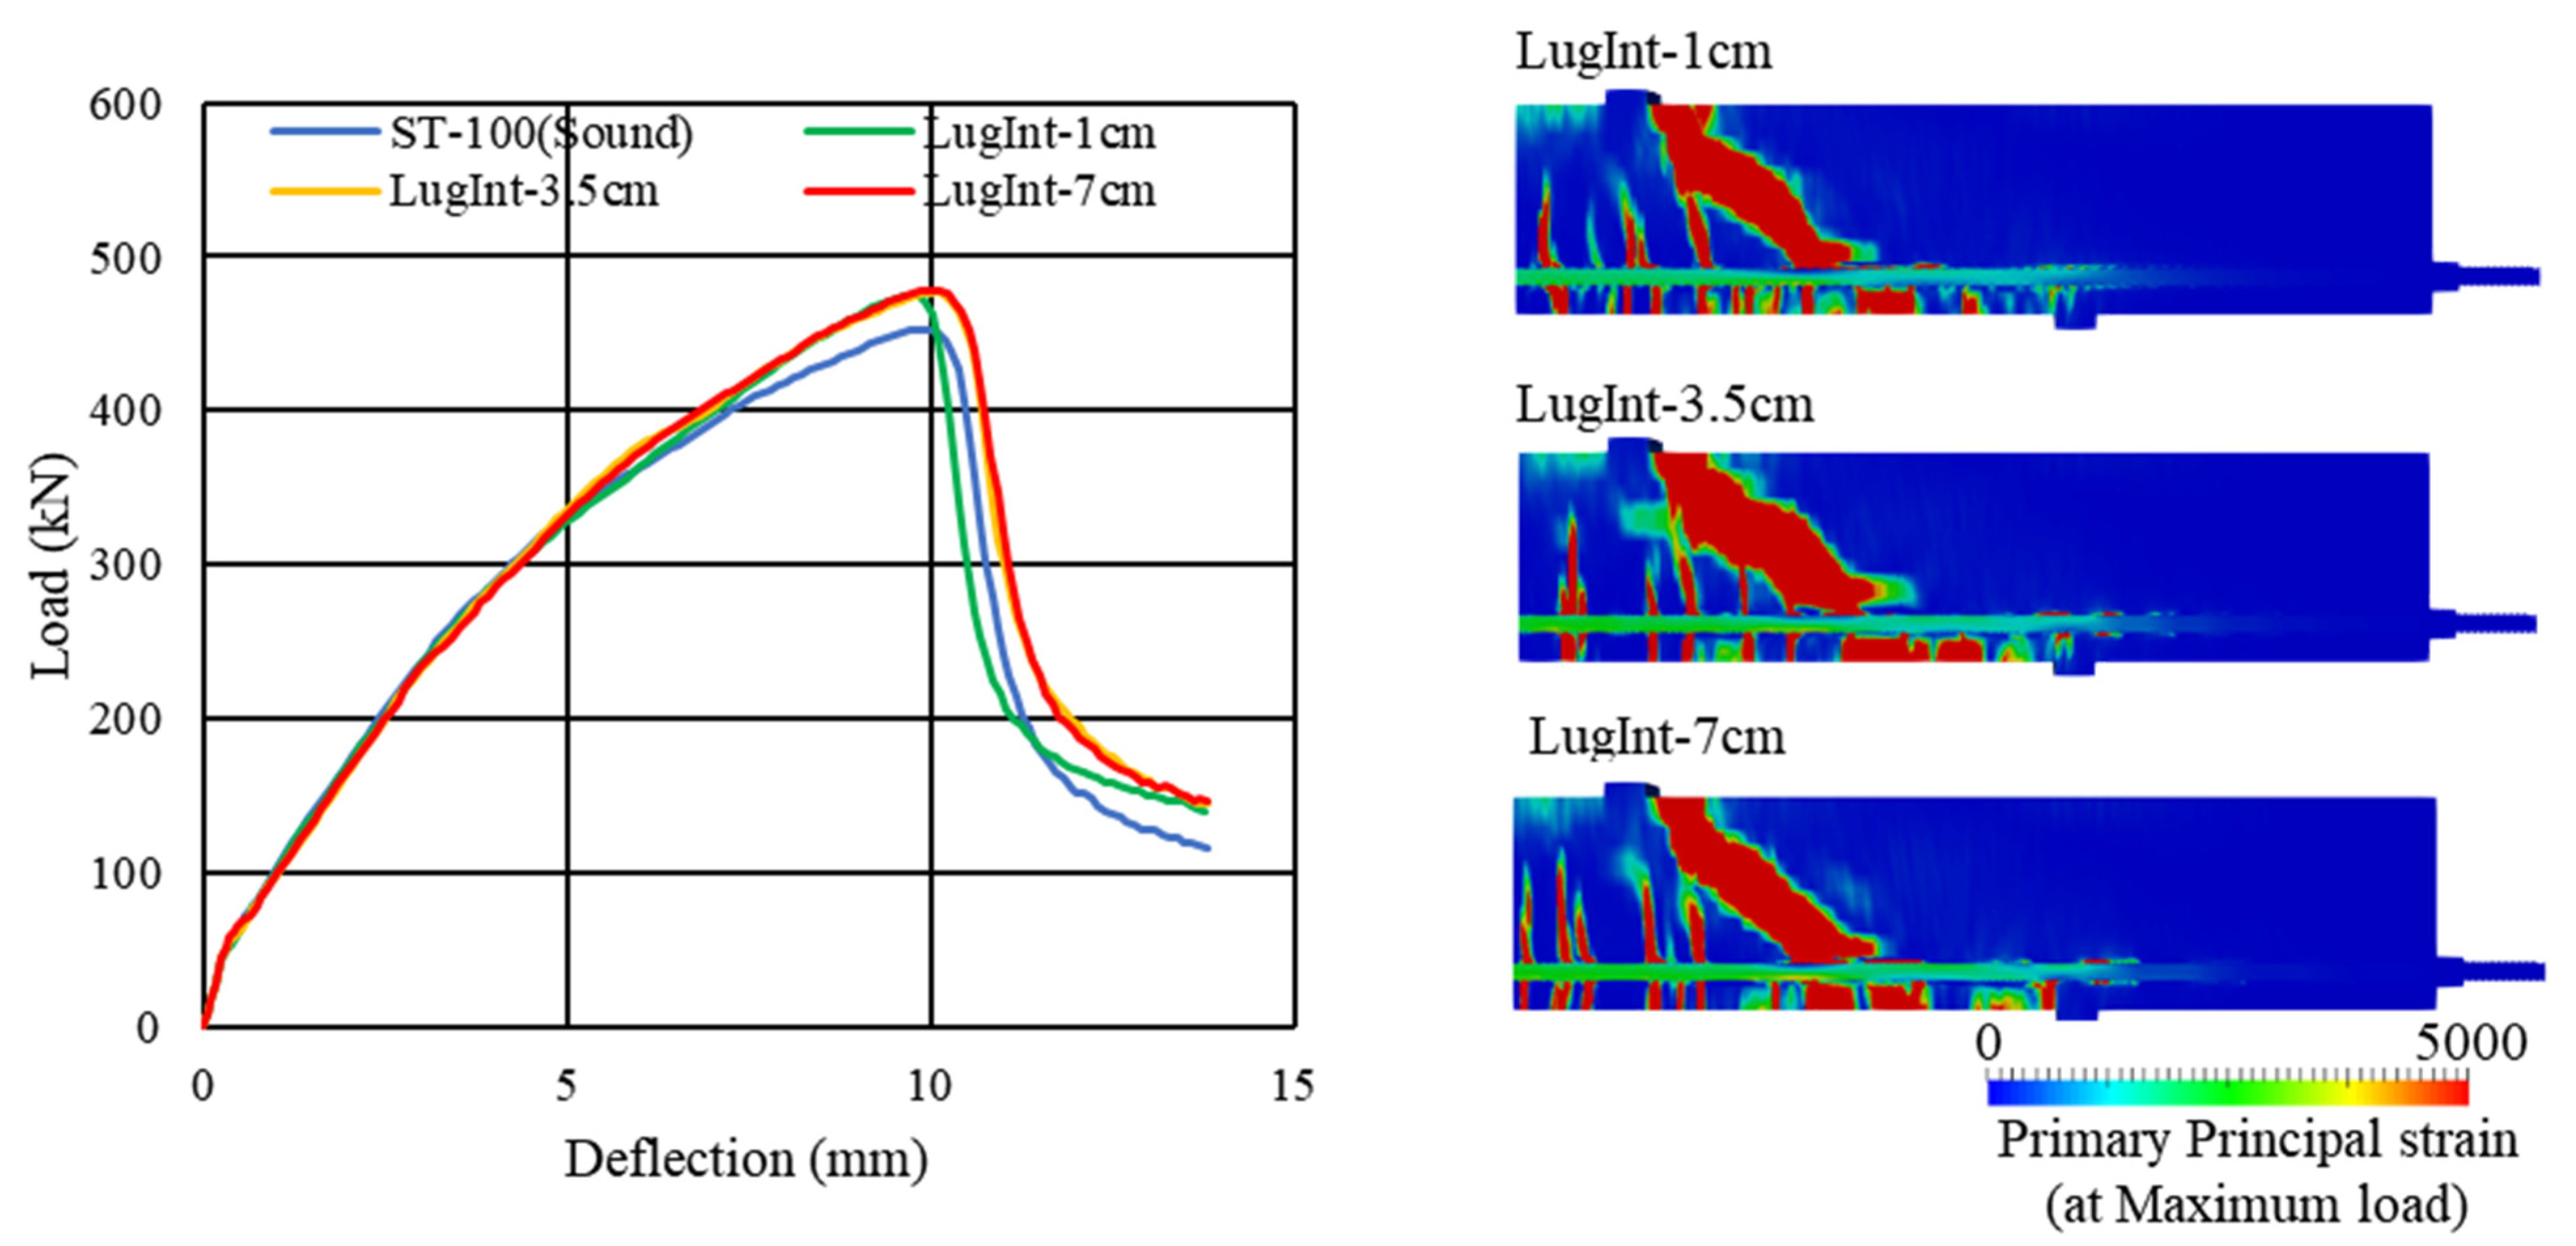
5.4. Investigation on the Effect of Non-Uniform Lug Loss in the Axial Direction of Rebar

Figure 16 shows the load–deflection curves and strain distribution. Regardless of the spacing of the lug loss zones, the maximum load, crack distribution, and failure mode were almost same as those of the sound case. It can be seen that even if there are zones of significant interlock loss in the axial direction of the rebar, the bond is maintained for the entire member as long as there are zones where the interlock can be maintained.
Figure 17 shows the distribution of flexural cracks before shear crack formation in LugInt-3.5 cm and LugInt-7 cm. The orange parts indicate the sound lug zones, and almost of all flexural cracks occur from sound lug zones or at the boundary between a sound lug zone and a lug loss zone. These parts are considered when there was strong bond between the main rebar and concrete. This is in correlation with the result that flexural cracks occurred on the stirrups in the experiment.
In actual rebar corrosion, section loss does not occur uniformly in the axial direction. There will be a mixture of zones where the lug to concrete interlock remains sound and zones where it is lost. At this time, unless a part of the rebar due to extreme section loss caused by serious pitting corrosion exists, flexural cracks should be able to disperse in the sound parts and the bond of an entire member can be maintained.

5.5. Summary of Analystical Case Study

Analytical case studies focusing on lug height loss, lug loss region on cross section, and non-uniform lug loss in axial direction were conducted. Even when the height of the lugs was reduced, sufficient bond strength was maintained in a certain range of height, which was larger than 0.5 mm in this case. On the other hand, as long as stress transfer by interlock can work in a partial region in cross section or axial direction, rebar slip can be prevented and the bond as a whole member can be maintained.
This study focused on a lug based on the Japanese Industrial Standard for deformed steel bars (JIS G 3112 Steel bars for concrete reinforcement). From our analytical results, when a concentric section loss ratio reaches around 20% to 25%, 75% of contact area between a lug and concrete is lost which leads to bond deterioration. When the section loss ratio reaches around 25% to 30%, interlocking effects against pull-out force are eliminated.
On the other hand, when the section loss has non-uniformity, interlock in a partial region of rebars can transfer stress between rebar and concrete. Thus, a member can have bond as a whole member even when higher averaged section loss occurred. At minimum, slip and pull-out of an entire rebar can be prevented.

6. Conclusions and Suggestions

In this paper, the authors tried to separate out the multiple factors of bond deterioration and focused on the interlock, which is a dominant factor in the bond components. To evaluate the effect of change in the interlock condition on load-bearing mechanism and bond performance of RC beams with different interlock condition, experimental and analytical investigations were conducted. Furthermore, the finite element analysis as case studies that simulated interlocking conditions that were expected to occur due to rebar corrosion was performed. From these investigations, the conclusions are summarized as follows:
  • Bond between round bar and concrete was significantly low compared with deformed bar with interlock. It was confirmed that whether interlock can work or not was a dominant factor for a sound bond rather than chemical adhesion or friction effects. Section loss of rebar caused reduction of contact area between a lug and concrete, but interlock can be maintained until some lug height was lost.
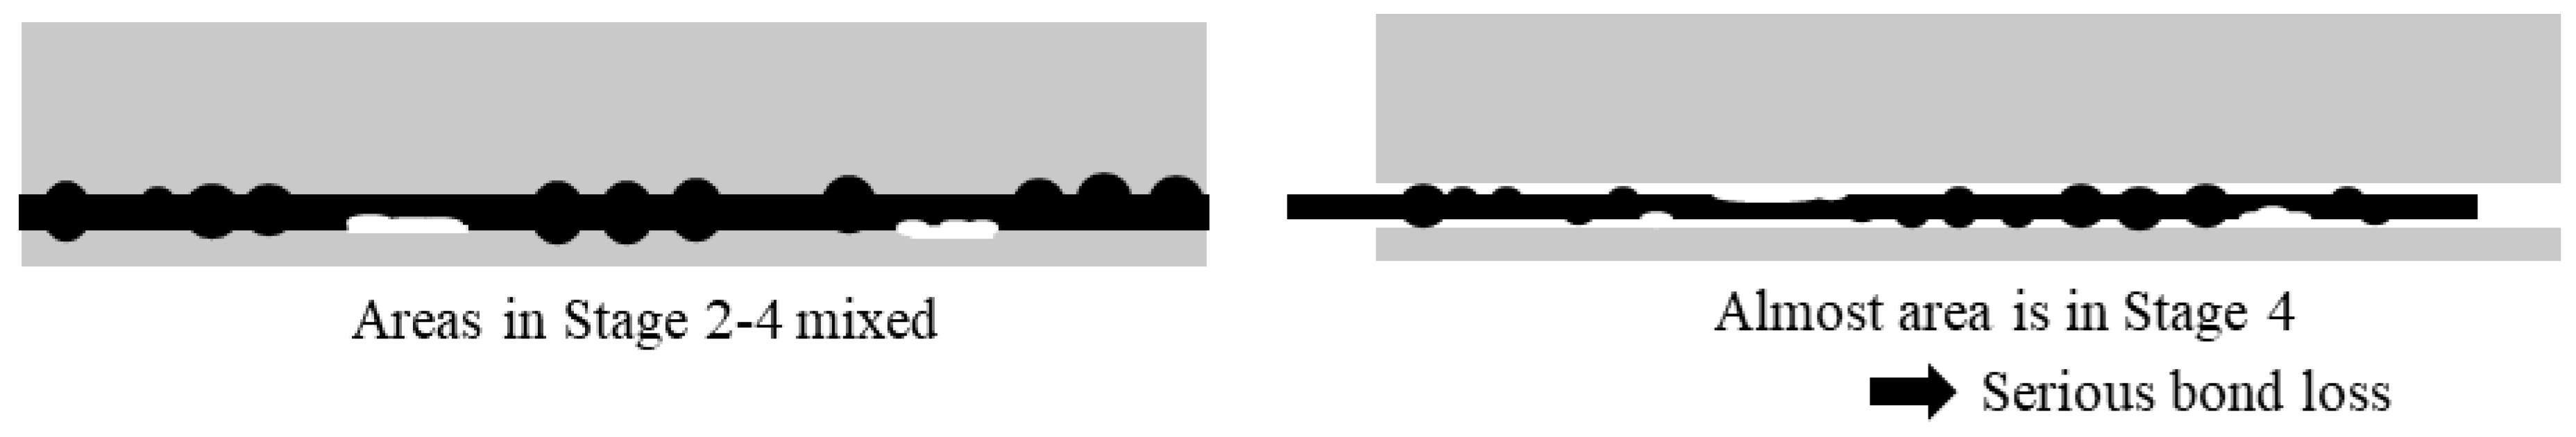
  • When bond performance between rebar and concrete as an entire member was focused, as long as a part of surface remained interlocked, slip and pull-out of rebar did not occur even if some region in rebar lost interlock completely. Thus, bond performance was insensitive even though the section loss ratio increased due to corrosion. As long as the section loss ratio was lower than approximately 20%, stress can be transferred by interlock, and the bond of an entire member can be maintained in an almost sound state.
  • Stirrups can strongly suppress the relative displacement of main rebar against concrete in axial direction and for the detachment. As a result, this affected crack location and kept an interlock between the concrete and main rebar, as long as a certain degree of roughness on rebar surface remains even after a corrosion crack was formed along rebar or cover concrete is lost.
This study focused on interlock effects, which are a dominant component of the bond between rebar and concrete. Interlock deteriorated with section loss. However, when considering bond deterioration by actual rebar corrosion, corrosion crack also affects bond deterioration. Some points still need more consideration for understanding the correspondence between the actual corrosion condition and bond deterioration.
It may be possible to evaluate a bond condition by residual interlocking and to assume an almost sound bond until the corrosion ratio reaches the point where the interlock between lugs and concrete is significantly lost.
Figure 18 shows a conceptual diagram of the relationship between the corrosion process and interlock condition alteration focusing on local interlocking around a lug. At first, after the onset of rebar corrosion, a sound bond is maintained until cracks occur in the surrounding concrete while chemical adhesion is lost due to corrosion product (Stage 2). When corrosion cracks occur, bearing strength of the concrete contacted with lugs is reduced. However, as long as the interlock persists, relative displacement between rebar and concrete can be suppressed (Stage 3). If the interlock is lost owing to serious section loss, the stress transfer will be completely lost (Stage 4). As far as the influence of section loss alone on the bond is concerned, Stage 4 is achieved in 25% section loss. However, when the rebar is actually corroded, the same state of Stage 4 can occur at a lower corrosion ratio due to corrosion cracks, which causes the geometry change of the concrete surface around rebar and the reduction of bearing strength.
When considering bond not on a meso scale but on a macro scale as a RC member, due to non-uniform corrosion in axial direction various local interlock conditions can be mixed. Figure 19 shows the interlocking condition of the entire corroded steel bar. Even if some regions reach Stage 4, as long as the other parts are corroded to a smaller degree, interlocks in these regions can maintain the bond of an entire member. When rebar corrosion condition is severe and almost every region reaches Stage 4, resistance against pull-out stress by interlock is lost and averaged bond of an entire member seriously deteriorates.
To further improve the accuracy of performance assessment of reinforced concrete structures with rebar corrosion, investigations focusing on the bond mechanisms, composed of interlocking, friction, and adhesion, and cracks around the rebar, are suggested.

Author Contributions

R.K.: conceptualization, methodology, investigation, formal analysis, data curation, writing—original draft. Y.I.: investigation, validation. Q.C.: investigation, data curation. N.C.: supervision, writing—review & editing. All authors have read and agreed to the published version of the manuscript.

Funding

This study was supported by Grant-in-Aid for JSPS Research Fellow (Grant number: 19J22658).

Institutional Review Board Statement

Not applicable.

Informed Consent Statement

Not applicable.

Data Availability Statement

The data that support the findings of this study are available from the corresponding author upon reasonable request.

Acknowledgments

The authors would like to thank Mitsuyasu Iwanami, a professor at the Tokyo Institute of Technology and Kazuhide Nakayama, an assistant professor at the Tokyo Institute of Technology for their advice in carrying out this study.

Conflicts of Interest

The authors declare no conflict of interest.

Appendix A

Separated Modeling of Aggregate and Mortal

In analytical investigation, aggregate and mortal were separately modeled and randomly placed. The mesh size was significantly smaller than the aggregate size in this model, thus it is out of assumption as to the composite behavior of aggregate and paste in a smeared crack model. Figure A1 shows the comparison between homogenized concrete model and separated modeling in the beam analysis of the ST-100 case. Two models that had the same meshing and material properties in homogenized concrete model as shown in Table 3 given from cylinder test. Post-cracking stiffness of homogenized concrete model was lower than experimental result, while maximum load and crack distribution in ultimate state were almost same. It seemed to be caused by high resistance of crack progress in the local region by aggregate. More accurate averaged strain and averaged stress relationship in extremely fine mesh reproduced by homogenized concrete model by tension stiffening requires more consideration.
Figure A1. Comparison of separated and homogenized concrete modeling.
Applsci 12 01079 g0a1

References

  1. Tuutti, K. Corrosion of Steel in Concrete. Ph.D. Thesis, Lund University, Lund, Sweden, 1982. [Google Scholar]
  2. Page, C.L. Mechanism of corrosion protection in reinforced concrete marine structures. Nature 1975, 258, 514–515. [Google Scholar] [CrossRef]
  3. Alonso, C.; Andrade, C.; Gonzalez, J.A. Relation between resistivity and corrosion rate of reinforcements in carbonated mortar made with several cement types. Cem. Concr. Res. 1988, 18, 687–698. [Google Scholar] [CrossRef]
  4. Coronelli, D.; Gambarova, P. Structural Assessment of Corroded Reinforced Concrete Beams: Modeling Guidelines. J. Struct. Eng. 2004, 130, 1214–1224. [Google Scholar] [CrossRef]
  5. Aldea, C.; Shah, S.; Karr, A. Effect of cracking on water and chloride permeability of concrete. J. Mater. Civ. Eng. 1999, 11, 181–187. [Google Scholar] [CrossRef]
  6. Bertolini, L. Steel corrosion and service life of reinforced concrete structures. Struct. Infrastruct. Eng. 2008, 4, 123–137. [Google Scholar] [CrossRef]
  7. Al-Sulaimani, G.J.; Kaleemullah, M.; Basunbul, I.A.; Rasheeduzzafar. Influence of corrosion and cracking on bond behaviour and strength of reinforced concrete member. ACI Struct. J. 1990, 87, 220–231. [Google Scholar]
  8. Fang, C.; Lundgren, K.; Chen, L.; Zhu, C. Corrosion influence on bond in reinforced concrete. Cem. Concr. Res. 2004, 34, 2159–2167. [Google Scholar] [CrossRef]
  9. Rodriguez, J.; Ortega, L.M.; Casal, J. Load carrying capacity of concrete structures with corroded reinforcement. Constr. Build. Mater. 1997, 11, 239–248. [Google Scholar] [CrossRef]
  10. Cairns, J.; Du, Y.; Law, D. Structural performance of corrosion-damaged concrete beams. Mag. Concr. Res. 2008, 60, 359–370. [Google Scholar] [CrossRef]
  11. Ikeda, S.; Uji, K. Studies on the effect of bond on the shear behavior of reinforced concrete beams. J. JSCE 1980, 1980, 101–109. [Google Scholar] [CrossRef] [Green Version]
  12. Pndey, G.R.; Mutsuyoshi, H.; Maki, T.; Tanino, R. Enhancing shear capacity by controlling bond of reinforcement. In Proceedings of the Annual Conference of Japan Concrete Institute, Aichi, Japan, 22–24 June 2005; Volume 27, pp. 799–804. [Google Scholar]
  13. Lutz, L.A.; Gergely, P. Mechanics of bond and slip of deformed bars in concrete. ACI J. 1967, 64, 711–721. [Google Scholar]
  14. Goto, Y. Cracks formed in concrete around deformed tension bars. ACI J. 1971, 68, 244–251. [Google Scholar]
  15. Cairns, J.; Plizzari, G.A.; Du, Y.; Law, D.W.; Franzoni, C. Mechanical properties of corrosion-damaged reinforcement. ACI Mater. J. 2005, 102, 256. [Google Scholar]
  16. Berra, M.; Castellani, A.; Coronelli, D.; Zanni, S.; Zhang, G. Steel–concrete bond deterioration due to corrosion: Finite-element analysis for different confinement levels. Mag. Concr. Res. 2003, 55, 237–247. [Google Scholar] [CrossRef]
  17. Lee, H.S.; Noguchi, T.; Tomosawa, F. Evaluation of bond properties between concrete and reinforcement as a function of the degree of reinforcement corrosion. Cem. Concr. Res. 2002, 32, 1313–1318. [Google Scholar] [CrossRef]
  18. Sæther, I. Bond deterioration of corroded steel bars in concrete. Struct. Infrastruct. Eng. 2011, 7, 415–429. [Google Scholar] [CrossRef]
  19. Auyeung, Y.; Balaguru, P.; Chung, L. Bond behaviour of corroded reinforcement bars. ACI Mater. J. 2000, 97, 214–220. [Google Scholar]
  20. Brantschen, F.; Faria, D.; Fernández Ruiz, M.; Muttoni, A. Bond behaviour of straight, hooked, U-shaped and headed bars in cracked concrete Struct. Concr. 2016, 17, 799–810. [Google Scholar] [CrossRef]
  21. Toongoenthong, K.; Maekawa, K. Multi-Mechanical Approach to Structural Performance Assessment of Corroded RC Members in Shear. J. Adv. Concr. Technol. 2005, 3, 107–122. [Google Scholar] [CrossRef] [Green Version]
  22. Grassl, P.; Johansson, M.; Leppänen, J. On the numerical modelling of bond for the failure analysis of reinforced concrete. Eng. Fract. Mech. 2018, 189, 13–26. [Google Scholar] [CrossRef] [Green Version]
  23. Gedik, Y.H.; Nakamura, H.; Yamamoto, Y.; Kunieda, M. Evaluation of three-dimensional effects in short deep beams using a rigid-body-spring-model. Cem. Concr. Compos. 2011, 33, 978–991. [Google Scholar] [CrossRef]
  24. Dehestani, M.; Mousavi, S.S. Modified steel bar model incorporating bond-slip effects for embedded element method. Construct. Build. Mater. 2015, 81, 284–290. [Google Scholar] [CrossRef]
  25. Ng, P.L.; Lam, J.Y.; Kwan, A.K. Tension stiffening in concrete beams. Part 1: FE analysis. Proc. Inst. Civ. Eng. Struct. Build 2010, 163, 19–28. [Google Scholar] [CrossRef] [Green Version]
  26. An, X.; Maekawa, K.; Okamura, H. Numerical Simulation of Size Effect in Shear Strength of RC Beams. J. Mater. Conc. Struct. Pavement 1997, 564, 297–346. [Google Scholar] [CrossRef] [Green Version]
  27. Massicotte, B.; Elwi, A.E.; MacGregor, J.G. Tension-stiffening model for planar reinforced concrete members. J. Struct. Eng. 1990, 116, 3039–3058. [Google Scholar] [CrossRef]
  28. Maekawa, K.; Okamura, H.; Pimanmas, A. Nonlinear Mechanics of Reinforced Concrete; Spon Press: London, UK, 2003; ISBN 978-0-415-27126-4. [Google Scholar]
  29. Fujiyama, C.; Maekawa, K. A computational simulation for the damage mechanism of steel-concrete composite slabs under high cycle fatigue loads. J. Adv. Concr. Technol. 2011, 9, 193–204. [Google Scholar] [CrossRef] [Green Version]
  30. Song, H.; You, D.; Byun, K.; Maekawa, K. Finite element failure analysis of reinforced concrete T-girder bridges. Eng. Struct. 2002, 24, 151–162. [Google Scholar] [CrossRef]
  31. Chijiwa, N.; Maekawa, K. Thermo-hygral case-study on full scale RC building under corrosive environment and seismic actions. J. Adv. Concr. Technol. 2015, 13, 465–478. [Google Scholar] [CrossRef] [Green Version]
  32. Biswas, R.; Iwanami, M.; Chijiwa, N.; Uno, K. Effect of non-uniform rebar corrosion on structural performance of RC structures: A numerical and experimental investigation. Constr Build. Mater. 2020, 230, 116908. [Google Scholar] [CrossRef]
  33. Maekawa, K.; Takemura, J.; Irawan, P.; Irie, M. Triaxial elasto-plastic and continuum fracture model for concrete. Proc. JSCE 1993, 460, 131–138. [Google Scholar] [CrossRef] [Green Version]
  34. Okamura, H.; Maekawa, K.; Sivasubramaniyam, S. Verification of modeling for reinforced concrete finite element. In Proceedings of the Finite Element Analysis of Reinforced Concrete Structures, Tokyo, Japan, 21–24 May 1985; Volume ASCE; pp. 528–543. [Google Scholar]
  35. Vecchio, F.J.; Collins, M.P. The modified compression-field theory for reinforced concrete elements subjected to shear. ACI J. 1986, 83, 219–231. [Google Scholar]
  36. Li, B.; Maekawa, K.; Okamura, H. Contact density model for stress transfer across cracks in concrete. J. Fac. Eng. 1989, 40, 9–52. [Google Scholar]
  37. Baltay, P.; Gjelsvik, A. Coefficient of friction for steel on concrete at high normal stress. J. Mater. Civ. Eng. 1990, 2, 46–49. [Google Scholar] [CrossRef]
  38. Maekawa, K.; Fukuura, N.; Soltani, M. Path-dependent high cycle fatigue modeling of joint interfaces in structural concrete. J. Adv. Concr. Technol. 2008, 6, 27–242. [Google Scholar] [CrossRef] [Green Version]
  39. Limestone Association of Japan. Limestone Aggregate and Concrete; Limestone Association of Japan: Tokyo, Japan, 2005; pp. 10–14. (In Japanese) [Google Scholar]
  40. Asamoto, S.; Ishida, T.; Maekawa, K. Investigation into volumetric stability of aggregates and shrinkage of concrete as a composite. J. Adv. Concr. Technol. 2008, 6, 77–90. [Google Scholar] [CrossRef] [Green Version]
  41. Hashin, Z. The elastic moduli of heterogeneous materials. J. Appl. Mech. 1962, 29, 143–150. [Google Scholar] [CrossRef]
  42. Hansen, T.C. Influence of aggregate and voids on modulus of elasticity of concrete, cement mortar, and cement paste. ACI J. Proc. 1965, 62, 193–216. [Google Scholar]
  43. Muthulingam, S.; Rao, B.N. Non-uniform corrosion states of rebar in concrete under chloride environment. Corros. Sci. 2015, 93, 267–282. [Google Scholar] [CrossRef]
Figure 1. Specimen geometry (top: ST-0, ST-100 as examples, bottom: PL-50 as an example).
Applsci 12 01079 g001
Figure 2. Measurement positions for main rebar strain.
Applsci 12 01079 g002
Figure 3. Load–deflection curve (left: PL series, right: ST series).
Applsci 12 01079 g003
Figure 4. Crack pattern (thick line: dominant cracks at failure, shaded area: concrete spoiled area at failure).
Applsci 12 01079 g004
Figure 5. Main rebar strain distribution (PL series).
Applsci 12 01079 g005
Figure 6. Main rebar strain distribution (ST series).
Applsci 12 01079 g006
Figure 7. Outline of analysis model.
Applsci 12 01079 g007
Figure 8. Constitutive law of concrete and joint element model.
Applsci 12 01079 g008
Figure 9. Outline of pull-out test.
Applsci 12 01079 g009
Figure 10. FE analysis model (half slice view).
Applsci 12 01079 g010
Figure 11. Rebar pull-out test reproduction analysis results (left: threaded bar, right: round PC bar).
Applsci 12 01079 g011
Figure 12. Reproduction FE analysis results.
Applsci 12 01079 g012
Figure 13. Analysis results (effect of lug height loss).
Applsci 12 01079 g013
Figure 14. Pull-out test results.
Applsci 12 01079 g014
Figure 15. Analysis results (non-uniform lug loss region).
Applsci 12 01079 g015
Figure 16. Analysis results (effect of non-uniform lug loss in axial direction of rebar).
Applsci 12 01079 g016
Figure 17. Flexural crack distribution before shear cracking (non-uniform loss of lugs in axial direction).
Applsci 12 01079 g017
Figure 18. Interlock loss progress on a lug with corrosion.
Applsci 12 01079 g018
Figure 19. Interlock loss progress as an entire member with corrosion.
Applsci 12 01079 g019
Table 1. List of specimens.
NameArea with InterlockStirrupOutline of Experimental SpecimensRemark
ST-100100%Placing Applsci 12 01079 i001
Deformed bar as main rebar
Sound specimen
PL-100100%Not placing
ST-5050%Placing Applsci 12 01079 i002
Deformed bar as main rebar
Applsci 12 01079 i003
Exposing underside of main rebar
PL5050%Not placing
ST-00%Placing Applsci 12 01079 i004
Round bar as main rebar
No lugs
PL-00%Not placing
Table 2. Mix proportions of concrete.
ConditionsUnit Content (kg/m3)
W/C (%)s/a (%)Slump (cm)Air Content (%)WaterCementSandGravelAdmixture
42.541.1124.517340869710334.08
Cement: Ordinary Portland cement, density 3.13 g/cm3. Fine aggregate: Crushed and natural mixed sand, specific gravity 2.60 g/cm3. Coarse aggregate: crushed limestone, maximum size 20 mm, specific gravity 2.69 g/cm3. Chemical admixture: Polycarboxylic acid-based AE water reducing agent, density 1.04 g/cm3.
Table 3. Characteristics of materials used.
Main RebarConcrete
Screw BarRound Rebar
(PC Rod)
TypeUSD685ASBPR 1080/1270Compressive strength (N/mm2)39.7
Yield strength (N/mm2)7101189Elastic modulus (kN/mm2)27.5
Tensile strength (N/mm2)8831270Tensile strength (N/mm2) *2.67
* Estimated value from compressive strength based on JSCE Standard Specifications.
Table 4. Material property values in analysis model.
Mortar ElementAggregate Element
Compressive strength (N/mm2)39.7140
Tensile strength (N/mm2)2.6710
Elastic modulus (kN/mm2)18.851.8
Table 5. List of analysis cases.
Focus PointLug Height LossNon-Uniform Lug Loss Region on Cross Section
Case nameLugH-75%LugH-50%LugH-25%Bottom-0%Outer-0%Side-0%
Lug loss region Applsci 12 01079 i005 Applsci 12 01079 i006 Applsci 12 01079 i007 Applsci 12 01079 i008 Applsci 12 01079 i009 Applsci 12 01079 i010
Lug loss ratio25%50%75%50%66.6%66.6%
RemarkLug height 75%Lug height 50%Lug height 25%Bottom sideBottom side and outsidestwo outer rebars
Focus pointNon-uniform lug loss in axial direction
Case nameLugInt-1 cmLugInt-3.5 cmLugInt-7 cm
Lug loss region Applsci 12 01079 i011
Applsci 12 01079 i012
Applsci 12 01079 i013
Applsci 12 01079 i014
Applsci 12 01079 i015
Applsci 12 01079 i016
Lug loss ratio50%50%50%
RemarkIntermittent lug loss
(1 cm interval)
Intermittent lug loss
(3.5 cm interval)
Intermittent lug loss
(7 cm interval)
Publisher’s Note: MDPI stays neutral with regard to jurisdictional claims in published maps and institutional affiliations.

