Article

Production and Characterization of Yogurt-Like Fermented Beverage Based on Camelina (Camelina sativa L.) Seed Press Cake

by
Łukasz Łopusiewicz
1,*,
Paweł Kwiatkowski
2 and
Emilia Drozłowska
1
1
Center of Bioimmobilisation and Innovative Packaging Materials, Faculty of Food Sciences and Fisheries, West Pomeranian University of Technology Szczecin, Janickiego 35, 71-270 Szczecin, Poland
2
Department of Diagnostic Immunology, Chair of Microbiology, Immunology and Laboratory Medicine, Pomeranian Medical University in Szczecin, Powstańców Wielkopolskich 72, 70-111 Szczecin, Poland
*
Author to whom correspondence should be addressed.
Appl. Sci. 2022, 12(3), 1085; https://doi.org/10.3390/app12031085
Submission received: 10 November 2021 / Revised: 14 January 2022 / Accepted: 19 January 2022 / Published: 20 January 2022
(This article belongs to the Special Issue New Innovations in Plant-Based Dairy Alternatives)

Abstract

:
Plant-based fermented beverages are growing in popularity due to the rise in vegetarianism, health trends and ethical concerns. In this study, camelina (Camelina sativa L.) seed press cake (CPC, 15% and 20% w/w) was fermented using yogurt starter culture. The physicochemical properties of the samples, including pH, total acidity, color, viscosity, texture and rheological properties were investigated. Moreover, the lactic acid bacteria (LAB) viability, bioactive compounds and antioxidant activity were determined. During fermentation and 28-day refrigerated storage, the samples achieved a mean viable bacterial count of at least 1010 CFU/g, which is higher than the recommended bacteria level for traditional dairy yogurt (106 CFU/g). A significant acidification, consumption of reducing sugars, increase in free amino acids and polyphenolics was observed. In addition, CPC-based fermented samples showed good antioxidant potential. Textural and rheological characteristics were similar to dairy yogurt. Moreover, fermentation improved the sensory attributes of CPC, meeting consumers’ acceptance criteria. Thus, the study indicated that fermentation had a marked effect on the physicochemical, microbiological and functional properties of CPC. Therefore, the fermented CPC-based beverage has the potential to be a valid, value-added and novel alternative to dairy-based yogurt.

1. Introduction

The consumption of cold-pressed oils has been steadily increasing in recent years due to the promotion of a balanced diet, of which functional foods are a pivotal part. However, this produces large amounts of by-products [1]. The possibility of biotransforming a large amount of low-cost by-products from the vegetable oil industry into new, valuable food products is enticing. Recently, there has been an emphasis on the topics of zero waste and circular economy [2]. In particular, oil cakes, deriving from minor oilseed crops, are considered as interesting by-products due to their high protein content and bioactive compounds that could be successfully explored as valuable plant-derived feedstock for food applications [2,3,4,5]. Furthermore, the need to develop new products from agro-industrial by-products is also driven by consumer expectations for more ecological, sustainable and plant-based alternatives to foods of animal origin.
Currently, not only are vegetarian and vegan diets in demand but also flexitarian diets. Moreover, consumers are looking for alternatives to dairy products due to ecological, health and ethical concerns. Yogurt is a globally produced fermented beverage based on animal milk. It is an important part of the human diet, served as a snack or part of breakfast. The lactic acid bacteria (LAB) are responsible for the yogurt formation via milk fermentation. Lactobacillus delbrueckii subsp. bulgaricus and Streptococcus thermophilus are mainly used to obtain a favorable taste and aroma. In addition to sensory qualities, an adequate LAB content is also important. It is widely accepted that to maintain its functionality, the LAB content should not be lower than 106 CFU/g or mL of the product [6]. Therefore, when developing plant-based dairy alternatives, it is very important to find matrices that can provide a good habitat for the bacteria.
At present, cold-pressed oils are the most popular vegetable fats consumed in Poland because of their health-promoting activities [1]. Camelina sativa L., (also known as “false flax”) is one of the oldest crops from the Brassicaceae family (used for oil production for 3000 years [1,7,8,9]. It receives attention for its oil, rich in beneficial ω-3 (linolenic acid) and ω-6 (linoleic acid) fatty acids [1,3,7,10,11,12]. For instance, in Poland camelina oil is used as a food supplement, registered under the name “Olej rydzowy tradycyjny” as a Traditional Speciality Guaranteed product in the European Union and the United Kingdom [1,13,14]. Camelina is an oil plant native to northern Europe and central Asia; however, it is mainly cultivated in Western Europe (Poland, Ukraine), Canada and the US [9]. Currently, the area of camelina cultivation has increased both in Europe and North America [9]. Residues from the oil industry can be used as co-products for high value-added products, food additives or supplements [2]. Camelina oil pressing also yields high value press cake (CPC—camelina press cake) with low residual oil content (5–15%). Previous reports underlined that press cake contains a good amount of crude proteins (protein content 35–40%, with the presence of important essential amino acids, such as lysine, methionine and cysteine), insoluble fiber, carbohydrates, minerals and phytochemicals (such as phenolic compounds, carotenoids, fatty acids, phytosterols and vitamins) [3,7,8,10,15,16,17]. Therefore, CPC is a promising substrate as a supplement or base for new food products. New food products can be developed from two categories of ingredients: first, these are new, alternative ingredients never before used in a regular way in food products, and second, they are obtained by valorizing by-products [2]. Fermentation, an ancient food biotechnology is still widely employed in the food industry to extend shelf life as well as to improve the nutritional and sensory attributes of foods [18]. A large number of studies have demonstrated that fermented edible seeds and their by-products exhibit manifold bioactivities (such as antioxidant, antihypertensive and anticancer effects) [4,5,6,18,19,20] as well as being used in the preparation of innovative food products [2,21,22]. For instance, Olukomaiya et al. described the positive effect of semi-solid fermentation in improving the nutritional value and bioactivity of various oilseed press cakes including camelina pressed seeds [8]. There is one important difference between camelina and other plants in the Brassicaceae family: it contains a large amount of polysaccharides and mucilage that can be used as a prebiotic matrix in the fermentation process. Many authors have described the positive effect of mucilage on bacterial growth [23,24]. Mucilage can act as a prebiotic that increases bacterial growth and viability. According to Bãtrîna et al. [25], camelina oil can inhibit the growth of pathogenic bacteria and, on the other hand, is able to promote LAB growth. LAB are used in the fermentation process of yogurt. As mentioned, CPC contains a small amount of residual oil (<15% w/w). In light of these facts, it can be hypothesized that CPC may be a promising matrix for fermentation to develop plant-based dairy alternatives.
Previous works have shown the positive effect of fermenting a mucilage-rich matrix, flaxseed cake to produce a yogurt, kefir and probiotic drink as dairy plant-based alternatives [5,6,19]. Several similarities can be observed between camelina and flax. Both plants are used as a source of oil, are rich in protein and can be used to extract mucilage. Moreover, they are widely grown for their agronomic advantages such as high adaptability, low water, nutrient requirements, and good tolerance to pathogens.
Although camelina has been shown to contain many bioactive components and provide numerous health benefits, its potential as a substrate for the development of new food products has not been fully exploited. There is scarce available data about the application of CPC as a matrix for the development of yogurt-like beverages. Therefore, the purpose of the present study was the fermentation of CPC with yogurt culture to obtain novel products and the analysis of physicochemical properties and bioactivity during the storage time.

2. Materials and Methods

2.1. Materials and Reagents

Camelina press cake (CPC) obtained via cold pressing was procured from Olejarnia Niwki (Niwki, Poland). Based on manufacturer’s data the proximate composition of CPC were: solids content 92.59%, ash content 5.39%, protein content 34.95%, fat content 14.12%, carbohydrates 24.51%, fiber 13.62%. Commercial yogurt starter culture (YO 122) consisting of Streptococcus salivarius subsp. thermophilus and Lactobacillus delbrueckii subsp. bulgaricus was purchased from Biochem Srl (Via Salaria, Italy). Sodium hydroxide, hydrogen peroxide, disodium phosphate, monosodium phosphate, 2,2-diphenyl-1-picrylhydrazyl (DPPH), 2,2′-azino-bis(3-ethylbenzothiazoline-6-sulfonic acid) (ABTS), methanol, Folin–Ciocalteu reagent, sodium chloride, sodium carbonate, gallic acid, 3,5-dinitrosalicylic acid, sodium tartrate tetrahydrate, acetic acid, sodium acetate, potassium ferricyanide, trichloroacetic acid, ferric chloride, ninhydrin, glacial acetic acid, cadmium chloride, glycine, ferric chloride hexahydrate and 2,4,6-tripyridyl-s-triazine (TPTZ) were purchased from Merck (Merck, Darmstadt, Germany). Glucose, hydrochloric acid and ammonium thiocyanate were supplied from Chempur (Chempur, Piekary Śląskie, Poland). All reagents were of analytical grade. MRS (de Man, Rogosa and Sharpe) agar, VRBG (Violet Red Bile Glucose) agar, XLD (Xylose, Lysine, Deoxycholate) agar and Sabouraud agar with chloramphenicol were obtained from Merck (Merck, Darmstadt, Germany).

2.2. The Preparation of Beverages and Fermentation

CPC was ground and mixed with hot (80 °C) distilled water to obtain two concentrations of 15% and 20% (w/w). The solutions were boiled for 20 min with constant stirring, cooled and homogenized using a home mixer. Finally, the mixtures were pasteurized (60 °C, 30 min) and stored for further steps. Then, the samples were inoculated with 0.5 g of yogurt starter culture YO 122. Freshly inoculated samples were used for the baseline data. The remaining yogurt-like beverages were bottled into sterile, low-density polyethylene cups (50 mL capacity), tightly covered and incubated at 37 °C for 24 h. Subsequently, incubated samples were stored for 28 days at 5 ± 1 °C in the dark.

2.3. Determination of Microbiological Quality and LAB Viability during Storage

To determine microbial quality (presence of bacterial and fungal pathogens) of the samples after thermal treatment and pasteurization as well as during storage time, the assay of bacterial and fungal counts was carried out. Enumeration of total coliforms, Salmonella sp. and fungi was performed using VRBG agar, XLD agar and Sabouraud agar supplemented with 150 ppm of chloramphenicol, respectively. Inoculated plates were after incubated at 30 °C for 24 h for bacterial counts, whereas the plates for fungal counts were incubated at 25 °C for 72 h [26]. The LAB viability was determined as described elsewhere [5], and the viable microbial counts were expressed as CFU/g of the samples.

2.4. Determination of pH, Titratable Acidity (TA), Total Solids Content (TSC), and Color Measurements

For pH and TA determination, samples (10 g) were collected and diluted in 90 mL of sterile saline solution (0.9% NaCl) throughout the storage period and measured directly at 25 °C using a pH meter (CP-411, Elmetron, Zabrze, Poland). TA was determined by mixing 10 mL of the prepared dilutions with 10 mL of distilled water and titrating with 0.01 M NaOH solution, using phenolphthalein (0.1%, w/v in 95% ethanol) as an indicator [4]. Total solids content (TSC) of the samples was evaluated following the standard method (no. 925.23) of AOAC (Association of Official Agricultural Chemists) [27]. All samples were measured for color during the storage time by a Konica Minolta CR-5 colorimeter (Konica Minolta, Osaka, Japan). The values measured were L * (white 100/black 0), a * values (red positive/green negative) and b * values (yellow positive/blue negative). Additionally, ∆E (total color difference) compared to non-fermented samples (used as standards), was also calculated as follows
∆E = [(Lstandard − Lsample)2 + (astandard − asample)2 + (bstandard − bsample)]0.5

2.5. Preparation of Extracts

The samples were lyophilized for 24 h (chamber pressure 0.190 mbar, shelf temperature Tmin = −35 °C, Tmax = 20 °C, condenser temperature −85 °C) using a Beta 2–8 LSC plus lyophilizer (Martin Christ Gefriertrocknungsanlagen GmbH, Osterode am Harz, Germany). One gram of lyophilized samples were mixed with 50 mL of methanol/water solution (7:3 v/v), then extracted in an ultrasonic bath (Elmasonic S30H, Elma Schmidbauer GmbH, Singen, Germany) for 15 min. The obtained extracts were centrifuged at 14,000 rpm for 10 min at 20 °C (Centrifuge 5418 Eppendorf, Warsaw, Poland) and subsequently filtered using 0.22 µm nylon membrane filters (Sigma-Aldrich, Darmstadt, Germany). The resulting clear extracts served for further analyses.

2.6. Determination of the Reducing Sugars Content (RSC), Total Free Amino Acids (TFAA) and Total Phenolic Content (TSC)

The RSC was determined by the DNS (3,5-dinitrosalicylic acid) method as described elsewhere [19]. Briefly, 1 mL of each extract was mixed with 1 mL of 0.05 M acetate buffer (pH 4.8) and 3 mL of DNS reagent, then shaken vigorously. The mixtures were incubated in boiling water for 5 min, and cooled at room temperature. The absorbance value was measured at 540 nm using a microplate reader (Synergy LX, BioTek, Winooski, VT, USA) by placing the samples in a 96-well microplate. Glucose (0.01–10 mg/mL) in acetate buffer was used for the calibration curve.
Total free amino acid (TFAA) were analyzed following previously described methodology using Cd-ninhydrin reagent [4]. Exactly 1 mL of extracts were mixed with 2 mL of a Cd-ninhydrin reagent. The samples were shaken, heated at 84 °C for 5 min, cooled in ice water and the absorbance at 507 nm was determined by the use of UV–VIS Thermo Scientific Evolution 220 spectrophotometer (Waltham, MA, USA). The results were expressed as mg glycine (Gly) per gram of sample with respect to the standard curve including the dilution factor. The standard curve was first prepared using glycine (0.01–10 mg/mL).
TPC was determined by the Folin–Ciocalteu method as described by Tong et al. [28]. To 100 µL of extracts, 6 mL of distilled water and 0.5 mL of Folin–Ciocalteu reagent were added. After 3 min of incubation, 1.5 mL of saturated Na2CO3 solution was added. In the next step, the mixtures were incubated for 30 min in the dark at 40 °C. The absorbance of the mixtures was measured at 765 nm. TPC was expressed as mg gallic acid equivalents (GAE) per mL of sample (mg GAE/mL).

2.7. Antioxidant Activity Measurements

For the antioxidant properties of the CPC-based beverages, ABTS, DPPH radicals scavenging activities test as well as FRAP test were chosen. Additionally, the reducing power was evaluated.
Briefly, DPPH radical scavenging activity was determined by mixing 1 mL of extracts with 1 mL of 0.01 mM DPPH methanolic solution. Absorbance was determined at 517 nm. Three mL of ABTS·+ solution were mixed with 50 µL of extracts and absorbance was measured at 734 nm [4]. For FRAP assessment, 25 mL of acetate buffer (300 mM), 2.5 mL of 2,4,6-tripyridyl-s-triazine (TPTZ) solution (10 mM in 40 mM HCl) and 2.5 mL of ferric chloride hexahydrate aqueous solution (20 mM) were mixed. To 300 μL of FRAP reagent in a microcentrifuge tube, 10 μL of extracts were added and vortexed for 10 s. Absorbance was measured at 593 nm [29]. For the determination of reducing power, the extracts (500 μL) were placed in tubes to which 1.25 mL of phosphate buffer solution (0.2 M, pH 6.6) and 1.25 mL of 1% potassium ferricyanide solution were added. After incubation at 50 °C for 20 min, 1.25 mL of trichloroacetic acid solution was added to the tubes. The 1.25 mL of supernatant obtained by centrifugation at 3000 rpm for 10 min was diluted with 1.25 mL of deionized water. Finally, 0.25 mL of 0.1% ferric chloride solution was added to complete the determination the reduction of ferric ion (Fe3+). The reducing power was determined as absorbance at 700 nm [4].

2.8. Rheology and Texture Measurements

The viscosity and viscoelastic measurements were performed with a rotational rheometer (AR G2, TA Instruments Ltd., New Castle, DE, USA). The samples were analyzed at 20 °C in both tests using a stainless steel cone plate (diameter = 40 mm). Steady-state flow measurements were carried out at a shear rate 50 s−1 [19]. The viscoelastic properties of the samples were evaluated using frequency oscillatory shear tests at 20 °C. The changes in modulus G′ and G″ were monitored at angular frequency from 0.1 to 100 Hz and constant strain 1%. The oscillatory rheological parameters used to compare the viscoelastic properties of beverage samples were elastic storage modulus (G″) and viscous or loss modulus (G″). The data were obtained and analyzed by the TA Rheology Advantage Data Analysis equipment software V 5.4.7. (TA Instruments, New Castle, DE, USA) [30].
Zwick/Roell 2.5 Z instrument (Zwick/Roell, Ulm, Germany) with a cylindrical probe (diameter 40 mm) was used to perform texture profiles assays. The samples were analyzed directly (at room temperature), the penetration speed into the samples was 10 mm/s and the penetration depth was 25 mm. All texture coordinates were calculated from the results of the force–time curves [4].

2.9. Sensory evaluation

Sensory evaluation was conducted according to recommendations described in ISO 13299: 2003 [31]. The sensory panel consisted of ten members (five males and five females, age range 25–55). The samples were evaluated for six sensor attributes (color, smell, consistency, mouthfeel, taste and overall acceptability) using a 5-point hedonic scale, where: 5 was excellent and 1 was extremely poor. An overall acceptability value ≥ 4.00 was considered acceptable by the panelists. Tap water was provided between samples to cleanse the palate.

2.10. Statistical Analyses

All experiments were replicated three times. All data have been expressed as mean ± standard deviation (SD). Statistical significance was tested by analysis of variance (two-way ANOVA) and followed by Fisher’s NIR test. All analyses were conducted using Statistica version 10 (StatSoft Polska, Kraków, Poland). Values were considered as significantly different when p < 0.05.

3. Results and Discussion

3.1. The Changes in pH, TA, TSC, LAB Viability and Color

The microbiological quality of food products is particularly pertinent in view of the fact that microbial contamination can reduce or even eliminate the safety of consumption and cause food poisoning [32]. Pathogenic microbes (such as coliforms, Salmonella sp. or molds) presented in food products not only make them hazardous from the infectious standpoint, but, in addition, may change the chemical, physical and organoleptic properties or change the contents of the active ingredients [32]. As a result of thermal treatment and pasteurization, as well as during storage time, no coliforms, Salmonella sp. and molds were detected; therefore, it can be concluded that the products were microbiologically safe to ensure no undesirable microorganism competition for LAB. One of the key factors in the fermentation process is to improve nutritional value and sensory properties through the production of metabolites such as lactic acid, while extending shelf life by lowering the pH value [33,34]. As can be seen in Figure 1, the LAB content in the beverages markedly increased as a result of fermentation (p < 0.05). In both variants, the initial value was determined as 1.10 × 10⁸ CFU/g. The highest LAB content was observed for sample CPC-15% on day 1 (1.38 × 10¹² ± 0.09 CFU/g). This result is in agreement with the findings of Olukomaiya et al., who reported an almost three-fold increase in lactic acid bacteria counts as a result of camelina meal solid-state fermentation [8]. It should be noted that at any time, the LAB viability was maintained in the CPC-based samples over the 1010 CFU/g level. The recommended minimum for yogurt is >106 CFU/g LAB viability, and the highest obtained results are approximately two-fold higher than the recommendation. For some oil cakes, the residual oil should be considered as it is known that various oils could affect bacterial growth and the viability due to their antimicrobial properties. However, Bãtrîna et al. reported that camelina oil can stimulate LAB growth while inhibiting pathogen growth [25]. The authors suggest that fatty acids from camelina oil and other camelina compounds (such as amino acids) can nourish LAB. In fact, camelina is abundant in essential amino acids (such as leucine, valine, phenylalanine, lysine, isoleucine) [35], thus, the favorable amino acid content can induce a synergistic effect for LAB growth and make CPC an excellent matrix for fermentation. Moreover, camelina is also capable of producing mucilage, which can be used as a prebiotic material and carrier for bacteria acting as a prebiotic [11,36].
Table 1 presents the results of the pH, titratable acidity (TA) and total solids content (TSC) measurements during the storage time. The shelf life of yogurt should be around twenty days under refrigeration, and the product should maintain its own characteristics during storage [37]. The physicochemical properties of CPC were strongly modified by the fermentation process. The initial pH values were 6.28 ± 0.01 and 6.32 ± 0.05 for samples CPC-15% and CPC-20%, respectively. As a result of fermentation, a significant increase in the samples’ acidity (4.65 ± 0.01–CPC-15% and 4.56 ± 0.02–CPC-20%, respectively) was observed (p < 0.05). A decline in pH suggests an increase in the organic acids content produced by the microorganisms [8]. Acidification of the product protects against spoilage and pathogenic microorganisms, as well as being one of the main factors determining taste and aroma. TA also increased significantly during the fermentation process (p < 0.05). The highest TA content was observed for the CPC-15% sample on day 21 of storage (1.25 ± 0.14 mg lactic acid/g). The observed acidification is in line with earlier findings that reported a decrease in pH and the production of organic acids in camelina meal fermented with fungi [8,38]. The deacidification observed on day 28 could be attributed to the changes in buffering capacity, also observed in the case of other plant-based products as reported by Ghorbani et al. for soya yogurt [39]. The TSC of the samples significantly increased as a result of fermentation (p < 0.05); however, during refrigerated storage, no marked changes were noticed in either variant (p > 0.05). It should also be pointed out that the TSC of the CPC-15% sample was similar to the TSC reported for dairy full milk yogurts [40], whereas the TSC of CPC-20% was slightly lower than that reported for the Greek type of yogurt [41,42].
The changes in color parameters as well as total color difference (ΔE) are summarized in Table 2. It was observed that fermentation significantly decreased the color attributes of both variants (p < 0.05). The most noticeable change was observed for a * (redness) value. The color of fermented beverages is frequently associated with the presence of pigments in the raw material; also, changes in the storage time and pH can affect the color of fermented foods [8,19]. In fact, as shown in Table 1, the fermentation of CPC resulted in significant acidification of the matrix, thus, the observed a * decrease can be presumably linked with the stability of carotenoids [1]. Olukomaiya et al. also reported significant decrease in a * value in solid-state fermented camelina meal [8]. A similar reduction in redness as a result of fermentation was also reported for flaxseed oil cake [19] as well as for fruit juices [43]. The total color difference (∆E) ≥ 1 is considered perceptible to the human eye. It was noticed that on day 1 the ΔE values of the samples were ≤ 1.00 (1.00 ± 0.01 and 0.87 ± 0.01 for samples CPC-15% and CPC-20%, respectively); thus, only for sample CPC-15% were the changes in color attributes visually noticeable. On the other hand, the highest ΔE value (4.55 ± 0.01) was observed for sample CPC-15% on day 14.

3.2. The Changes in Bioactive Compounds and Antioxidant Activity

The changes in RSC, TFAA and TPC are summarized in Table 3. The initial values of RSC were 51.10 ± 1.05 mg/g for sample CPC-15% and 41.49 ± 0.57 mg/g for sample CPC-20%. A significant decrease in RSC was found after fermentation (p < 0.05), 38.53 ± 0.38 mg/g and 33.02 ± 0.57 mg/g for samples CPC-15% and CPC-20%, respectively. Camelina seeds contain carbohydrates in the form of monosaccharides, disaccharides, oligosaccharides, polysaccharides and fiber [11]. According to Bertacchi et al., approximately one-third of CPC is composed of carbohydrates [44]. Moreover, camelina mucilage is abundant in simple sugars such as galactose (58%), glucose (25%), rhamnose (12%) and xylose (5%) [45]. The observed decrease in RSC could be attributed to LAB metabolism, especially the consumption of available sugars to obtain energy required for growth. In fact, as presented in Figure 1, a significant increase in LAB counts was observed. However, in the present study a decreased trend of RSC was generally observed in the days following cold storage (p < 0.05). This behavior is associated with the enzymatic hydrolysis of more complex carbohydrates necessary to maintain microbial metabolic activity, as has been reported in previous studies [6,19,20]. In fact, a decrease in soluble carbohydrates was reported by Olukomaiya et al. for camelina meal solid-state fermented by food grade Aspergillus strains [8].
In general, TFAA and TPC increased after fermentation in comparison to non-fermented samples (p < 0.05). The highest TFAA was noticed for sample CPC-15% on day 1 (2.59 ± 0.11 mg Gly/g). LAB activity is not solely related to acidification, as a number of enzymatic activities lead to efficient proteolysis, thereby increasing protein digestibility and the concentration of potentially bioactive peptides [46]. Phenolic compounds are recognized as important food metabolites and are known for their antioxidant activity, playing a pivotal role in the treatment and prevention of several pathologies, such as cardiovascular and neurodegenerative diseases as well as cancer [3]. The highest TPC was observed on day 5 (8.54 ± 1.37 mg GAE/g and 8.18 ± 1.60 mg GAE/g, for samples CPC-15% and CPC-20%, respectively). Olukomaiya et al. also reported an increase in TPC in solid-state fermented camelina meal [8]. The influence of fermentation on the polyphenolic content in fermented plants has been reported in numerous studies [6,19,20]. This phenomenon was often reported as a generic effect of LAB-induced acidification that increases polyphenols’ solubilization and extractability but is mainly strain dependent from specific LAB enzymatic activities that favor the release of polyphenols from glycosylated and more complex forms, with carbohydrates showing lower activity [7,46]. This is particularly important because phenolic compounds must be in soluble form to enter the human bloodstream and exert their beneficial properties. Thus, the increased TPC can be linked with increased acidity as well as decreased RSC. However, further in-depth studies should be carried out to determine the influence of fermentation on particular bioactive compounds’ content in CPC.
Several studies reported good antioxidant activity of CPC extracts [3,7,10]. Performed tests revealed that, in general, antioxidant activity markedly increased as a result of fermentation (p < 0.05). The highest activity against ABTS radical (59.03 ± 4.27%) was noticed for sample CPC-20% on day 7, whereas the highest DPPH inhibition (62.59 ± 5.33%) was found for sample CPC-15% on day 14. This observation is consistent with studies showing that fermented plant-based foods contained significantly more antioxidants than non-fermented raw materials [6,8,19,20]. Interestingly, only slight changes in DPPH radical scavenging activity after fermentation were observed for both variants (p < 0.05). The differences can be attributed to different mechanisms of DPPH and ABTS radicals’ scavenging activity, which is based on the transfer of electrons and hydrogen atoms. In this case, ABTS more precisely evaluates the antioxidant activity of both hydrophilic and lipophilic compounds [47].

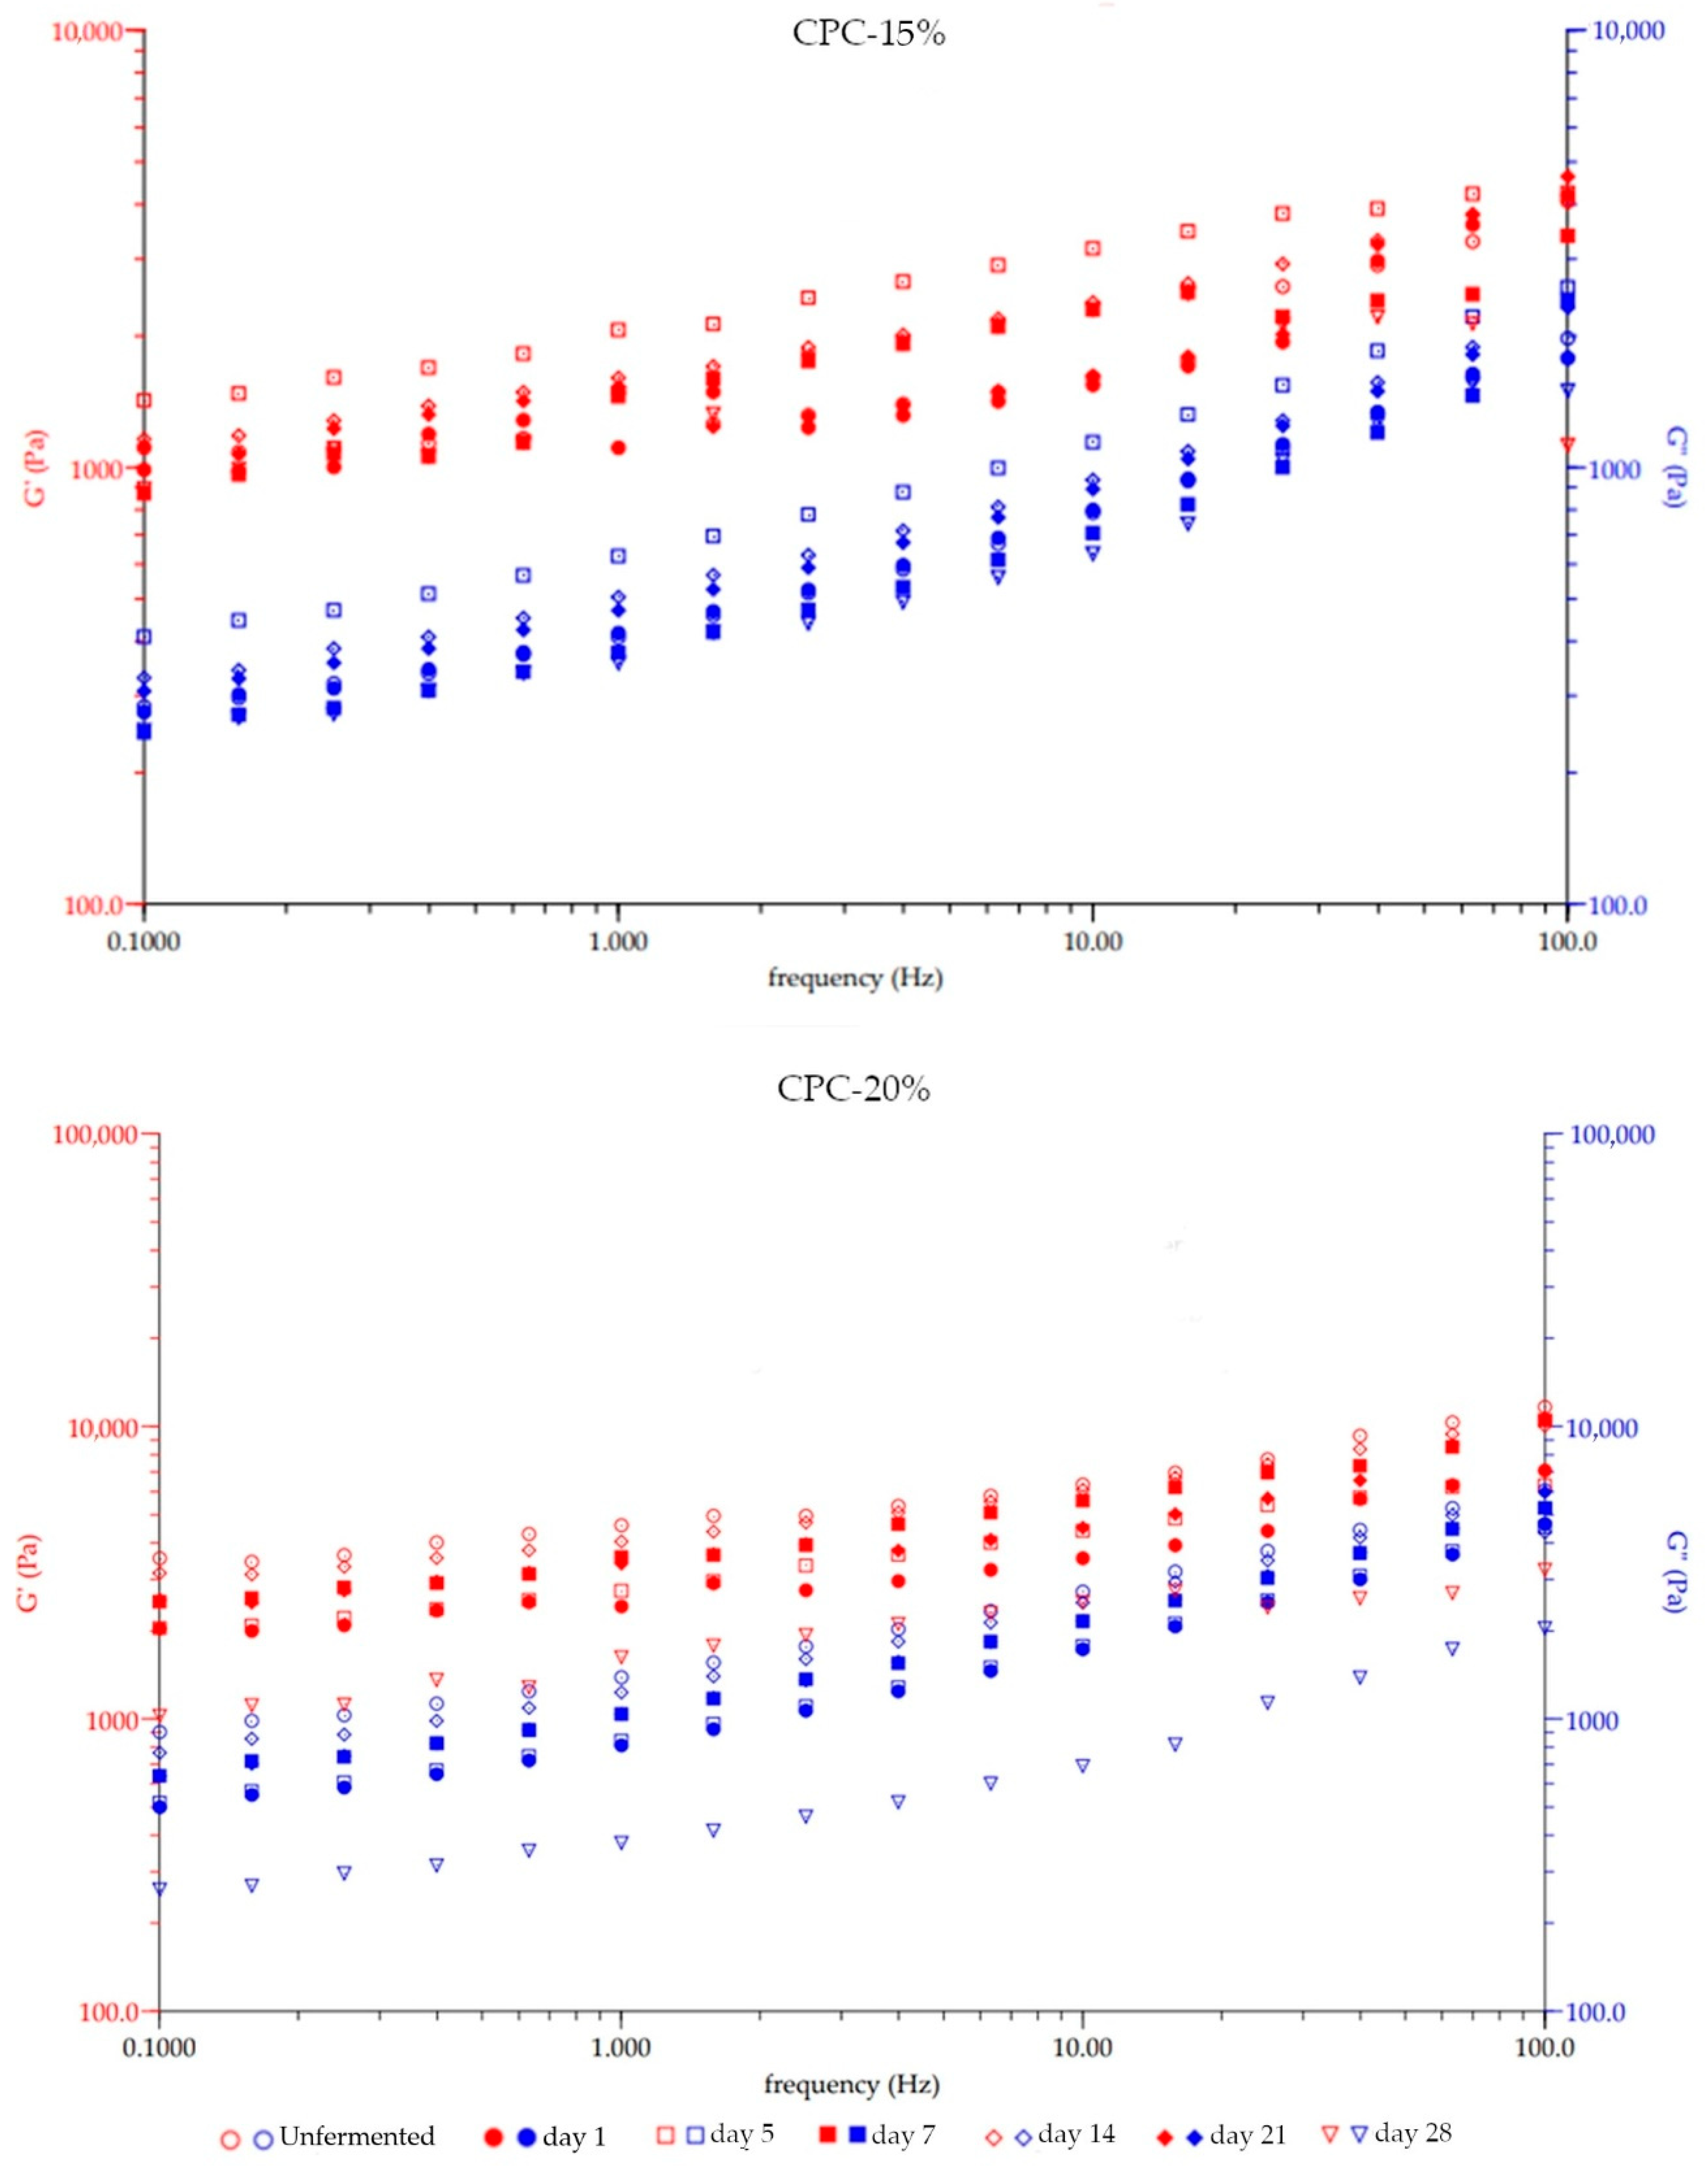
3.3. The Textural, Viscosity, and Rheological Changes

Table 4 shows the results of texture analysis. The fermentation process significantly affected the texture of the products (p < 0.05). The increase in hardness is a typical phenomenon observed for conventional milk-based yogurt. It is one of the important texture parameters in the dairy industry. These observations indicate that for camelina-based yogurts, consumers may have a sensory experience similar to the consumption of a traditional yogurt. Cohesiveness is related to hardness and expresses how well a product withstands a second deformation relative to how it behaved under the first deformation. In the presented study, it was observed that the obtained products were susceptible to deformation, which makes them more easily subjected to consumption, which can be attributed to a significant decrease in cohesiveness (p < 0.05). The samples were characterized by higher gumminess, chewiness and elasticity (p < 0.05), which gives the impression of a semi-solid structure, similar to that of traditional yogurt. It could be observed that the sample CPC-15% exhibited significantly higher viscosity than the sample CPC-20%. In both cases the viscosity significantly (p < 0.05) increased during the storage time. A similar trend was reported for soy–maize blends [48].
As can be seen in Figure 2, the G’ and G” moduli changed significantly during storage (p < 0.05). For the CPC-15% sample, both moduli increased significantly after fermentation, in contrast to the CPC-20% sample where a decrease in these parameters was noticed. For sample CPC-15% the highest G’ (974.70 Pa at 0.1 Hz) was observed on day 5, whereas the lowest (532.50 Pa at 0.1 Hz) was noticed on day 28 (p < 0.05). For the CPC-20% sample, the lowest modulus values were also observed on day 28 (664.00 Pa for G’ at 0.1 Hz and 536.90 Pa for G’’ at 0.1 Hz). It can also be noted that CPC-15% showed a higher viscosity than elasticity, contrary to CPC-20%. According to Bortnowska et al. [49], the moduli G′ (storage modulus) indicates the amount of stored energy and G″ (loss modulus) is a measure of the energy that is lost by viscous dispersion with strain. The dynamic oscillatory test is often used to determine the viscoelastic properties of food materials. It was observed that for both samples the values of G’ and G” increased with increasing frequency. According to Gul et al. [50], this behavior indicates that the samples exhibited elastic properties. A weak gel structure is characteristic of yogurt [51]. According to Sendra et al. [52], yogurts show a predominantly elastic behavior (G′ > G″). These results indicate that, rheologically, the structure obtained is similar for dairy products. Additionally, Froiio et al. [30] stated that for plant-based, yogurt-like products, these results indicate that the selected matrix is able to represent a stable structure similar to that of dairy yogurt.

3.4. Sensory Evaluation Results

From the point of view of the consumers, beverages based on by-products should be, visually and in textural terms, as homogeneous as milk-based products [53,54]. In fact, the most important indicators of the quality of a fermented product are its sensory features, and the most important sensory characteristics of fermented products that are decisive for consumers are taste and aroma [55,56]. Sensory evaluation scores of the fermented and control samples are summarized in Table 5. The initial smell was described by panelists as “bitter”, “irritating” or “pungent”, characteristic of mustard. In fact, C. sativa seeds contain sulfur-containing compounds called glucosinolates. These compounds cause the pungent flavor associated with mustards and they are present to a greater or lesser extent in other members of the Brassicaceae family [57,58]. After fermentation, the panelists indicated that the taste and smell changed significantly to pleasant and slightly acidic (p < 0.05), which can be linked with the production of lactic acid (Table 1). On day 14 the highest scores for smell and taste were noted; however, scores decreased on subsequent days because they were considered too intense (p < 0.05). Presumably, the disappearance of bitter flavor notes as a result of fermentation may be linked to the degradation of glucosinolates by LAB, but this requires more in-depth research. In fact, the ability of various LAB strains to cause glucosinolates’ degradation and conversion into bioactive functional compounds that exert antioxidative, antiinflammatory and anticarcinogenic effects was reported [59,60]. Changes in color were also noticeable to the panelists (p < 0.05); these results are consistent with the ΔE values (Table 2). It was indicated that the product had an attractive pale yellow color; however, it began to darken slightly during storage. An increase in consistency and mouth feel scores was noticed (p < 0.05). However, on day 28 the panelists indicated a slightly lower rating than on days 14 and 21 due to an increase in viscosity and difficulty in sticking to the palate (“too vicious”). Moreover, the panelists indicated that on day 1, the cohesiveness of the beverages was too low. To sum up, it can be stated that the overall acceptability shifted from unacceptable (3.1 ± 0.19 and 2.6 ± 0.10 for non-fermented CPC-15% and CPC-20%, respectively) to acceptable by consumers (4.0 ± 0.01 for sample CPC-15% on day 1, and 4.4 ± 0.31 for sample CPC-20% on day 5).

4. Conclusions

In conclusion, our research has proven the significant potential of CPC as a raw material for biotransformation into a functional product fermented with yogurt starter cultures. The obtained textural and rheological properties can mimic the structure of dairy yogurts. Camelina is also a good environment for LAB growth, which was confirmed by the results of microbiological analyses and the obtained bacterial viability higher than recommended for this type of product. Nowadays, the health effect of vegan food is also important for consumers. In this study, attention was paid to the antioxidant (including antiradical) capacity of the obtained yogurt-like beverages. In the light of the obtained results, CPC-based yogurt-like beverages, due to the high content of bioactive compounds (such as polyphenolics and flavonoids) and the high viability of LAB in the matrices (over 1010 CFU/g), can be proposed as a new functional product suitable for vegans and vegetarians.

Author Contributions

Ł.Ł.—Conceptualization, data curation, formal analysis, investigation, methodology, supervision, visualization, writing—original draft, funding acquisition; E.D.—data curation, formal analysis, investigation; P.K.—formal analysis. All authors have read and agreed to the published version of the manuscript.

Funding

This research was funded by the National Centre for Research and Development (NCBR) (Grant No. LIDER 41/0141/L-11/19/NCBR/2020).

Institutional Review Board Statement

Not applicable.

Informed Consent Statement

Not applicable.

Data Availability Statement

The data presented in this study are available on request from the corresponding author.

Acknowledgments

The authors thank Paulina Trocer and Daria Paradowska for their help in conducting analyses.

Conflicts of Interest

The authors declare no conflict of interest.

References

  1. Kurasiak-Popowska, D.; Rynska, B.; Stuper-Szablewska, K. Analysis of distribution of selected bioactive compounds in Camelina sativa from seeds to pomace and oil. Agronomy 2019, 9, 168. [Google Scholar] [CrossRef] [Green Version]
  2. Ancuţa, P.; Sonia, A. Oil press-cakes and meals valorization through circular economy approaches: A review. Appl. Sci. 2020, 10, 7432. [Google Scholar] [CrossRef]
  3. Tavarini, S.; De Leo, M.; Matteo, R.; Lazzeri, L.; Braca, A.; Angelini, L.G. Flaxseed and camelina meals as potential sources of health-beneficial compounds. Plants 2021, 10, 156. [Google Scholar] [CrossRef] [PubMed]
  4. Łopusiewicz, Ł.; Drozłowska, E.; Tarnowiecka-Kuca, A.; Bartkowiak, A.; Mazurkiewicz-Zapałowicz, K.; Salachna, P. Biotransformation of Flaxseed Oil Cake into Bioactive Camembert-Analogue Using Lactic Acid Bacteria, Penicillium camemberti and Geotrichum candidum. Microorganisms 2020, 8, 1266. [Google Scholar] [CrossRef]
  5. Łopusiewicz, Ł.; Drozłowska, E.; Trocer, P.; Kostek, M.; Kwiatkowski, P.; Bartkowiak, A. The Development of Novel Probiotic Fermented Plant Milk Alternative from Flaxseed Oil Cake Using Lactobacillus rhamnosus GG Acting as A Preservative Agent Against Pathogenic Bacteria During Short-term Refrigerated Storage. Emirates J. Food Agric. 2021, 33, 266–276. [Google Scholar] [CrossRef]
  6. Łopusiewicz, Ł.; Drozłowska, E.; Siedlecka, P.; Mężyńska, M.; Bartkowiak, A. Preparation and characterization of novel flaxseed oil cake yogurt-like plant milk fortified with inulin. J. Food Nutr. Res. 2020, 59, 61–70. [Google Scholar]
  7. Quezada, N.; Cherian, G. Lipid characterization and antioxidant status of the seeds and meals of Camelina sativa and flax. Eur. J. Lipid Sci. Technol. 2012, 114, 974–982. [Google Scholar] [CrossRef]
  8. Olukomaiya, O.O.; Fernando, W.C.; Mereddy, R.; Li, X.; Sultanbawa, Y. Physicochemical, microbiological and functional properties of camelina meal fermented in solid-state using food grade aspergillus fungi. Fermentation 2020, 6, 44. [Google Scholar] [CrossRef]
  9. Kurasiak-Popowska, D.; Tomkowiak, A.; Człopińska, M.; Bocianowski, J.; Weigt, D.; Nawracała, J. Analysis of yield and genetic similarity of Polish and Ukrainian Camelina sativa genotypes. Ind. Crops Prod. 2018, 123, 667–675. [Google Scholar] [CrossRef]
  10. Terpinc, P.; Polak, T.; Makuc, D.; Ulrih, N.P.; Abramovič, H. The occurrence and characterisation of phenolic compounds in Camelina sativa seed, cake and oil. Food Chem. 2012, 131, 580–589. [Google Scholar] [CrossRef]
  11. Mondor, M.; Hernández-Álvarez, A.J. Camelina sativa Composition, Attributes, and Applications: A Review. Eur. J. Lipid Sci. Technol. 2021, in press. [Google Scholar] [CrossRef]
  12. Rahman, M.M.; Kim, W.S.; Kumura, H.; Shimazaki, K.I. Autoaggregation and surface hydrophobicity of bifidobacteria. World J. Microbiol. Biotechnol. 2008, 24, 1593–1598. [Google Scholar] [CrossRef]
  13. Commission Regulation (EC) No 506/2009 of 15 June 2009 Entering a Designation in the Register of Traditional Specialities Guaranteed (Olej Rydzowy (TSG). Available online: https://eur-lex.europa.eu/legal-content/EN/ALL/?uri=CELEX%3A32009R0506 (accessed on 21 December 2021).
  14. Department for Environment, Food & Rural Affairs. Protected Geographical Food and Drink Names—Olej Rydzowy Tradycyjny. Available online: https://www.gov.uk/protected-food-drink-names/olej-rydzowy-tradycyjny (accessed on 21 December 2021).
  15. Rahman, M.J.; Costa de Camargo, A.; Shahidi, F. Phenolic profiles and antioxidant activity of defatted camelina and sophia seeds. Food Chem. 2018, 240, 917–925. [Google Scholar] [CrossRef] [PubMed]
  16. Salminen, H.; Estévez, M.; Kivikari, R.; Heinonen, M. Inhibition of protein and lipid oxidation by rapeseed, camelina and soy meal in cooked pork meat patties. Eur. Food Res. Technol. 2006, 223, 461–468. [Google Scholar] [CrossRef]
  17. Sarv, V.; Trass, O.; Diosady, L.L. Preparation and Characterization of Camelina sativa Protein Isolates and Mucilage. J. Am. Oil Chem. Soc. 2017, 94, 1279–1285. [Google Scholar] [CrossRef]
  18. Gan, R.Y.; Li, H.B.; Gunaratne, A.; Sui, Z.Q.; Corke, H. Effects of Fermented Edible Seeds and Their Products on Human Health: Bioactive Components and Bioactivities. Compr. Rev. Food Sci. Food Saf. 2017, 16, 489–531. [Google Scholar] [CrossRef] [PubMed]
  19. Łopusiewicz, Ł.; Drozłowska, E.; Siedlecka, P.; Mężyńska, M.; Bartkowiak, A.; Sienkiewicz, M.; Zielińska-Bliźniewska, H.; Kwiatkowski, P. Development, characterization, and bioactivity of non-dairy kefir-like fermented beverage based on flaxseed oil cake. Foods 2019, 8, 544. [Google Scholar] [CrossRef] [Green Version]
  20. Łopusiewicz, Ł.; Drozłowska, E.; Trocer, P.; Kwiatkowski, P.; Bartkowiak, A.; Gefrom, A.; Sienkiewicz, M. The Effect of Fermentation with Kefir Grains on the Physicochemical and Antioxidant Properties of Beverages from Blue Lupin (Lupinus angustifolius L.) Seeds. Molecules 2020, 25, 5791. [Google Scholar] [CrossRef]
  21. Juodeikiene, G.; Trakselyte-Rupsiene, K.; Navickaite, B.; Zadeike, D.; Bendoraitiene, J.; Bartkiene, E.; Lele, V.; Rueller, L.; Robert, J.; Arnoldi, A.; et al. Functionalization of soya press cake (okara) by ultrasonication for enhancement of submerged fermentation with Lactobacillus paracasei LUHS244 for wheat bread production. LWT 2021, 152, 112337. [Google Scholar] [CrossRef]
  22. Nissen, L.; Casciano, F.; Babini, E.; Gianotti, A. Prebiotic potential and bioactive volatiles of hemp byproduct fermented by lactobacilli. LWT 2021, 151, 112201. [Google Scholar] [CrossRef]
  23. Bustamante, M.; Villarroel, M.; Rubilar, M.; Shene, C. Lactobacillus acidophilus La-05 encapsulated by spray drying: Effect of mucilage and protein from flaxseed (Linum usitatissimum L.). LWT-Food Sci. Technol. 2015, 62, 1162–1168. [Google Scholar] [CrossRef]
  24. Lai, K.; How, Y.; Pui, L. Microencapsulation of Lactobacillus rhamnosus GG with flaxseed mucilage using co-extrusion technique. J. Microencapsul. 2021, 38, 134–148. [Google Scholar] [CrossRef] [PubMed]
  25. Bătrîna, Ș.L.; Corcionivoschi, N.; Jurcoane, S.; Linton, M.; Kelly, C.; Pinkerton, L.; Imbrea, I.M.; Sima, F.; Imbrea, F. Camelina sativa oil can inhibit Campylobacter jejuni but stimulate lactic acid bacteria growth. Rom. Biotechnol. Lett. 2021, 26, 2423–2427. [Google Scholar] [CrossRef]
  26. Ratajczak, M.; Kubicka, M.M.; Kamińska, D.; Sawicka, P.; Długaszewska, J. Microbiological quality of non-sterile pharmaceutical products. Saudi Pharm. J. 2015, 23, 303–307. [Google Scholar] [CrossRef] [PubMed] [Green Version]
  27. Horwitz, W. Official Methods of Analysis of AOAC International, 17th ed.; AOAC International: Gaithersburg, MD, USA, 2000. [Google Scholar]
  28. Tong, T.; Liu, Y.-J.; Kang, J.; Zhang, C.-M.; Kang, S.-G. Antioxidant Activity and Main Chemical Components of a Novel Fermented Tea. Molecules 2019, 24, 2917. [Google Scholar] [CrossRef] [Green Version]
  29. Guo, C.; Yang, J.; Wei, J.; Li, Y.; Xu, J.; Jiang, Y. Antioxidant activities of peel, pulp and seed fractions of common fruits as determined by FRAP assay. Nutr. Res. 2003, 23, 1719–1726. [Google Scholar] [CrossRef]
  30. Froiio, F.; Cristiano, M.C.; Mancuso, A.; Iannone, M.; Paolino, D. Vegetable-milk-based yogurt-like structure: Rheological properties influenced by gluten-free carob seed flour. Appl. Sci. 2020, 10, 6963. [Google Scholar] [CrossRef]
  31. ISO. ISO 13299:2003—Sensory Analysis—Methodology—General Guidance for Establishing a Sensory Profile. Available online: https://www.iso.org/standard/37227.html (accessed on 14 January 2022).
  32. Bintsis, T. Foodborne pathogens. AIMS Microbiol. 2017, 3, 529–563. [Google Scholar] [CrossRef]
  33. Mäkinen, O.E.; Wanhalinna, V.; Zannini, E.; Arendt, E.K. Foods for Special Dietary Needs: Non-dairy Plant-based Milk Substitutes and Fermented Dairy-type Products. Crit. Rev. Food Sci. Nutr. 2016, 56, 339–349. [Google Scholar] [CrossRef]
  34. Russo, P.; de Chiara, M.L.V.; Capozzi, V.; Arena, M.P.; Amodio, M.L.; Rascón, A.; Dueñas, M.T.; López, P.; Spano, G. Lactobacillus plantarum strains for multifunctional oat-based foods. LWT-Food Sci. Technol. 2016, 68, 288–294. [Google Scholar] [CrossRef] [Green Version]
  35. Bătrîna, L.S.; Jurcoane, Ș.; Popescu, I.; Marin, F.; Imbrea, I.; Crista, F.; Pop, G.; Imbrea, F. Camelina sativa: A study on amino acid content. Rom. Biotechnol. Lett. 2020, 25, 1136–1142. [Google Scholar] [CrossRef]
  36. Łopusiewicz, Ł.; Bogusławska-Wąs, E.; Drozłowska, E.; Trocer, P.; Dłubała, A.; Mazurkiewicz-Zapałowicz, K.; Bartkowiak, A. The Application of Spray-Dried and Reconstituted Flaxseed Oil Cake Extract as Encapsulating Material and Carrier for Probiotic Lacticaseibacillus rhamnosus GG. Materials 2021, 14, 5324. [Google Scholar] [CrossRef] [PubMed]
  37. Penna Barretto, A.L.; Converti, A.; Nogueira De Oliveira, M. Simultaneous effects of total solids content, milk base, heat treatment temperature and sample temperature on the rheological properties of plain stirred yogurt. Food Technol. Biotechnol. 2006, 44, 515. [Google Scholar]
  38. Olukomaiya, O.O.; Fernando, W.C.; Mereddy, R.; Zhang, D.; Li, X.; Sultanbawa, Y. Phytic Acid Reduction in Canola and Camelina Meals by Fungal Fermentation for Potential Broiler Feeding. In Proceedings of the 30th Annual Australian Poultry Science Symposium, Sydney, Australia, 17–20 February 2019; p. 203. [Google Scholar]
  39. Ghorbani, A.; Pourahmad, R.; Fallahpour, M.; Assadi, M.M. Production of probiotic soy yogurt. Ann. Biol. Res. 2012, 3, 2750–2754. [Google Scholar]
  40. El-Sayed, E.M.; Abd El-Gawad, I.A.; Murad, H.A.; Salah, S.H. Utilization of laboratory-produced xanthan gum in the manufacture of yogurt and soy yogurt. Eur. Food Res. Technol. 2002, 215, 298–304. [Google Scholar] [CrossRef]
  41. Silva, E.G.d.S.O.; Anaya, K.; Bezerra, M.d.F.; Macêdo, C.S.; Urbano, S.A.; Borba, L.H.F.; Barbosa, I.d.M.; Ramalho, H.M.M.; Cipolat-Gotet, C.; Galdino, A.B.d.S.; et al. Physicochemical and sensory evaluation of greek style yoghurt with bovine colostrum. Food Sci. Technol. 2021, in press. [Google Scholar] [CrossRef]
  42. Lange, I.; Mleko, S.; Tomczynska-Mleko, M.; Polischuk, G.; Janas, P.; Ozimek, L. Technology and factors influencing Greek-style yogurt—A Review. Ukr. Food J. 2020, 9, 361–480. [Google Scholar] [CrossRef]
  43. Randazzo, W.; Corona, O.; Guarcello, R.; Francesca, N.; Germanà, M.A.; Erten, H.; Moschetti, G.; Settanni, L. Development of new non-dairy beverages from Mediterranean fruit juices fermented with water kefir microorganisms. Food Microbiol. 2016, 54, 40–51. [Google Scholar] [CrossRef] [Green Version]
  44. Bertacchi, S.; Bettiga, M.; Porro, D.; Branduardi, P. Camelina sativa meal hydrolysate as sustainable biomass for the production of carotenoids by Rhodosporidium toruloides. Biotechnol. Biofuels 2020, 13, 47. [Google Scholar] [CrossRef]
  45. Li, N.; Qi, G.; Sun, X.S.; Wang, D. Characterization of gum isolated from Camelina seed. Ind. Crops Prod. 2016, 83, 268–274. [Google Scholar] [CrossRef] [Green Version]
  46. Montemurro, M.; Pontonio, E.; Coda, R.; Rizzello, C.G. Plant-Based Alternatives to Yogurt: State-of-the-Art and Perspectives of New Biotechnological Challenges. Foods 2021, 10, 316. [Google Scholar] [CrossRef] [PubMed]
  47. Drozłowska, E.; Bartkowiak, A.; Trocer, P.; Kostek, M.; Tarnowiecka-Kuca, A.; Bienkiewicz, G.; Łopusiewicz, Ł. The influence of flaxseed oil cake extract on oxidative stability of microencapsulated flaxseed oil in spray-dried powders. Antioxidants 2021, 10, 211. [Google Scholar] [CrossRef] [PubMed]
  48. Amankwah, E.A.; Barimah, J.; Acheampong, R.; Addai, L.O.; Nnaji, C.O. Effect of fermentation and malting on the viscosity of maize-soyabean weaning blends. Pakistan J. Nutr. 2009, 8, 1671–1675. [Google Scholar] [CrossRef] [Green Version]
  49. Bortnowska, G.; Balejko, J.; Tokarczyk, G.; Romanowska-Osuch, A.; Krzemińska, N. Effects of pregelatinized waxy maize starch on the physicochemical properties and stability of model low-fat oil-in-water food emulsions. Food Hydrocoll. 2014, 36, 229–237. [Google Scholar] [CrossRef]
  50. Gul, O.; Atalar, I.; Mortas, M.; Dervisoglu, M. Rheological, textural, colour and sensorial properties of kefir produced with buffalo milk using kefir grains and starter culture: A comparison with cows’ milk kefir. Int. J. Dairy Technol. 2018, 71, 73–80. [Google Scholar] [CrossRef]
  51. Glibowski, P.; Kowalska, A. Rheological, texture and sensory properties of kefir with high performance and native inulin. J. Food Eng. 2012, 111, 299–304. [Google Scholar] [CrossRef]
  52. Sendra, E.; Kuri, V.; Fernández-López, J.; Sayas-Barberá, E.; Navarro, C.; Pérez-Alvarez, J.A. Viscoelastic properties of orange fiber enriched yogurt as a function of fiber dose, size and thermal treatment. LWT-Food Sci. Technol. 2010, 43, 708–714. [Google Scholar] [CrossRef]
  53. Gallardo-Escamilla, F.J.; Kelly, A.L.; Delahunty, C.M. Mouthfeel and flavour of fermented whey with added hydrocolloids. Int. Dairy J. 2007, 17, 308–315. [Google Scholar] [CrossRef]
  54. Farah, J.S.; Araujo, C.B.; Melo, L. Analysis of yoghurts’, whey-based beverages’ and fermented milks’ labels and differences on their sensory profiles and acceptance. Int. Dairy J. 2017, 68, 17–22. [Google Scholar] [CrossRef]
  55. Shepard, L.; Miracle, R.E.; Leksrisompong, P.; Drake, M.A. Relating sensory and chemical properties of sour cream to consumer acceptance. J. Dairy Sci. 2013, 96, 5435–5454. [Google Scholar] [CrossRef]
  56. Gierczynski, I.; Guichard, E.; Laboure, H. Aroma perception in dairy products: The roles of texture, aroma release and consumer physiology. A review. Flavour Fragr. J. 2011, 26, 141–152. [Google Scholar] [CrossRef]
  57. Mullaney, J.A.; Kelly, W.J.; McGhie, T.K.; Ansell, J.; Heyes, J.A. Lactic Acid Bacteria Convert Glucosinolates to Nitriles Efficiently Yet Differently from Enterobacteriaceae. J. Agric. Food Chem. 2013, 61, 3039–3046. [Google Scholar] [CrossRef]
  58. Watanabe, H.; Usami, R.; Kishino, S.; Osada, K.; Aoki, Y.; Morisaka, H.; Takahashi, M.; Izumi, Y.; Bamba, T.; Aoki, W.; et al. Enzyme systems involved in glucosinolate metabolism in Companilactobacillus farciminis KB1089. Sci. Rep. 2021, 11, 23715. [Google Scholar] [CrossRef] [PubMed]
  59. Palani, K.; Harbaum-Piayda, B.; Meske, D.; Keppler, J.K.; Bockelmann, W.; Heller, K.J.; Schwarz, K. Influence of fermentation on glucosinolates and glucobrassicin degradation products in sauerkraut. Food Chem. 2016, 190, 755–762. [Google Scholar] [CrossRef] [PubMed]
  60. Zhang, Z.; Wen, M.; Chang, Y. Degradation of glucosinolates in rapeseed meal by Lactobacillus delbrueckii and Bacillus subtilis. Grain Oil Sci. Technol. 2020, 3, 70–76. [Google Scholar] [CrossRef]
Figure 1. Lactic acid bacteria (LAB) counts during storage time.
Applsci 12 01085 g001
Figure 2. The changes in G′ (storage modulus) and G″ (loss modulus).
Applsci 12 01085 g002
Table 1. The Total Solids Content (TSC), pH and Titratable Acidy (TA) of fermented beverages and unfermented (control) sample.
Sample * Time of Storage (Days)
Unfermented157142128
TSC (%)
CPC-15%13.84 ± 0.76 Aa14.36 ± 0.04 Ba14.38 ± 0.05 Ba14.34 ± 0.08 Ba14.44 ± 0.08 Ba14.49 ± 0.07 Ba14.46 ± 0.06 Ba
CPC-20%17.88 ± 3.05 Ab19.87 ± 0.12 Bb19.55 ± 0.06 Bb19.88 ± 0.06 Bb19.71 ± 0.12 Bb19.96 ± 0.11 Bb19.60 ± 0.20 Bb
pH (-)
CPC-15%6.28 ± 0.00 Aa4.65 ± 0.01 Ba5.12 ± 0.01 Ca4.31 ± 0.01 Da4.46 ± 0.01 Ea4.37 ± 0.00 Fa4.65 ± 0.00 Ga
CPC-20%6.32 ± 0.01 Ab4.56 ± 0.02 Bb4.82 ± 0.00 Cb4.84 ± 0.01 Db4.87 ± 0.02 Eb4.69 ± 0.01 Fb4.71 ± 0.01 gb
TA (mg lactic acid/g)
CPC-15%0.32 ± 0.03 Aa0.75 ± 0.00 Ba0.66 ± 0.01 Ca0.98 ± 0.04 Da0.97 ± 0.01 Da1.25 ± 0.14 Ea0.94 ± 0.02 Da
CPC-20%0.37 ± 0.00 Aa0.89 ± 0.00 Bb0.89 ± 0.05 Cb0.83 ± 0.04 Cb0.88 ± 0.04 Da0.98 ± 0.04 Eb1.12 ± 0.01 Fb
* CPC-15%—sample with 15% (w/w) camelina press cake content, CPC-20%—sample with 20% (w/w) camelina press cake content; values are means ± standard deviation of triplicate determinations. Means with different lowercase in the same column are significantly different at p < 0.05. Means with different uppercase in the same row are significantly different at p < 0.05.
Table 2. Color parameters and total color difference (ΔE) of samples during the storage time.
Sample * Time of Storage (Days)
Unfermented157142128
L *
CPC-15%55.11 ± 0.01 Aa55.65 ± 0.01 Ba57.15 ± 0.02 Ca56.51 ± 0.03 Da56.60 ± 0.01 EDa55.46 ± 0.01 Fa55.27 ± 0.01 Ga
CPC-20%53.32 ± 0.00 Ab53.26 ± 0.00 Bb51.07 ± 0.01 Cb53.51 ± 0.01 Db51.48 ± 0.01 Eb52.96 ± 0.02 Fb52.47 ± 0.01 Gb
a *
CPC-15%7.74 ± 0.01 Aa6.83 ± 0.02 Ba6.81 ± 0.01 Ba6.59 ± 0.01 Ca6.59 ± 0.01 Ca6.40 ± 0.01 Da6.68 ± 0.02 Ea
CPC-20%8.07 ± 0.01 Ab7.48 ± 0.01 Bb7.11 ± 0.01 Cb7.30 ± 0.01 Db7.17 ± 0.01 Eb7.08 ± 0.01 Fb7.49 ± 0.01 Bb
b *
CPC-15%25.50 ± 0.02 Aa25.61 ± 0.03 Ba27.35 ± 0.04 Ca24.44 ± 0.01 Da26.30 ± 0.03 Ea24.34 ± 0.04 Fa25.41 ± 0.02 Ga
CPC-20%24.56 ± 0.00 Ab24.16 ± 0.01 Bb23.22 ± 0.02 Cb24.90 ± 0.04 Db23.61 ± 0.03 Eb24.35 ± 0.01 Fb24.75 ± 0.03 Gb
ΔE
CPC-15%Used as a standard1.00 ± 0.01 Aa1.78 ± 0.02 Ba2.08 ± 0.10 Ca4.55 ± 0.01 Da2.46 ± 0.02 Ea1.11 ± 0.01 Fa
CPC-20%Used as a standard0.87 ± 0.01 Ab2.71 ± 0.02 Bb0.54 ± 0.04 Cb2.27 ± 0.03 Db1.56 ± 0.02 Eb0.93 ± 0.03 Fb
* CPC-15%—sample with 15% (w/w) camelina press cake content, CPC-20%—sample with 20% (w/w) camelina press cake content; values are means ± standard deviation of triplicate determinations. Means with different lowercase in the same column are significantly different at p < 0.05. Means with different uppercase in the same row are significantly different at p < 0.05.
Table 3. Reducing Sugars Content (RSC), Total Free Amino Acids (TFAA), Total Polyphenolics Content (TPC) and Antioxidant Activity of fermented beverages and unfermented (control) samples.
Sample * Time of Storage (Days)
Unfermented157142128
RSC (mg/g)
CPC-15%51.10 ± 1.05 Aa38.53 ± 0.38 Ba35.77 ± 0.10 Ca37.32 ± 1.14 Da33.02 ± 0.57 EFa32.75 ± 0.76 Ea33.69 ± 1.52 Fa
CPC-20%41.49 ± 0.57 Ab33.02 ± 0.57 Bb29.05 ± 0.10 Cb26.96 ± 0.38 Db25.01 ± 0.10 Eb32.01 ± 0.10 Fa29.99 ± 0.10 Gb
TFAA (mg Gly/g)
CPC-15%1.90 ± 0.14 ABa2.59 ± 0.11 Da2.41 ± 0.01 CDa1.80 ± 0.06 Aa1.73 ± 0.01 Aa2.07 ± 0.06 ABCa2.18 ± 0.08 BCa
CPC-20%1.72 ± 0.10 Aa2.03 ± 0.34 Ba2.34 ± 0.05 Bb1.87 ± 0.20 Aa2.00 ± 0.01 Cb2.16 ± 0.07 Da2.18 ± 0.05 Da
TPC (mg GAE/g)
CPC-15%6.74 ± 0.26 Aa7.21 ± 0.14 Ba8.54 ± 1.37 Ba8.27 ± 0.10 Ba7.50 ± 0.06 Ca6.65 ± 0.47 Aa7.40 ± 0.05 Ca
CPC-20%6.18 ± 0.10 Aa6.98 ± 0.23 Ba8.18 ± 1.60 Ba6.68 ± 0.59 Ab6.27 ± 1.13 Aa6.71 ± 0.99 Aa7.90 ± 2.72 Ba
ABTS (%)
CPC-15%31.15 ± 3.42 Aa53.32 ± 2.66 Ba54.60 ± 0.28 Ba56.95 ± 1.52 Ba55.00 ± 2.75 Ba52.12 ± 5.13 Ba50.44 ± 1.23 Ba
CPC-20%40.37 ± 1.33 Ab55.81 ± 2.82 Ba54.13 ± 1.33 ABa59.03 ± 4.27 Bb50.10 ± 1.33 Aa47.95 ± 0.95 Ab54.40 ± 1.14 Aa
DPPH (%)
CPC-15%53.14 ± 0.25 Aa59.80 ± 0.90 BDa51.39 ± 0.16 Ca57.37 ± 0.25 Dea62.59 ± 5.33 Ba57.89 ± 0.33 DEa55.10 ± 0.49 Ea
CPC-20%56.79 ± 1.23 Ab57.66 ± 0.16 Ba58.18 ± 0.57 Db57.77 ± 0.00 Ca55.28 ± 0.25 Eb56.61 ± 0.33 Aa58.24 ± 2.79 Da
FRAP (mg AAE/g)
CPC-15%6.18 ± 0.41 Aa6.65 ± 0.23 Ba6.19 ± 0.24 Aa6.77 ± 0.40 Ba5.35 ± 0.44 Ca5.01 ± 0.36 Da5.72 ± 0.22 Ea
CPC-20%5.58 ± 0.52 ACb6.03 ± 0.29 Bb6.13 ± 0.47 Bb5.47 ± 0.45 Ada5.38 ± 0.32 Da6.02 ± 0.47 Bb5.75 ± 0.46 Ca
RP (-)
CPC-15%1.220 ± 0.014 Aa1.250 ± 0.011 Ba1.154 ± 0.006 Ca1.278 ± 0.008 Da1.070 ± 0.021 Ea1.037 ± 0.003 Fa1.049 ± 0.004 Ga
CPC-20%1.095 ± 0.003 Ab1.167 ± 0.009 Bb1.172 ± 0.011 Cb1.093 ± 0.003 Db1.165 ± 0.011 Eb1.254 ± 0.006 Fb1.087 ± 0.004 Gb
* CPC-15%—sample with 15% (w/w) camelina press cake content, CPC-20%—sample with 20% (w/w) camelina press cake content; values are means ± standard deviation of triplicate determinations. Means with different lowercase in the same column are significantly different at p < 0.05. Means with different uppercase in the same row are significantly different at p < 0.05.
Table 4. Textural characteristics and viscosity of the samples.
Sample * Time of Storage (Days)
Unfermented157142128
Springiness (N)
CPC-15%0.99 ± 0.07 Aa0.84 ± 0.19 Ba0.81 ± 0.17 Ca1.01 ± 0.08 Da1.06 ± 0.15 Ea0.92 ± 0.17 Fa0.79 ± 0.15 Ga
CPC-20%0.83 ± 0.14 Ab0.60 ± 0.33 Bb1.03 ± 0.08 Cb1.28 ± 0.17 Db0.97 ± 0.12 Eb0.89 ± 0.19 Fb1.09 ± 0.15 Gb
Gumminess (N)
CPC-15%0.02 ± 0.01 Aa0.07 ± 0.01 Ba0.16 ± 0.02 CDa0.18 ± 0.02 Da0.18 ± 0.02 Da0.20 ± 0.01 Ea0.15 ± 0.02 Fa
CPC-20%0.04 ± 0.03 Ab0.10 ± 0.01 Bb0.34 ± 0.03 Cb0.37 ± 0.04 Db0.42 ± 0.03 Eb0.47 ± 0.06 Fb0.44 ± 0.10 Gb
Chewiness (N)
CPC-15%0.02 ± 0.01 Aa0.08 ± 0.01 Ba0.13 ± 0.04 Ca0.18 ± 0.02 Da0.19 ± 0.03 Ea0.19 ± 0.03 Ea0.11 ± 0.03 Fa
CPC-20%0.04 ± 0.02 Ab0.10 ± 0.00 Bb0.36 ± 0.02 Cb0.47 ± 0.07 Db0.41 ± 0.07 Eb0.42 ± 0.11 Fb0.48 ± 0.09 Gb
Cohesiveness (N)
CPC-15%0.93 ± 0.35 Aa0.82 ± 0.65 Ba0.71 ± 0.09 Ca0.75 ± 0.17 Da0.66 ± 0.05 Ea0.72 ± 0.05 Fa0.51 ± 0.11 Ga
CPC-20%0.93 ± 0.28 Ab0.33 ± 0.49 Bb0.65 ± 0.06 Cb0.61 ± 0.05 Db0.65 ± 0.06 Eb0.68 ± 0.03 Fb0.68 ± 0.22 Gb
Hardness (N)
CPC-15%0.02 ± 0.00 Aa0.21 ± 0.01 Ba0.23 ± 0.03 Ca0.24 ± 0.03 Da0.27 ± 0.02 Ea0.28 ± 0.01 Ea0.27 ± 0.02 Ea
CPC-20%0.02 ± 0.00 Aa0.01 ± 0.00 Ba0.51 ± 0.03 Cb0.58 ± 0.07 Db0.63 ± 0.04 Eb0.67 ± 0.08 Fb0.62 ± 0.08 Gb
Viscosity (Pa s)
CPC-15%1.78 ± 0.01 Aa2.84 ± 0.05 Ba2.05 ± 0.03 Ca3.20 ± 0.01 Da3.50 ± 0.00 Ea3.16 ± 0.00 Fa3.26 ± 0.02 Ga
CPC-20%0.39 ± 0.01 Ab0.24 ± 0.03 Bb0.37 ± 0.02 Cb0.36 ± 0.05 Db0.29 ± 0.00 Eb0.23 ± 0.03 Fb1.56 ± 0.02 Gb
* CPC-15%—sample with 15% (w/w) camelina press cake content, CPC-20%—sample with 20% (w/w) camelina press cake content; values are means ± standard deviation of triplicate determinations. Means with different lowercase in the same column are significantly different at p < 0.05. Means with different uppercase in the same row are significantly different at p < 0.05.
Table 5. Results of sensory analyses.
Sample *Time of Storage (Days)
0157142128
Color
CPC-15%4.0 ± 0.00 Aa4.2 ± 0.10 Ba4.3 ± 0.00 Ca4.2 ± 0.10 Ba4.2 ± 0.05 Da4.3 ± 0.27 Ea4.4 ± 0.10 Ba
CPC-20%4.0 ± 0.00 Aa4.0 ± 0.55 Bb4.2 ± 0.10 Ca4.4 ± 0.11 Ba4.4 ± 0.15 Db4.5 ± 0.09 Eb4.5 ± 0.10 Eb
Smell
CPC-15%3.8 ± 0.05 Aa4.5 ± 0.10 Ba4.6 ± 0.10 Ca4.8 ± 0.10 Da4.5 ± 0.05 Ba4.5 ± 0.10 Ba4.4 ± 0.10 Ba
CPC-20%3.5 ± 0.10 Ab4.5 ± 0.00 Bb4.7 ± 0.00 Cb4.6 ± 0.00 Db4.6 ± 0.10 Eb4.5 ± 0.15 Fb4.5 ± 0.10 Gb
Consistency
CPC-15%3.5 ± 0.19 Aa4.2 ± 0.12 Ba4.5 ± 0.10 Ca4.4 ± 0.05 CDa4.5 ± 0.10 Ca4.3 ± 0.31 CDa4.1 ± 0.05 Ea
CPC-20%3.5 ± 0.19 Aa4.4 ± 0.05 Bb4.5 ± 0.21 BCb4.5 ± 0.27 Cb4.6 ± 0.12 Da4.2 ± 0.00 Eb4.2 ± 0.24 Fb
Mouth feel
CPC-15%3.0 ± 0.23 Aa4.0 ± 0.10 Ba4.0 ± 0.12 Ba4.1 ± 0.25 Ca4.4 ± 0.40 Da4.4 ± 0.10 Ea4.3 ± 0.00 Fa
CPC-20%2.8 ± 0.15 Ab4.0 ± 0.00 Bb4.1 ± 0.20 Cb4.2 ± 0.00 Db4.6 ± 0.12 Eb4.4 ± 0.10 Fb4.3 ± 0.10 Gb
Taste
CPC-15%2.5 ± 0.45 Aa3.0 ± 0.55 Ba3.5 ± 0.70 Ca4.2 ± 0.20 Da4.2 ± 0.10 Ea4.5 ± 0.00 Fa4.6 ± 0.20 Ga
CPC-20%2.1 ± 0.23 Ab3.1 ± 0.20 Bb3.5 ± 0.10 Cb3.9 ± 0.16 Db4.1 ± 0.15 Eb4.5 ± 0.10 Fb4.5 ± 0.15 Gb
Overall acceptability
CPC-15%3.1 ± 0.19 Aa4.0 ± 0.01 Ba4.4 ± 0.19 Ca4.4 ± 0.45 Da4.5 ± 0.23 Ea4.4 ± 0.11 Fa4.3 ± 0.45 Ga
CPC-20%2.6 ± 0.10 Aa 3.8 ± 0.20 Ba4.4 ± 0.31 Cb4.4 ± 0.55 Db4.5 ± 0.15 Eb4.5 ± 0.23 Fb4.3 ± 0.20 Gb
* CPC-15%—sample with 15% (w/w) camelina press cake content, CPC-20%—sample with 20% (w/w) camelina press cake content; values are means ± standard deviation of triplicate determinations by 10 panelists. Means with different lowercase in the same column are significantly different at p < 0.05. Means with different uppercase in the same row are significantly different at p < 0.05.
Publisher’s Note: MDPI stays neutral with regard to jurisdictional claims in published maps and institutional affiliations.

