Article

The Effect of the Use of Essential Oils in the Feed of Bee Families on Honey Chemical Composition and Antimicrobial Activity

1
Faculty of Bioengineering of Animal Resources, Banat’s University of Agricultural Sciences and Veterinary Medicine “King Michael I of Romania” from Timișoara, Calea Aradului No. 119, 300645 Timisoara, Romania
2
Faculty of Food Engineering, Banat’s University of Agricultural Sciences and Veterinary Medicine “King Michael I of România” from Timișoara, Calea Aradului No. 119, 300645 Timisoara, Romania
3
Faculty of Veterinary Medicine, Banat’s University of Agricultural Sciences and Veterinary Medicine “King Michael I of România” from Timișoara, Calea Aradului No. 119, 300645 Timisoara, Romania
*
Authors to whom correspondence should be addressed.
Appl. Sci. 2022, 12(3), 1094; https://doi.org/10.3390/app12031094
Submission received: 21 December 2021 / Revised: 12 January 2022 / Accepted: 19 January 2022 / Published: 21 January 2022

Abstract

:
Honey is a natural food with pharmacological properties. The present study was focused on the use of essential oils in the supplementary feeding of bee families for three weeks (spring). The purpose was to monitor the effect of essential oils (basil, thyme, juniper, cloves, mint, cinnamon, oregano, rosemary) on the chemical components of the resulting honey. The honey sampling period was carried out before the administration of essential oils in the supplementary feed of the bee families, after the administration of essential oils in the bee feed, respectively, after the first harvest (rapeseed). The honey samples were subjected to chemical analysis to determine humidity, impurities, ash, pH, acidity, total phenolic content (TPC) and flavonoid content (FC), reducing sugar content and antioxidant activity. In addition, the antimicrobial activity against nine strains was tested. We found out that all the essential oils used had a positive effect on the chemical composition of honey, especially the essential oil of oregano, mint, thyme, cinnamon. Experimental variants in which juniper and clove essential oil were introduced reduced the acidity of honey by 28.12% and 35.48%, respectively. Ash content varies between 0.23% and 0.46%, impurities content between 4.11% and 9.11%, while the values for pH were between 3.42 and 4.03. As for the TPC, they have increased considerably in all experimental variants to which essential oil has been added, compared to the batch fed only with sugar syrup, the highest value being recorded for the sample treated with cinnamon after the third harvest (163.94 mg/100 g). The FC values vary between 8.41–44.36 mg/100 g, depending of the treatment applied and the period of harvesting. Regarding the antimicrobial activity, the results highlighted that the essential oils present in the diet of bees produced honey with antimicrobial effect increased after two weeks after administration.

1. Introduction

Honey has been used since ancient times and its main use was to heal burns and wounds [1,2]. Over time, honey has successively undergone a series of physicochemical investigations in which its anti-inflammatory and healing properties were associated with the antioxidant activity and antimicrobial effect [3,4,5]. The protection factor against wounds or burns is the antimicrobial activity caused mainly by the amount of sugar contained in honey, low water content, low pH level, molecules that inhibit the growth of bacteria and the content of honey in other compounds [6,7,8,9].
In recent years, it has been found that bacteria have become very resistant to many of the conventional antibiotics, which poses a real danger to the health of the whole world [10]. In 2017, the World Health Organization reported a number of bacteria with considerable resistance to the existing drugs, which indicates a high degree of emergency in the discovery of new antibiotics [11,12].
The main foundations in the discovery of new antibiotics are the natural compounds or the examination of bioactive compounds procured from natural products [13,14].
Essential oils (EOs) are an alternative source to the use of antibiotics with a number of antioxidant, antibacterial, antifungal, antiparasitic and antiviral properties [15,16,17,18].
The studies carried out by Imtara et al. [19] highlighted that the antimicrobial and antioxidant activities of honey are correlated with the color of honey and with the content of polyphenols, flavonoids and melanoidins.
Another study showed that after using honey combined with EOs against the tested bacteria, the highest efficacy was determined by wild carrot honey combined with oregano essential oil, with a minimum inhibitory concentration of 8% and 2%, respectively [20].
The use of basil, thyme, juniper, cloves, mint, cinnamon, oregano, rosemary EOs in the sugar syrup given to bee colonies, as additional food in the spring, had the effect of reducing the total number of germs in the intestine of worker bees [21], and also a better development of bee colonies, materialized into a greater capacity of collecting nectar. The use of the mentioned EOs increased the honey production by 5.54% (clove oil) and 35.41% (mint oil) [22]. The obtained results can be attributed to the content in active principles of the studied essential oils (Table 1).
Honey production of a bee family and its quality is influenced by the development of the bee family, the health of the bee family, the quantity and quality of nectar and the weather conditions [36,37,38].
In this sense, the purpose of this paper was to study the influence of treatment with EOs (basil, thyme, juniper, cloves, mint, cinnamon, oregano, rosemary) applied in the sugar syrup administrated to the bees, on the nutritional, active principle and antimicrobial activity of honey.

2. Materials and Methods

2.1. Experimental Conditions

The biological material was represented by 90 bee colonies divided into 9 experimental lots, of 10 bee colonies/lot. They were fed, between 30 March–14 April 2021, with sugar syrup in which 20 µL/L of syrup of an essential oil were incorporated. The 9 experimental groups were systematized into 8 groups fed with sugar syrup in which essential oil was incorporated, and 1 group represented the control group which was fed only with sugar syrup. Honey samples were collected from each experimental variant at the beginning of the experiment (Control sample), after 7 days of EOs administration (Harvest I), at 20 days of administration of sugar syrup with essential oils (Harvest II) and after the first harvest of production (rapeseed) (Harvest III) in 30 May 2021 according to Table 2.
After harvesting, the honey samples were placed in sterile containers and transported to the Interdisciplinary Research Platform “Ecological Agriculture and Food Safety”, the chemistry laboratory, within the Banat’s University of Agricultural Sciences and Veterinary Medicine “King Michael I of Romania” in Timișoara, Romania. These were examined for humidity, ash, impurities, acidity, pH, polyphenols, reducing sugar and flavonoids. The antioxidant and antimicrobial activity were evaluated, too.

2.2. Determination of Humidity by Drying Method

In total, 27 samples of honey were used to determine the humidity, obtained after the 3 harvests; 1 experimental lot was represented by 1 honey sample. We weighed 5 g of each honey sample, placed it on a Petri dish and then introduced it in the drying chamber (BINDER GmbH, Tuttlingen, Germany), at 103 °C, for 24 h. After removing from the oven, the samples were allowed to cool down, then, we weighed them and noted the result obtained according to the formula [39]:
Humidity = ( G 1 G 2 ) ( G 1 G 3 ) × 100 ( % )
Dry matter = 100 − Humidity (%)
where:
  • G1—the weight of petri dish and sample before drying (g);
  • G2—the weight of petri dish and sample after drying (g);
  • G3—the weight of Petri dish (g).

2.3. Determination of Impurities

The content of impurities was determined on 27 samples of honey. In total, 10 g were weighed from each sample and dissolved in 50 mL of water. To dissolve the honey, the containers were closed with a lid and stirred using a magnetic stirrer with hot plate (IDL, Freising, Germany) for 30 min. After homogenization of the honey, the solutions obtained were filtered through filter paper (previously weighed). The samples thus obtained were placed in the drying closet at 103 °C for 10 min, to dry the filter paper, then weighed, noting the results obtained according to the formula [40]:
I = m 2 m 1 100 ( % )
where:
  • I—represents the quantity of impurities (%);
  • m1—represents the mass of the sample taken for analysis (g);
  • m2—represents the mass of residue left on the filter paper after drying (g).

2.4. Mineral Substance Content (Ash) Determination

To determine the ash, we prepared 27 melting pots, each of them with 3 g of honey, from the 3 harvests. The honey samples were placed in the calcination furnace (Nabertherm, Lilienthal, Germany) at the temperature of 525 °C, up to a constant mass. The ash obtained after calcination was uniformly grayish white. After removing the samples from the calcination furnace, they were left to cool down, then, the melting pots with ash were weighed to calculate and express the results according to the formula [39]:
Ash = m m 1 m 2 m 1 ( % )
where:
  • m—represents the mass of the melting pot with the ash obtained after calcination (g);
  • m1—represents the mass of the empty melting pot (g);
  • m2—represents the mass of the melting pot with honey (g).

2.5. Determination of Acidity

The determination of acidity was performed on 9 samples obtained before the administration of sugar syrup and essential oils, 9 samples collected after the administration of sugar syrup and essential oils, and 9 samples collected after the rape harvesting. In total, 10 g of honey from the honey samples subjected to the experiment were weighed, and 50 mL of water and 2 drops of Phenolphthalein over each sample were added. The samples were placed on a magnetic stirrer with hot plate (IDL, Freising, Germany) and stirred for 30 min. Then, each sample was passed through filter paper, and titrated with sodium hydroxide 0.1 n solution until the pink color persisted for 30 s. To calculate and express the results, we used the formula [41]:
Acidity = V × 0 . 1 10 × 100 ( mL NaOH 0.1 n / 100 g honey )
where:
  • V—represents the volume of sodium hydroxide solution used in the titration (mL);
  • 0.1—represents the normality of sodium hydroxide solution used for titration.

2.6. Determination of pH

To determine the pH, we used 27 samples from the 3 harvests. The pH of the samples studied was determined with the WTW inoLab pH 730 pH-meter (Xylem Analytics, Weilheim, Germany). We extracted 3 g of honey from each sample and dissolved them in 30 mL of water. The samples were dissolved with the help of the Holt plate Stirrer LM4-1002 for 30 min. After 30 min, we determined the pH and temperature of each sample. pH working range: −2000 ± 19,999, with accuracy of ±0.005. The temperature of the room in which the pH was determined was between 22–26 °C [41].

2.7. Determination of Total Phenolic Content (TPC)

The TPC were performed on 27 honey samples taken from the 3 harvests. From each sample, 1 g of honey was extracted in a container with a lid over which 10 mL of 70% ethanol was added. The containers were closed and placed in a Holt plate Stirrer (IDL, Freising, Germany) for 30 min. After stirring, the samples were filtered with filter paper. A total of 27 glass tubes were prepared in which 0.5 mL of the filtered sample was added. To each sample, 1.25 mL of Folin–Ciocalteu reagents (Sigma-Aldrich Chemic GmbH, München, Germany), diluted 1:10 with distilled water was added. The samples were then incubated for 5 min at room temperature and added with 1 mL Na2CO3 (60 g/L aqueous solution). The samples thus obtained were introduced to the thermostat incubator (Memmert GmbH, Schwabach, Germany) at 50 °C for 30 min, after which the absorbance at 750 nm was read using a UV-VIS spectrometer (Analytical Jena Specord 205, Jena, Germany). Ethanol was used as control. The calibration curve was obtained using gallic acid—GA (concentration range: 2.5–250 μg/mL). The results were expressed in µg GA per g [40]. All determinations were performed in triplicate [42].

2.8. Determination of Reducing Sugar

The honey samples subjected to the determination of the reducing sugar resulted from the 3 moments of harvest (27 samples). From the initial sample, we weighed 3 g of honey and added water on it, up to 200 mL of the container, after which we homogenized it very well. From the resulting solution, we extracted 20 mL in a glass container and filled it up to 100 mL with water, and afterwards, we homogenized it. The solution thus obtained represented the working solution. In a bowl, we added 20 mL of copper sulfate solution, 20 mL of alkaline Seignette salt solution and 20 mL of water, after which we homogenized this. The vessel was placed on the electric hob, and at the time of boiling, we added 20 mL of the working solution. When the boiling was restarted, it was timed for 5 min, then the dish was taken off the stove and placed in water for cooling. After cooling, we added 25 mL of sodium chloride, and then stirred. The solution in the bowl became clear with a greenish-blue appearance. We added 2 g of baking soda, and after the effervescence stopped, the remaining baking soda was visible in the solution from the bowl, the color becoming intense blue. The solution thus obtained was titrated with iodine solution, stirring constantly. At the beginning of the titration, a milky color appeared, becoming clear and green at the end of the titration. To find out the excess iodine, we added 0.5 starch solution to the green solution, and the color changed to dark blue. The latter was titrated with sodium thiosulphate solution until the solution changed from dark blue to light blue. The reducing sugar content expressed in invert sugar was calculated according to the formula [41]:
Cinvert sugar = m 10 5 m 1 1000 100 ( % )
where:
  • m—represents the amount of invert sugar (mg);
  • m1—represents the amount of honey analyzed (g);
  • 10—represents the ratio between the volume of the solution in the 200-mL volumetric container and the volume of the solution taken for dilution;
  • 5—represents the ratio between the volume of the solution in the 100-mL volumetric container and the volume of the diluted solution taken for analysis.

2.9. Determination of Flavonoid Content (FC)

For the determination of flavonoids on the honey samples from Harvest I (before administration of sugar syrup with essential oils), Harvest II (after administration of sugar syrup with essential oils) and Harvest III (after rapeseed harvest), we prepared 27 containers with lids in which we inserted 1 g of honey sample and 10 mL of ethanol 60%. The containers were closed and placed in the Holt plate Stirrer for 30 min. After dissolution, they were filtered using filter paper, and we prepared 27 colorless glass containers. We added to each container 1.5 mL of the previously prepared extract, 4.5 mL H2O and 1 mL NaNO2, and left this to incubate for 6 min. After the incubation period, we added 1 mL of Al(NO3)3 10% and left it to incubate again for 6 min. When the incubation time had finished, we added 10 mL of NaOH 4% and topped it with alcohol 70% up to 20 mL.
The samples were left to stand for 15 min. After 15 min, we read the absorbance at 510 nm using the UV-VIS spectrometer (Analytical Jena Specord 205, Jena, Germany). Quercitin (QE) solutions were used as standard. The results were expressed as mg QE/100 g and all determinations were performed in triplicate [43].

2.10. Determination of Antioxidant Activity (AA) by DPPH

In order to determine the antioxidant activity of honey by the DPPH method, the extracts were prepared as follows: we weighed 1 g of honey, diluted it with 10 mL of ethanol 60% and then we filtered it through filter paper. The extracts thus obtained were left to incubate for 30 min. For the negative control, we used ethanol 60%; the sample was read on a UV-VIS spectrometer (Analytical Jena Specord 205, Jena, Germany) at an absorbance of 518 nm. For the positive control, we added 1 mL of DPPH solution (3 mM), 2.5 mL extract, to a test tube, we left it at incubation for 30 min and then we read it on the spectrometer (absorbance 518 nm). For the blank, we placed 1 mL of ethanol, 2.5 mL extract in a test tube, left this to incubate for 30 min, then read it at the absorbance 518 nm using a spectrometer. The antioxidant activity was calculated according to the formula:
AA = 100 { [ ( ABS sample ABS blank ) 100 ] ABS control }
where:
  • AA—represents the antioxidant activity of the analyzed sample;
  • ABSsample—represents the absorbance of the sample measured at a wavelength of 518 nm;
  • ABScontrol—represents the absorbance of the DPPH sample measured at a wavelength of 518 nm;
  • ABSblank—represents the absorbance of the alcohol sample measured at a wavelength of 518 nm [44].

2.11. Antimicrobial Activity

In our research, we used ATCC microbial strains obtained from the culture collection of the Microbiology Laboratory of the Interdisciplinary Research Platform within the University of Agricultural Sciences and Veterinary Medicine “King Mihai I of Romania” in Banat, Timisoara. In our laboratory, ATCC strains are maintained at −50 °C.
The honey samples were tested against S. pyogenes (ATCC 19615), S. aureus (ATCC 25923), E. coli (ATCC 25922), P. aeruginosa (ATCC 27853), S. flexneri (ATCC 12022), S. typhimurium (ATCC 14028), H. influenzae type B (ATCC 10211), C. albicans (ATCC 10231) and C. parapsilopsis (ATCC 22019).
The MIC is defined as the lowest compound concentration that yields no visible microorganism growth compared to a positive control. The method of MIC determination based on the microbial mass loss by measurement of OD by spectrophotometry according to ISO 20776-1:2019 was described in our previous research [45].

Bacterial Culture

A 10−3 dilution for bacteria, respectively, 10−2 dilution for fungi of fresh culture was used to perform the assay, an inoculum equivalent to a 0.5 McFarland standard. The ATCC strains were revived by overnight growth in Brain Heart Infusion (BHI) broth CM1135 (Oxoid, Hampshire, UK) at 37 °C and subsequently passed on BHI agar (Oxoid, CM1136) for 24 h at 37 °C. The cultures were then diluted at an optical density (OD) of 0.5 McFarland standard (1.5 × 10⁸ UFC×mL) using BHI broth and a McFarland densitometer Grand-Bio (Fisher Scientific, Loughborough, UK). The suspensions were tested using a 96 microdilution well plate, by using a Calibra digital 852 multichannel pipette, we placed 100 μL of microbial suspension in each well. The honey samples were tested at a concentration of 12.5%, 25%, 37.5% and 50%, added in each well. The plates were covered and left 24 h at 37 °C. After 24 h, the OD was measured at 540 nm using an ELISA reader (BIORAD PR 1100, Hercules, CA, USA). Triplicate tests were performed for all samples. The suspensions of strain and BHI were used as a negative control. The values obtained are expressed as OD (optical density) reading values.
OD sample—optical density at 540 nm as the mean value of triplicate readings for honey samples in the presence of the selected bacteria/fungi;
OD negative control—optical density at 540 nm as the mean value of triplicate readings for the selected bacteria in BHI.

3. Results

3.1. Humidity (H) and Dry Matter (D.M.) Content

The analysis of the honey samples at the beginning of the experiment (polyfloral honey from the winter reserve) revealed humidity between 14.94% and 21.93%. After administration of the sugar syrup with EOs, a decrease in the water content was observed in all experimental variants, while in the control group, the water content increased by 2.2%. Three weeks after the use of essential oils in the supplementary food of the bee families, respectively after the first harvest (rapeseed harvest), the experimental groups registered increases of the honey water content between 0.66% (thyme) and 2.94% (cinnamon). Figure 1 shows the data on water content and dry matter, during the three harvests.

3.2. Impurities Content

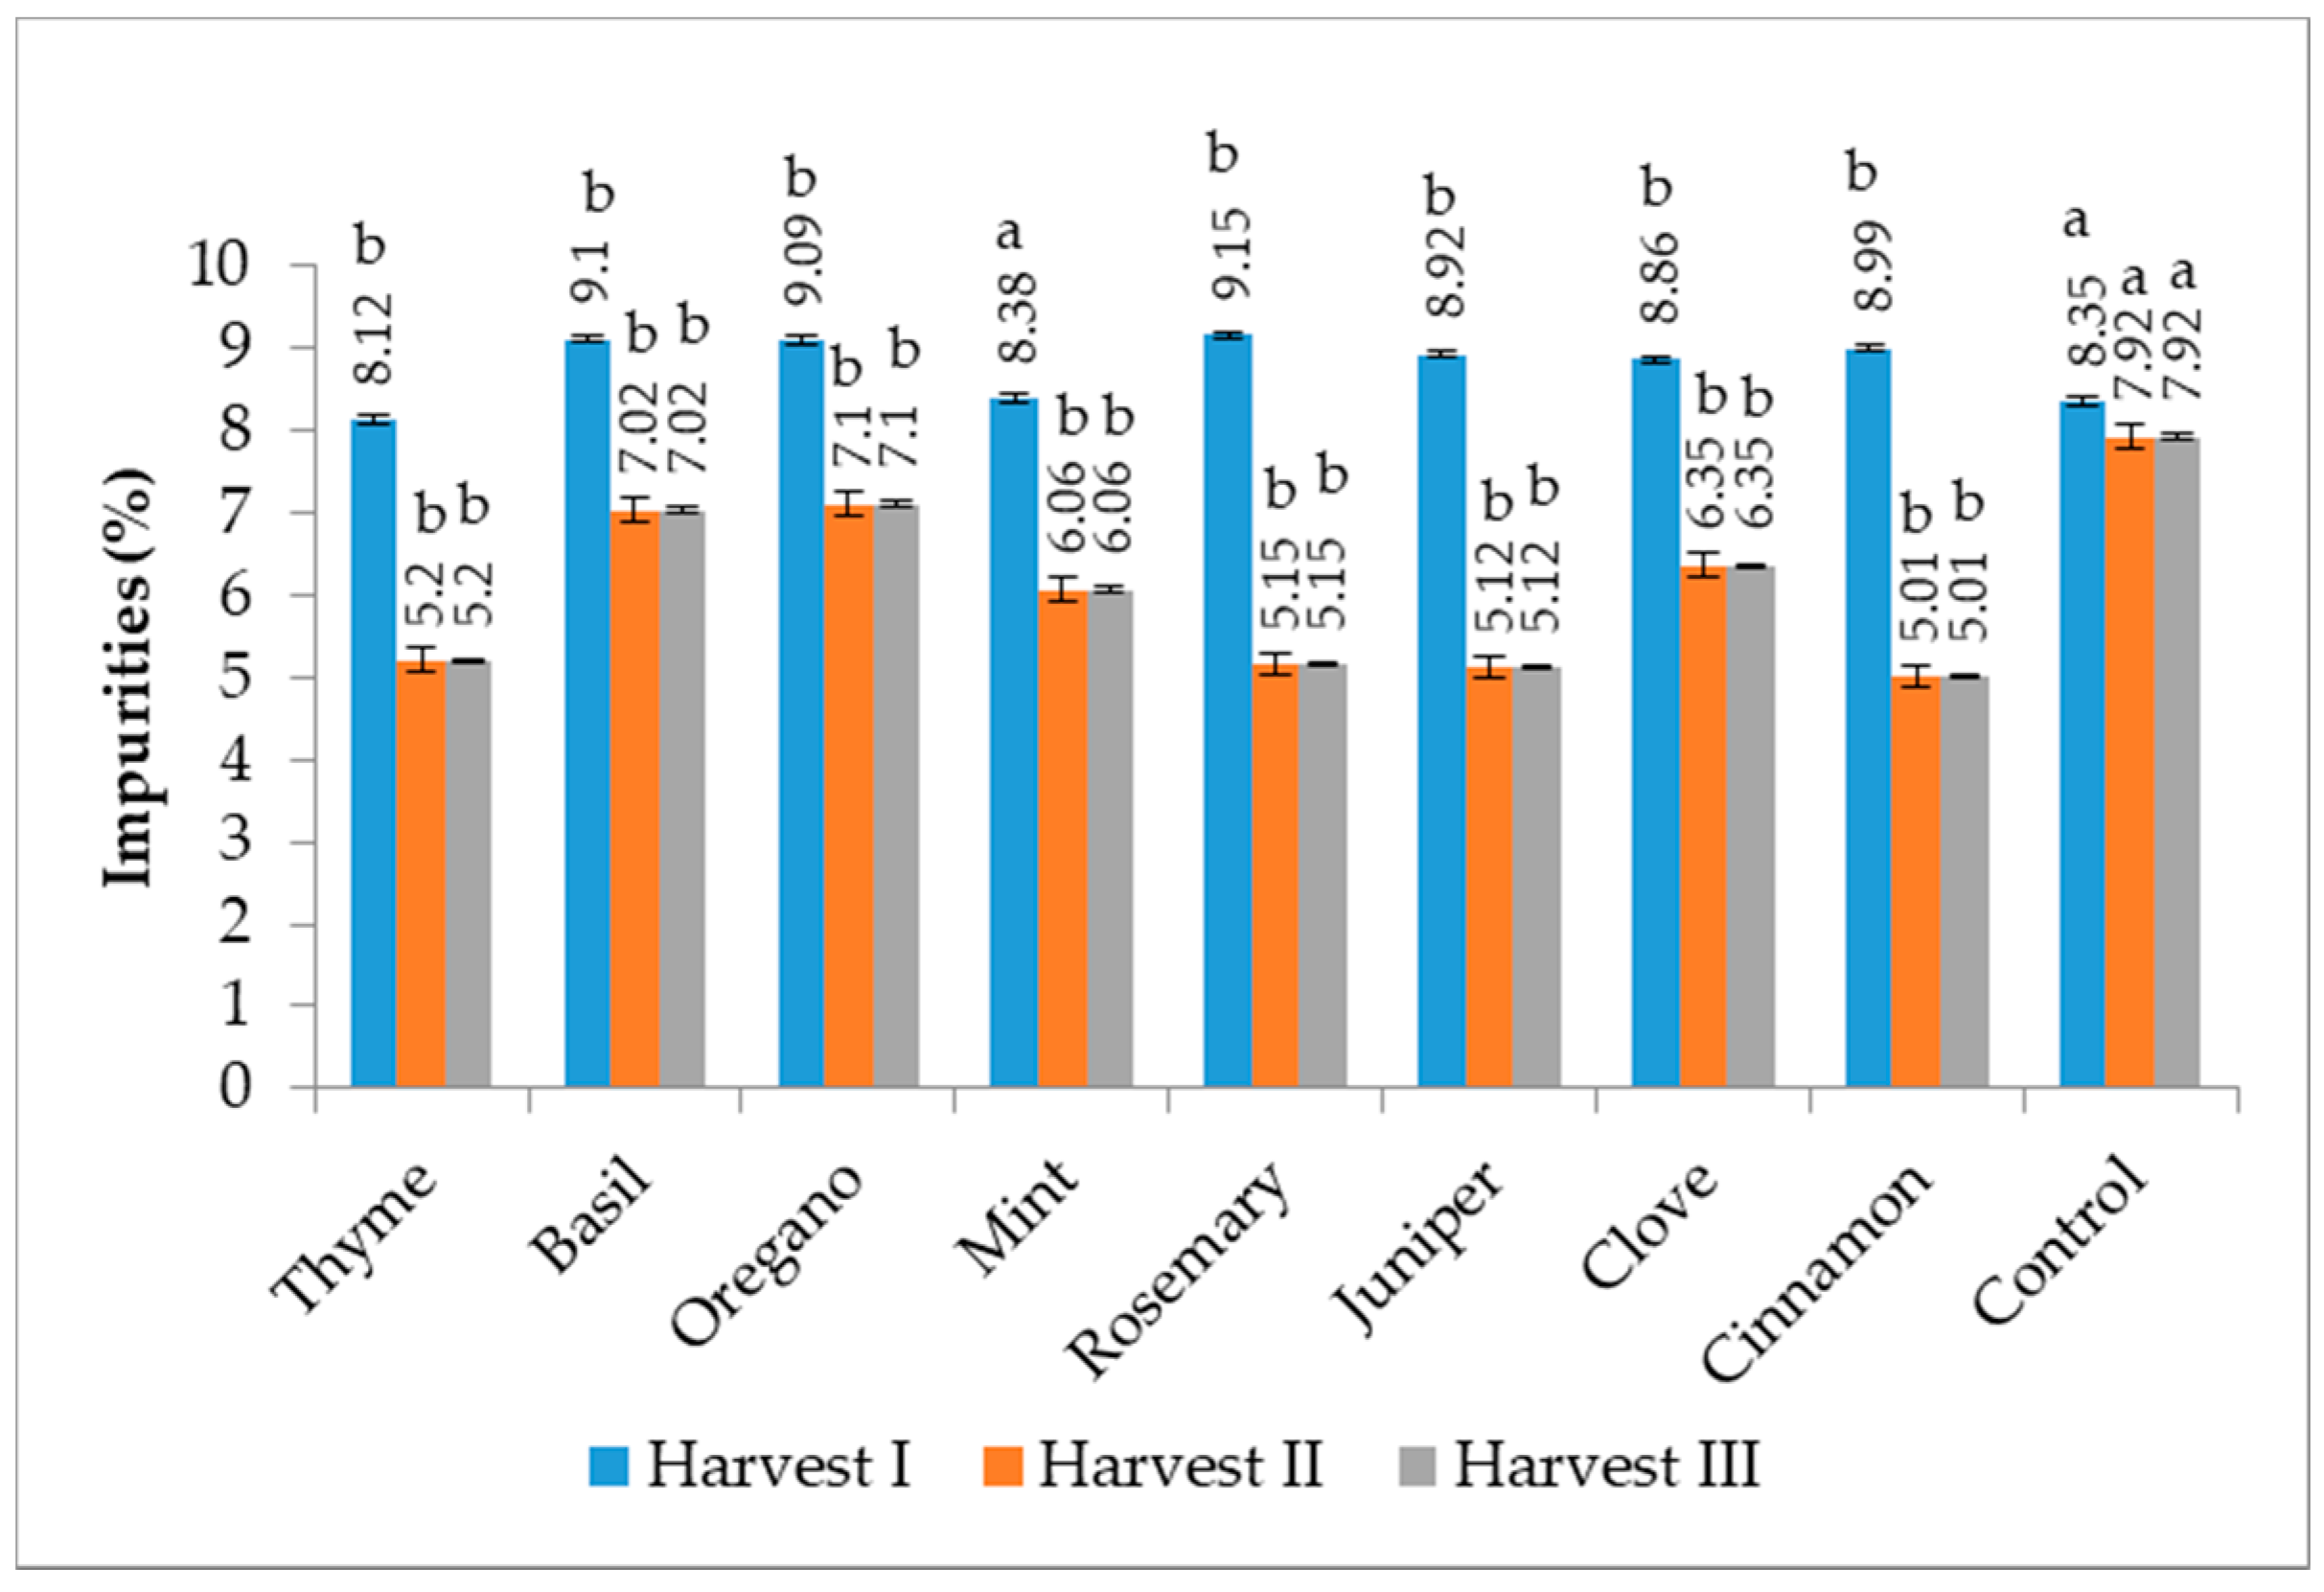
The impurities content varies between 4.11% in the sample treated with oregano EO, after Harvest III and 9.11% for the honey sample with mint oil, after Harvest I. In the analysis of the samples collected after the administration of the sugar syrup with EOs, respectively after the rapeseed harvest, a reduction of the content of existing impurities in honey was observed in all experimental groups, especially in the groups in which oregano, mint and basil essential oil was used, compared to the control group. The average number of impurities before the administration of essential oils in the supplementary feeding of bee families was 8.77%, compared to 5.60% after using these oils (Figure 2).

3.3. Mineral Substance (Ash) Content

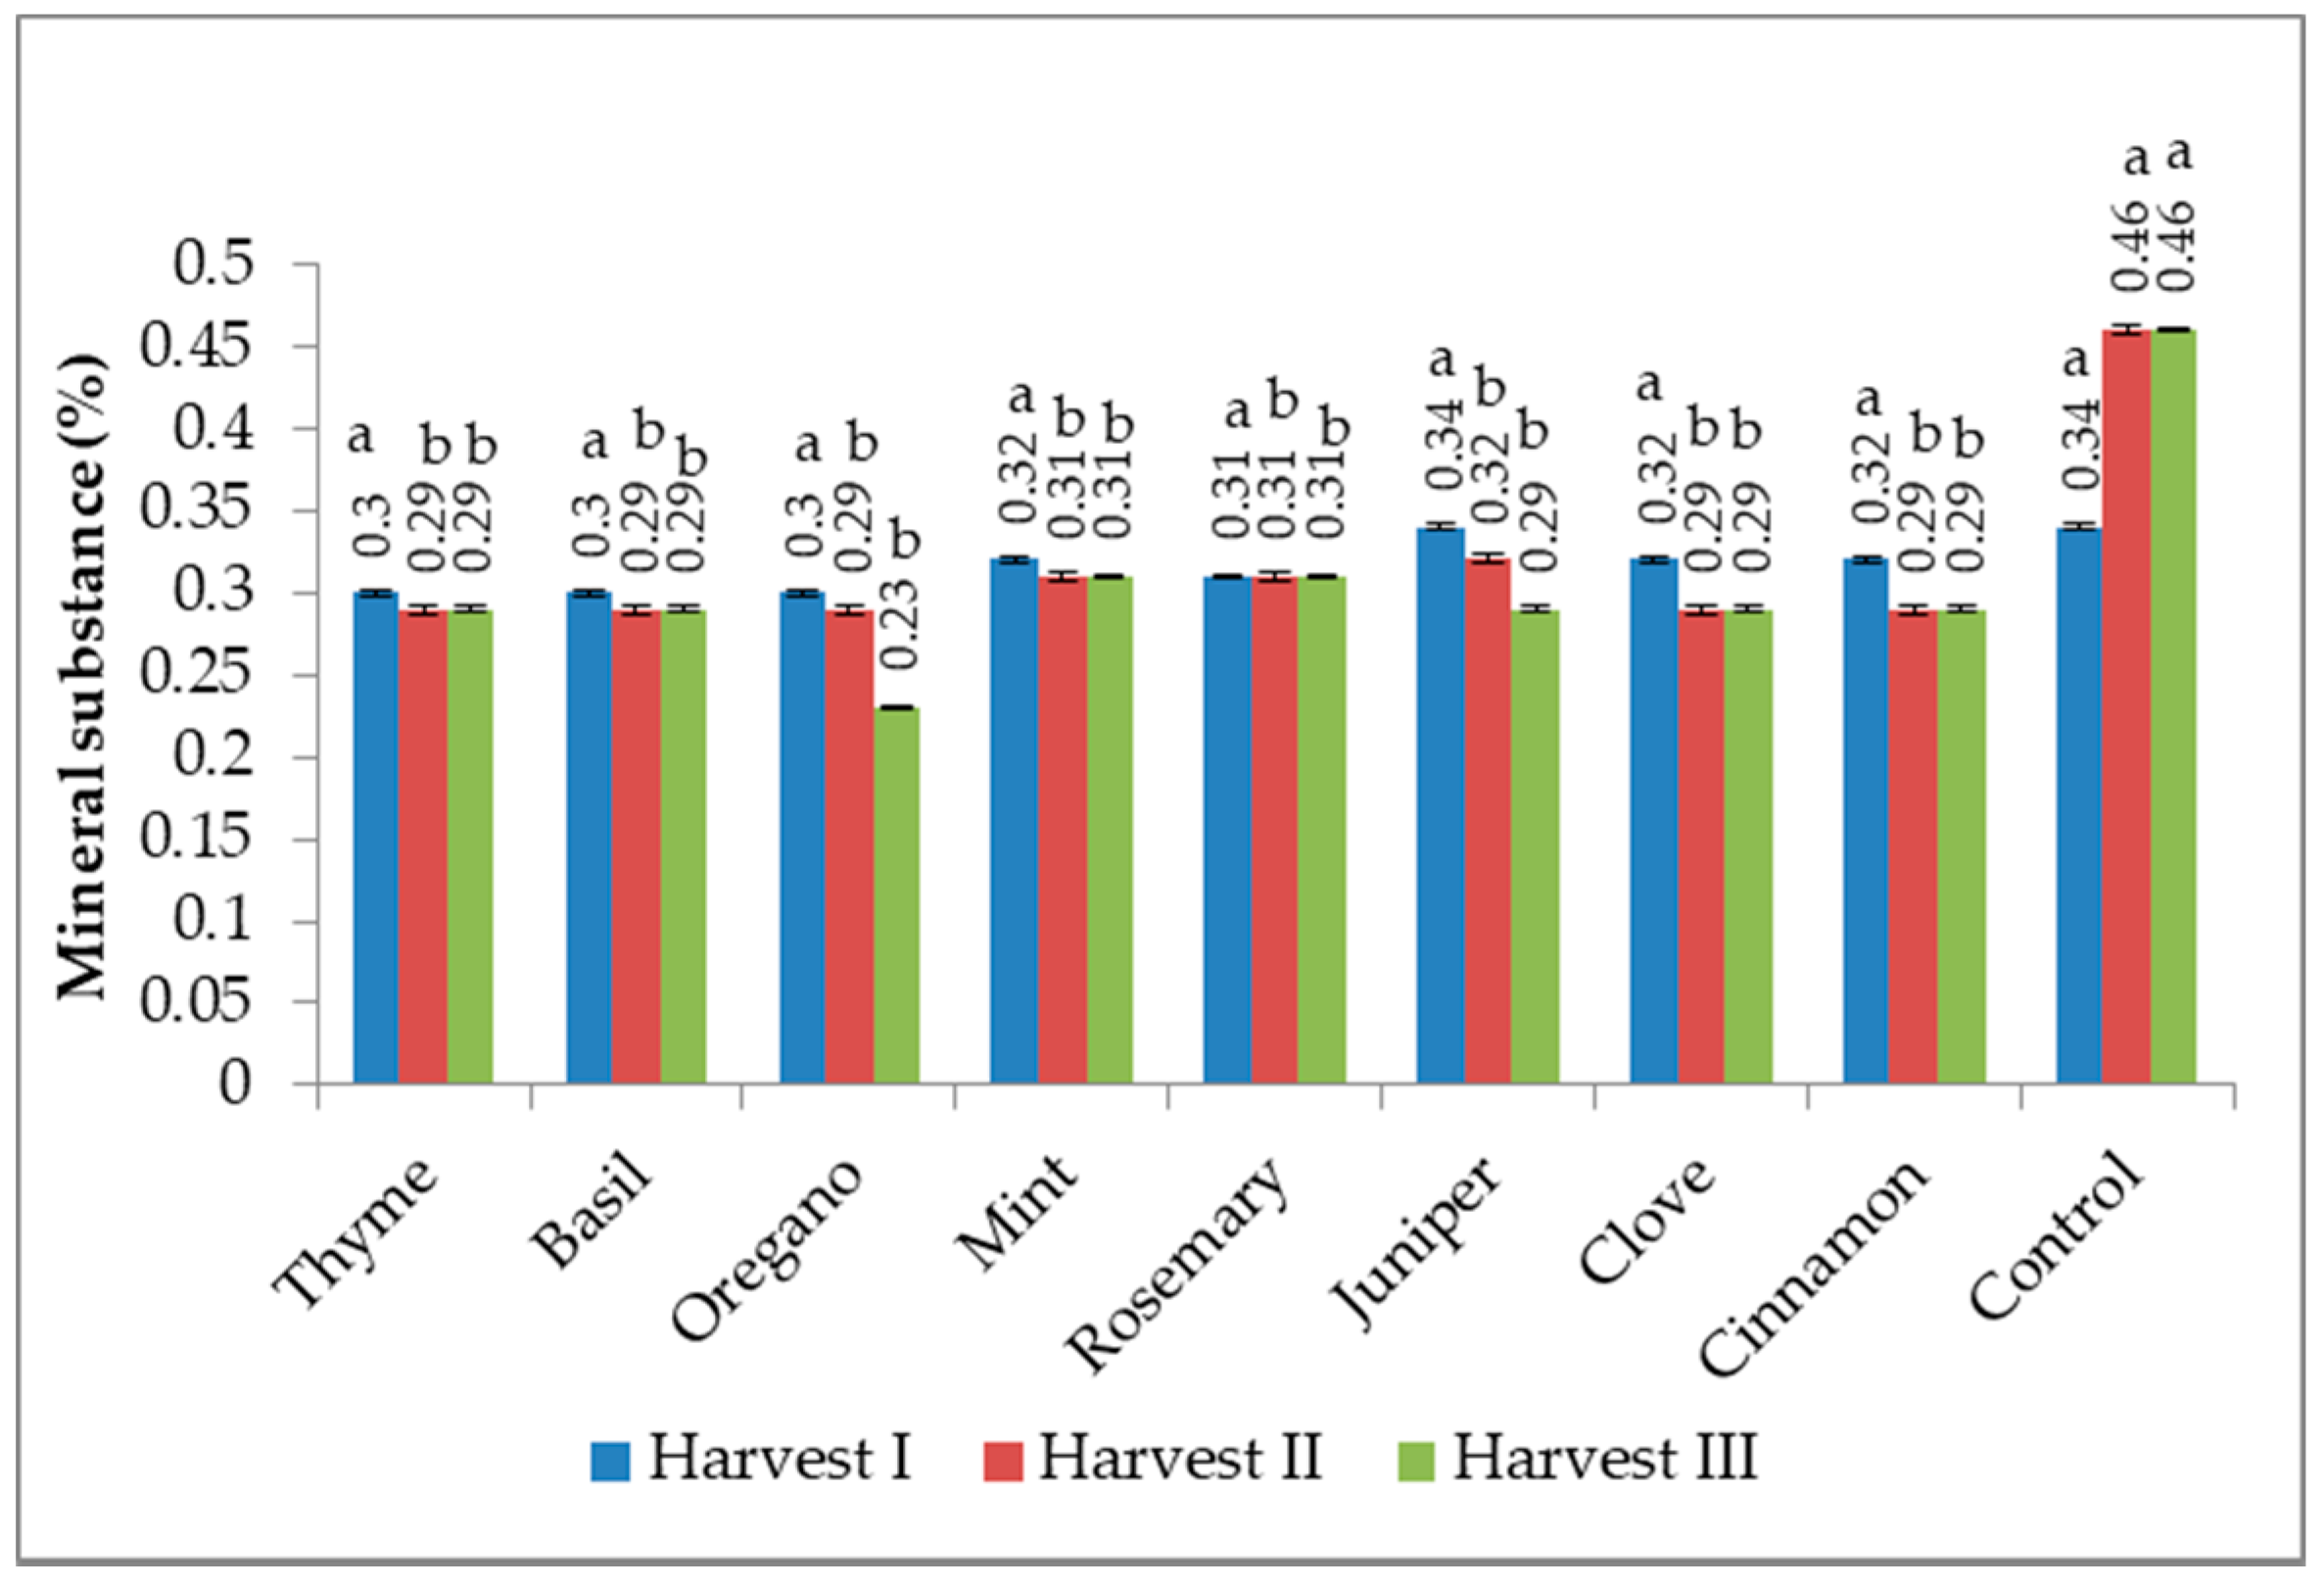
The determined values for the ash content were between 0.23% and 0.46%. Mint essential oil recorded a 23.33% reduction in ash content between Harvest I and Harvest III. The essential oil of cloves registered after the third harvest a reduction of the ash content by 14.70% compared to the first harvest. The average value of the samples subjected to calcination regarding the first harvest was 0.31%, the second harvest 0.31%, and the third harvest, 0.30%, thus obtaining a reduction in the amount of ash by 3.22% between the first and last harvest (Figure 3).

3.4. Acidity Profile

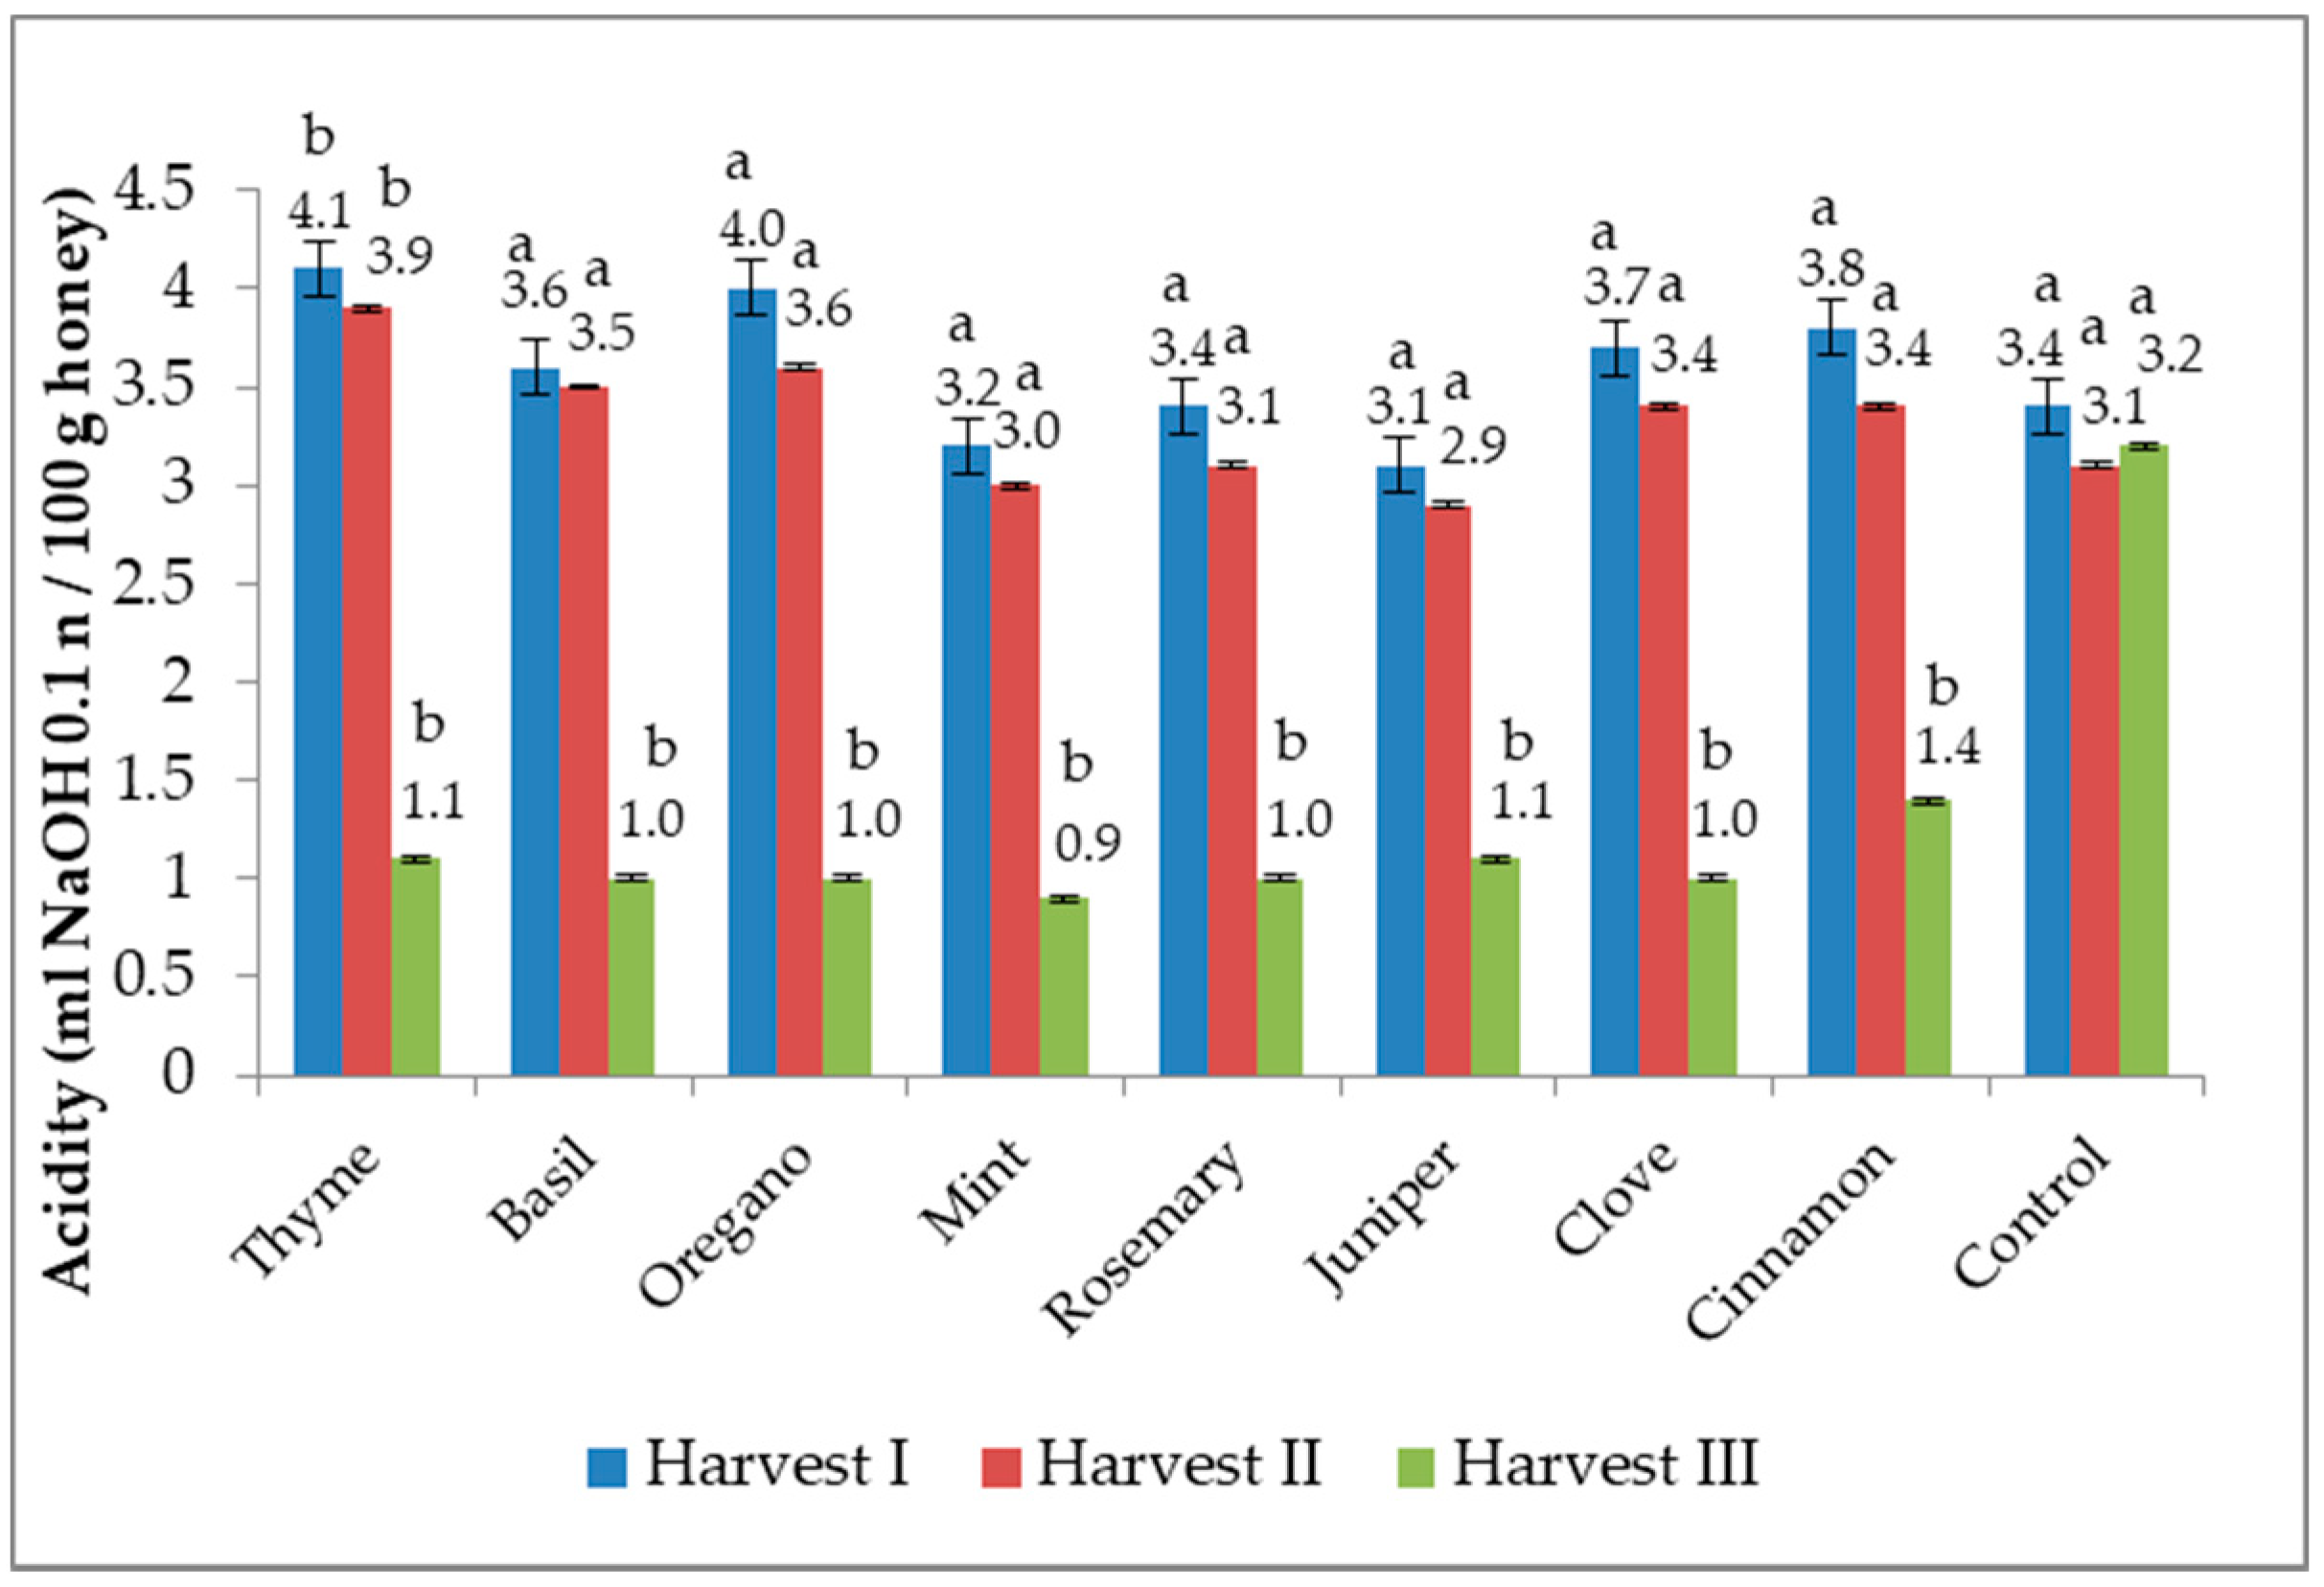
Studies on the determination of acidity at Harvest I and Harvest II did not show any representative changes compared to Harvest III where there were changes in the acidity values of the groups in which essential oils were introduced. The group in which oregano essential oil was used reduced the acidity of honey by 26.82%, thyme essential oil by 25%, juniper by 28.12%, mint by 29.41%, cloves by 35.48%. The control group did not show in the 3 harvests representative changes of honey acidity (Figure 4). Significant statistical differences were recorded between all treatments with EOs in the Harvest III and control and also between thyme samples (Harvest I and II) and control.

3.5. pH Value

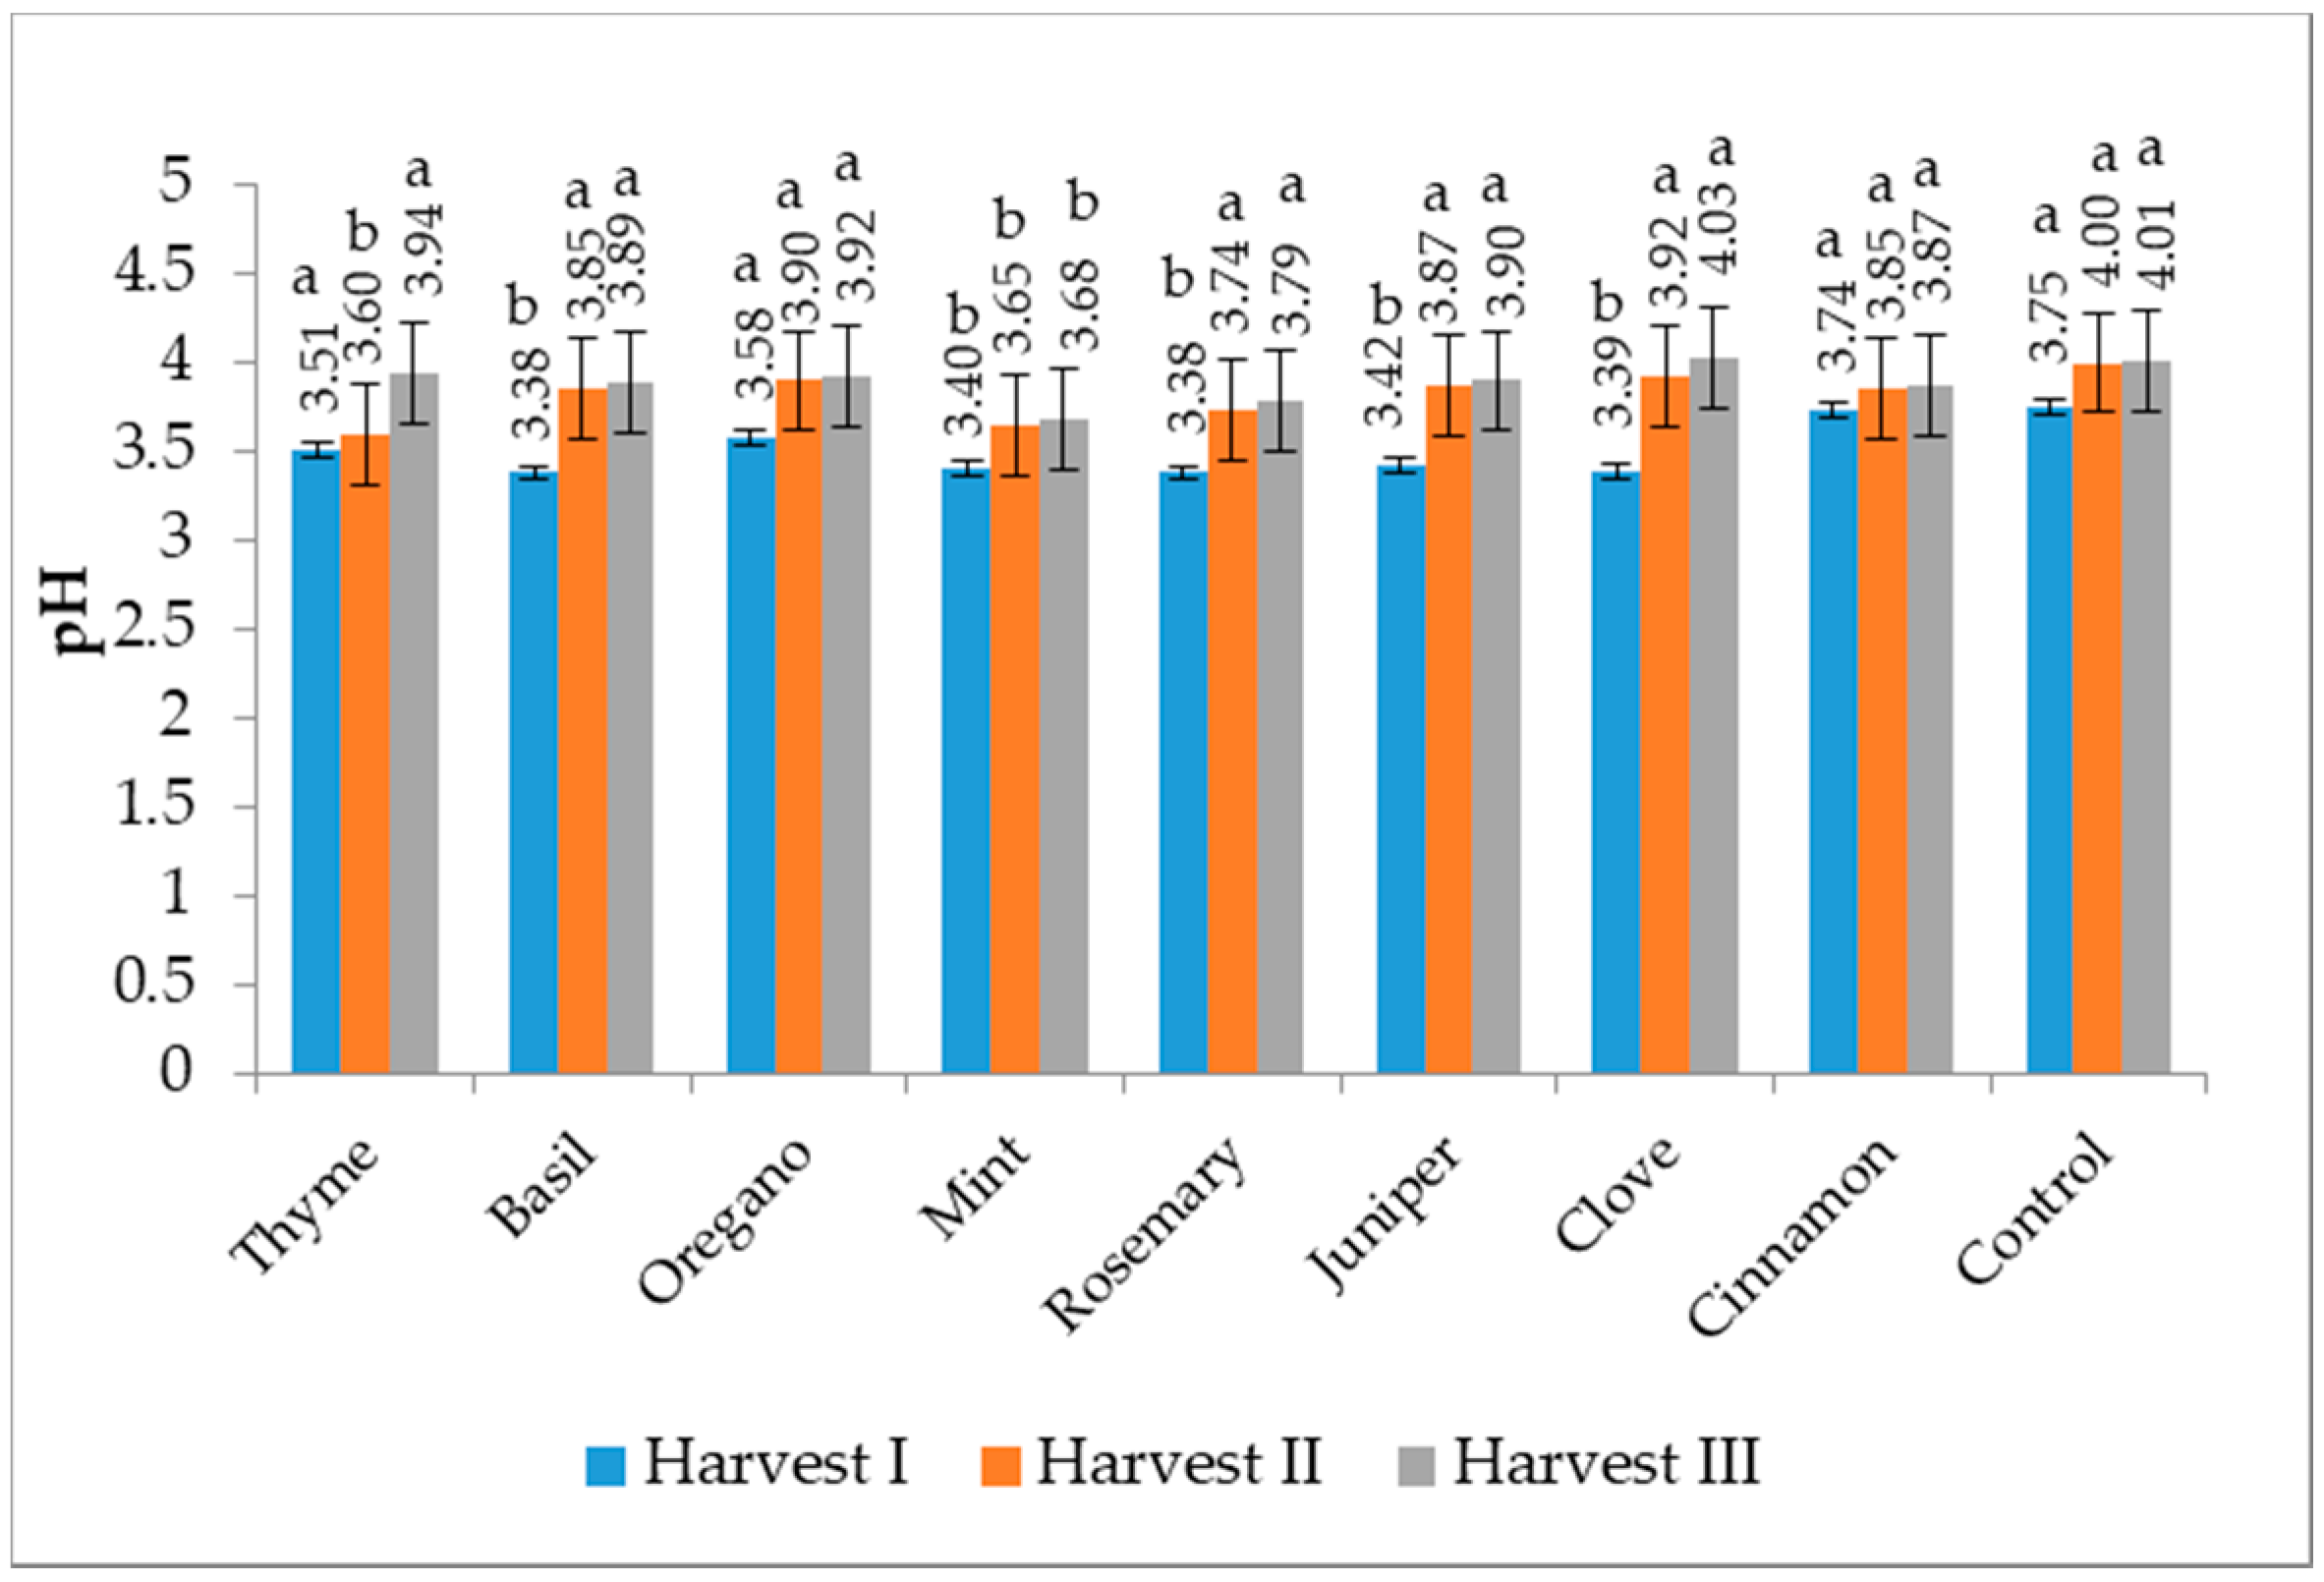
The pH analysis of the honey samples was performed at temperatures between 23.6 °C and 25.8 °C, the registered values being between 3.42 and 4.03. Both the data recorded in the samples collected before the administration of the sugar syrup with EOs and the samples collected after the use of the EOs, respectively after the rapeseed harvest, had close pH values (Figure 5). Some statistical differences were recorded between the pairs: mint (all harvest stages and control), thyme (Harvest II) and control, basil and rosemary (Harvest II) and control.

3.6. Total Phenolic Content (TPC)

At the beginning of the experiment, successive to the analysis of the polyfloral honey samples, which remained as a reserve during the winter in the hive, we found out that TPC in the control sample was 122.02 mgGAE)/100 g. The TPC at Harvest I was between 110.12–159.74 (mgGAE)/100 g, the lowest value was recorded in the sample fed with cinnamon EO and the highest content in the sample fed with basil EO. After 3 weeks of administration of the sugar syrup with essential oils, the samples of honey harvested had a content of polyphenols between 123.51–162.94 (mgGAE)/100 g. The control sample recorded the lowest value, respectively the honey sample with basil EO the highest TPC, followed by mint and thyme. After the first harvest of nectar (rapeseed), the content of the honey samples had a TPC between 123.91 (in control)—163.95 (mgGAE)/100 g. The highest TPC value was recorded in the sample treated with basil EO, followed by the sample with rosemary, oregano, juniper, mint, thyme and cinnamon. The maximum values were recorded in Harvest II, except the treatment with rosemary and oregano where, in the Harvest III, the maximum TPC was obtained (Figure 6). Except for the honey harvested after the last treatment with thyme oil, for all other samples, there are statistically significant differences in terms of TPC compared to the untreated control.

3.7. Reducing Sugar Content

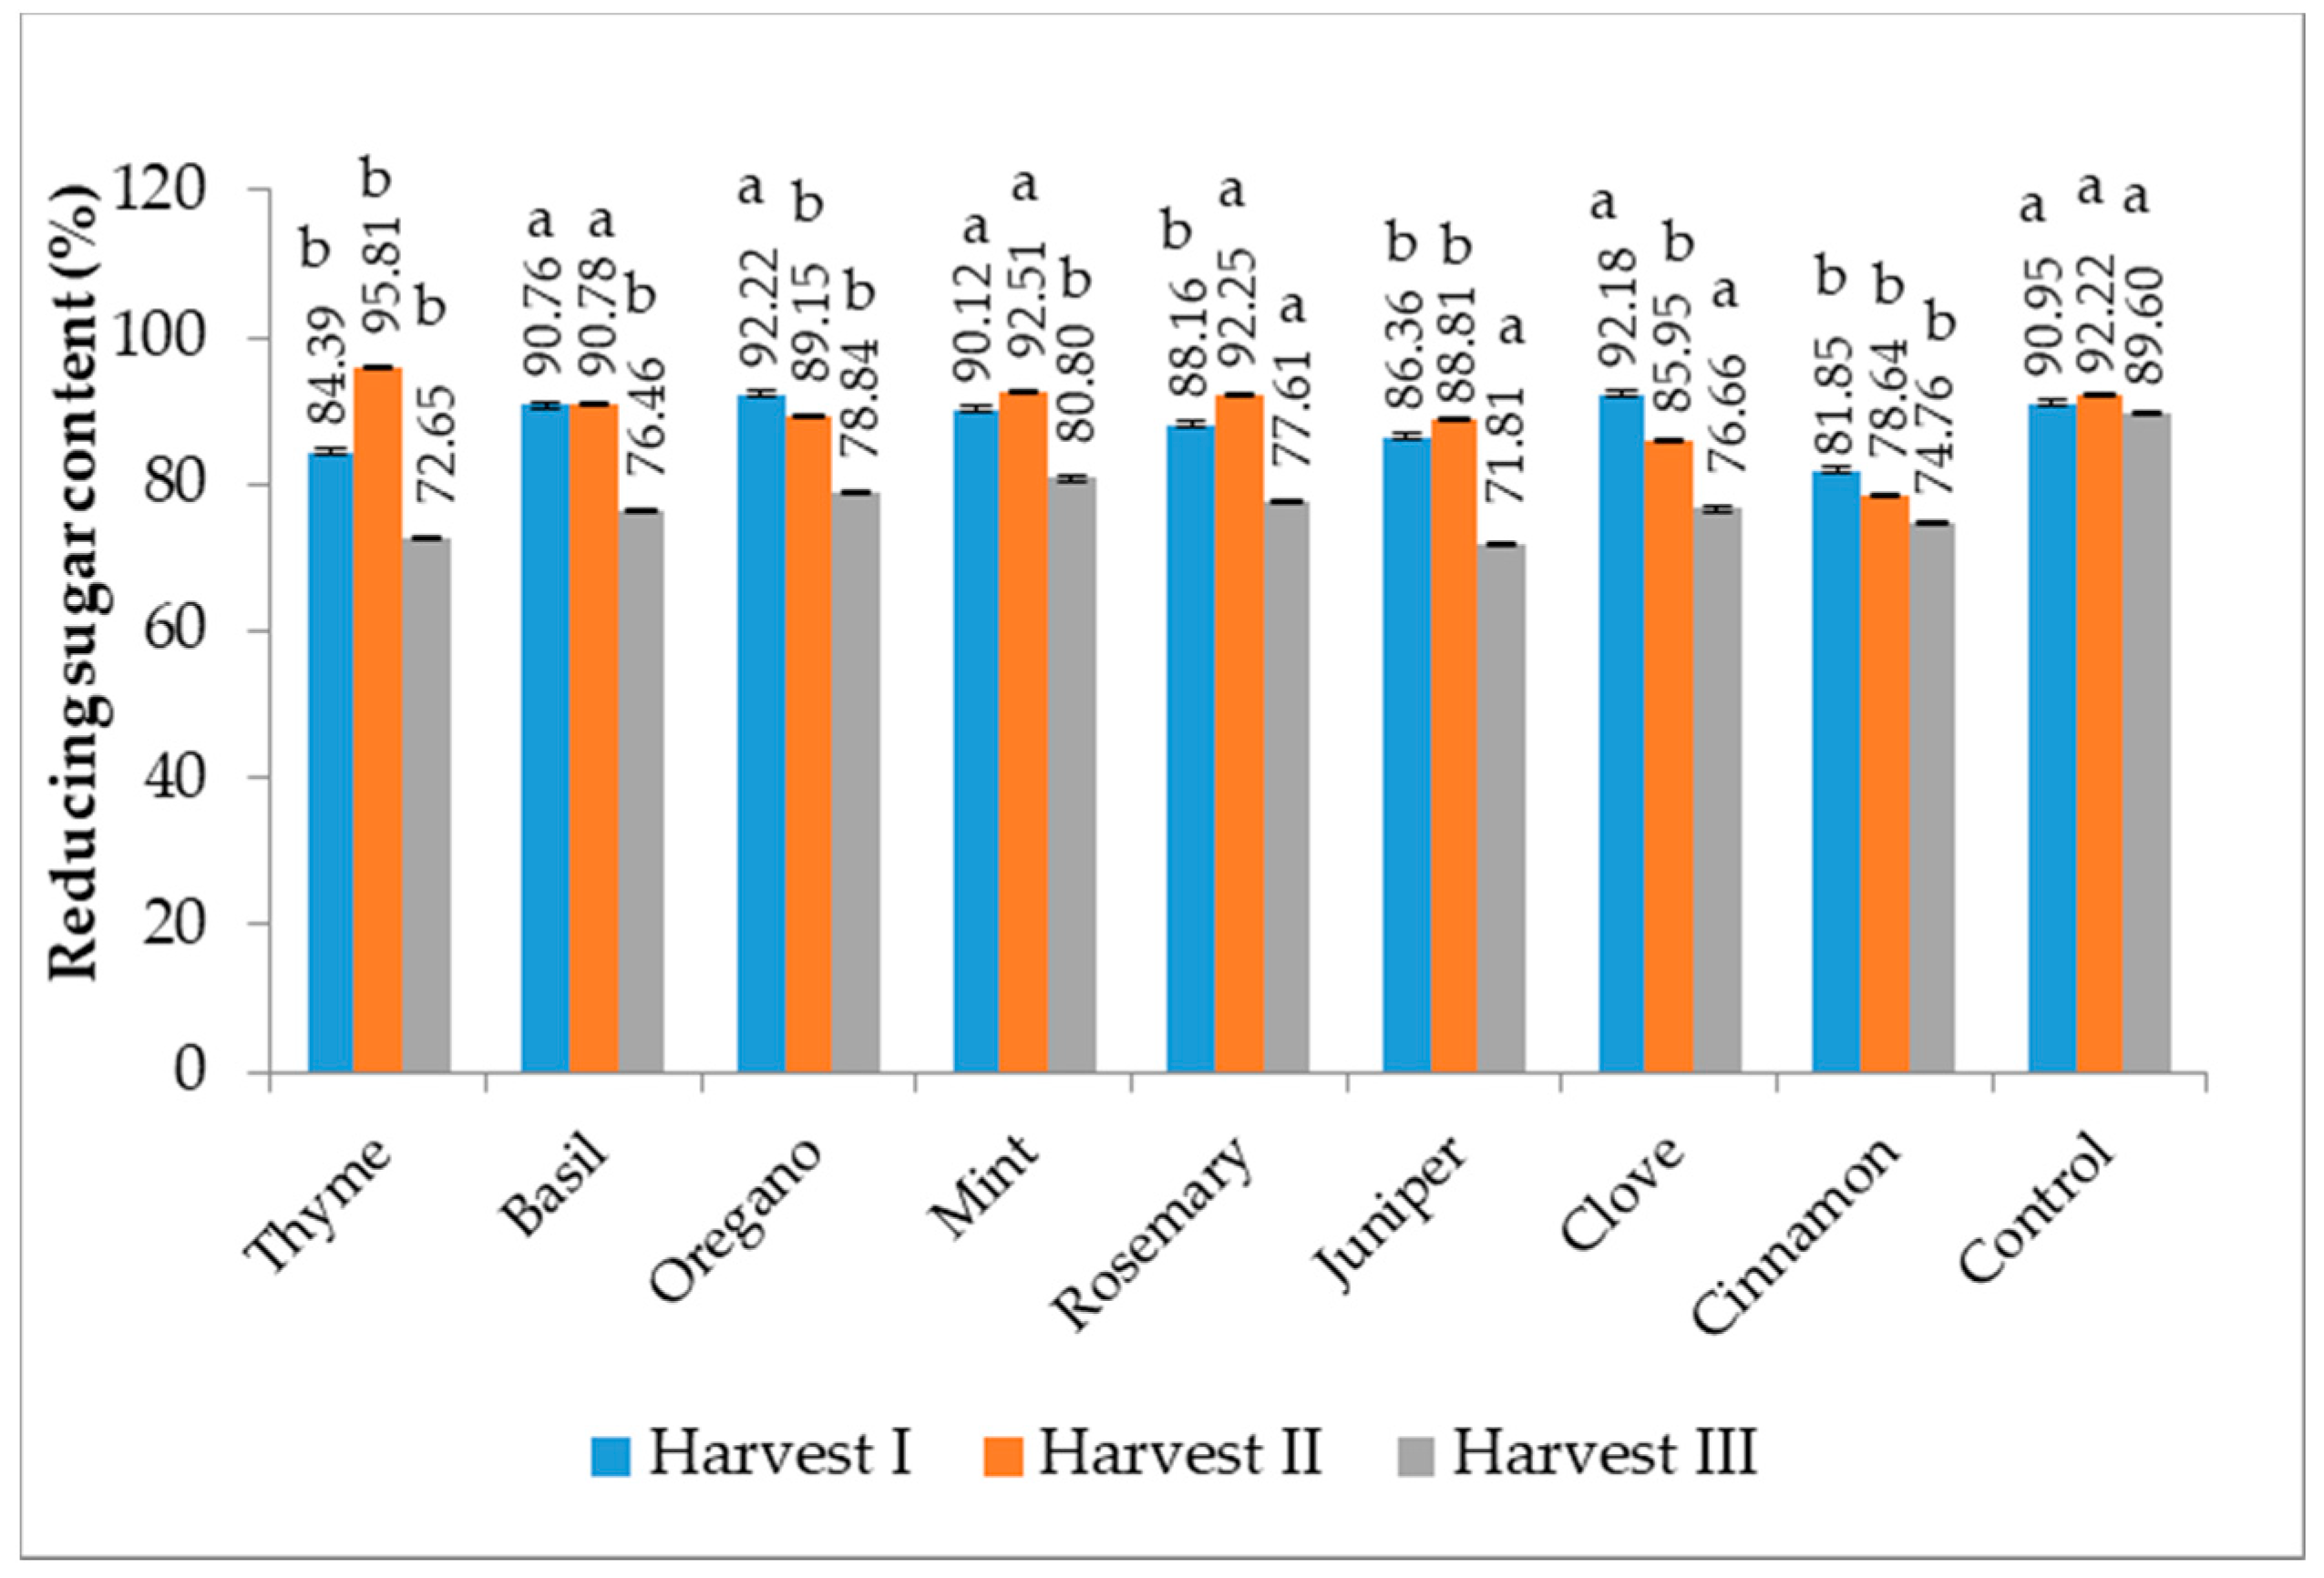
Reducing sugar content values were reduced in all experimental groups in which Eos were used, compared to honey from Harvest I (before administration of EOs). Inverted sugar reduction values for groups with the addition of essential oil were lower by 8.67% (mint EO) and 16.84% (oregano EO) (Figure 7). There are statistical differences between thyme samples and control, cinnamon and control, for all harvest times, and also between basil, mint, oregano (Harvest III) and control, oregano, clove, juniper (Harvest II) and control and rosemary (Harvest I) and control.

3.8. Flavonoid Content (FC)

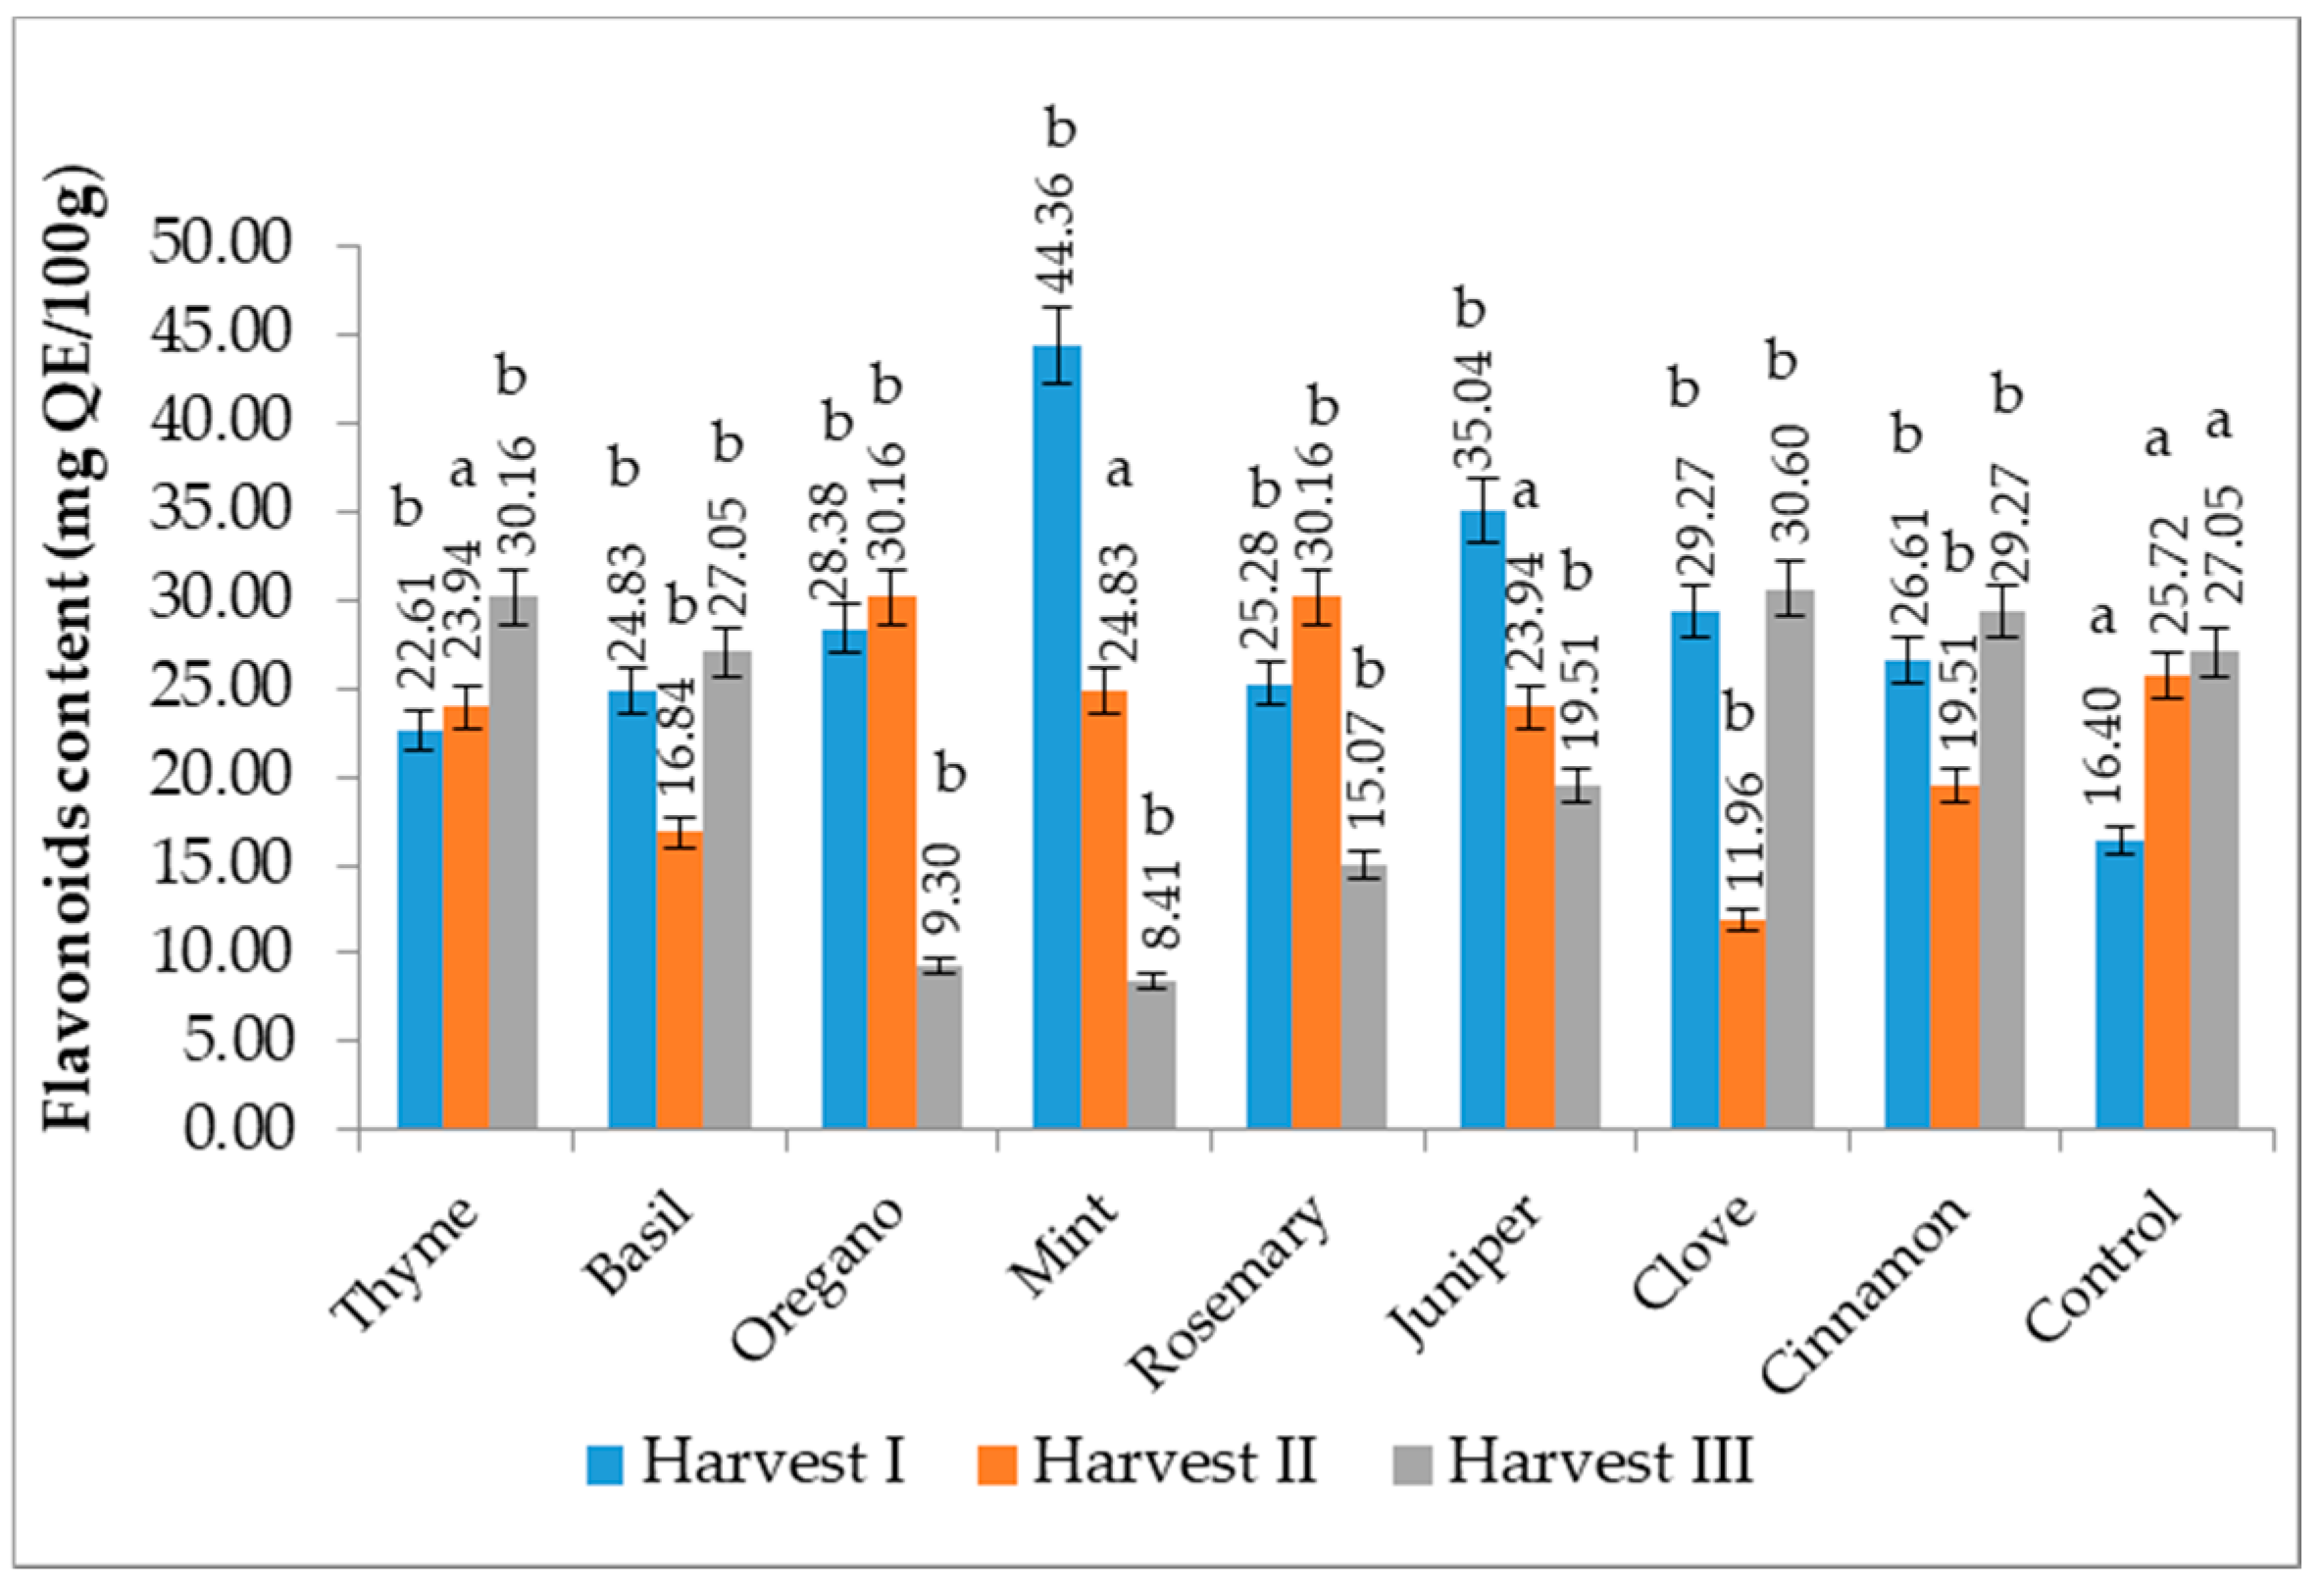
The FC varies between 8.41 mgQE/100 g in control and 44.36 mg/100 g in the honey treated with mint EOThe FC increased after the administration of sugar syrup with EOs in all honey samples after 7 days of treatment, the highest value being recorded after the treatment with mint and juniper EO. In the groups where essential oil of mint, oregano, rosemary, and juniper was used, the FC decreased at Harvest III compared to Harvest I, the values being between 8.41–19.51 mgQE/100 g (Harvest III). The groups in which we used thyme, basil, cloves, and cinnamon, essential oil determined an increase in the flavonoid content at Harvest III compared to the first harvest, the values being between 27.05–30.60 mg QE/100 g honey (Figure 8). Except for thyme, juniper and mint administration at Harvest II, where no significant differences compared with the control were recorded, other samples showed significant differences compared with the control.

3.9. Antioxidant Activity by DPPH

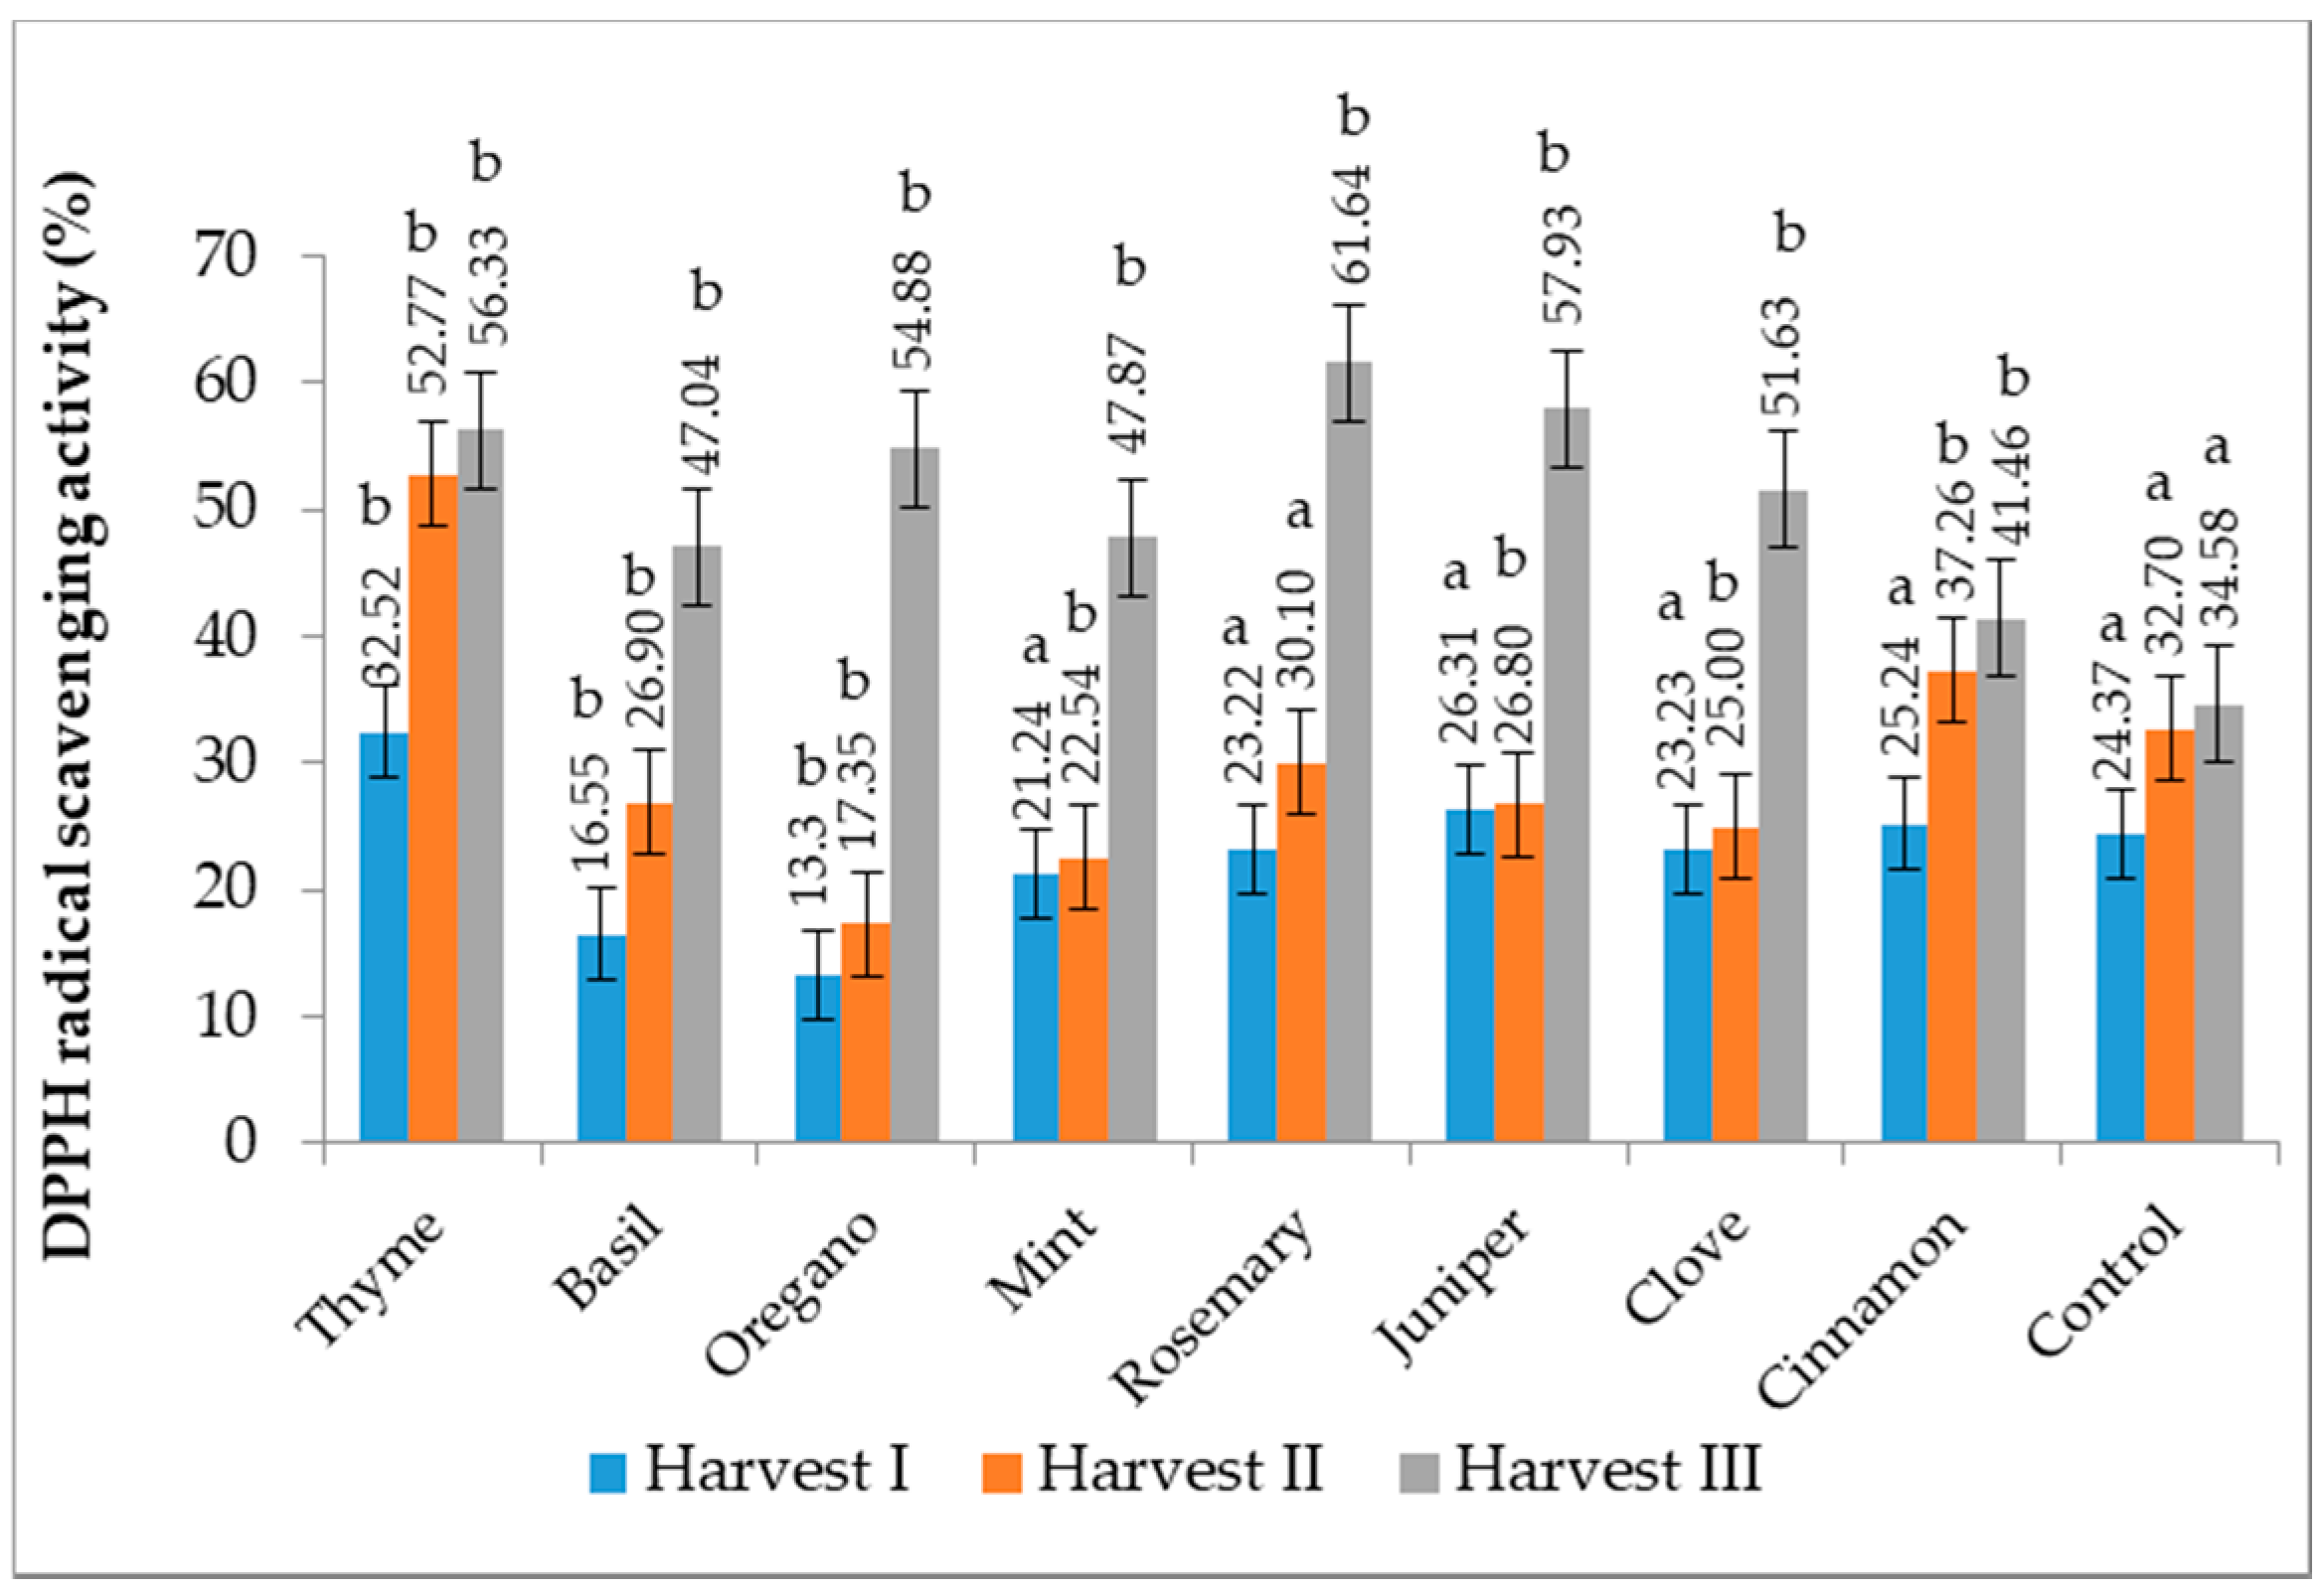
The antioxidant activity (AA) was highlighted in all groups in which we administered sugar syrup with addition of EOs. The groups with the highest values were those in which juniper, clove, rosemary, basil, thyme, cinnamon, oregano EOs were used. The average value of antioxidant activity was 22.88% (Harvest I), 30.15% (Harvest II) and 50.37% after harvest III (for rapeseed) (Figure 9). In the control sample, the AA value varies between 24.37% (Harvest I) and 34.58% (Harvest III), while in the experimental samples, after the treatment with EOs, the AA values increase until 61.64%, the maximum value recorded for the juniper sample. Similar values after Harvest III were obtained when EOs of basil, clove or rosemary were used in the feeding of bees. Except for the treatment with rosemary EO, Harvest I and Harvest II, statistically significant differences related to the control were observed.

3.10. Antimicrobial Activity

Table 3 presents the antimicrobial activity of EOs against different strains, expressed as OD, after Harvest II, while Table 4 presents the same evaluation after Harvest III.
The honey samples were harvested after the treatment with different concentrations of EOs, noted in the table as: thyme (T); basil (B); oregano (O); mint (M); J (juniper); R (rosemary); CL (clove); CI (cinnamon); C (control). The gray color highlights the samples where the MIC was determined, with the MIC value highlighted. The effect was maintained together with an increase in concentration. The samples that had a strain-boosting effect, maintained with an increase in concentration but still reached an MIC value, are marked in yellow color.
Concerning the effect of the tested honey samples on the bacterial/fungal strains, the registered effect is either a strain-boosting effect, where the bacterial/mycelial mass growth of the strain affected by the oil is larger than that found in the case of the simple strain, which is therefore a potentiating effect, or an inhibitory effect, in which case the mass growth of the bacterial/mycelial strain is lower than that reported for the simple strain.
Yellow color highlights MIC values (inhibition) but with upward evolution, the effect being one of sustained strain-boosting effect with increasing concentration; the gray color highlights sustained MIC values, the trend sustained as the concentration increases.

4. Discussion

4.1. Chemical Composition

In our study, the resulting humidity content in the honey after treatment with Eos was between 14.94% and 21.93%. Similar studies were conducted by other authors on the harvesting of the thyme nectar by bees [46]. They showed that the matured honey resulting from thyme nectar has a water content of less than 19%. These values resulted either from the maturation of honey, which has a high concentration of metabolites, or the volatile essential oils from thyme can evaporate through the intense ventilation activity performed by bees before capping the cells with honey.
European Union Directive (EU) 2001/110/EC, relating to honey [47] and Turkish Food Codex 2005, [48], set limits on the content of impurities present in honey, these being a maximum of 100 mg of impurities per 100 g of honey. Research on the content of impurities in honey produced and consumed in Turkey has been undertaken by Bakirdere et al. (2016) [49], and the results obtained indicated values between 10–95 mg/100 g sample. The average of the impurities in the analyzed samples was 58.5 mg/100 g sample. The results obtained in our study are in line with those obtained by other authors: 0.21–1.19% [50], 0.46% [51], the limits being influenced by the honey source that supplies the nectar.
Honey contains different organic acids, as well as aliphatic and aromatic acids. The aromatic acids greatly contribute to the flavor of honey [52]. In the studies carried out by [51], the average value of the acidity of the analyzed honey samples was 2.16 mg/100 g. The mean values for the current study ranged from 2.3 mg/100 g (family of bees fed with sugar syrup and clove essential oil) to 4.8 mg/100 g (family of bees fed only with sugar syrup). The value obtained helps fight free radicals resulting in the fact that honey acid is a compound that has antioxidant properties. Honey acts as a buffer, which means that by adding small amounts of acids and bases, the pH does not change, which prevents chemical processes [53,54].
According to the National Honey Board, the acidity of honey ranges from a pH of about 3.4 to about 6.1, with an average of 3.9. The acidity of any honey is directly related to the floral sources that created it [55]. Our results are in line with those stipulated in EU legislation, the registered values being between 3.42 and 4.03.
The sugar content of honey is influenced by the time of collection and storage of honey. It is composed of fructose, glucose, sucrose [56]. Akharaiyi et al. (2016) [51] studied the percentage of reducing sugar, the average value of 78.8% was obtained in the samples analyzed in Lagos State, 66.5% in the samples in Osun State and 56.7% in the samples in Oyo State.
In general, phenolic constituents are responsible for the antioxidant effects of bee products and belong to two main classes: flavonoids and phenolic acids [57]. The strong antioxidant action of these compounds is well known, as they are able to annihilate free radicals, thus protecting cell membranes against lipid peroxidation. Flavonoids can reduce the cellular level of H2O2 and NO, this action probably contributing to its anti-inflammatory effects; the antioxidant action is also closely linked to other biological effects, including the chemopreventive effect [58].
In addition to the effect of inhibiting the oxidative reactions in the chain and chelating the reactive metals, antioxidants prevent the formation of reactive species, neutralize and remove them. Bee products are considered sources of natural antioxidants that can reduce the effects of oxidative stress. Of these products, propolis generally has the highest antioxidant activity, followed by royal jelly and honey (5.0–15.5 mg/mL) [59].
The previous studies [60] showed that the content of polyphenols in honey is very important because they lead to the antioxidant activity. The same authors found a correlation (r = 0.963) between the content of total phenolic content (TPC) and antioxidant activity in honey.
Our results are in line with those obtained by other authors [61]. Thus, before the administration of the treatment with EOs, the TPC in our honey sample was 110.1 mgGAE/100 g and increase, after the administration of EOs until 163.95 mgGAE/100 g, in the honey sample treated with basil EO. Other authors reported, in Sicilian black honeybees, a TPC content between 41.11–13.90 mgGAE/100 g, respectively in honey from Spain 100–137 mgGAE/100 g [62,63]. TPC in the samples harvested from Romania was found in the range of 12.75–31.04 mgGAE/100 g [64], while in chestnut honey samples from Turkey, the TPC was 470.70 mgGAE/100 g and 34.37 mgGAE/100 g in wild mint honey [65].
Pauliuc et al. (2020) studied the TPC and FC content in thyme and mint honey samples purchased from apicultural associations from different regions in Romania [66]. The TPC was 18.9 mg/100 g in the mint honey and 23.7 mg/100 g in the thyme mint. Our results highlight the contribution of TPC conferred by the addition of EOs in bee feed. Thus, the TPC in the harvested honey is 143.7 mgGAE/100 g in the mint honey and 137.88 mgGAE/100 g in the thyme honey, emphasizing the importance of treatment with EOs in order to improve the antioxidant activity of honey. The best results were obtained in the case of applying the treatment with basil oil, where there is an increase in TPC compared to the control even after 7 days of administration, values that remain constant even after one month of treatment.
In a broad sense, flavonoids are pigments with a universal spread in plant, with more than 5000 compounds currently known, most of which have increased solubility in water [58]. The content of honey flavonoids (FC) is influenced by both geographical and floral origin and climatic conditions [66], highlighted the fact that there is a low correlation between the content of TPC and the FC.
Our results show an increase in FC content after 7 days of treatment for all variants of EOs used, which demonstrates the effectiveness of supplementing bee feed with EOS-enriched syrup. After Harvest II and III, there are variations in FC, either increases or decreases depending on the type of EOS administered. It should be noted that in the control group, the amount of FC increases from the first to the last harvest, which means that the intake of FC is ensured not only by the EOs syrup introduced in the bees’ diet. Previous studies highlighted that FC in the honey from Romania [65] varies between 17.4–25.7 mgQE/100 g, 6.85–18.01 mgQE/100 g (Sicilian honey) [62], and between 7.66 to 16.23 mg QE/100 g in rape honey from Kosovo [67]. Another Romanian study reported that FC content of honey samples ranged between 0.91–2.42 mg QE/100 g in acacia honey, 4.70–6.98 mg QE/100 g in tilia honey, and between 11.53–15.33 mg QE/100 g in sunflower honey [68].
The highest AA value was recorded in our experiment, after administration of juniper EO (61.64%), but also for clove EO (57.93%) and basil EO (56.33%) comparatively with the control value (34.58%) after Harvest III. The increase in AA at the end of the experiment is noticeable for all experimental variants, including control, but to a lesser extent compared to EOS treatments. Similar studies on antioxidant activity using the DPPH method were reported in Romanian honey, namely DPPH values between 55.4–79.05% in mint, thyme, polyfloral, rape and sunflower honey [66].
The antioxidant action of honey is influenced by its chemical composition. The composition of honey depends on a number of factors (bee species, botanical origin, geographical area, temperature variations, collection season, storage conditions [69]). In this sense, studies regarding the influence of various factors (climatic, ecological, agrochemical, chemical, technological) on the honey quality are of interest in order to approach a sustainable apiculture.

4.2. Antimicrobial Activity

Our results showed that the evolutionary trend of antimicrobial activity is obvious, namely the development of an inhibitory effect over time. The inhibitory properties are much more evident in the case of Harvest III (Table 4).
In the studies conducted by Estevinho et al. (2008), the antimicrobial activity of honey was tested using six bacterial tupins (Bacillus publitis, Staphylococcus aureus, Staphylococcus lentus, Pseudomonas aeruginosa, Klebsiella pneumoniae, Escherichia coli) [70]. By determining the antimicrobial activity of honey extracts, it was found that Staphylococcus aureus strains were the most sensitive (0.4 mg/mL). The strains of Escherichia coli, Klebsiella pneumoniae, Staphylococcus lentus and Bacillus subtilis were moderately susceptible, and no antimicrobial activity was observed for bacterial strains of Pseudomonas aeruginosa.
In our study, the case of S. pyogenes, the antimicrobial activity is very weak in the samples taken in Harvest II. Table 3 shows in yellow the values denoting inhibition evaluated as MIC, but these values are not simultaneously supported as evolution with the increase of concentration. Instead, the increase in the concentration of samples taken in Harvest II led to an obvious potentiating effect, with values much higher than those of the control. There is only one test with an obvious inhibitory effect sustained with increasing concentration, namely in the case of samples R 75 and R100. The MIC values obtained vary between 0.747–0.719, with values lower than those obtained in the case of S. pyogenes strain (0.796) increased as a control. The only samples with an inhibitory effect that increases with increasing concentration are C (with values ranging from 0.734 to 0.748) as well as O 25 (0.787), CL 25 (0.78) and M 25 (0.704). All other values are higher than the control value, thus, cannot be considered MIC and have an obvious potentiating effect. The situation is a bit different in the case of Harvest III, when in addition to maintaining the inhibitory effect of R, it also occurs in the case of M 50 (0.729), M 75 (0.716) and M 100 (0.705) as well as in the case of B. The inhibition trend in the case of samples B should be discussed, in which, if in the case of Harvest II, they presented MIC values but with potentiation effect synchronized with the increase of concentration, in the case of Harvest III, the effect is clearly one of inhibition, sustained a with increasing concentration, with values ranging between 0.782 and 0.714. It should be noted that the values in the case of R samples are much lower in Harvest III than in Harvest II, the pattern of the action being maintained. In addition, obvious MIC values with increasing concentration appear in the case of C 100 (0.701).
In the case of S. aureus (ATCC 25923), according to the values presented in Table 3 and Table 4, the evolution of inhibition between Harvest II and Harvest III is obvious. Thus, if in the case of Harvest II only R, O and J obviously have antistaphylococcal activity, sustained by the increase of concentration, in the case of Harvest III, the number of samples with inhibitory effect are in greater numbers, namely B, T, R, O and J. Even the values obtained in the case of samples with effect in both sampling periods have an improved antimicrobial effect in Harvest III. This is evident in the case of R samples, in which in the case of Harvest II, the inhibition values are present only at two of the tested concentrations R75 and R100 (0.67, 0.534) while in the case of Harvest III, all four tested concentrations have effect inhibition, with values ranging from 0.564 to 0.621 compared to the control which had an optical density of 0.629. Other authors reported similar data regarding the antimicrobial activity of honey samples against S. aureus [71,72].
Taormina et al. (2001) conducted studies according to which honey from six floral sources was used (treated or untreated with catalase) against bacterial strains Escherichia coli, Staphylococcus typhimurium, Staphylococcus sonnei, Listeria monocytogenes, Staphylococcus aureus and Bacillus cereus. It has been shown that Staphylococcus aureus was the most sensitive for all types of honey analyzed [73].
Our results showed that S. flexneri, S. typhimurium and E. coli proved to be one of the most susceptible strains at the activity of samples taken during Harvest I. So, concerning S. flexneri, the most effective samples with MIC values influenced by concentration presented in gray color, proved to be C (0.923–0.878), B (0.922–0.882), R (0.849–0.705), CL (0.789–0.646) and CI (0.753–0.714), compared to the positive control which presented an OD of 0.956. We want to highlight that the inhibition effect was present at all four concentrations tested, in case of the effective samples. The same trend is present for samples taken during Harvest II, in case of C, B, R, CL, CI and M. All the values for Harvest III have proven a lower absorbance value compared to Harvest I, thus, a better inhibitory effect, M developing also an inhibitory activity with values ranging from 0.942–0.829.
Regarding the antibacterial effect, P. aeruginosa was the least susceptible strain. Of all samples tested during Harvest II, antibacterial activity with proven effect was present only in R 75 and R 100 and all four concentrations tested of M III (0.927–0.998). Compared to all the other strains tested, the effect present in Harvest II decreased in Harvest III, with only a few singular concentrations inhibiting the growth of the ATCC strain (C 100, T 75, T 100, R 100, M 75 and M 100).
In our research, E coli proved to be the most sensitive strain, being the most susceptible to most of the samples tested in Harvest II and also in Harvest III. Only R, J and CL proved MIC values but with a potentiating effect, while all the other tested samples proved MIC values with obvious inhibitory effect, correlated to concentration.
In case of S. typhimurium, in Harvest II, the antibacterial effect was present only in a few samples, the same effect being recognized in Harvest III, as follows: B, T, O and M for Harvest II and C, B, R, O in case of Harvest III. The good news was that the effect was better in Harvest III, data sustained by values that proved an inhibitory effect in all for concentrations tested. The difference was present only in case of M sample, in which the inhibitory effect in Harvest II decreased in Harvest III.
In our research, H. influenzae type B (ATCC 100211) was more resistant to the antibacterial effect of samples tested in Harvest II, being susceptible only to CL (0.764–0.538), C 75 and C 100 (1.233–1.103) and M for all four concentrations tested (1.127–1.273). In samples tested during Harvest III, C, T, R, O, CL, CI and M proved MIC values, with inhibitory effect, proved in all tested concentrations.
Concerning the antifungal effect, C. parapsilopsis proved to be more susceptible, while C. albicans showed less sensitivity to all tested samples. In case of C. parapsilopsis, for Harvest II, T, O, CL and M 100 demonstrated MIC values correlated with the increase of concentration. C, T, R, O, CL and M maintained the same efficacy in Harvest III, with lower OD values compared to the ones obtained for Harvest II, as presented in Table 3. C. albicans, on the other hand, proved to be resistant, presenting MIC values which decrease alongside the increase of concentration for all tested samples, both in Harvest II and Harvest III.
Through these values we can conclude that the essential oils present in the diet of bees produced honey with antibacterial effect increased after two weeks after administration.

5. Conclusions

The administration of sugar syrup with addition of essential oil of oregano, mint, thyme, cinnamon caused an increase in polyphenols in honey, respectively a decrease in the amount of invert sugar. The essential oils of mint, thyme, rosemary, oregano also had a positive effect on the flavonoids in honey, causing an increase compared to the control variant.
By determining the antioxidant activity of the analyzed honey in the groups, where we used essential oils of clove, juniper, basil, oregano, thyme, cinnamon, a representative increase was observed.
According to the results obtained, the acidity of the analyzed honey samples decreased after the harvest in all experimental variants.
Of all the essential oils tested, although most of the samples proved antimicrobial activity, rosemary and mint proved enhanced antimicrobial effects during Harvest II and III on almost all the strains tested, opening new pathways for further research on this topic.
Following our research, we can conclude that providing essential oils in the diet of bees is a very good suggestion for obtaining honey with enhanced nutritional properties, antioxidant and antimicrobial activity.

Author Contributions

All authors contributed to the study conception and design. Conceptualization original draft preparation, R.N.L. and S.P.; methodology, formal analysis, E.A., D.O., I.C.; review and editing and validation, R.N.L., S.P. and E.A. All authors have read and agreed to the published version of the manuscript.

Funding

This research is published from internal funds of Banat’s University of Agricultural Sciences and Veterinary Medicine “King Michael I of Romania”, Timișoara, Romania.

Institutional Review Board Statement

Not applicable.

Informed Consent Statement

Not applicable.

Data Availability Statement

The report of the analyses performed for the samples in the paper can be found at the Interdisciplinary Research Platform (PCI) belonging to the Banat University of Agricultural Sciences and Veterinary Medicine “King Michael I of Romania” in Timisoara.

Conflicts of Interest

The authors declare no conflict of interest.

References

  1. Al-Waili, N.S.; Salom, K.; Butler, G.; Al Ghamdi, A.A. Honey and microbial infections: A review supporting the use of honey for microbial control. J. Med. Food 2011, 14, 1079–1096. [Google Scholar] [CrossRef]
  2. Abdellah, F.; Boukraâ, L.; Mohamed, H.S.; Alzahrani, H.A.; Bakhotmah, B. Synergistic effect of Honey and Thymus ciliatus against pathogenic bacteria. Open Nutraceuticals J. 2012, 5, 174–178. [Google Scholar] [CrossRef] [Green Version]
  3. Cooper, R.A.; Molan, P.C.; Harding, K.G. Antibacterial activity of honey against strains of Staphylococcus aureus from infected wounds. J. R. Soc. Med. 1999, 92, 283–285. [Google Scholar] [CrossRef] [Green Version]
  4. Aazza, S.; Lyoussi, B.; Antunes, D.; Miguel, M.G. Physicochemical characterization and antioxidant activity of commercial portuguese honeys. J. Food Sci. 2013, 78, 1159–1165. [Google Scholar] [CrossRef]
  5. Zainol, M.I.; Mohd Yusoff, K.; Mohd Yusof, M.Y. Antibacterial activity of selected Malaysian honey. BMC Complement. Altern. Med. 2013, 13, 129. Available online: https://bmccomplementmedtherapies.biomedcentral.com/articles/10.1186/1472-6882-13-129 (accessed on 20 December 2021).
  6. Wahdan, H.A. Causes of the antimicrobial activity of honey. Infection 1998, 26, 26–31. [Google Scholar] [CrossRef]
  7. Adeleke, O.E.; Olaitan, J.O.; Okpekpe, E.I. Comparative antibacterial activity of honey and gentamicina gainst Escherichiacoliand Pseudomonas aeruginosa. Ann. Burn. Fire Disasters 2006, 19, 201–204. Available online: https://www.ncbi.nlm.nih.gov/pmc/articles/PMC3188119/ (accessed on 20 December 2021).
  8. Khoo, Y.T.; Halim, A.S.; Singh, K.K.B.; Mohamad, N.A. Wound contraction effects and antibacterial properties of Tualang honey on full-thickness burn wounds in rats in comparison to hydrofibre. BMC Complement. Altern. Med. 2010, 10, 48. Available online: https://bmccomplementmedtherapies.biomedcentral.com/articles/10.1186/1472-6882-10-48 (accessed on 20 December 2021). [CrossRef] [Green Version]
  9. Montenegro, G.; Mejías, E. Biological applications of honeys produced by Apis mellifera. Biol. Res. 2013, 46, 341–345. [Google Scholar] [CrossRef] [Green Version]
  10. World Health Organization (WHO). Antimicrobial Resistance: Global Report on Surveillance. 2014. Available online: https://apps.who.int/iris/bitstream/handle/10665/112647/WHO_HSE_PED_AIP_?sequence=1 (accessed on 20 December 2021).
  11. Nishio, E.K.; Ribeiro, J.M.; Oliveira, A.G.; Andrade, G.C.T.J.; Proni, E.A.; Kobayashi, R.K.T.; Nakazato, G. Antibacterial synergic effect of honey from two stingless bees: Scaptotrigona bipunctata Lepeletier, 1836, and S. postica Latreille. 1807. Sci. Rep. 2016, 6, 21641. [Google Scholar] [CrossRef]
  12. World Health Organization (WHO). A Global Health Guardian: Climate Change, Air Pollution and Antimicrobial Resistance; WHO: Geneva, Switzerland, 2017. [Google Scholar]
  13. Coates, A.R.M.; Hu, Y. Novel approaches to developing new antibiotics for bacterial infections. Br. J. Pharmacol. 2007, 152, 1147–1154. [Google Scholar] [CrossRef] [Green Version]
  14. Valgas, C.; Souza, S.M.; Smânia, E.F.A.; Smânia, A., Jr. Screening methods to determine antibacterial activity of natural products. Braz. J. Microbiol. 2007, 38, 369–380. [Google Scholar] [CrossRef] [Green Version]
  15. Kim, S.I.; Roh, J.Y.; Kim, D.H.; Lee, H.S.; Ahn, Y.J. Insecticidal activities of aromatic plant extracts and essential oils against Sitophilus oryzae and Callosobruchus chinensis. J. Stored Prod. Res. 2003, 39, 293–303. [Google Scholar] [CrossRef]
  16. Prabuseenivasan, S.; Jayakumar, M.; Ignacimuthu, S. In vitro antibacterial activity of some plant essential oils. BMC Complement. Altern. Med. 2006, 6, 39. Available online: https://bmccomplementmedtherapies.biomedcentral.com/articles/10.1186/1472-6882-6-39 (accessed on 20 December 2021). [CrossRef] [PubMed] [Green Version]
  17. Hyldgaard, M.; Mygind, T.; Meyer, R.L. Essential oils in food preservation: Mode of action, synergies, and interactions with food matrix components. Front. Microbiol. 2012, 3, 1–24. [Google Scholar] [CrossRef] [PubMed] [Green Version]
  18. Lazăr, R.N.; Pătruică, S. Use of Essential Oils in Bees. Sci. Pap. Anim. Sci. Biotechnol. 2020, 53, 74–79. Available online: http://conference.spasb.ro/index.php/issbar/2020/paper/view/1249 (accessed on 20 December 2021).
  19. Imtara, H.; Elamine, Y.; Lyoussi, B. Honey antibacterial effect boosting using Origanum vulgare L. essential oil. Evid.-Based Complement. Altern. Med. 2018, 2018, 7842583. [Google Scholar] [CrossRef]
  20. Boukra, L.; Alzahrani, H.A.; Abdelah, F.; Bakhotmah, B.; Hammoudi, S.M. Synergistic Effect of Monofloral Honeys and Essential Oils against Pseudomonas aeruginosa. Br. Microbiol. Res. J. 2013, 3, 564–573. [Google Scholar] [CrossRef]
  21. Lazăr, R.N.; Moț, D.; Simiz, E.; Pătruică, S. Research on the use of essential oils on the health of bee families. Sci. Pap. Anim. Sci. Biotechnol. 2020, 53, 161–164. Available online: https://www.spasb.ro/index.php/spasb (accessed on 20 December 2021).
  22. Lazăr, R.N.; Moț, D.; Alexa, E.; Boldea, M.; Ștef, L.; Pătruică, S. Influence of essential oils on bioproductive indices and health of bee families. In Scientific Papers; Series D; Animal Science: Bucharest, Romania, 2021; Volume LXIV, pp. 247–253. [Google Scholar]
  23. Medhat, M.A.; Mohsen, M.S.A. Chemical composition, antioxidant and antimicrobial activity of the essential oil of the thyme and rosemary. Int. J. Acad. Res. Part A 2013, 5, 186–195. [Google Scholar] [CrossRef]
  24. Imelouane, B.; Amhamdi, H.; Wathelet, J.P.; Ankit, M.; Khedid, K.; El Bachiri, A. Chemical composition of the essential oil of thyme (Thymus vulgaris) from Eastern Morocco. Int. J. Agric. Biol. 2009, 11, 205–208. [Google Scholar]
  25. Schulz, H.; Schrader, B.; Quilitzsch, R.; Pfeffer, S.; Kruger, H. Rapid classification of basil chemotypes by variousvibrational spectroscopy methods. J. Agric. Food Chem. 2003, 51, 2475–2481. [Google Scholar] [CrossRef] [PubMed]
  26. Politeo, O.; Jukic, M.; Milos, M. Chemical composition and antioxidant capacity of free volatile aglycones from basil (Ocimum basilicum L.) compared with its essential oil. Food Chem. 2007, 101, 379–385. [Google Scholar] [CrossRef]
  27. Eslahi, H.; Fahimi, N.; Sardarian, A.R. Chemical Composition of Essential Oils, Chemistry, Safety and Applications, 1st ed.; Hashemi, S.M.B., Khaneghah, A.M., de Souza Sant’ Ana, A., Eds.; IFT Press, Wiley Blackwell: Hoboken, NJ, USA, 2018; pp. 119–122. ISBN 978-1-119-14934-7. [Google Scholar]
  28. Kokkini, S.; Karousou, R.; Hanlidou, E. Herbs of Labiatae. In Encyclopedia of Food Sciences and Nutrition; Elsevier: Amsterdam, The Netherlands, 2003; pp. 3082–3090. [Google Scholar] [CrossRef]
  29. Muntean, D.; Licker, M.; Alexa, E.; Popescu, I.; Jianu, C.; Buda, V.; Dehelean, C.A.; Ghiulai, R.; Horhat, F.; Horhat, D.; et al. Evaluation of essential oil obtained from Mentha piperita L. against multidrug-resistant strains. Infect Drug Resist. 2019, 12, 2905–2914. [Google Scholar] [CrossRef] [Green Version]
  30. Alexa, V.T.; Galuscan, A.; Popescu, I.; Tirziu, E.; Obistioiu, D.; Floare, A.D.; Perdiou, A.; Jumanca, D. Synergistic/Antagonistic Potential of Natural Preparations Based on Essential Oils Against Streptococcus mutans from the Oral Cavity. Molecules 2019, 24, 4043. [Google Scholar] [CrossRef] [Green Version]
  31. Jirovetz, L.; Buchbauer, G.; Stoilova, I.; Stoyanova, A.; Krastanov, A.; Schmidt, E. Chemical Composition and Antioxidant Properties of Clove Leaf Essential Oil. J. Agric. Food Chem. 2006, 54, 6303–6307. [Google Scholar] [CrossRef]
  32. Burt, S.; Vlielander, R.; Haagsman, H.; Veldhuizen, E. Increase in activity of essential oil components carvacroland thymol against Escherichia coli O157:H7 by addition offood stabilizers. J. Food Prot. 2005, 68, 919–926. [Google Scholar] [CrossRef] [PubMed]
  33. Teixeira, B.; Marques, A.; Ramos, C.; Serrano, C.; Matos, O.; Neng, N.R.; Nogueira, J.M.F.; Saraivab, J.A.; Nunesa, M.L. Chemical composition and bioactivity of different oregano (Origanum vulgare) extracts and essential oil. J. Sci. Food Agric. 2013, 93, 2707–2714. [Google Scholar] [CrossRef]
  34. Simić, A.; Soković, M.D.; Ristić, M.; Grujić-Javanivić, S.; Vukojević, J.; Marin, P.D. The Chemical Composition of some Lauraceae Essential Oils and Their Antifungal Activities. Phytother. Res. 2004, 18, 713–717. [Google Scholar] [CrossRef]
  35. Adams, R.P. Investigation of Juniperus species of the United States for new sources of cedarwood oil. Econ. Bot. 1987, 41, 48–54. Available online: https://www.jstor.org/stable/4254934 (accessed on 20 December 2021). [CrossRef]
  36. Pătruică, S.; Moț, D. The effect of using prebiotic and probiotic products on intestinal micro-flora of the honeybee (Apis mellifera carpatica). Bull. Entomol. Res. 2012, 102, 619–623. [Google Scholar] [CrossRef]
  37. Pătruică, S.; Huțu, I. Economic benefits of using prebiotic and probiotic products as supplements in stimulation feeds administered to bee colonies. Turk. J. Vet. Anim. Sci. 2013, 37, 259–263. [Google Scholar] [CrossRef]
  38. Pătruică, S.; Peț, I.; Simiz, E. Beekeeping in the context of climate change. In Scientific Papers; Series D; Animal Science: Bucharest, Romania, 2021; Volume LXIV, ISSN Online 2393-2260. [Google Scholar]
  39. Bobiș, R. Researches on the Nutritional and Biological Value of Bee Pollen. Doctoral Thesis, the Faculty of Animal Husbandry and Biothnology, University of Agricultural Sciences and Veterinary Medicine of Cluj-Napoca, Cluj-Napoca, Romania, 2014. Available online: http://www.usamvcluj.ro/files/teze/2014/margaoan.pdf (accessed on 20 December 2021).
  40. International Honey Commision. World Network of Honey Science. HarmonisedMethods of the International Honey Commission. 2009. Available online: http://ihc-platform.net/ihcmethods2009.pdf (accessed on 20 December 2021).
  41. Gergen, I. Agri-Food Products Analysis; EUROSTAMPA Publishing House: Timișoara, Romania, 2004; 316p, ISBN 973-687-271-8. [Google Scholar]
  42. Ciulca, S.; Roma, G.; Alexa, E.; Radulov, I.; Cocan, I.; Madosa, E.; Ciulca, A. Variation of Polyphenol Content and Antioxidant Activity in Some Bilberry (Vaccinium myrtillus L.) Populations from Romania. Agronomy 2021, 11, 2557. [Google Scholar] [CrossRef]
  43. Zhao, L.-J.; Liu, W.; Xiong, S.-H.; Tang, J.; Lou, Z.-H.; Xie, M.-X.; Xia, B.-H.; Lin, L.-M.; Liao, D.-F. Determination of Total Flavonoids Contents and Antioxidant Activity of Ginkgo biloba Leaf by Near-Infrared Reflectance Method. Int. J. Anal. Chem. 2018, 2018, 8195784. [Google Scholar] [CrossRef] [PubMed] [Green Version]
  44. Mensor, L.L.; Menezes, F.S.; Leitão, G.G.; Reis, A.S.; Dos Santos, T.C.; Coube, C.S.; Leitão, S.G. Screening of Brazilian Plant Extracts for Antioxidant Activity by the Use of DPPH Free Radical Method. Phytother. Res. 2001, 15, 127–130. [Google Scholar] [CrossRef]
  45. Alexa, V.T.; Szuhanek, C.; Cozma, A.; Galuscan, A.; Borcan, F.; Obistioiu, D.; Dehelean, C.A.; Jumanca, D. Natural Preparations Based on Orange, Bergamot and Clove Essential Oils and Their Chemical Compounds as Antimicrobial Agents. Molecules 2020, 25, 5502. [Google Scholar] [CrossRef]
  46. Gary, N.E. Activities and Behaviour of Honey Bees; Graham, J.M., Ed.; The Hive and the Honey Bee; Bookmasters Inc.: Mansfield, UK, 1992; Volume 8, pp. 269–361. [Google Scholar]
  47. European Union Directive (EU). European Union Directive 2001/110/EC, 32001L0110 Relating to Honey. Available online: www.eumonitor.eu/9353000/1/ (accessed on 20 December 2021).
  48. Turkish Food Codex. Number 26026. 2005. Available online: https://www.tariff-tr.com/legislation/item/6840.aspx (accessed on 20 December 2021).
  49. Bakirdere, S.; Yaroglu, T.; Tirik, N.; Demirez, M.; Karaca, A. Analysis of some physical, chemical and microbiological aspects of honey samples produced and consumed in Turkey. Rev. Fac. Cienc. Agrar. UNCuyo 2016, 50, 263–271. [Google Scholar]
  50. White, J.W. Composición y Propriedades De La Miel; McGregor, S.E., Ed.; La Apicultura en los Estados Unidos; Limusa: Mexico City, Mexico, 1979; pp. 57–66. [Google Scholar]
  51. Akharaiyi, F.C. Physicochemical Analysis and Mineral Contents of Honey from Farmers in Western States of Nigeria. J. Nat. Sci. Res. 2016, 6, 19. [Google Scholar]
  52. AL-Khalifa, A.S.; AL-Arify, I.A. Physicochemical characteristics and pollen spectrum of some Saudi honeys. Food Chem. 1999, 67, 21–25. [Google Scholar] [CrossRef]
  53. Molan, P.C. Authenticity of honey. In Food Authentication; Springer: Boston, MA, USA, 2006; pp. 259–303. [Google Scholar]
  54. Tafere Dessie Ashagrie, Chemical composition and uses of Honey: A Review. J. Food Sci. Nutr. Res. 2021, 4, 194–201. [CrossRef]
  55. Sohaimya, S.A.E.; Masryb, S.H.D.; Shehataa, M.G. Physicochemical characteristics of honey from different origins. Ann. Agric. Sci. 2015, 60, 279–287. [Google Scholar] [CrossRef] [Green Version]
  56. Kocot, J.; Kielczykowska, M.; Luchowska-Kocot, D.; Kurzepa, J.; Musik, I. Antioxidant Potential of Propolis, Bee Pollen, and Royal Jelly: Possible Medical Application. Oxidative Med. Cell. Longev. 2018, 2018, 7074209. [Google Scholar] [CrossRef] [PubMed]
  57. Duca, A. Contributions to the Experimental Characterization of Indigenous Propolis Varieties. Ph.D. Thesis, “Victor Babeş” University of Medicine and Pharmacy, Timișoara, Romania, 2018. [Google Scholar]
  58. Duca, A.; Sturza, A.; Moacă, E.A.; Negrea, M.; Lalescu, V.D.; Lungescu, D.; Dehelean, C.A.; Muntean, D.M.; Alexa, E. Identification of resveratrol as bioactive compound of propolis from western Romania and characterization of phenolic profile and antioxidant activity of ethanolic extracts. Molecules 2019, 24, 3368. [Google Scholar] [CrossRef] [PubMed] [Green Version]
  59. Buratti, S.; Benedetti, S.; Cosio, M.S. Evaluation of the antioxidant power of honey, propolis and royal jelly by amperometric flow injection analysis. Talanta 2007, 71, 1387–1392. [Google Scholar] [CrossRef] [PubMed]
  60. Gheldof, N.; Wang, X.H.; Engeseth, N.J. Identification and quantification of antioxidant components of honeys from various floral sources. J. Agric. Food Chem. 2002, 50, 5870–5877. [Google Scholar] [CrossRef]
  61. Pyrzynska, K.; Biesaga, M. Analysis of phenolic acids and flavonoids in honey. TrAC Trends Anal. Chem. 2009, 28, 893–902. [Google Scholar] [CrossRef]
  62. Tenore, G.; Ritieni, A.; Campiglia, P. Nutraceutical potential of monofloral honeys produced by the Sicilian black honeybees (Apis mellifera ssp. sicula). Food Chem. Toxicol. 2012, 50, 1955–1961. [Google Scholar] [CrossRef]
  63. Bonvehi, J.S.; Coll, F.V.; Bermejo, J.O. Characterization of avocado honey (Persea americana Mill.) produced in Southern Spain. Food Chem. 2019, 287, 214–221. [Google Scholar] [CrossRef]
  64. Pauliuc, D.; Oroian, M. Sugars content and physicochemical parameters of romanian rape honey. In Scientific Bulletin; Series F. Biotechnologies; University of Agronomic Sciences and Veterinary Medicine of Bucharest Faculty of Biotechnology: Bucharest, Romania, 2020; Volume XXIV, pp. 69–75, ISSN 2285-1364, CD-ROM ISSN 2285-5521, ISSN Online 2285-1372, ISSN-L 2285-1364. [Google Scholar]
  65. Gul, A.; Pelhivan, T. Antioxidant activities of some monofloral honey types produced across Turkey. Saudi J. Biol. Sci. 2018, 25, 1056–1065. [Google Scholar] [CrossRef]
  66. Pauliuc, D.; Dranca, F.; Oroian, M. Antioxidant Activity, Total Phenolic Content, Individual Phenolics and Physicochemical Parameters Suitability for Romanian Honey Authentication. Foods 2020, 9, 306. [Google Scholar] [CrossRef] [Green Version]
  67. Ibrahimi, H.; Hajdari, A. Phenolic and flavonoid content, and antioxidant activity of honey from Kosovo. J. Apic. Res. 2020, 59, 452–457. [Google Scholar] [CrossRef]
  68. Marghitas, L.A.; Dezmirean, D.S.; Pocol, C.B.; Ilea, M.; Bobis, O.; Gergen, I. The Development of a Biochemical Profile of Acacia Honey by Identifying Biochemical Determinants of its Quality. Not. Bot. Horti Agrobot. Cluj-Napoca 2010, 38, 84–90. [Google Scholar] [CrossRef]
  69. Meda, A.; Lamien, C.E.; Romito, M.; Millogo, J.; Nacoulma, O.G. Determination of the total phenolic, flavonoid and proline contents in Burkina Fasan honey, as well as their radical scavenging activity. Food Chem. 2005, 91, 571–577. [Google Scholar] [CrossRef]
  70. Estevinho, L.; Pereira, A.P.; Moreira, L.; Luís, G.; Pereira, D.E. Antioxidant and antimicrobial effects of phenolic compounds extracts of Northeast Portugal honey. Food Chem. Toxicol. 2008, 46, 3774–3779. [Google Scholar] [CrossRef] [PubMed]
  71. Agbaje, E.O.; Ogunsanya, T.; Aiwerioba, O.I.R. Conventional use of honey as antibacterial agent. Ann. Afr. Med. 2006, 5, 79–81. Available online: https://www.ajol.info/index.php/aam/article/view/8379 (accessed on 20 December 2021).
  72. Mundo, M.A.; Padilla-Zakour, O.I.; Worobo, R.W. Growth inhibition of food borne pathogens and foods spoilage organisms by select raw honeys. Int. J. Food Microbiol. 2004, 97, 1–8. [Google Scholar] [CrossRef] [PubMed]
  73. Taormina, P.J.; Niemira, B.A.; Beuchat, L.R. Inhibitory activity of honey against foodborne pathogens as influenced by the presence of hydrogen peroxide and level of antioxidant power. Int. J. Food Microbiol. 2001, 69, 217–225. [Google Scholar] [CrossRef]
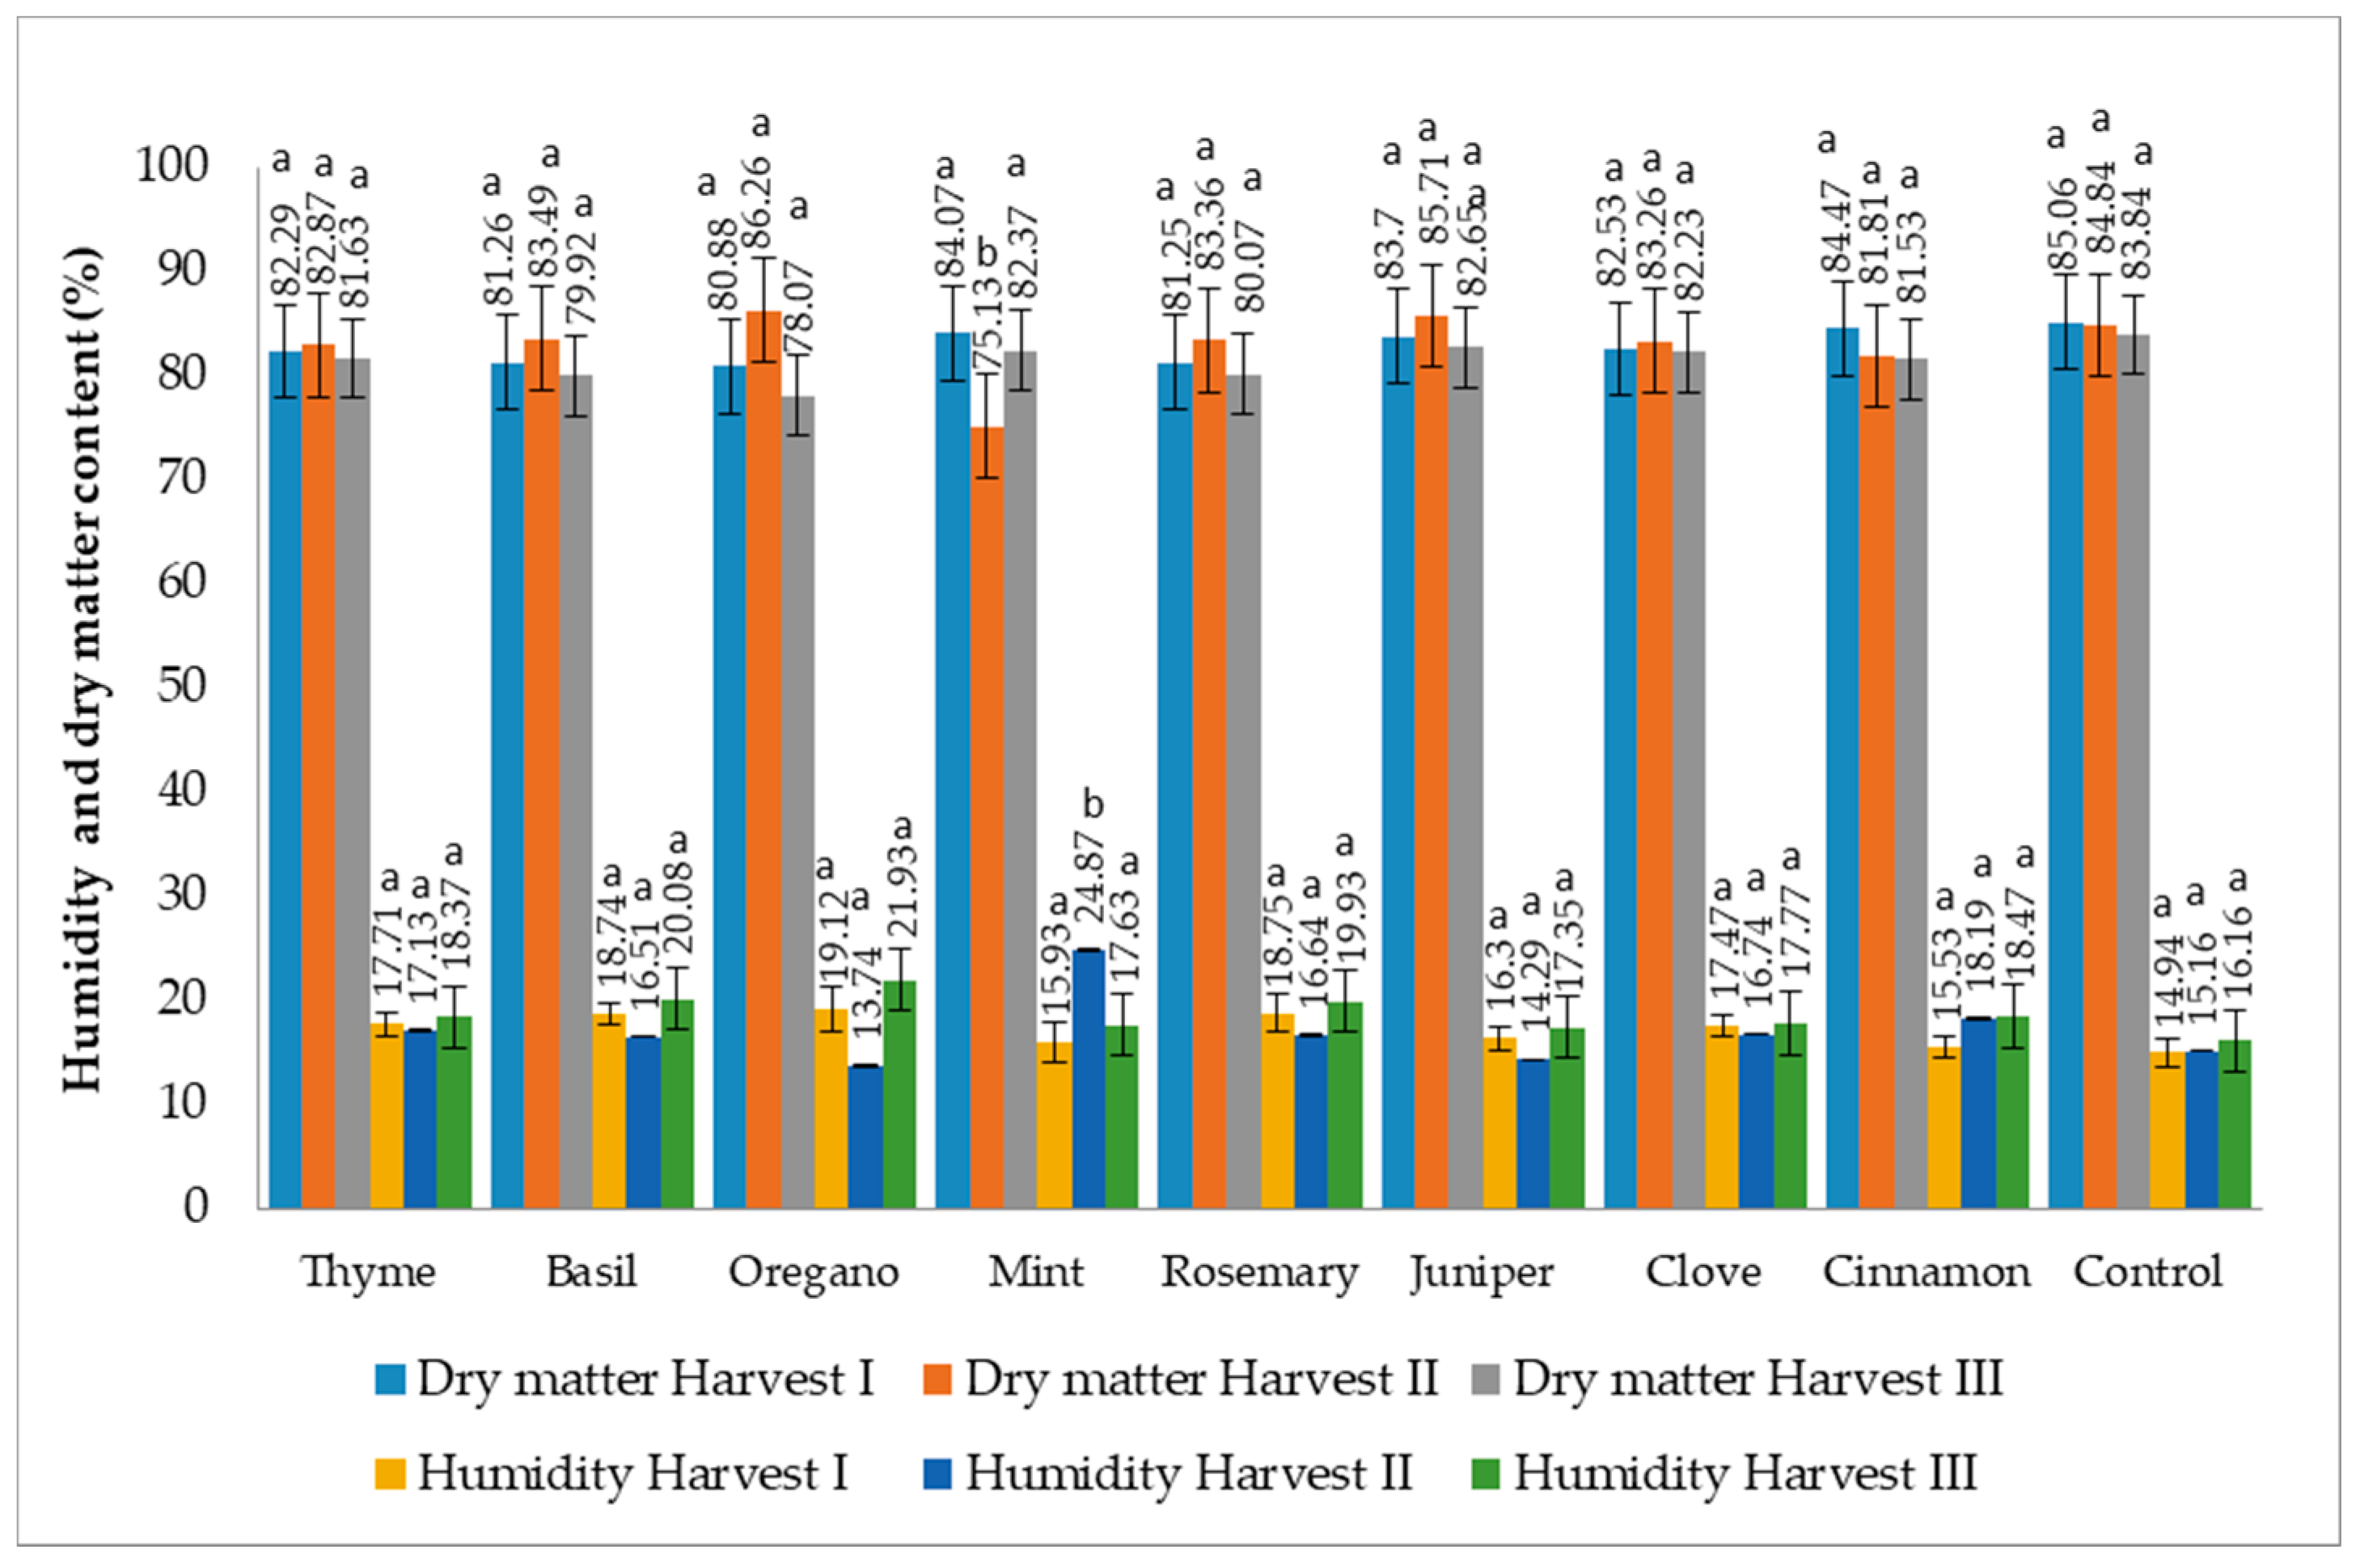
Figure 1. Humidity (H) and dry matter (D.M.) content (%) before (Harvest I), after (Harvest II) the use of EOs in the supplementary feed of bee families, respectively after the first harvest (rapeseed) (Harvest III). Different letters between control and samples indicate significant differences (p < 0.05) among these values according to the t-test.
Applsci 12 01094 g001
Figure 2. Impurities content (%) before (Harvest I), after (Harvest II) the use of EOs in the supplementary feed of bee families, respectively after the first harvest (rapeseed) (Harvest III). Different letters between control and samples indicate significant differences (p < 0.05) among these values according to the t-test.
Applsci 12 01094 g002
Figure 3. Mineral substances content (%) before (Harvest I), after (Harvest II) the use of EOs in the supplementary feed of bee families, respectively after the first harvest (rapeseed) (Harvest III). Different letters between control and samples indicate significant differences (p < 0.05) among these values according to the t-test.
Applsci 12 01094 g003
Figure 4. The acidity of the samples before (Harvest I), after (Harvest II) the use of EOs in the supplementary feed of bee families, respectively after the first harvest (rapeseed) (Harvest III). Different letters between control and samples indicate significant differences (p < 0.05) among these values according to the t-test.
Applsci 12 01094 g004
Figure 5. pH evolution of the samples before (Harvest I), after (Harvest II) the use of EOs in the supplementary feed of bee families, respectively after the first harvest (rapeseed) (Harvest III). Different letters between control and samples indicate significant differences (p < 0.05) among these values according to the t-test.
Applsci 12 01094 g005
Figure 6. TPC of the samples before (Harvest I), after (Harvest II) the use of EOs in the supplementary food of bee families, respectively after the first harvest (rapeseed) (Harvest III). Different letters between control and samples indicate significant differences (p < 0.05) among these values according to the t-test.
Applsci 12 01094 g006
Figure 7. The reducing sugar content of the samples before (Harvest I), after (Harvest II) the use of EOs in the supplementary food of bee families, respectively after the first harvest (rapeseed) (Harvest III). Different letters between control and samples indicate significant differences (p < 0.05) among these values according to the t-test.
Applsci 12 01094 g007
Figure 8. Flavonoid content (FC) of the samples before (Harvest I), after (Harvest II) the use of EOs in the supplementary food of bee families, respectively after the first harvest (rapeseed) (Harvest III). Different letters between control and samples indicate significant differences (p < 0.05) among these values according to the t-test.
Applsci 12 01094 g008
Figure 9. The antioxidant activity of the samples before (Harvest I), after (Harvest II) the use of EOs in the supplementary food of bee families, respectively after the first harvest (rapeseed) (Harvest III). Different letters between control and samples indicate significant differences (p < 0.05) among these values according to the t-test.
Applsci 12 01094 g009
Table 1. Chemical composition of the analyzed EOs.
EOsChemical CompositionReferences
Thyme
(Thymus Vulgaris L.)
Borneol 17.15%
Alfa terpineol 6.05%
Camphene 14.41%
Lazar et al. [22]
Thymol 39.44
p-Cymene 23.6
y-Terpinene 12.51
Ledol 2.24
Medhat et al. [23]
Camphor 38.54%
Borneol 4.91%
Camphene 17.19%
Imelouane et al. [24]
Basil
(Ocimum basilicum)
Estragol 55.73%
Linalool 38.64%
Lazar et al. [22]
Estragol 80%
Linalool 35–50%
Schultz et al. [25]
Linalool 28.6%
Estragole 21.7%
Politeo et al. [26]
Rosemary
(Rosmarinus officinalis)
Eucalyptol 52.82%
Alfa pinene 17.56%
Camphor 10.01%
Lazar et al. [22]
Alfa pinene 7.4%
Beta pinene 5.0%
1.8 Cineole 43.6%
Camphor 12.3%
Eslahi et al. [27]
Borneol 24.13
Alfa pinene 9.72
Camphor 5.01
Medhat and Mouhsen [23]
Mint
(Mentha piperita)
Menthone 30.73%
Neomenthol 17.37%
Limonene 9.52%
Lazar et al. [22]
Menthol 27–51%
Limonene 0.5–6%
Methyl acetate 2–4%
Kokkini et al. [28]
Menthone 0.461%
Beta Myrcene 1.659%
p-Mentha-1.8-diene 29.576%
Muntean et al. [29]
Clove
(Syzygium aromaticum)
Eugenol
85.17%
Carryophillene 8.15%
Eugenol acetate
5.44%
Lazar et al. [22]
Eugenol 80.11%
Eugenol acetate 13.54%
Alexa et al. [30]
Eugenol 76.8%
Limonene 0.1%
Beta Caryophyllene 17.4%
Jirovetz et al. [31]
Oregano
(Origanum vulgare)
Carvacrol 33.42%
O-cymene 22.98%
Gamma terpinene
17.44%
Lazar et al. [22]
Carvacrol 80%
Thymol 64%
Burt et al. [32]
Carvacrol 14.5%
Thymol 12.6%
Beta fenchyl alcohol 12.8%
Teixeira et al. [33]
Cinnamon
(Cinnamomum verum)
Cinnamaldehyde (E) 69.28%
Cinnamaldehyde-o-methoxy 14.30%
Cinnamil acetate 6.55%
Lazar et al. [22]
(E)-cinnamaldehyde 77.1%
Eugenol 7.2%
p-cymene 6.1%
Eslahi et al. [27]
Trans-Cinamaldehyde 62.79%
Limonene 8.31%
Alfa-pinene 1.83%
Simić et al. [34]
Juniper
(Juniperus communis L.)
Alfa-pinene 49.75%
Beta-pinene 16.70%
Beta-myrcene 9.27%
Lazar et al. [22]
Alfa pinene 33.7%
Sabinene 27.6%
Myrcene 5.5%
Eslahi et al. [27]
Limonene 27.8%
Sabinene 38.0%
Myrcene 22.6%
Adams, 1987 [35]
Table 2. Experiment organization scheme.
Experimental VariantExtra FeedingQuantity of Honey Harvested (g)
Sugar Syrup (l)EOs
(µL/L)
The Period of FeedingAt 7 Days after the EOs Administration (Harvest I)
(g)
At 20 Days after the EOs Administration(Harvest II)
(g)
After the Final Harvest of Production (Rapeseed)
(Harvest III)
(g)
Thyme1 l2030.03
07.04
14.04
105.3116.8115.2
Basil1 l20102.6106.1107.6
Rosemary1 l20102.9103.2103.5
Juniper1 l20104.8105.5105.9
Mint1 l20110.9110.9111.0
Oregano1 l20109.5111.3112.5
Cloves1 l20106.8110.1110.6
Cinnamon1 l20103.8103.2109.7
Control1 l-115.1110.5109.5
Table 3. OD value (540 nm) for honey samples after treatment with EOs (Harvest II).
HarvestSampleS. pyogenesS. aureusS. flexneriP. aeruginosaE. coliS. typhimuriumH. influenzae Type BC. parapsilopsisC. albicans
IIC 12.5%0.7340.4520.9361.1391.2120.8260.6750.4910.239
C 25%0.7400.6050.9331.1980.9210.8981.0540.8010.547
C 37.5%0.7480.7840.9231.1990.8590.9051.1470.8700.874
C 50%0.8110.7960.8781.2040.7771.5271.2191.1490.959
B 12.5%0.8250.6131.0141.2230.9381.1211.0750.6230.686
B 25%0.8420.7550.9221.2010.8140.8751.0910.7850.854
B 37.5%0.8770.9880.911.1380.6960.8371.1860.8431.025
B 50%0.8990.9990.8821.1170.6320.8121.2610.9401.175
T 12.5%0.8750.7100.7951.2221.281.2041.1151.1900.473
T 25%1.1830.8430.9181.2870.9311.1471.1480.8360.765
T 37.5%1.1631.1631.0141.470.8821.0271.2710.7350.843
T 50%1.1771.1831.0471.5570.7691.0041.4360.6940.892
R 12.5%1.1350.7250.8491.2810.8260.8951.1270.5971.042
R 25%1.0370.7210.8381.1030.9361.271.4411.2241.318
R 37.5%0.7470.670.7770.9271.1381.6381.5511.4301.431
R 50%0.7190.5340.7050.9461.2071.6961.5691.6351.522
O 12.5%0.7870.6620.7111.2891.2231.2011.0891.0790.325
O 25%0.9430.5810.8301.3041.1390.8981.1410.8860.606
O 37.5%1.0790.5351.0251.3361.0390.7321.2870.8180.758
O 50%1.0980.5131.0571.4070.9950.6831.4330.7950.825
J 12.5%0.9820.7220.8301.1250.9770.9951.1970.8500.985
J 25%1.0890.70.9681.151.0940.9911.2361.0101.471
J 37.5%1.2860.6751.0491.1591.3701.1411.4111.1921.461
J 50%1.2940.5361.0661.2711.4641.2451.5281.2431.499
CL 12.5%0.7800.6250.7891.0310.5951.0991.2201.0100.224
CL 25%0.9150.6710.7401.2030.6791.1671.0380.7640.464
CL 37.5%1.0220.7210.7031.220.7311.2270.9930.6390.685
CL 50%1.0340.7750.6461.3080.7821.2640.9020.5380.859
CI 12.5%1.2680.5450.7531.4170.8380.9371.3190.7660.609
CI 25%1.1710.6160.7341.3480.7941.1561.2670.7300.732
CI 37.5%1.0291.0080.7221.2190.7771.1981.2330.8680.768
CI 50%0.8631.0680.7141.1960.7051.2851.1030.9490.805
M 12.5%0.7040.8850.7840.9271.2821.0771.1021.0250.849
M 25%0.9020.9430.9730.9320.9320.9751.1270.9950.941
M 37.5%0.9950.9960.9840.9770.930.9071.1440.8860.997
M 50%1.0081.0071.1420.9980.8330.8811.1790.7971.005
BHI0.7960.6210.9561.0431.3531.0431.2340.9141.029
Table 4. OD value (540 nm) for honey samples after treatment with EOs (Harvest III).
HarvestSampleS. pyogenesS. aureusS. flexneriP. aeruginosaE. coliS. typhimuriumH. influenzae Type BC. parapsilopsisC. albicans
IIIC 12.5%0.9520.5340.721.1990.9740.9761.2730.8060.502
C 25%0.9430.7350.7361.1290.9060.9331.5750.7620.633
C 37.5%0.8650.7380.781.0820.8810.9131.130.6950.733
C 50%0.7010.8230.951.030.8250.8870.1510.6590.902
B 12.5%0.7820.5520.8811.0181.2230.9850.8340.5400.686
B 25%0.7230.4640.7331.130.9640.9281.1830.7340.746
B 37.5%0.7100.4230.7221.2470.9410.8521.2440.9800.834
B 50%0.7140.4060.6821.380.9270.7961.2510.9960.906
T 12.5%0.8310.6700.7311.3210.9551.2421.3210.9910.730
T 25%0.9390.6440.8851.2090.9361.1991.3350.9500.859
T 37.5%1.0790.6251.0560.9310.8721.1441.4590.8850.956
T 50%1.0990.611.0890.9180.8840.9771.4610.7751.060
R 12.5%0.8550.5640.7161.2710.9721.0181.2410.7390.575
R 25%0.8040.6020.6821.1890.870.9831.1660.6810.612
R 37.5%0.7610.6240.6371.1840.750.9031.1340.6160.736
R 50%0.7220.6210.6280.9970.7040.8800.6820.5870.779
O 12.5%0.8120.6860.7561.3011.1931.1661.1220.9580.451
O 25%0.8890.6010.7991.3211.1240.9581.1970.8530.583
O 37.5%1.0040.5210.9771.3451.0140.8431.2340.7960.678
O 50%1.1130.4971.0381.3970.9820.7051.3620.7080.789
J 12.5%1.0410.6990.8091.1250.8760.9041.1740.7990.921
J 25%1.1020.6580.9241.180.9470.9251.2050.8821.246
J 37.5%1.1580.5761.0081.1991.1781.0541.3510.9431.308
J 50%1.1980.5021.0341.2051.2641.1541.4291.0871.412
CL 12.5%0.6680.5890.6870.9470.5480.9871.1560.9700.274
CL 25%0.8470.6280.6571.0840.5971.0271.0050.7890.387
CL 37.5%0.9870.6970.6021.1240.7311.1210.9840.6180.452
CL 50%1.0080.7240.5811.1890.7721.1840.8590.5550.548
CI 12.5%1.0280.5410.6891.2580.7850.8871.1140.6870.609
CI 25%0.9870.5890.6201.2080.7020.9541.0070.7410.678
CI 37.5%0.9050.7410.5871.1150.6441.0890.9410.7990.724
CI 50%0.8240.7890.5241.0410.6011.1170.8740.8520.799
M 12.5%0.8850.4580.9421.3531.2861.0401.1971.1820.561
M 25%0.7290.6230.8721.1541.1011.1831.0980.8580.622
M 37.5%0.7161.3780.8751.0181.0941.4161.210.7460.721
M 50%0.7051.4420.8290.9341.0491.5211.0680.7240.886
BHI0.7960.6210.9561.0431.3531.0431.2340.9141.029
Publisher’s Note: MDPI stays neutral with regard to jurisdictional claims in published maps and institutional affiliations.