Abstract
A computational investigation of the mechanism of dihydrosanguinarine (DHSAN) photoactivation and its conversion into the active drug sanguinarine (SAN) is here reported. The reaction mechanism of DHSAN photoconversion was fully explored by considering its excitation first, essential for generating one of the reactants, the 1O2, and then locating all the minima and transition states involved in the formation of SAN. Both forms of the drug present at physiological pH, namely, iminium cation and alkanolamine, were considered as products of such reaction. The ability of the generated drug SAN to induce cell apoptosis was then explored, taking into consideration two anticancer activities: the induction of DNA conformational and functional changes by intercalation and the absorption of light with proper wavelength to trigger type II photochemical reactions leading to 1O2 sensitization for photodynamic therapy application. Concerning the ability to work as photosensitizers, the outcomes of our calculations prove that DHSAN can easily be converted into the active SAN under visible and NIR irradiation through the application of two-photon excitation, and that the maximum absorption of SAN, once intercalated into DNA, shifts to the near region of the therapeutic window.
1. Introduction
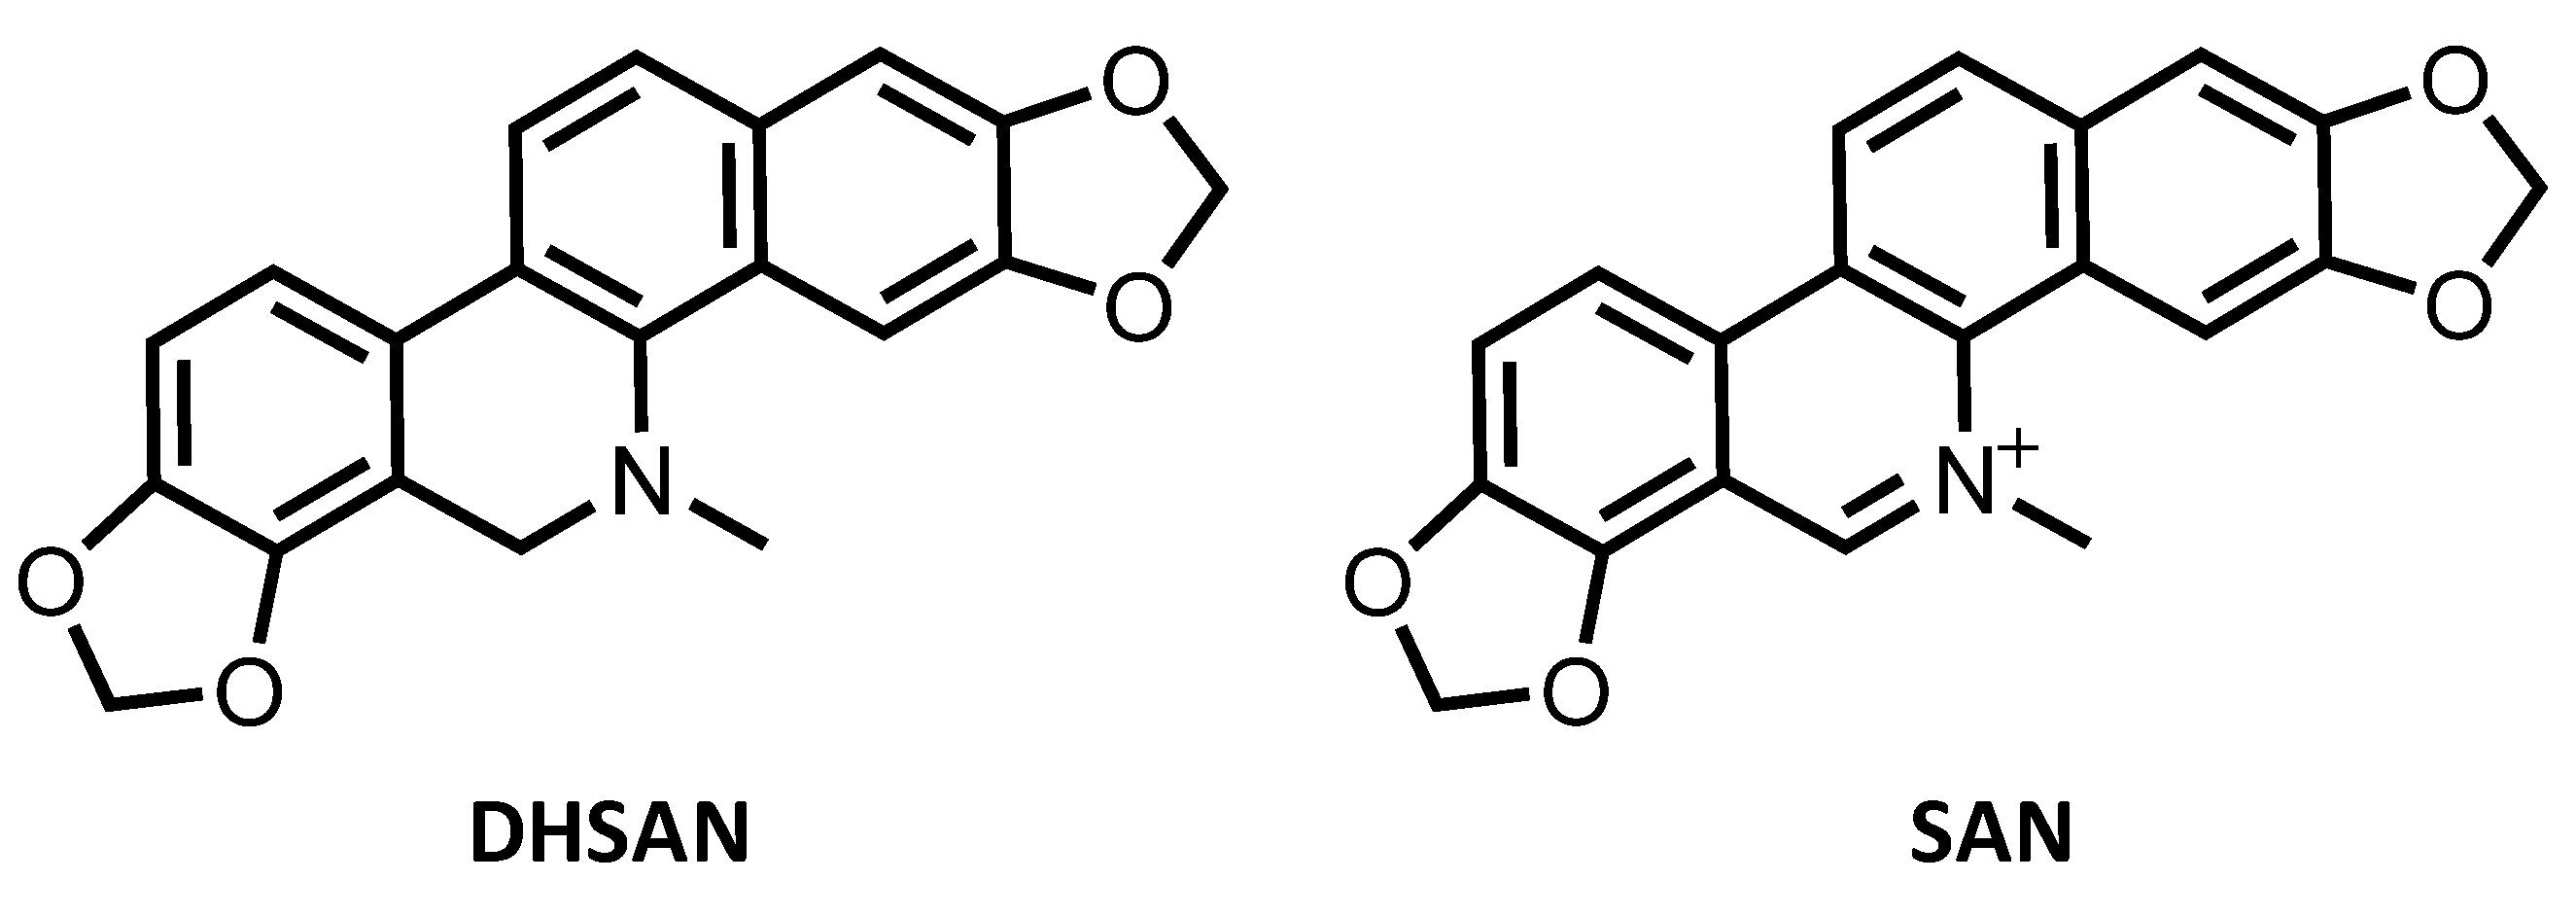
Sanguinarine (SAN) belongs to the quaternary benzo[c]phenanthridine alkaloids family having methylene dioxy substituents at the 2, 3 and 7, 8 positions of the chromophore as shown in Scheme 1. Sanguinarine is, very likely, the most important member of such family possessing remarkable biological significance. Indeed, this alkaloid has been shown to possess antimicrobial, antioxidant, and antitumor properties and it is widely used for the prevention and treatment of many inflammatory conditions [1,2,3,4,5,6].

Scheme 1.
Molecular structure of sanguinarine (SAN) and its dihydro precursor dihydrosanguinarine (DHSAN).
The interest in SAN anticancer properties has recently been renewed [7] by the proposal to use this alkaloid in the framework of the strategy named photoactivated chemotherapy (PACT) [8]. SAN, indeed, as well as all the chemotherapeutics, is plagued by lack of selectivity and off-target toxicity [9,10]. Dihydrosanguinarine (DHSAN), instead, being a SAN dihydro precursor (see Scheme 1), is not cytotoxic [11], and can be used to form the SAN active species by irradiation with light of proper wavelength in presence of singlet molecular oxygen 1O2 to undergo photooxidative dehydrogenation in situ allowing selective killing of cancer cells. Nevertheless, in spite of the displayed multiple anticancer effects, the underlying mechanisms by which SAN exerts its antitumor activity have not been yet fully elucidated.
As demonstrated, first, by the biophysical studies of Maiti et al. [12], in comparison with the classical DNA ethidium bromide intercalator, one of the most important properties of SAN is its strong DNA binding ability that, surely, is relevant for its therapeutic anticancer action [13]. Intercalation is the way of binding and several studies of the base sequence specificity for the sanguinarine DNA binding [14,15,16] have evidenced the strong preference for alternating purine–pyrimidine sequences. In particular, it has been revealed that sanguinarine is a guanine–cytosine (GC) specific DNA intercalator. The alternating GC sequence binding affinity is followed by that for alternating adenine–thymine (AT) sequences.
SAN, together with other alkaloids, has been also examined for its ability to produce singlet oxygen under light irradiation [17,18,19,20]. The exploration of the capability of such compounds to generate singlet oxygen is strictly connected to their use as photosensitizers in Photodynamic Therapy (PDT) [21,22]. PDT is a well-known less aggressive treatment used for combatting cancer, whose indispensable components are a photosensitizer, molecular oxygen, and irradiation with light of proper wavelength. Under light irradiation of the photosensitizer, reactive oxygen species (ROS) are produced, including excited singlet oxygen, as cytotoxic agents able to selectively destroy diseased cells. However, the studies of the photosensitizing properties of SAN are scarce and not up-to-date [21,22]. Moreover, on the capability of DHSAN to work as a photosensitizer generating singlet oxygen 1O2 relies the possibility that its photooxidative dehydrogenation occurs for the controlled generation of the active species SAN.
On the basis of such premises, in the present paper we have focused our attention on the investigation of the photophysical properties of SAN to evaluate whether it can act as a photosensitizer in PDT, the mode of interaction of SAN with DNA occurring through intercalation and how the spectroscopic properties are influenced by DNA intercalation. Photophysical properties of DHSAN have also been examined to prove that it is phoactivatable and, then, able to generate singlet oxygen, which causes the formation of SAN from its dihydro precursor DHSAN. To this aim, DFT and TDDFT were used for examining the spectroscopic properties of both DHSAN and SAN alone and in its DNA intercalated forms. The photosensitizer nature of SAN for its use in PDT and binding effects on sensitization activity were compared. Molecular Dynamics (MD) simulations and free binding energy calculations were carried out in order to obtain information about the intermolecular interactions favoring intercalation into DNA.
2. Computational Details
2.1. Molecular Dynamic Simulations
In order to study the drug intercalation into DNA, a B-DNA dodecamer, with Protein Data Bank code 1BNA [23], was used. SAN was manually introduced into the different potential intercalation sites described in the next section. Hydrogens were added to the model system using H++ web-server [24,25]. In order to obtain SAN parameters, a gas phase geometry optimization was carried out at density functional theory (DFT) level employing the hybrid B3LYP [26,27] as exchange and correlation functional coupled with 6-311G(d,p) basis set and using Gaussian 16 package [28]. Atomic charges are derived by fitting the electrostatic potential according to the Merz–Singh–Kollman scheme [29], using the RESP fitting procedure. The Lennard-Jones parameters of the GAFF force field were used for SAN [30]. Developed parameters are reported in the Supplementary Materials. Molecular dynamics topology and coordinate files were generated by means of tleap in Amber [31] using the standard DNA.bsc [32] and GAFF force fields [30,33] together with the newly generated parameters for SAN. A TIP3P solvation model [34,35,36] was used to construct an octahedral box of explicit water molecules around the DNA dodecamer with a 14 Å buffer distance around the DNA in each direction. Sodium ions were added to neutralize the system. The system was relaxed prior to the molecular dynamics by a 1000 minimization steps with a cutoff distance of 15.0 Å and a constant volume of periodic boundaries. DNA and SAN were fixed during this initial minimization by using a force constant of 500 kcal mol−1. This step was followed by 2500 minimization steps for the whole system including the DNA with the same cutoff distance and constant volume periodic boundaries. The system was then heated from 0 K to 300 K over 10,000 steps for a total of 20 ps. SHAKE algorithm was implemented to constrain bonds involving hydrogen. During the heating, DNA and SAN were restrained by a force constant of 10 kcal mol−1 while keeping the constant volume periodic boundaries and the same cutoff distance. Equilibration followed by production of molecular dynamics (MD) for 100 ns at 300 K were ran under similar conditions with a 0.002 ps interval with no restraints on DNA, a constrain to bonds involving hydrogen and the cutoff distance of 15.0 angstroms were all maintained. NPT molecular dynamics at 1 atm pressure using the Berendsen barostat and an isotropic position scaling with a relaxation time of 2 ps were used. For evaluating the relative binding free energy between SAN, at different intercalation sites, and DNA, the MM-PBSA method [37], as implemented by MMPBSA.py script in the Amber 16 package, was used considering the whole production trajectory of each intercalation position over 100 ns. Calculation of the interaction energy and solvation free energies for the drug–DNA adducts and DNA and drug alone was followed by results averaging to obtain an estimate of the binding free energy as implemented in the MM-PBSA method in Amber 16. To obtain data about the root mean squared deviation (RMSD), distances between residues, and conformational changes in the DNA in the drug–DNA system, cpptraj [38] of Amber was used. cpptraj was also used to extract the most representative conformations of the SAN–DNA systems, and cluster analysis was performed adopting the algorithm of hierarchical agglomerative (bottom-up approach) kind. RMSD of eight surrounding base pairs was used as parameter for clustering. The clustering ends when the suggested optimal number of clusters, that is 10, remains.
2.2. Quantum Mechanical Calculations
Gaussian 16 package was used to perform all quantum mechanical calculations [28]. B3LYP including Grimme’s dispersion correction for nonbonding interactions was employed using atom pair-wise additive scheme [39], the DFT-D3 method. The 6-311G** basis set was employed to describe all the atoms. Frequency calculations were performed at the same level of theory for all located stationary points to confirm their nature of minima and transition states and for zero-point energy corrections calculations. All the located transition states were checked to be properly connected to the corresponding minima by means of intrinsic reaction coordinate (IRC) analysis [40,41]. Full geometry optimizations, without imposing any constrain, were carried out in in implicit water (ε = 78.4) using the PCM continuum solvation model as implemented in Gaussian 16 [42]. Enthalpies and Gibbs free energies were obtained at 298 K at 1 atm from total energies, including zero-point, and thermal and solvent corrections, using standard statistical procedures [43].
To accurately describe the photophysical properties, a preliminary benchmark study was carried out on both SAN and DHSAN. The optimized structure at the B3LYP level in water implicit solvent was used to compute the excitation energies employing several functionals: B3LYP, camB3LYP [44], M06L [45], PBE [46], B3P86 [47], ωB97XD [48], and PW91 [49] including the Grimme dispersion corrections (DFT-D3). Their performances were evaluated comparing S1 absorption peak wavelengths in water and THF for SAN and DHSAN, respectively (Table S1). Then, B3LYP-D3 was selected as the most suitable exchange and correlation functional, and it was used for all the TDDFT calculations.
To establish whether DHSAN is able to produce 1O2 required to generate SAN, the possibility of an intersystem spin crossing from a bright singlet state to a triplet one of DHSAN was taken into consideration by computing the spin–orbit matrix elements, within the atomic-mean field approximation as implemented in the ORCA code [50,51] at the same level of theory used for the other calculations (PCM/B3LYP/6-311G(d,p)). The same calculation was performed on SAN to ascertain its ability to act as photosensitizer as well. The Dalton code [52] was used to evaluate the two-photon absorption cross section that can probe the applicability of the drug as a PDT two-photon agent. For this purpose, the quadratic-response TD-DFT approach was used. B3LYP coupled with 6-311G(d,p) were selected for such calculations that are performed in an implicit (PCM) water environment by considering the non-equilibrium contributions of the solvent to the response calculation.
The representative structure of the most populated clusters was used to build up a model including the drug and the eight surrounding nucleotides for further TDDFT analysis. The intercalated SAN geometries from the extracted conformations were optimized together with the four nearby nucleobases, the rest of the atoms were kept frozen in order to avoid the unrealistic distortion of the DNA portion included in the QM calculations because of the absence of the rest of the dodecamer used for the MD intercalation study. The optimization and then the absorption spectrum in implicit solvent water was obtained maintaining B3LYP and the 6-311G(d,p) basis set for all the atoms of SAN, 6-31G(d,p) was, instead, employed to describe the nucleobases that surround the drug and the standard 6-31G basis set for the rest of the atoms of the DNA portion. In order to ascertain the influence of the DNA on the photophysical properties, the spin–orbit matrix elements were computed as well. Nevertheless, given the size of the systems SAN-nucleobases, the computation of such property was only possible using a small basis set (6-31G) describing all the atoms. However, these quantities were preliminarily calculated for SAN with both basis set, 6-311G(d,p) and 6-31G. A difference of no more than 0.02 cm−1 was found for S1–T2 coupling, while S1–T1 remains exactly the same.
3. Results and Discussion
3.1. Photophysical Properties of DHSAN
The most suitable protocol for the study of the photophysical properties was chosen performing a preliminary benchmark of a series of exchange-correlation functionals to test their ability to reproduce the experimental value of the main absorption wavelength of the lowest-lying absorption band (S1 state) of SAN and its precursor DHSAN [7,53]. The values calculated using several exchange-correlation functionals are reported in Table S1 of the Supplementary Materials together with the corresponding oscillatory strengths and the main contributions in terms of Molecular Orbitals (MO) involved in the transitions. Calculations were carried out in water solvent for SAN and THF for DHSAN, to reproduce the environment used to register the experimental UV–vis spectra. Comparison shows that two functionals, namely, B3LYP-D3 [26,27,39] and B3P86-D3 [47], are able to better reproduce the reference experimental values of the maximum absorption wavelength. The B3LYP-D3 level of theory was chosen, being the most versatile, and was used also to carry out all the involved calculations and to build-up the free energy profiles in water solvent. The photophysical properties of DHSAN are discussed in this section, while those of SAN will be addressed in Section 3.4.
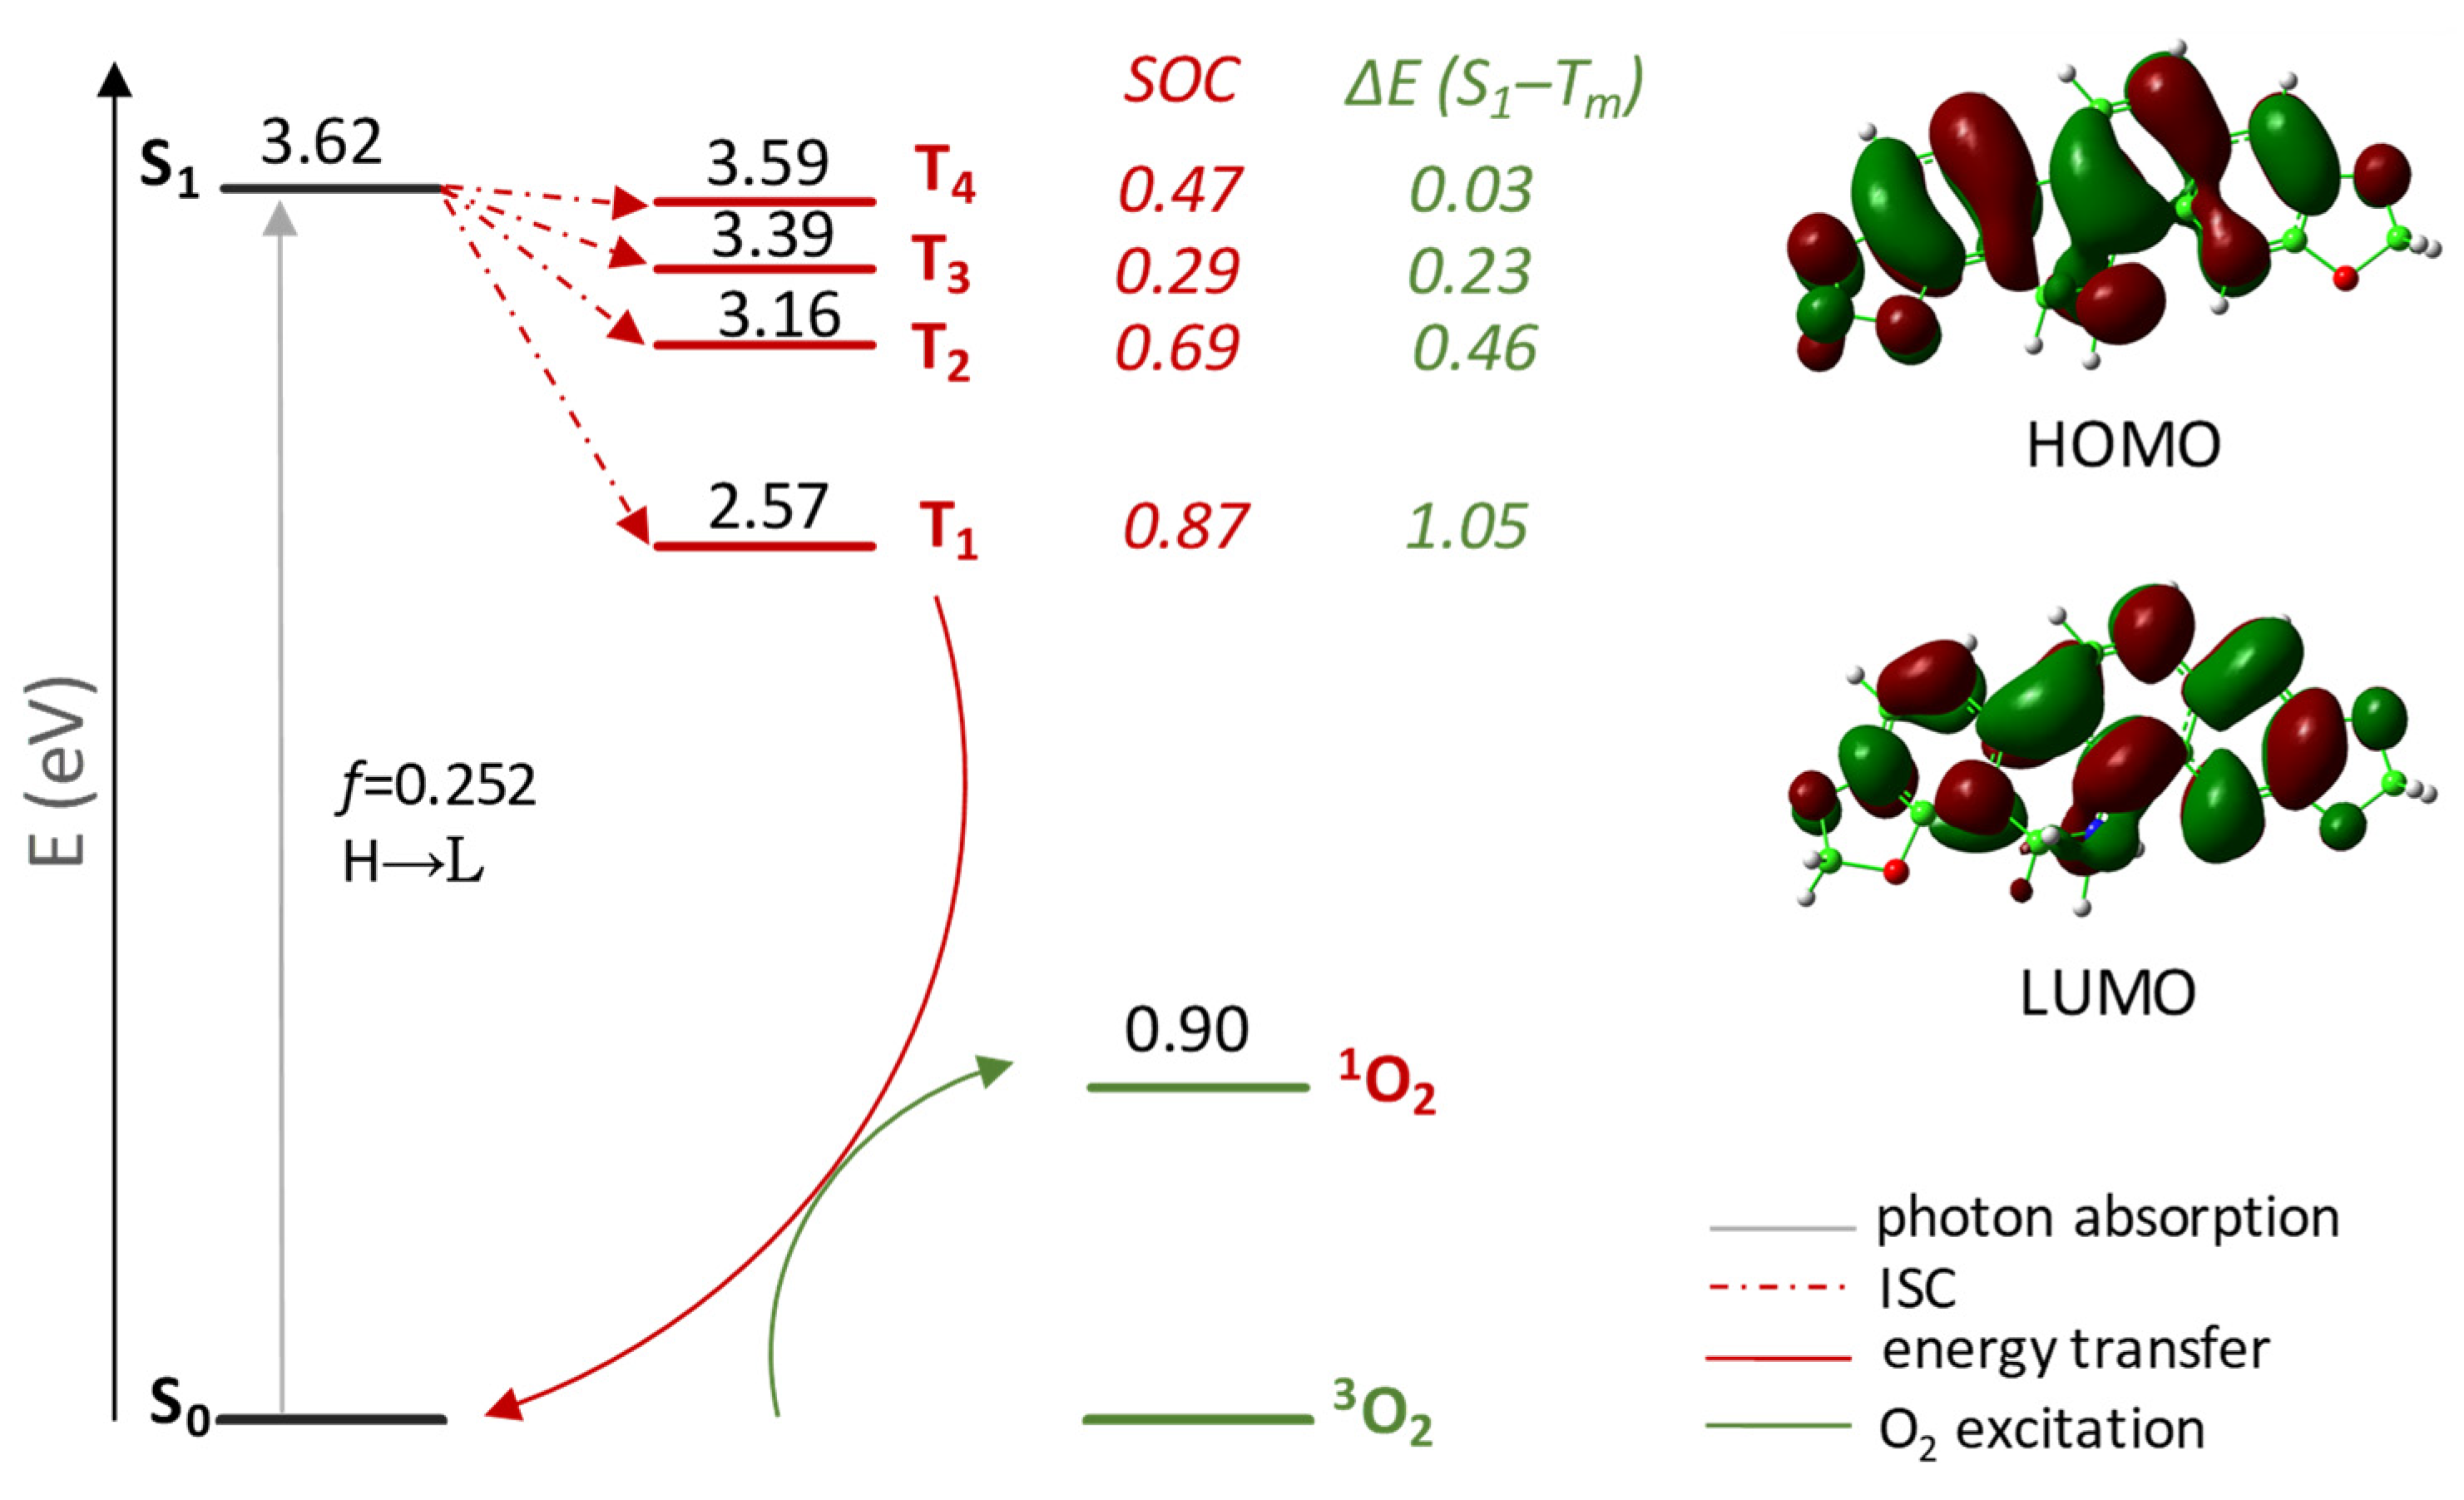
The absorption spectrum of DHSAN is simple and has a single peak with maximum experimentally recorded in THF solvent at 335 nm [7]. Since the computed spectra in THF and water did not show significant differences, the calculated key parameters illustrating the photophysical properties of DHSAN in water are reported, while detailed information can be found in Table S2. The maximum absorption wavelength of 342 nm with an oscillator strength of 0.252, well reproduces the experimental one obtained in THF and corresponds to a vertical excitation energy of 3.62 eV. The spin-allowed transition involves the HOMO(H) and LUMO(L) orbitals. The transition has clear ππ* character, being the orbitals delocalized across the molecule, and strong π conjugation is observed even if the structure deviates from planarity.
Four triplet states were localized below the excited singlet one (see Table S3 for further details). In order to establish their probability of population that, in turn, depends on the possibility that excitation is followed by an efficient Inter System Crossing (ISC) allowing the access to the triplet manifold, both singlet–triplet splitting energies ΔE(S1–Tm), and spin–orbit coupling (SOC) matrix elements ⟨Tm|HSOC|S1⟩ were calculated and are reported in the same Figure 1. All the four intercepted triplet states can be involved in deactivation of the bright state once the S1 state is populated. The values of the coupling constants between the S1 state and all triplet states, Tm (with m = 1–4), lying below are larger than that calculated for the approved Foscan® (2.4 × 10⁻¹ cm−1 for the S1 → T1 radiationless transition) [54]. Finally, DHSAN decaying from the triplet excited to the ground state allows an efficient generation of singlet molecular oxygen 1O2 (1Δg), as the calculated energy gap (shown in Figure 1) is significantly larger than 0.98 eV, which is the minimum energy amount required to excite triplet oxygen.
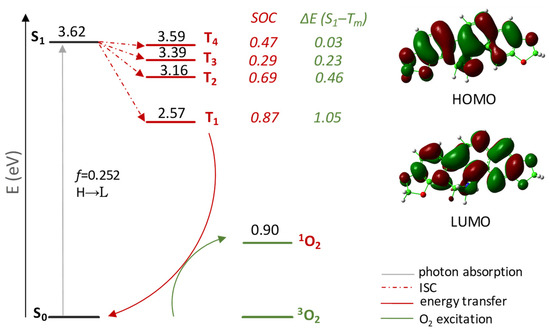
Figure 1.
Jablonski-like diagram of DHSAN for 1O2 formation and its frontier orbital contour plots. SOC values, in cm−1, and ΔE(S1–Tm), in eV, are also reported. All the calculations were carried out in implicit water solvent.
However, the 1O2 sensitization triggered by DHSAN is limited by the wavelength as its maximum absorption (335 and 342 nm, for recorded and computed spectra in THF and water, respectively) falls outside the optimal spectral region identified as the ideal phototherapeutic window (550–850 nm), suggesting a limited tissue penetration that could prevent the 1O2 formation needed for in situ SAN generation. For this reason, in view of its importance for photosensitizers, two-photon excitation (TPE) was taken into consideration. TPE occurs when two lower energy photons of NIR light, whose energy spans the gap between the ground state and excited electronic states, are absorbed by the photosensitizer. Such an approach was suggested to extend the excitation wavelength allowing for deeper light penetration and lower photo-bleaching of the drug in tissues.
It is well established that the size of the chromophore, in terms of length of the π system and then the number of π electrons, has a strong effect on two-photon absorption (TPA). Indeed, most of the photosensitizers suggested for TPE-based action are characterized by extended π systems. However, as recently reviewed by E. Robbins et al., relatively small organic chromophores can also exhibit large values of TPA cross-sections [55]. DTP-based dyes (DTP = 2,5-dithienylpyrrole), characterized by D-π-A structure, exhibit cross section values comprised in the range 400–8000 GM.
The TD-DFT outcomes of DHSAN are collected in Table 1, where for each obtained excited state, the photon energy (ΔE) and wavelength (λ), TPA strength ⟨⟩, and cross section are reported.

Table 1.
Photon energy (ΔE) and wavelength (λ), TPA strength ⟨⟩, and cross section for five states TD-DFT calculated for DHSAN in implicit water solvent for linearly polarized light.
The computed TPA parameters suggest that the TPE most likely occurs near the red end of the visible light. Indeed, the highest cross-section values were found for excited states comprised between 575 and 720 nm. In particular, the excited state lying at 3.47 eV is characterized by the highest σTPA. From the analysis of the Natural Frontier Orbitals (NTOs), whose Highest Occupied Transition Orbital (HOTO) and Lowest Unoccupied Transition Orbitals (LUTO) are shown in Figure S1, emerged that such a state originated from a charge transfer involving the whole π system of the DHSAN molecule, included the peripheral oxygen atoms.
Therefore, the computed photon energies and the corresponding cross-section values highlight that DHSAN can be activated by two-photon laser irradiation at a wavelength falling in the phototherapeutic window as efficiently as under violet-light irradiation. This means that, under TPE, singlet oxygen, the key reactant in oxidation of DHSAN into SAN, can be efficiently generated.
3.2. Photoconversion Mechanism of DHSAN into SAN
Here are reported the outcomes of the investigation of the mechanism that allows the formation of SAN starting from its dihydro precursor DHSAN under light irradiation and, then, singlet oxygen 1O2 assistance. As first demonstrated by Maiti and coworkers using spectroscopic measurements, SAN exists almost exclusively as iminium and alkanolamine forms at physiological pH, being the equilibrium shifted toward alkanolamine formation [56]. Both forms of the alkaloid, the water-soluble cation and the less soluble neutral alkanolamine can be involved in interactions with biological systems. For that reason, the transformation of the iminium ion into the alkanolamine form was also examined. In the previous paragraph, it was demonstrated that the proposed mechanism [7] is reliable. Indeed, irradiation with light of proper wavelength causes the excitation of DHSAN from the ground state into a short-lived electronically excited state (S1). The excited singlet state undergoes, via intersystem crossing, spin inversion and populates the lower-energy first excited triplet state, and then from such state, a second spin-forbidden inversion occurs depopulating the excited triplet state T1 by decaying to the ground state. The longer lifetime of this species is sufficient to allow the DHSAN T1 state to interact with surrounding molecules including the ground triplet state of molecular oxygen, and being the released amount of energy more than enough, excited singlet oxygen is formed. Singlet oxygen, in turn, can react with DHSAN to produce SAN.
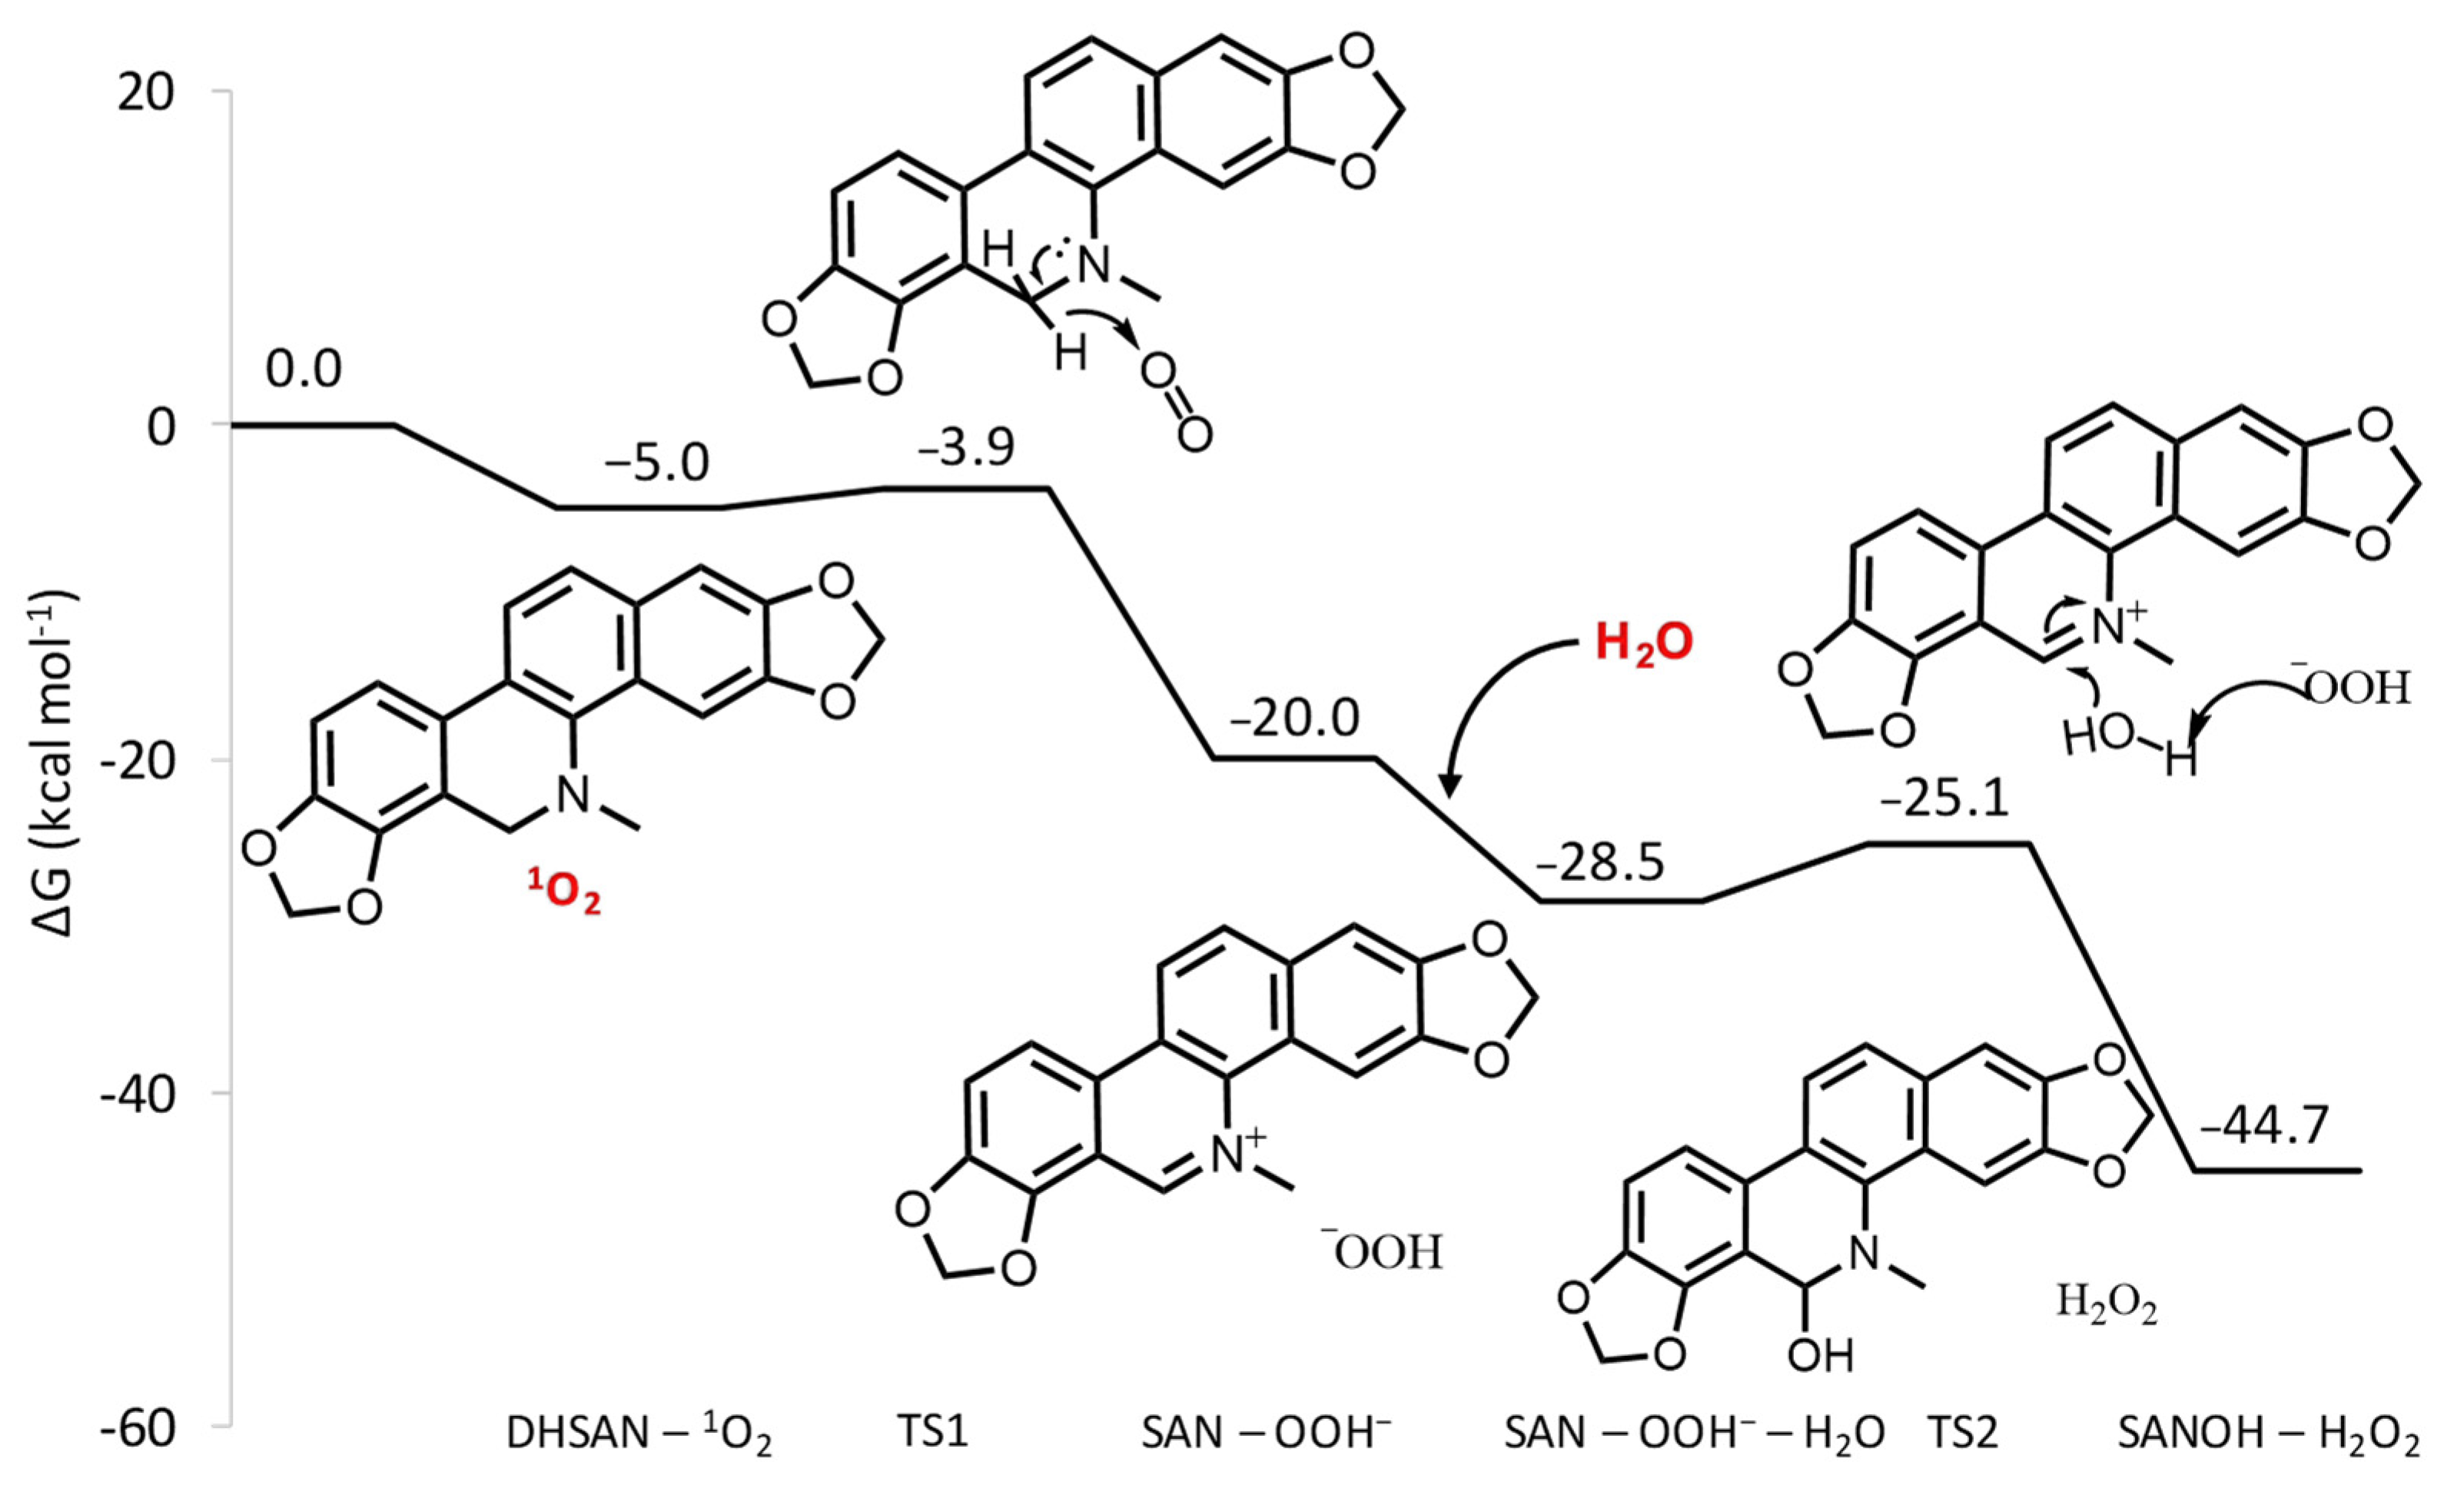
The free energy profile describing the reaction between SAN and 1O2 is reported in Figure 2. Optimized geometrical structures of the stationary points located along the reaction pathway are reported in Figure S2 of the Supplementary Materials. After the formation of the first adduct between DHSAN and singlet oxygen, lying 5 kcal mol−1 lower in energy than the separated reactants, the strongly oxidizing nature of 1O2 causes the transfer of a H− unit from the tertiary amine to molecular oxygen leading to the formation of the iminium cation and the hydroperoxide anion HOO−. The height of barrier that is necessary to overcome for this reaction to occur is only 1.1 kcal mol−1, whereas the products are stabilized by 20.0 kcal mol−1 with respect to the entrance channel. The reaction, then, can proceed towards the formation of the alkanolamine form of SAN. The favorable interaction with water further stabilizes the adduct formed with the iminium cation by 8.5 kcal mol−1. The simultaneous abstraction of a proton from water by the HOO−. species and the nucleophilic attack of the formed hydroxo species to the carbon atom in position 6 of the iminium cation affords the 6-hydroxydihydroderivative (SANOH). The corresponding transition state is higher by 3.4 kcal mol−1 than the minimum leading to it. The formation of alkanolamine and hydrogen peroxide is calculated to be exergonic by 16.2 kcal mol−1 with respect to the iminium cation and water.

Figure 2.
B3LYP-D3/6-311G(d,p) free energy profile for oxidative dehydrogenation reaction of DHSAN.
As underlined in the literature concerning the pH-dependent equilibrium between the two forms of SAN, namely, iminium cation and alkanolamine, this equilibrium is shifted towards the iminium form in biological environments by the interaction in terms of intercalation with DNA [57]. Indeed, the SAN charged form can bind to DNA, establishing intercalative interactions with its bases, whereas intercalation is precluded to the alkanolamine neutral form, as proved by a number of biophysical experiments, due to its non-planar structure having a partial saturation [58].
3.3. Structures and Dynamics of SAN Intercalation into DNA
As underscored above, the various pharmacological effects exhibited by SAN including its anticancer activity, can involve SAN strong capability to bind DNA, as one of the most important mechanisms. A large number of studies have been dedicated to this aspect [53], and we are going to illustrate the outcomes of MD simulations we have carried out with the aim of obtaining more detailed information about the intercalation process. Intercalative binding is one of three different modes, together with electrostatic and groove binding, by which molecules can be non-covalently attached to DNA. The stacking effect as well as hydrogen bonding with surrounding nucleotides are, generally, prominent in determining the intercalation strength that, in turn, can induce DNA conformational and functional changes ultimately leading to cell apoptosis. For cationic intercalators, it is reported that the stabilization energy is considerably larger than for uncharged species [59]. Due to its planar structure and aromaticity, intercalation of SAN, in its iminium cationic form, is very likely. Therefore, MD simulations were performed manually putting the molecule into the adopted B-DNA dodecamer model considering different positions across the major groove of the helix between two base pairs in analogy with our previous studies [60,61,62]. The examined DNA sites are shown in Figure 3A. Due to the asymmetric structure of SAN, two different orientations of the molecule in positions labeled 2 and 4 were examined (Figure 3B). The labels used for the studied sites of intercalation are: 1 where the drug is stacked within the cytosine–guanine (CG) and guanine–cytosine (GC) base pairs, 2 corresponds to the drug stacked within adenine–thymine (AT) and adenine–thymine (AT) base pairs, 3 for adenine–thymine (AT) and thymine–adenine (TA), and 4 for thymine–adenine (TA) and cytosine–guanine (CG) base pairs stacking. The two different orientations of SAN were included adding the labels a and b to both 2 and 4 positions.
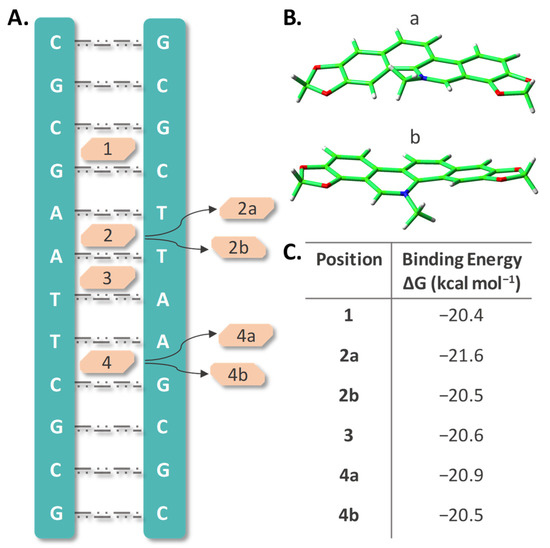
Figure 3.
(A) Schematic representation of SAN intercalated at the four positions, labelled 1–4, of the B-DNA dodecamer; (B) its possible orientations within 2 and 4 positions; (C) MMPBSA calculated binding energies (kilocalories per mole) for all the considered intercalated positions.
Trajectories simulating all the arrangements were extended up to 100 ns and more detailed information concerning the outcomes of the MD simulations can be found in Figures S3–S5 of the Supplementary Materials. The plot of the DNA length change, calculated as the distance between the center of mass of the two pre-terminal base pairs of the helix and taking drug-free DNA as a reference, shows that intercalation causes a lengthening of about 3 Å for each position. This elongation is mainly due to the increased spacing between the base pairs at the intercalation sites. Plots of the Root Mean Square Deviation (RMSD) for every intercalation site give an indication of the conformational distortion caused by intercalation with respect to the unperturbed DNA structure. Oscillations are more evident when the whole structure is taken into consideration caused by the flexibility of the terminal base pairs and consequent temporary breaking of the established H-bonds. Binding due to the intercalation appears to be stable over the whole simulation time. The binding free energies, BEs, calculated by means of the MM-PBSA approach over the full trajectories, are listed in panel C of Figure 3. These values are not very different amongst them and span in a range from 20.4 to 21.6 kcal mol−1 with an uncertainty comprised between 2.1 and 2.4 (Table S4). The same kind of calculation was performed on subsets of the trajectories, splitting the 100 ns simulations in four parts of 25 ns, in order to verify that their average binding free energy is representative of the full simulation (Table S5). Even in this case, the obtained values within the same MD simulation for each position are not very dissimilar from each other, and their mean value differs by no more than 0.4 kcal mol−1 from the value obtained processing the whole trajectory, and in some cases (2a and 4b) perfectly reproduce this value.
In order to select the proper geometries to use as starting points for further, more computationally expensive, quantum mechanical calculations, clustering analysis of MD trajectories was carried out for SAN intercalated into DNA at the positions shown in Figure 3A. The results of this analysis were collected in Table S4. As it clearly appears, only one cluster corresponds to the largest population with respect to the total number of structures attained along the dynamics run for all the examined situations. From the selected MD snapshots, starting geometrical structures were extracted including the portion of interest, which is the drug in close proximity to four surrounding nucleotides, and cutting out the rest of the arrangements. Such geometries have been used as an initial guess for subsequent DFT geometrical optimizations (see Computational Details for further details), as shown in Figure S6, and the resulted structures were labeled as I, IIa, IIb, III, Iva, and IVb following the labelling of MD simulations.
3.4. Photophysical Properties of SAN
SAN, due to its highly conjugated nature, is a brightly colored molecule strongly adsorbing in the UV–vis region of the spectrum. The key features of the SAN spectrum, which are vertical excitation energies, maximum absorption wavelength, oscillator strength, and molecular orbitals (MO) contributions for singlet excitations, are calculated by adopting the selected protocol and are included in Table S2 of the Supplementary Materials. The experimental absorption spectrum recorded in water shows a shoulder in which two bands are discernible centered at 470 and 400 nm, respectively. Two intense bands are clearly visible at higher transition energy centered at 327 and 273 nm. The computed spectrum satisfactorily reproduces such characteristics. The spin-allowed transitions at low energy give rise to the two shoulder bands centered at 496 and 434 nm having H → L and H-1 → L character, respectively. Absorption in the short wavelength region of the spectrum generates two bands. One corresponds to two transitions centered at 341 and 324 nm due to H → L+1 and H-1 → L+1 electron promotions, respectively. The second band is equally comprised of two transitions at 290 and 275 nm with H → L+2 and H-3 → L character, respectively.
Changes induced in the absorption spectrum of the free SAN upon DNA intercalation were examined for each intercalation position on which MD calculations were carried out. As illustrated above, clustering analysis was used to extract the most representative configuration for each intercalation position. The structures extracted from each MD run and subsequently partially optimized (see computational details for further details) at DFT level are collected in Figure S6. The computed absorption spectra are plotted in Figure 4, where that of the free SAN is also included. While detailed information on the electronic transitions contributing to each absorption band of intercalated SAN can be found in Table S7, the most relevant photophysical features of the drug useful to ascertain its ability of 1O2 sensitization in all the intercalated arrangements are reported in Figure 5.
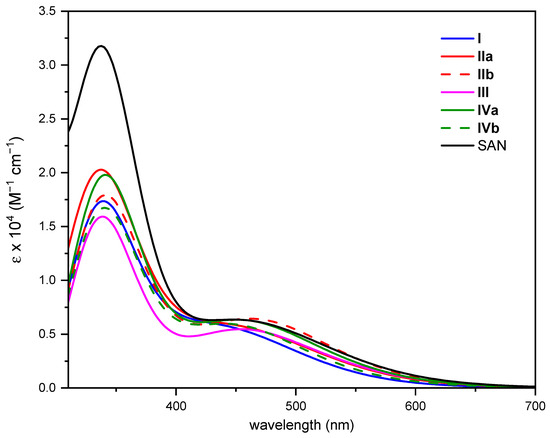
Figure 4.
Computed absorption spectra in implicit water solvent of SAN and all its possible intercalated arrangements.
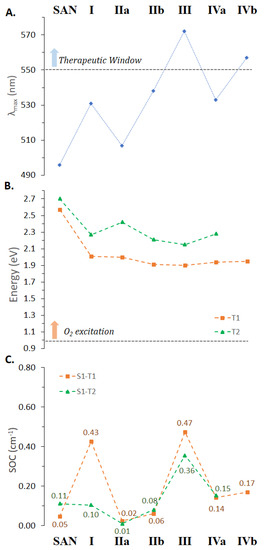
Figure 5.
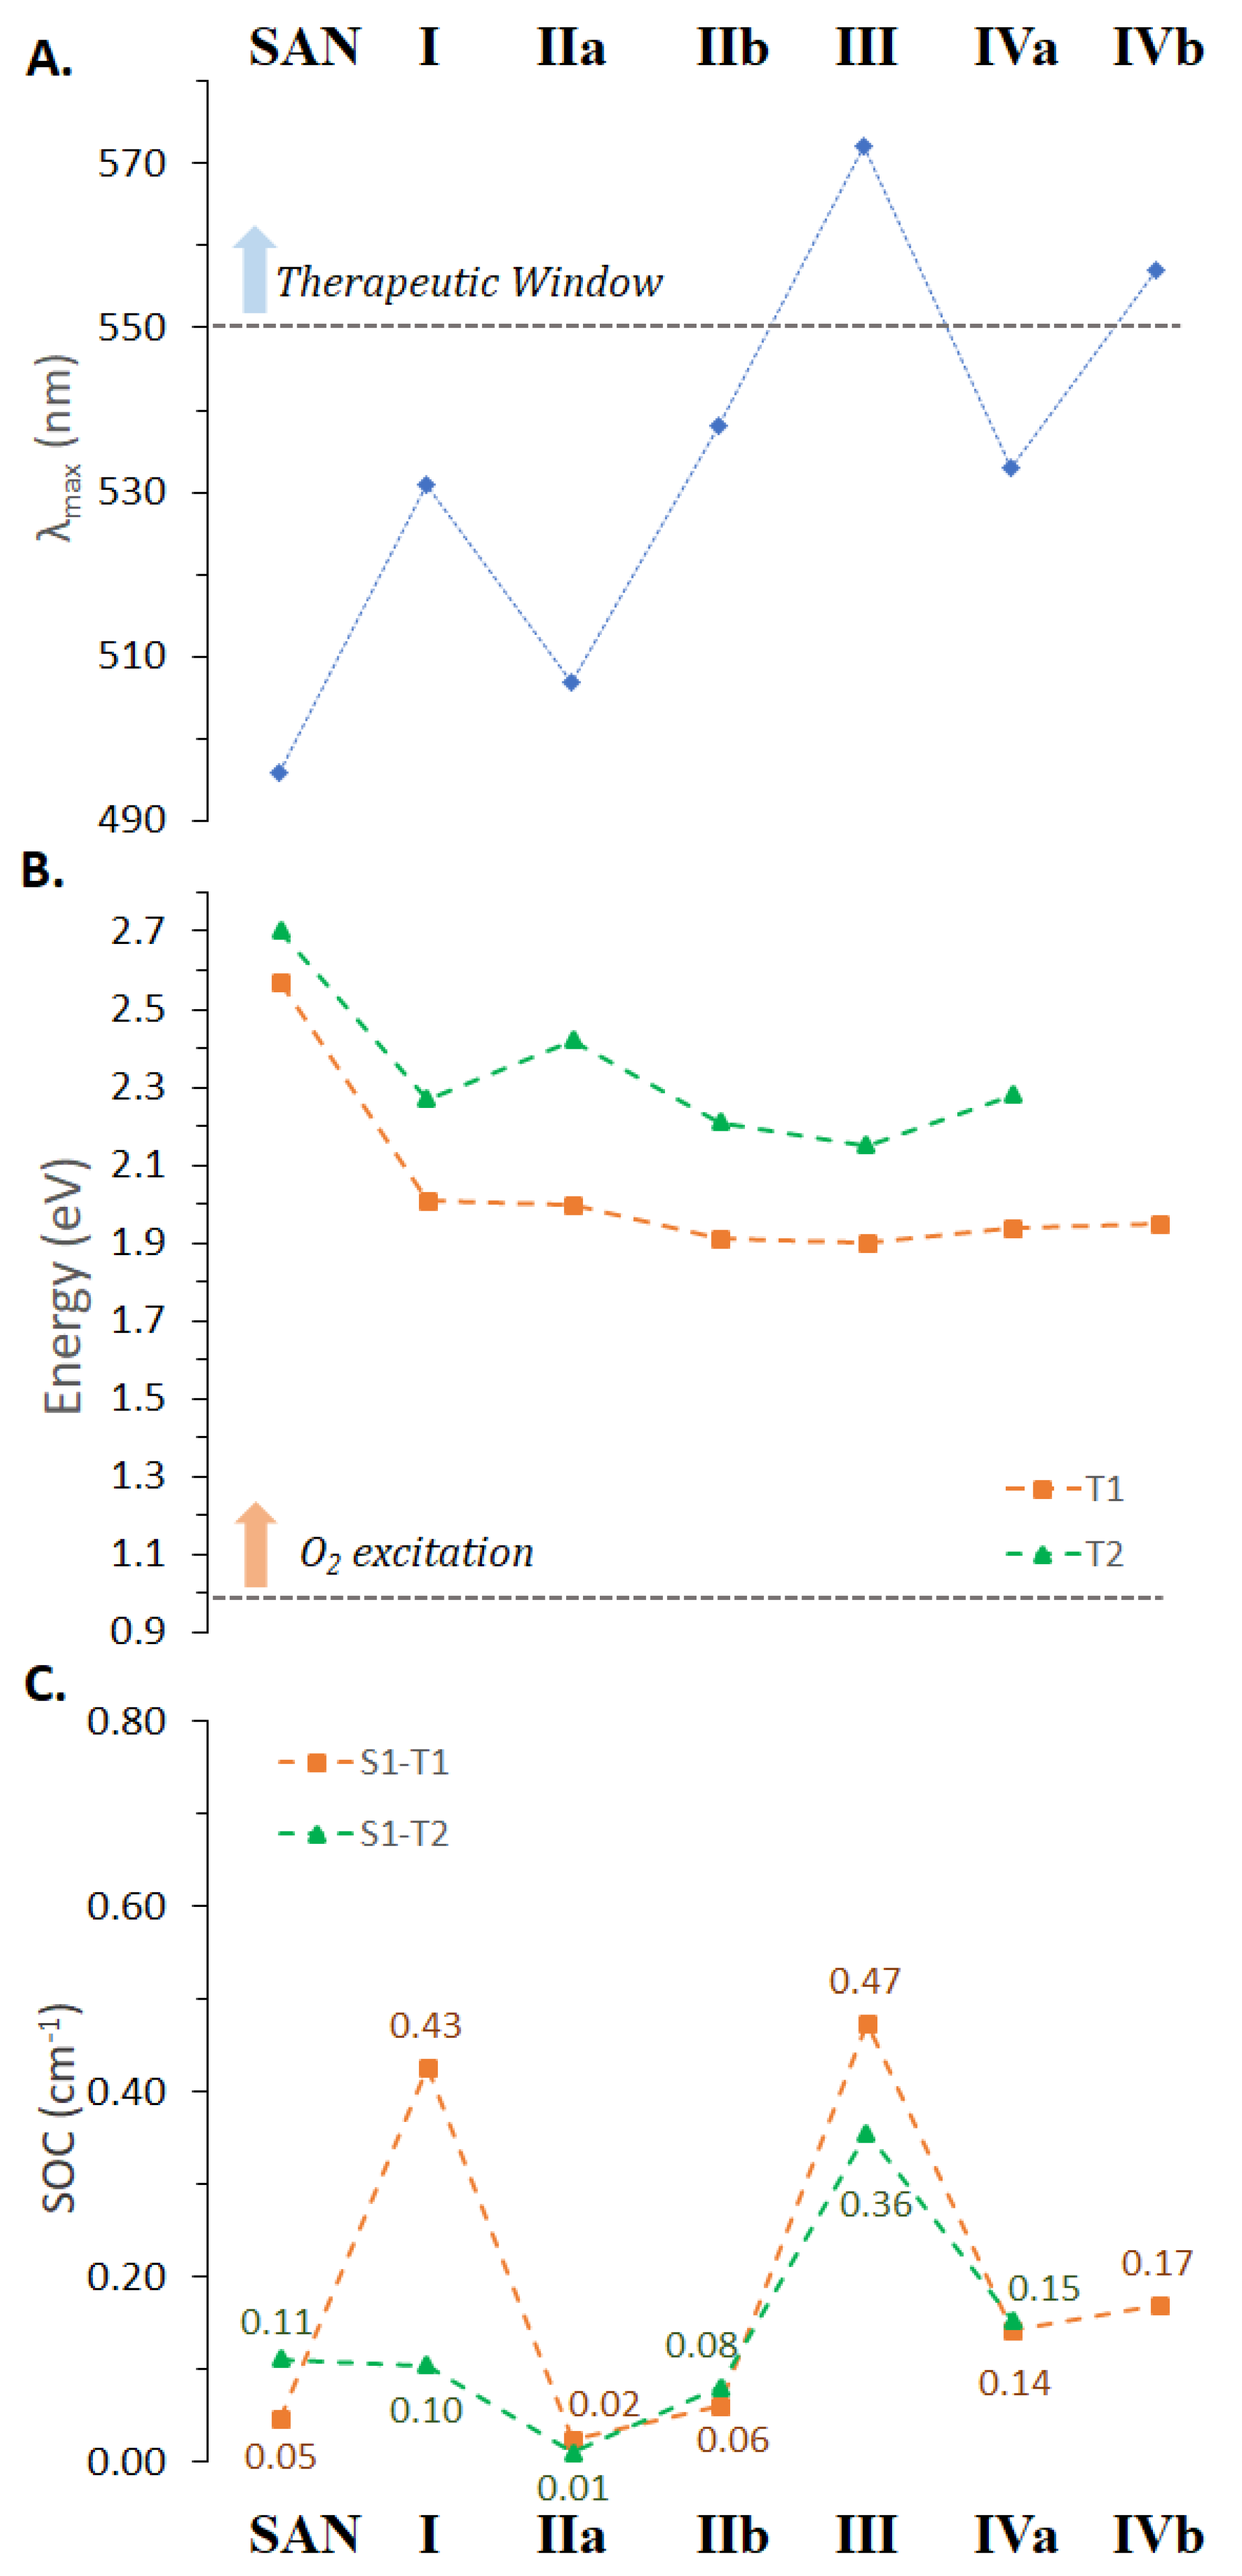
Computed (A) maximum absorption wavelengths, (B) T1 and T2 triplet states energy and (C) spin–orbit coupling constants for the accessible S1 deactivation processes of the SAN and all its possible intercalated arrangements extracted from MD simulations.
Both bathochromism and hypochromism of the absorption bands have been reported for DNA intercalative interactions of conjugated π systems [60,63]. Even in the case of SAN, the intercalation process, whatever the position considered, influences the position of the maximum absorption wavelength (see Figure 5A) as well as the intensity of the bands; although, as it appears evident from Figure 4, the shape of the spectrum does not differ too much from that of the free SAN, especially in the key region for the use of the drug in PDT. While the spectrum of intercalated SAN is characterized by a considerably less intense band in the region 300–400 nm, which originated by the highest energy electronic transitions, for the most relevant transition a less evident effect on the band intensity occurs and a bathochromic shift comprised between 37 (IIa) and 102 nm (III) was found. The noticeable shift in wavelength upon intercalation of SAN into DNA helix confirms that strong ππ* interactions are established [60], responsible for the orbital energy gap decrease causing the red-shift of the absorption band.
In all cases, such excitation is originated by a H → L electronic transition, with the exception of IVb, for which it becomes H-1 → L type. However, the inspection of the involved MOs reported in Figure S7 clearly shows that the absorption corresponds to a charge transfer (CT) from the DNA to the intercalated SAN, and guanine base is involved in all cases except III for which the adenine base is responsible for the CT.
An improvement in the photophysical properties of the drug, therefore, is proved by the calculated red-shift for intercalated arrangements of SAN into the DNA helix leading to a potentially higher ability to act as photosensitizer.
Nevertheless, as described for DHSAN, an efficient photosensitizer has to fulfill other requirements, which include a consistent spin–orbit coupling for promoting the ISC from the excited singlet to triplet electronic states, and the existence of a triplet state of proper energy to be able to excite molecular oxygen. For this reason, triplet excited states of SAN in water within the vertical approximation have also been calculated and are included in Table S3 of the Supplementary Materials. Two lowest lying triplets together with MO contributions were characterized using TDDFT. S1 and T1 transitions involve H and L orbitals with ππ* character. The HOMO delocalized on entire molecular skeletons, while the LUMO is mainly localized on the isoquinoline part (Figure S8). These triplets are shown in Figure 5B together with the computed values of the spin–orbit matrix elements ⟨Tm|HSOC|S1⟩ (panel C), from which the efficiency of the ISC depends on together with the singlet–triplet energy gaps, ΔE(S1 − Tm) for m = 1, 2.
Data reported in Figure 5B clearly reveal that the intercalation process entails a stabilization of the low-lying triplet states with respect to the free SAN. Nevertheless, the energy gaps between the ground state and the first excited triplet state remain higher than the energy required for O2 excitation (0.98 eV) for all the intercalated adducts, and then SAN, in such conditions, once its triplet state is populated, should be surely able to generate the 1O2 cytotoxic species.
The remaining requirement usually taken into consideration for the photosensitizers in PDT, namely, the efficiency of the ISC between the bright state and the triplet manifold, was examined. On the basis of calculated SOC values (see Figure 5C), SAN seems to be less able than its DHSAN precursor in acting as a photosensitizer, being DHSAN characterized by SOC values one order of magnitude higher than those of SAN. However, it is likely to be hypothesized that once intercalated, since the absorption wavelength improves, its ability to populate the low-lying triplet states could also be enhanced. Indeed, as shown above, DNA nucleobases actively participate in the CT to SAN (Figure S7) for the population of the bright state changing the MOs’ nature found for the free drug (Figure S8), which, in turn, influences the ISC efficiency. The same changes in MOs’ nature were found for triplet states of investigated arrangements of SAN within the DNA helix. In fact, as reported in Table S8, while T1 state remains essentially of the type ππ*, T2 systematically involves the nucleotides in the CT from DNA to SAN. Looking at data collected in Figure 5C it can be seen that SAN, once intercalated, exhibits a higher ability to promote the triplet state population and, then, 1O2 production. Indeed, the SOC values from 0.05 to 0.11 for S1-T1 and S1-T2 radiationless transition, respectively, pass, e.g., to 0.47 and 0.36 in the intercalation site 3 (AT-TA).
4. Conclusions
In this paper, a carefully theoretical exploration of the reaction mechanism for the photoconversion of DHSAN into SAN is reported. To this aim, the DHSAN photophysical properties, in terms of electronic transitions, singlet–triplet energy gaps and spin–orbit coupling constants were computed by means of DFT and TD-DFT, in order to ascertain its ability to generate the excited state of molecular oxygen, essential for in situ SAN formation. The plausible formation of both SAN iminium and alkanolamine forms present at physiological pH were examined. The characterized free energy surface proved the exergonicity of the drug generation in both forms, which is realized overcoming very low activation energy barriers. From here, two different modes for inducing cells apoptosis by SAN were taken into consideration: the intercalation into DNA helix and the capability to generate the cytotoxic species 1O2 through photoirradiation. The outcomes of the computational analysis presented here show that the intercalation process, explored by means of MD simulations, provokes conformational changes into DNA structure that ultimately might compromise its main functions, leading to cell death. From the other hand, it was seen that an improvement in the photophysical properties of SAN upon intercalation occurs.
Since the wavelength of the radiation activating DHSAN falls outside the ideal therapeutic window, the possibility of TPE was taken into consideration. On the basis of the TPA calculated parameters it is possible to hypothesize that the efficacy of DHSAN can be increased by TPE in the range 550–850 nm. However, additional biological studies should be carried out to ascertain whether DHSAN could be a two-photon activatable drug by irradiation with long wavelength. This option is of particular interest aiming at reaching deep tumour tissues and could open the way to a new SAN-based therapeutic strategy.
Supplementary Materials
The following are available online at https://www.mdpi.com/article/10.3390/app12031095/s1, Developed parameters for SAN. Figure S1: Natural Frontier Orbitals (NTOs), Highest Occupied Transition Orbital (HOTO), and Lowest Unoccupied Transition Orbitals (LUTO) for the most important DHSAN electronic transition computed for TPE. Figure S2: B3LYP/6-311G** optimized structures of stationary points along the oxidative dehydrogenation reaction of DHSAN in water. Figure S3: DNA length change due to the intercalation of the SAN measured from the pre-terminal (one before the last) base pairs center of mass, taking the drug-free DNA as a reference. Figure S4: RMSD plots of DNA, four residues around the intercalated SAN obtained by DNA-SAN dynamics. Figure S5: RMSD plots of the four residues around the sanguinarine taking the same residues in a drug-free DNA dynamics as a reference. Figure S6: Optimized geometries of the representative structures extracted from the most populated cluster selected from MD simulations that include SAN and the eight surrounding nucleotides for all the investigated intercalated positions. Figure S7: Contour plots of the key molecular orbitals for intercalated adducts extracted from MD simulations. Figure S8: Contour plots of the key molecular orbitals of SAN. Table S1: TD-DFT Benchmark computed at B3LYP-D3/6-311G** level in water for SAN and in THF for DHSAN. Table S2: B3LYP/6-311G** Vertical excitation energies, ΔE (eV), λmax (nm), oscillator strengths, f, and main transitions computed in water for SAN and in THF for DHSAN. Table S3: Triplet States energies and MO contribution computed in water for SAN and THF for DHSAN. Table S4: MMPBSA terms for the binding of SAN into DNA different positions (kcal mol−1). Table S5: Calculated binding energy (kcal mol−1) values for each 25 ns of molecular dynamics simulation and for the total time trajectory 0–100 ns. Table S6: Results of clustering analysis, of hierarchical agglomerative kind, of MD trajectories for SAN intercalated at the preferred positions in %. Table S7: Vertical excitation energies, ΔE (eV), λmax (nm), oscillator strengths, f, and main transitions computed in water for the extracted structures by clustering. Table S8: Triplet States energies and MO contribution computed in water for intercalated arrangements extracted from the MD simulations.
Author Contributions
Conceptualization and data curation, S.S.; methodology and investigation S.S. and S.B.; resources, writing—review, editing, and supervision, E.S. and G.M. All authors have read and agreed to the published version of the manuscript.
Funding
This research received no external funding.
Acknowledgments
This research was supported by the project POR Calabria–FSE/FESR 2014–2020. University of Calabria and Calabria Region are acknowledged for financial support and CINECA for the computing time (Project IsC86). The authors thank Meng Gao for fruitful and stimulating discussion.
Conflicts of Interest
The authors declare no conflict of interest.
References
- Lenfeld, J.; Kroutil, M.; Marsalek, E.; Slavík, J.; Preininger, V.; Simánek, V. Antiinflammatory activity of quaternary benzophenanthridine alkaloids from Chelidonium majus. Planta Med. 1981, 43, 161–165. [Google Scholar] [CrossRef] [PubMed]
- Godowski, K.C. Antimicrobial action of sanguinarine. J. Clin. Dent. 1989, 1, 96–101. [Google Scholar] [PubMed]
- Obiang-Obounou, B.W.; Kang, O.H.; Choi, J.G.; Keum, J.H.; Kim, S.B.; Mun, S.H.; Shin, D.W.; Kim, K.W.; Park, C.B.; Kim, Y.G.; et al. The mechanism of action of sanguinarine against methicillin-resistant staphylococcus aureus. J. Toxicol. Sci. 2011, 36, 277–283. [Google Scholar] [CrossRef] [Green Version]
- Adhami, V.M.; Aziz, M.H.; Reagan-Shaw, S.R.; Nihal, M.; Mukhtar, H.; Ahmad, N. Sanguinarine causes cell cyle blockade and apoptosis of human prostate carcinoma cells via modulation of cylin kinase inhibitor-cyclin-cyclin-dependent kinase machinery. Mol. Cancer Ther. 2004, 3, 933–940. [Google Scholar]
- Croaker, A.; King, G.J.; Pyne, J.H.; Anoopkumar-Dukie, S.; Liu, L. Sanguinaria canadensis: Traditional Medicine, Phytochemical Composition, Biological Activities and Current Uses. Int. J. Mol. Sci. 2016, 17, 1414. [Google Scholar] [CrossRef] [Green Version]
- Galadari, S.; Rahman, A.; Pallichankandy, S.; Thayyullathil, F. Molecular targets and anticancer potential of sanguinarine—a benzophenanthridine alkaloid. Phytomedicine 2017, 34, 143–153. [Google Scholar] [CrossRef]
- Ling, X.; Huang, L.; Li, Y.; Wan, Q.; Wang, Z.; Qin, A.; Gao, M.; Tang, B.Z. Photoactivatable dihydroalkaloids for cancer cell imaging and chemotherapy with high spatiotemporal resolution. Mater. Horiz. 2020, 7, 2696–2701. [Google Scholar] [CrossRef]
- Bonnet, S. Why develop photoactivated chemotherapy? Dalton Trans. 2018, 47, 10330–10343. [Google Scholar] [CrossRef]
- Slunská, Z.; Gelnarová, E.; Hammerová, J.; Táborská, E.; Slaninová, I. Effect of quaternary benzo[c]phenanthridine alkaloids sanguilutine and chelilutine on normal and cancer cells. Toxicol. Vitr. 2010, 24, 697–706. [Google Scholar] [CrossRef] [PubMed]
- Malíková, J.; Zdařilová, A.; Hlobilková, A.; Ulrichová, J. The effect of chelerythrine on cell growth, apoptosis, and cell cycle in human normal and cancer cells in comparison with sanguinarine. Cell Biol. Toxicol. 2006, 22, 439–453. [Google Scholar] [CrossRef]
- Dvorak, Z.; Simanek, V. Metabolism of Sanguinarine: The Facts and The Myths. Curr. Drug Metab. 2007, 8, 173–176. [Google Scholar] [CrossRef] [PubMed]
- Maiti, M.; Nandi, R.; Chaudhuri, K. Sanguinarine: A monofunctional intercalating alkaloid. FEBS Lett. 1982, 142, 280–284. [Google Scholar] [CrossRef] [Green Version]
- Hossain, M.; Kumar, G.S. DNA binding of benzophenanthridine compounds sanguinarine versus ethidium: Comparative binding and thermodynamic profile of intercalation. J. Chem. Thermodyn. 2009, 41, 764–774. [Google Scholar] [CrossRef]
- Bajaj, N.P.S.; McLean, M.J.; Waring, M.J.; Smekal, E. Sequence-selective, pH-dependent binding to DNA of benzophenanthridine alkaloids. J. Mol. Recognit. 1990, 3, 48–54. [Google Scholar] [CrossRef]
- Sen, A.; Ray, A.; Maiti, M. Thermodynamics of the interactions of sanguinarine with DNA: Influence of ionic strength and base composition. Biophys. Chem. 1996, 59, 155–170. [Google Scholar] [CrossRef]
- Bai, L.P.; Zhao, Z.Z.; Cai, Z.; Jiang, Z.H. DNA-binding affinities and sequence selectivity of quaternary benzophenanthridine alkaloids sanguinarine, chelerythrine, and nitidine. Bioorgan. Med. Chem. 2006, 14, 5439–5445. [Google Scholar] [CrossRef] [PubMed]
- An, Y.W.; Jin, H.T.; Yuan, B.; Wang, J.C.; Wang, C.; Liu, H.Q. Research progress of berberine mediated photodynamic therapy (Review). Oncol. Lett. 2021, 21, 1–10. [Google Scholar] [CrossRef]
- Warowicka, A.; Łukasz, P.; Grażyna, B.; Oskar, M.; Litowczenko, J.; Dorota, K.; Robert, N.; Stefan, J.; Anna, G.J. Protoberberine compounds extracted from Chelidonium majus L. as novel natural photosensitizers for cancer therapy. Phytomedicine 2019, 64, 152919. [Google Scholar] [CrossRef]
- Arnason, J.T.; Guèrin, B.; Kraml, M.M.; Mehta, B.; Redmond, R.W.; Scaiano, J.C. Phototoxic and Photochemical Properties of Sanguinarine. Photochem. Photobiol. 1992, 55, 35–38. [Google Scholar] [CrossRef] [PubMed]
- Maiti, M.; Chatterjee, A. Production of singlet oxygen by sanguinarine and berberine. Curr. Sci. 1995, 68, 734–736. [Google Scholar]
- Agostinis, P.; Berg, K.; Cengel, K.A.; Foster, T.H.; Girotti, A.W.; Gollnick, S.O.; Hahn, S.M.; Hamblin, M.R.; Juzeniene, A.; Kessel, D.; et al. Photodynamic therapy of cancer: An update. CA. Cancer J. Clin. 2011, 61, 250–281. [Google Scholar] [CrossRef] [PubMed]
- Dąbrowski, J.M.; Arnaut, L.G. Photodynamic therapy (PDT) of cancer: From local to systemic treatment. Photochem. Photobiol. Sci. 2015, 14, 1765–1780. [Google Scholar] [CrossRef]
- Drew, H.R.; Wing, R.M.; Takano, T.; Broka, C.; Tanaka, S.; Itakura, K.; Dickerson, R.E. Structure of a B-DNA dodecamer: Conformation and dynamics. Proc. Natl. Acad. Sci. USA 1981, 78, 2179–2183. [Google Scholar] [CrossRef] [Green Version]
- Anandakrishnan, R.; Aguilar, B.; Onufriev, A.V. H++ 3.0: Automating pk prediction and the preparation of biomolecular structures for atomistic molecular modeling and simulations. Nucleic Acids Res. 2012, 40, W537. [Google Scholar] [CrossRef] [PubMed] [Green Version]
- Myers, J.; Grothaus, G.; Narayanan, S.; Onufriev, A. A simple clustering algorithm can be accurate enough for use in calculations of pKs in macromolecules. Proteins Struct. Funct. Genet. 2006, 63, 928–938. [Google Scholar] [CrossRef] [Green Version]
- Becke, A.D. Density-functional thermochemistry. III. The role of exact exchange. J. Chem. Phys. 1993, 98, 5648–5652. [Google Scholar] [CrossRef] [Green Version]
- Bauernschmitt, R.; Ahlrichs, R. Treatment of electronic excitations within the adiabatic approximation of time dependent density functional theory. Chem. Phys. Lett. 1996, 256, 454–464. [Google Scholar] [CrossRef]
- Frisch, M.J.; Trucks, G.W.; Schlegel, H.B.; Scuseria, G.E.; Robb, M.A.; Cheeseman, J.R.; Scalmani, G.; Barone, V.; Petersson, G.A.; Nakatsuji, H.; et al. G16_C01 2016, Gaussian 16, Revision C.01; Gaussian, Inc.: Wallingford, CT, USA, 2016. [Google Scholar]
- Bayly, C.I.; Cieplak, P.; Cornell, W.D.; Kollman, P.A. A well-behaved electrostatic potential based method using charge restraints for deriving atomic charges: The RESP model. J. Phys. Chem. 1993, 97, 10269–10280. [Google Scholar] [CrossRef]
- Wang, J.; Wolf, R.M.; Caldwell, J.W.; Kollman, P.A.; Case, D.A. Development and testing of a general Amber force field. J. Comput. Chem. 2004, 25, 1157–1174. [Google Scholar] [CrossRef]
- Case, A.D.; Betz, R.M.; Cerutti, D.S.; Cheatham, T.E.; Darden, T.A.; Duke, R.E.; Giese, T.J.; Gohlke, H.; Goetz, A.W..; Homeyer, N.; et al. AMBER; University of California: San Francisco, CA, USA, 2016. [Google Scholar]
- Ivani, I.; Dans, P.D.; Noy, A.; Pérez, A.; Faustino, I.; Hospital, A.; Walther, J.; Andrio, P.; Goñi, R.; Balaceanu, A.; et al. Parmbsc1: A refined force field for DNA simulations. Nat. Methods 2015, 13, 55–58. [Google Scholar] [CrossRef] [Green Version]
- Wang, J.; Wang, W.; Kollman, P.A.; Case, D.A. Automatic atom type and bond type perception in molecular mechanical calculations. J. Mol. Graph. Model. 2006, 25, 247–260. [Google Scholar] [CrossRef]
- Mahoney, M.W.; Jorgensen, W.L. Diffusion constant of the TIP5P model of liquid water. J. Chem. Phys. 2001, 114, 363–366. [Google Scholar] [CrossRef] [Green Version]
- Mahoney, M.W.; Jorgensen, W.L. A five-site model for liquid water and the reproduction of the density anomaly by rigid, nonpolarizable potential functions. J. Chem. Phys. 2000, 112, 8910–8922. [Google Scholar] [CrossRef]
- Jorgensen, W.L.; Chandrasekhar, J.; Madura, J.D.; Impey, R.W.; Klein, M.L. Comparison of simple potential functions for simulating liquid water. J. Chem. Phys. 1983, 79, 926–935. [Google Scholar] [CrossRef]
- Miller, B.R.; McGee, T.D.; Swails, J.M.; Homeyer, N.; Gohlke, H.; Roitberg, A.E. MMPBSA.py: An efficient program for end-state free energy calculations. J. Chem. Theory Comput. 2012, 8, 3314–3321. [Google Scholar] [CrossRef] [PubMed]
- Roe, D.R.; Cheatham, T.E. PTRAJ and CPPTRAJ: Software for processing and analysis of molecular dynamics trajectory data. J. Chem. Theory Comput. 2013, 9, 3084–3095. [Google Scholar] [CrossRef]
- Grimme, S.; Antony, J.; Ehrlich, S.; Krieg, H. A consistent and accurate ab initio parametrization of density functional dispersion correction (DFT-D) for the 94 elements H-Pu. J. Chem. Phys. 2010, 132, 154104. [Google Scholar] [CrossRef] [Green Version]
- Fukui, K. The Path of Chemical Reactions—The IRC Approach. Acc. Chem. Res. 1981, 14, 363–368. [Google Scholar] [CrossRef]
- Gonzalez, C.; Bernhard Schlegel, H. An improved algorithm for reaction path following. J. Chem. Phys. 1989, 90, 2154–2161. [Google Scholar] [CrossRef]
- Tomasi, J.; Mennucci, B.; Cammi, R. Quantum mechanical continuum solvation models. Chem. Rev. 2005, 105, 2999–3093. [Google Scholar] [CrossRef] [PubMed]
- McQuarrie, D.A.; Simon, J.D. Molecular Thermodynamics; University Science Books: Sausalito, CA, USA, 1999; Volume 17, ISBN 978-1891389054. [Google Scholar]
- Yanai, T.; Tew, D.P.; Handy, N.C. A new hybrid exchange-correlation functional using the Coulomb-attenuating method (CAM-B3LYP). Chem. Phys. Lett. 2004, 393, 51–57. [Google Scholar] [CrossRef] [Green Version]
- Zhao, Y.; Truhlar, D.G. A new local density functional for main-group thermochemistry, transition metal bonding, thermochemical kinetics, and noncovalent interactions. J. Chem. Phys. 2006, 125, 194101. [Google Scholar] [CrossRef] [Green Version]
- Perdew, J.P.; Burke, K.; Ernzerhof, M. Generalized gradient approximation made simple. Phys. Rev. Lett. 1996, 77, 3865–3868. [Google Scholar] [CrossRef] [PubMed] [Green Version]
- Perdew, J.P. Density-functional approximation for the correlation energy of the inhomogeneous electron gas. Phys. Rev. B 1986, 33, 8822–8824. [Google Scholar] [CrossRef] [PubMed]
- Da Chai, J.; Head-Gordon, M. Long-range corrected hybrid density functionals with damped atom-atom dispersion corrections. Phys. Chem. Chem. Phys. 2008, 10, 6615–6620. [Google Scholar] [CrossRef] [PubMed] [Green Version]
- Burke, K.; Perdew, J.P.; Wang, Y. Derivation of a Generalized Gradient Approximation: The PW91 Density Functional. In Electronic Density Functional Theory; Springer: Boston, MA, USA, 1998; pp. 81–111. [Google Scholar]
- Neese, F. The ORCA program system. Wiley Interdiscip. Rev. Comput. Mol. Sci. 2012, 2, 73–78. [Google Scholar] [CrossRef]
- Neese, F. Software update: The ORCA program system, version 4.0. Wiley Interdiscip. Rev. Comput. Mol. Sci. 2018, 8, e1327. [Google Scholar] [CrossRef]
- Aidas, K.; Angeli, C.; Bak, K.L.; Bakken, V.; Bast, R.; Boman, L.; Christiansen, O.; Cimiraglia, R.; Coriani, S.; Dahle, P.; et al. The Dalton quantum chemistry program system: The Dalton program. Wiley Interdiscip. Rev. Comput. Mol. Sci. 2014, 4, 269–284. [Google Scholar] [CrossRef]
- Kumar, G.S.; Hazra, S. Sanguinarine, a promising anticancer therapeutic: Photochemical and nucleic acid binding properties. RSC Adv. 2014, 4, 56518–56531. [Google Scholar] [CrossRef]
- Alberto, M.E.; Marino, T.; Quartarolo, A.D.; Russo, N. Photophysical origin of the reduced photodynamic therapy activity of temocene compared to Foscan®: Insights from theory. Phys. Chem. Chem. Phys. 2013, 15, 16167–16171. [Google Scholar] [CrossRef]
- Robbins, E.; Leroy-Lhez, S.; Villandier, N.; Samoć, M.; Matczyszyn, K. Prospects for More Efficient Multi-Photon Absorption Photosensitizers Exhibiting Both Reactive Oxygen Species Generation and Luminescence. Molecules 2021, 26, 6323. [Google Scholar] [CrossRef]
- Maiti, M.; Nandi, R.; Chaudhuri, K. The Effect of pH on the Absoprtion and Fluorescence Spectra of Sanguinarine. Photochem. Photobiol. 1983, 38, 245–249. [Google Scholar] [CrossRef]
- Maiti, M.; Kumar, G.S. Biophysical aspects and biological implications of the interaction of benzophenanthridine alkaloids with DNA. Biophys. Rev. 2009, 1, 119–129. [Google Scholar] [CrossRef] [Green Version]
- Sen, A.; Maiti, M. Interaction of sanguinarine iminium and alkanolamine form with calf thymus DNA. Biochem. Pharmacol. 1994, 48, 2097–2102. [Google Scholar] [CrossRef]
- D’Amico, M.L.; Paiotta, V.; Secco, F.; Venturini, M. A kinetic study of the intercalation of ethidium bromide into Poly(A)·Poly(U). J. Phys. Chem. B 2002, 106, 12635–12641. [Google Scholar] [CrossRef]
- Scoditti, S.; Dabbish, E.; Russo, N.; Mazzone, G.; Sicilia, E. Anticancer Activity, DNA Binding, and Photodynamic Properties of a N^C^N-Coordinated Pt(II) Complex. Inorg. Chem. 2021, 60, 10350–10360. [Google Scholar] [CrossRef]
- Dabbish, E.; Russo, N.; Sicilia, E. Rationalization of the Superior Anticancer Activity of Phenanthriplatin: An In-Depth Computational Exploration. Chem. Eur. J. 2020, 26, 259–268. [Google Scholar] [CrossRef] [Green Version]
- Scoditti, S.; Dabbish, E.; Sicilia, E. Is the cytotoxic activity of phenanthriplatin dependent on the specific size of the phenanthridine ligand π system? J. Inorg. Biochem. 2021, 219, 111447. [Google Scholar] [CrossRef] [PubMed]
- Biver, T. Use of UV-vis spectrometry to gain information on the mode of binding of small molecules to DNAs and RNAs. Appl. Spectrosc. Rev. 2012, 47, 272–325. [Google Scholar] [CrossRef]


Publisher’s Note: MDPI stays neutral with regard to jurisdictional claims in published maps and institutional affiliations. |
© 2022 by the authors. Licensee MDPI, Basel, Switzerland. This article is an open access article distributed under the terms and conditions of the Creative Commons Attribution (CC BY) license (https://creativecommons.org/licenses/by/4.0/).