Article

A Simple Analysis Method of Specific Anammox Activity Using a Respirometer

1
Institute for Environment and Energy, Pusan National University, Busan 46241, Korea
2
Department of Civil and Environmental Engineering, Pusan National University, Busan 46241, Korea
3
Disaster Scientific Investigation Division, National Disaster Management Research Institute, Ulsan 44538, Korea
*
Author to whom correspondence should be addressed.
Appl. Sci. 2022, 12(3), 1121; https://doi.org/10.3390/app12031121
Submission received: 12 December 2021 / Revised: 18 January 2022 / Accepted: 19 January 2022 / Published: 21 January 2022
(This article belongs to the Special Issue Wastewater Treatment Technologies)

Abstract

:
Anaerobic ammonium oxidation (anammox) is a biological nitrogen removal process with attractive prospects, such as no carbon addition, less aeration, lower greenhouse gas generation, and lower sludge production. However, it is difficult to maintain a stable anammox process since the anammox bacteria have a slow growth rate and high sensitivity to many factors. Therefore, it is very important to analyze and maintain the anammox activity as a process indicator for its successful operation. The conventional method for measuring the concentration of nitrogen compounds, such as ammonium, nitrite, or nitrogen gas is inconvenient during the reaction time for specific anammox activity (SAA) analysis, which can result in an inaccurately determined SAA due to the substrate loss and temperature change. In this study, a respirometer was utilized to analyze the SAA. The SAA values from a respirometer (rSAA) showed a similar pattern to the SAA values (mSAA) from the conventional method. All of the SAA analyses showed the highest value at 35 °C with a granule size of <1 mm. Statistical analysis showed no significant differences regardless of the analysis method, since the p-values for the t-test and Wilcoxon rank-sum test were >0.05. Therefore, the respirometer can be used as a simple and efficient tool for SAA analysis. Moreover, the operating maintenance and management of the anammox process can be improved due to the simple SAA analysis in the field.

1. Introduction

The anaerobic ammonium oxidation (anammox) process has several advantages over the conventional nitrification–denitrification process, such as no carbon addition requirements, less aeration, lower greenhouse gas generation, and lower sludge production [1,2]. However, a stable performance is difficult to maintain since the anammox bacteria have a slow growth rate and are highly sensitive to environmental conditions, such as substrate concentration, granule size, organic matter, temperature, etc. [1,3]. Therefore, it is essential to maintain a sufficient amount of anammox biomass in the reactors for successful operation. As a result, measurements of the anammox activity can indicate the parameters of the stable process operation since they identify the inhibitory effects on anammox bacteria from various factors.
In general, the anammox activity is expressed as a specific anammox activity (SAA). It can be determined based on the amount of ammonium (gNH4+/gVSS/day) and nitrite (gNO2/gVSS/day) consumed or the amount of nitrogen gas produced (gN2/gVSS/day) per biomass concentration over the reaction time, as shown in the following stoichiometry relationship (Equation (1)) [4]. Numerous studies analyzed the SAA to examine the effects of various environmental factors, such as zinc [5], sludge type [6], temperature, and pH [5] or salt [7] on the anammox process. However, measuring the concentrations of nitrogen compounds, such as ammonium, nitrite or nitrogen gas is inconvenient during the reaction time for the SAA analysis, which can result in an inaccurately determined SAA due to the substrate loss and temperature change.
NH4+ + 1.32NO2 + 0.066HCO3 + 0.13H+ → 1.02N2 + 0.26NO3 + 0.066CH2O0.5N0.15 + 2.03H2O
The respirometer is a device that analyzes the microbial activity simply and rapidly by in situ measurements of the gas consumed or produced from the respiration of microbes [8]. Numerous studies have made use of respirometers to evaluate the activity of iron-and sulfide-oxidizing bacteria [9,10], sulfur-oxidizing bacteria [11], thermophilic bioleaching archaea [12], hydrogen-producing bacteria [13], soil bacteria [14], activated sludge [15,16], anaerobic sludge [17], marine bacteria [18], and sediment [19]. These results can be used for wastewater treatment operation and management [20]. In addition, SAA can be measured using a respirometer since anammox bacteria produce nitrogen gas from ammonium and nitrite. However, to the best of our knowledge, there are little reports of SAA analysis using a respirometer.
This study evaluated a simple method for the determination of SAA using a respirometer and applied it to investigate the effects of granule size and temperature on the SAA. These results were compared with the SAA results of conventional analysis methods, providing readers with comprehensive and useful reference information for SAA analysis using a respirometer.

2. Materials and Methods

2.1. Anammox Granules
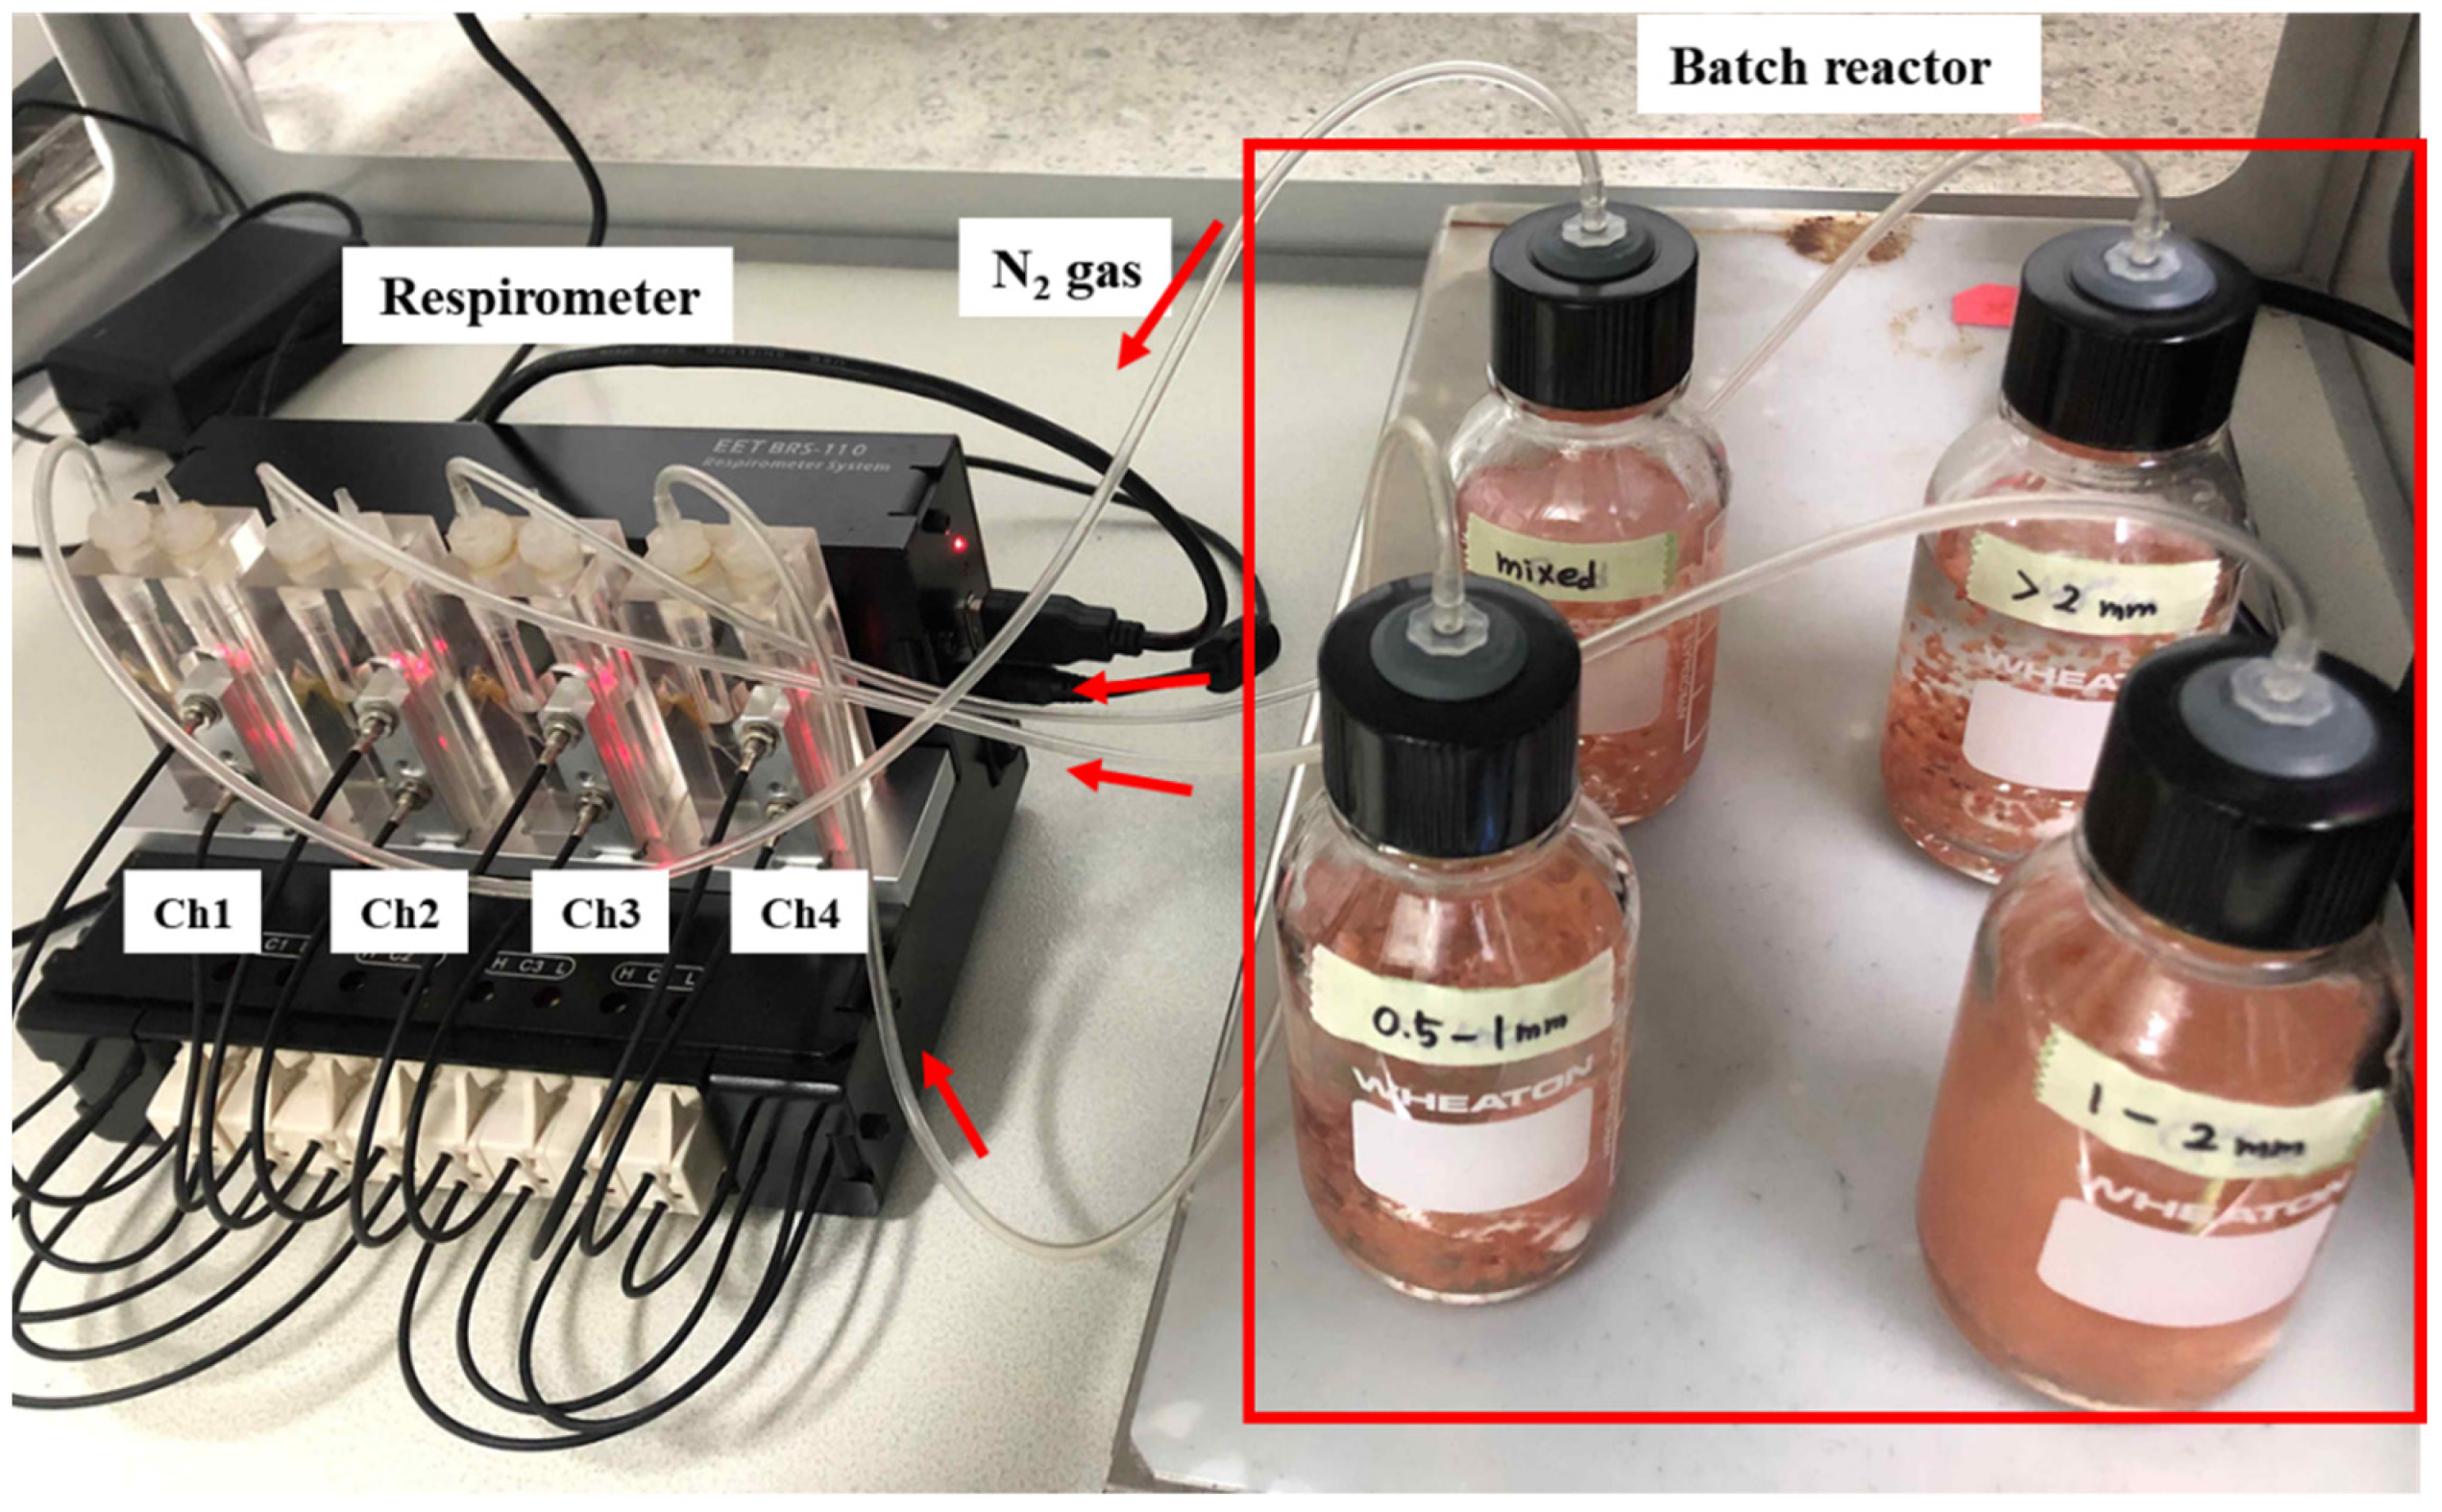
Anammox granules of the laboratory-scale anammox cultivation reactor (working volume 36 L), which has been operating with 200 mgNH4+-N and 200 mgNO2-N/L were used in this study. This reactor was operated in a continuous stirred mode under 8–10 h of HRT. A nitrogen removal efficiency of approximately 85% and nitrogen removal rate of 0.82–1.02 kg/m3/day were achieved. Moreover, the granules were enriched with uncultured anammox bacterium (68.1%), Ca. Brocadia (8.6%), Ca. Jettenia (1.9%), and Ca. Kuenenia (2.6%).

2.2. Batch Test

A batch test was performed with a working volume of 36 L and was conducted in two steps. In step 1, the granules that were not classified by size were used. Additionally, gas production was measured until all of the reactions were completed to determine the optimal reaction time for SAA analysis using the respirometer (BRS-100, EETech Co., Chuncheon, Korea) (Figure 1). In step 2, the experiments were conducted according to the granule size (<1, 1–2, and >2 mm) and temperature (30, 35, and 40 °C). Moreover, the granules were separated using a sieve for each size.
Herein, N2 gas production was calculated using two methods based on the actual measured gas (ΔrN2) using a respirometer (Equation (2)). In addition, theoretical gas production (ΔmN2) was calculated from the actual consumed ammonium and nitrite concentrations based on the following stoichiometry equation (Equations (3) and (4)):
Δ r N 2 ( m o l N 2 / m i n ) = P · Δ N R · T · Δ t
Δ m N 2 ( m o l N 2 / m i n ) = 1.02 · ( n Δ A ) · V L M · Δ t   at   t h e   r e m o v e d   N O 2 N t h e   r e m o v e d   N H 4 + N 1.32
Δ m N 2 ( m o l N 2 / m i n ) = 1.02 · ( n Δ N i ) · V L M · Δ t   at   t h e   r e m o v e d   N O 2 N t h e   r e m o v e d   N H 4 + N < 1.32
where ΔN is the net increase in N2 gas volume (L) measured from a respirometer over the reaction time; Δt is the reaction time (min); R is the ideal gas coefficient (0.082 atm L/mol⋅K); T is the temperature (K); ΔA is NH4+-N removed (g/L) during the reaction time; P is pressure (1 atm); ΔNi is NO2-N removed (g/L) during the reaction time; P is pressure (1 atm); VL is the volume of liquid (0.1 L); M is the molecular weight of nitrogen gas (28 g/mol); and n is the N2 gas modifying factor based on the stoichiometry equation (Equation (1)), which is one when the ratio of removed NO2-N divided by the removed NH4+-N is ≥1.32, and 1.32 when the ratio of removed NO2-N divided by the removed NH4+-N is <1.32.
SAA was calculated from the N2 gas production rate divided by the biomass concentrations (gVSS/L) in the vial (Equations (5) and (6)):
rSAA   ( g N 2 / g V S S / d a y ) = Δ r N 2 · M · f XV L
mSAA   ( g N 2 / g V S S / d a y ) = Δ m N 2 · M · f XV L
where rSAA is the SAA calculated based on the N2 gas production rate using a respirometer; mSAA is the SAA calculated based on the N2 gas production rate from the actual removed ammonium and nitrite; X is the biomass concentration (gVSS/L); M is the molecular weight of nitrogen gas (28 g/mol); f is the time modifying factor (1440 min/day); and VL is the volume of liquid (0.1 L).
All of the batch experiments (3 gVSS/L) were performed in duplicate under a thermostatic chamber maintained at 35 ℃, except for step 2 (On-lab Co., Busan, Korea). The reactors were carried out under a complete mixing condition using a stirrer at 120 rpm. Before the experiments, each reactor was purged with argon gas for 10 min to remove the oxygen and ensure anaerobic conditions in the reactor. The composition of the medium was as follows: 100 mg/L NH4+-N, 100 mg/L NO2-N, 1.010 g/L NaHCO3, 0.055 g/L KH2PO4, 0.005 g/L CaCl2·5H2O, 0.5 g/L MgSO4·7H2O, 0.010 g/L FeSO4·7H2O, 0.005 g/L EDTA.

2.3. Analysis

The biomass concentration (gVSS/L) was analyzed according to the standard method (APHA, 2005). All of the liquid samples from each vial were filtered through 0.22 μm disposable filters (RephiQuik Syringe Filter, RephiLe Bioscience Ltd., Shanghai, China) and stored in microcentrifuge tubes prior to further analysis. Ammonium and nitrite were analyzed using a kit (Humas Co. Ltd., Daejeon, Korea) according to the standard method (APHA, 2005).
Statistical analysis was performed using R [21]. The significance of the differences between rSAA and mSAA was evaluated by comparing the p-values of the t-test and Wilcoxon rank-sum test following the Shapiro–Wilk normality test (p-value < 0.05).

3. Results and Discussion

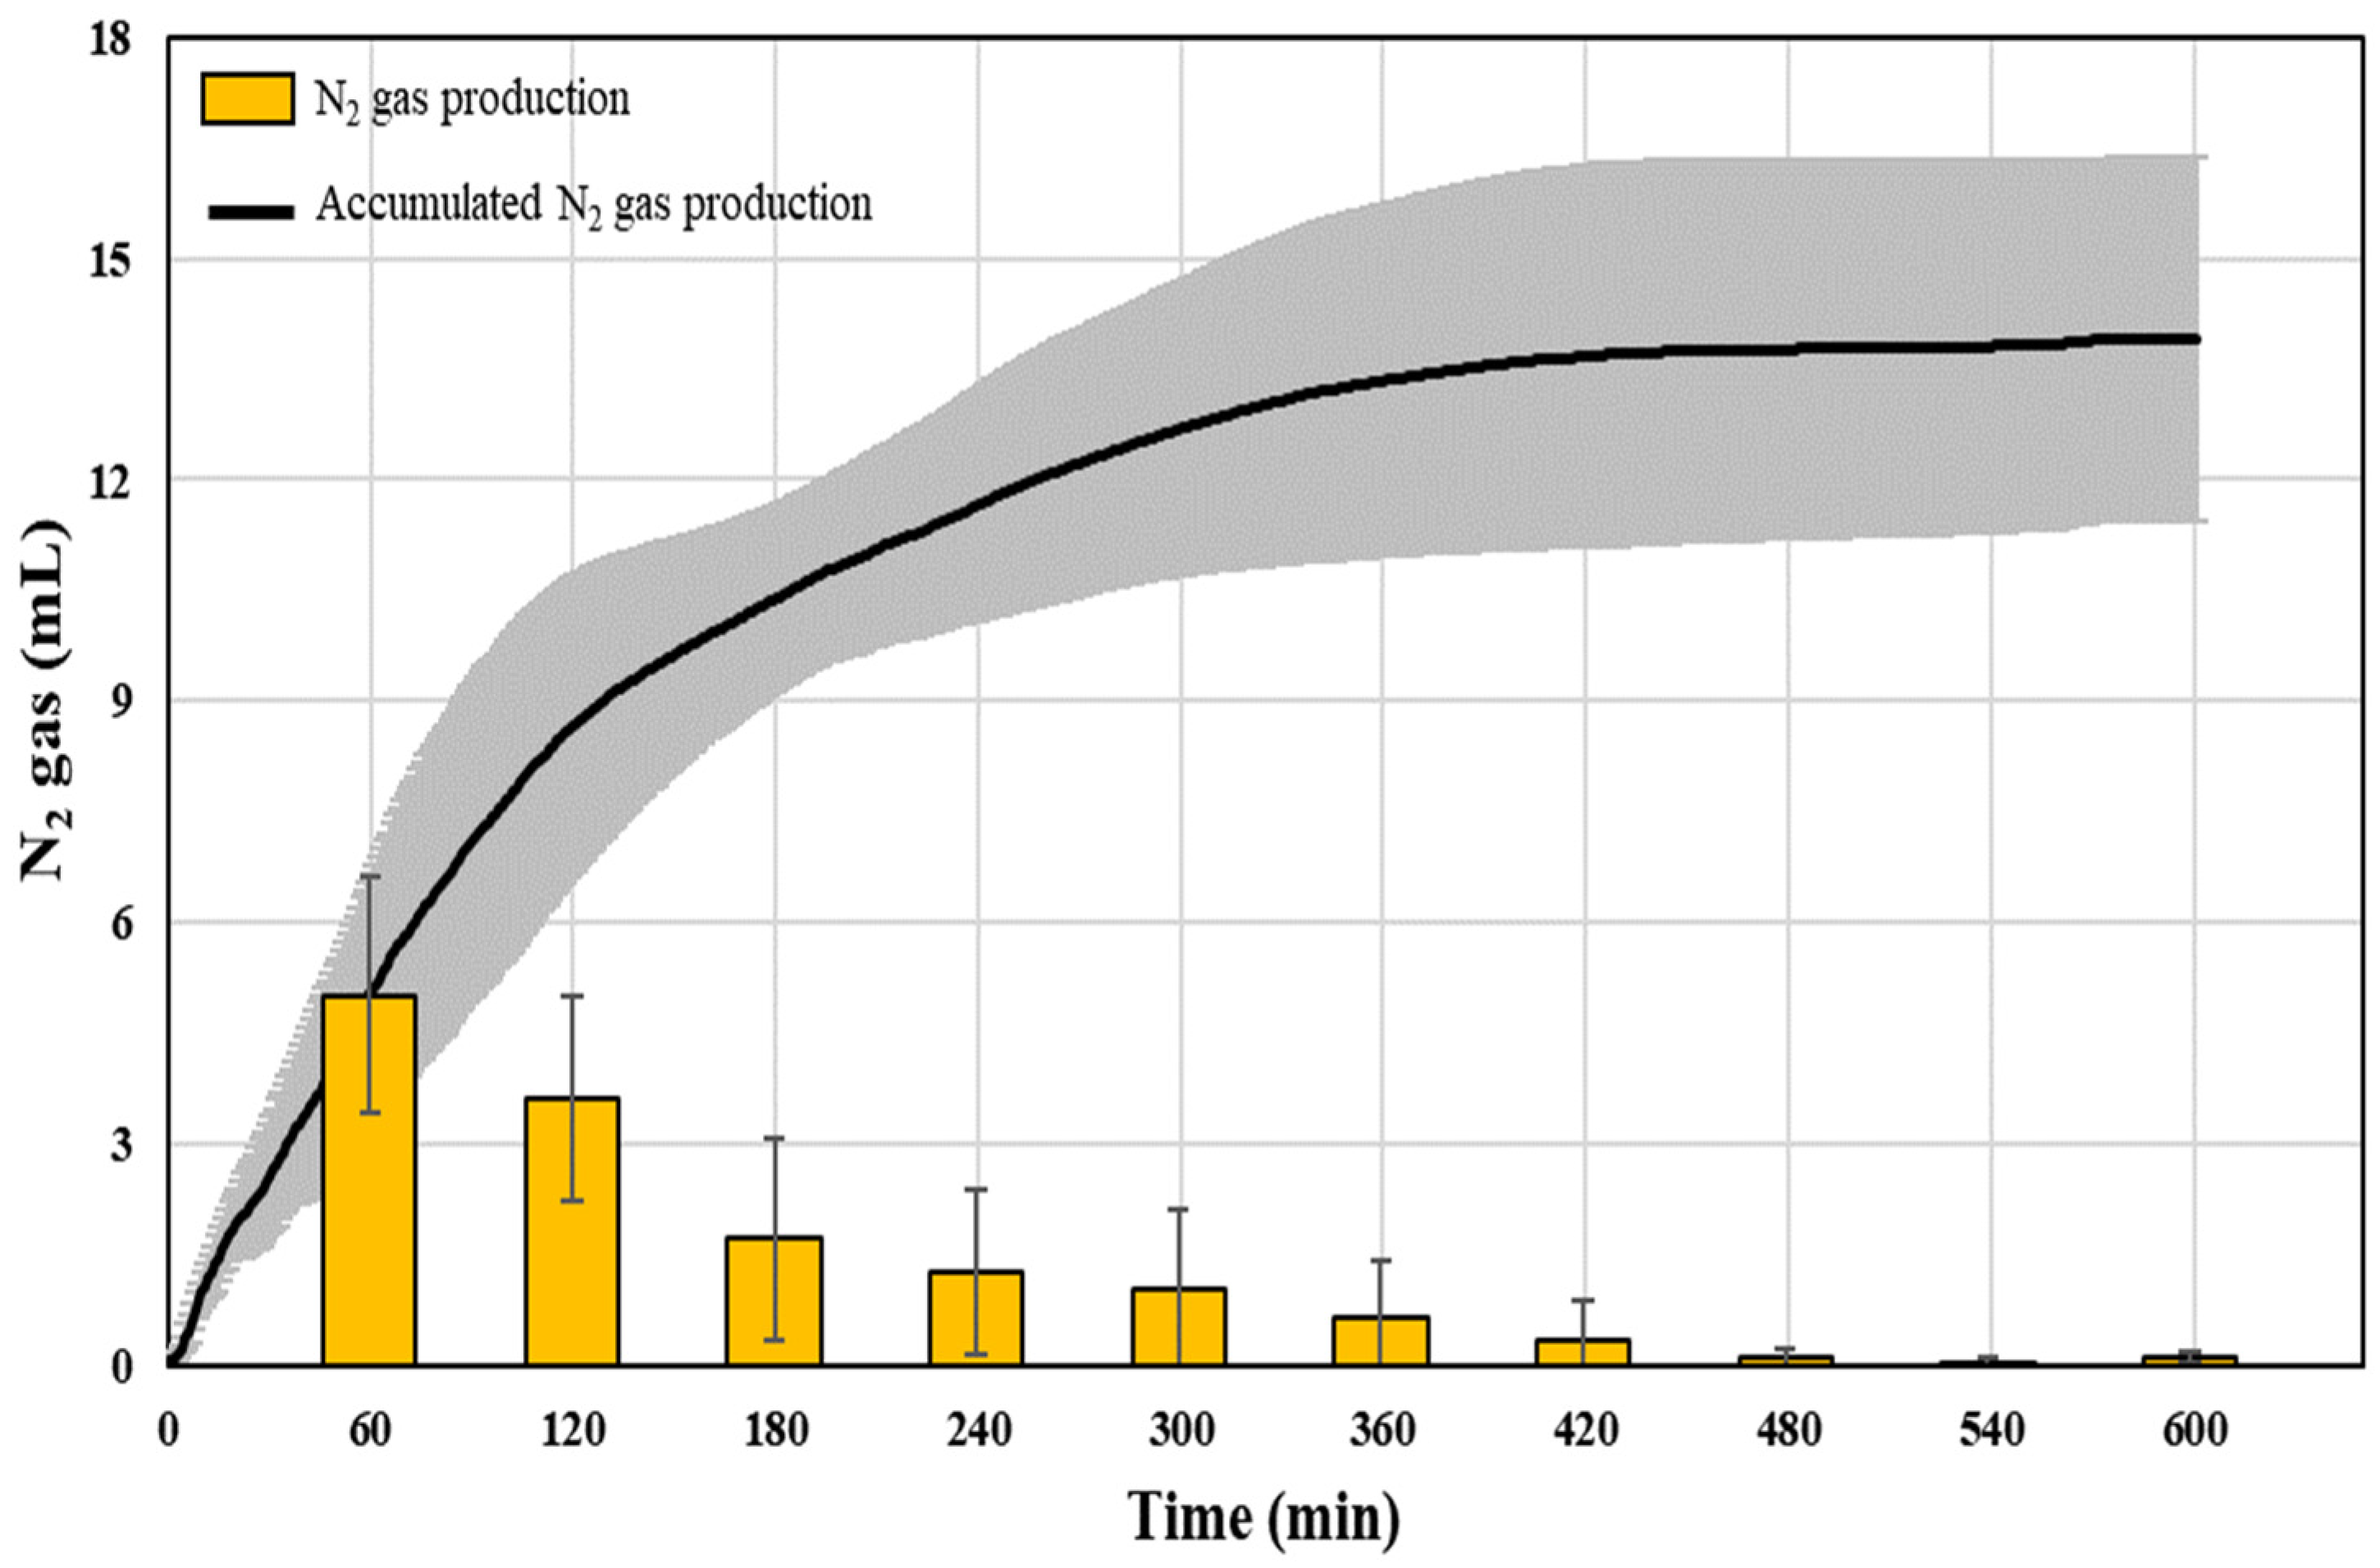
3.1. Changes in N2 Gas Production and rSAA According to the Reaction Time

An investigation of N2 gas production was conducted until the end of the reaction to determine the saturation point for SAA using a respirometer for the measurement of N2 gas production (Figure 2). In this case, the accumulated N2 gas production increased until 360 min and remained unchanged until the end of the reaction (saturated point).
The SAA varied depending on the reaction time, as shown in Table 1. The maximum rSAA (0.449 gN2/gVSS/day) and minimum rSAA (0.111 gN2/gVSS/day) were observed at 60 min and the end of the reaction (600 min), respectively. At the saturation point (360 min), rSAA (0.197 gN2/gVSS/day) was approximately 40% of the maximum rSAA.
These results showed that the SAA value could be easily calculated from the amount of biogas produced using a respirometer until the reaction was completed without analyzing the nitrogen compounds.

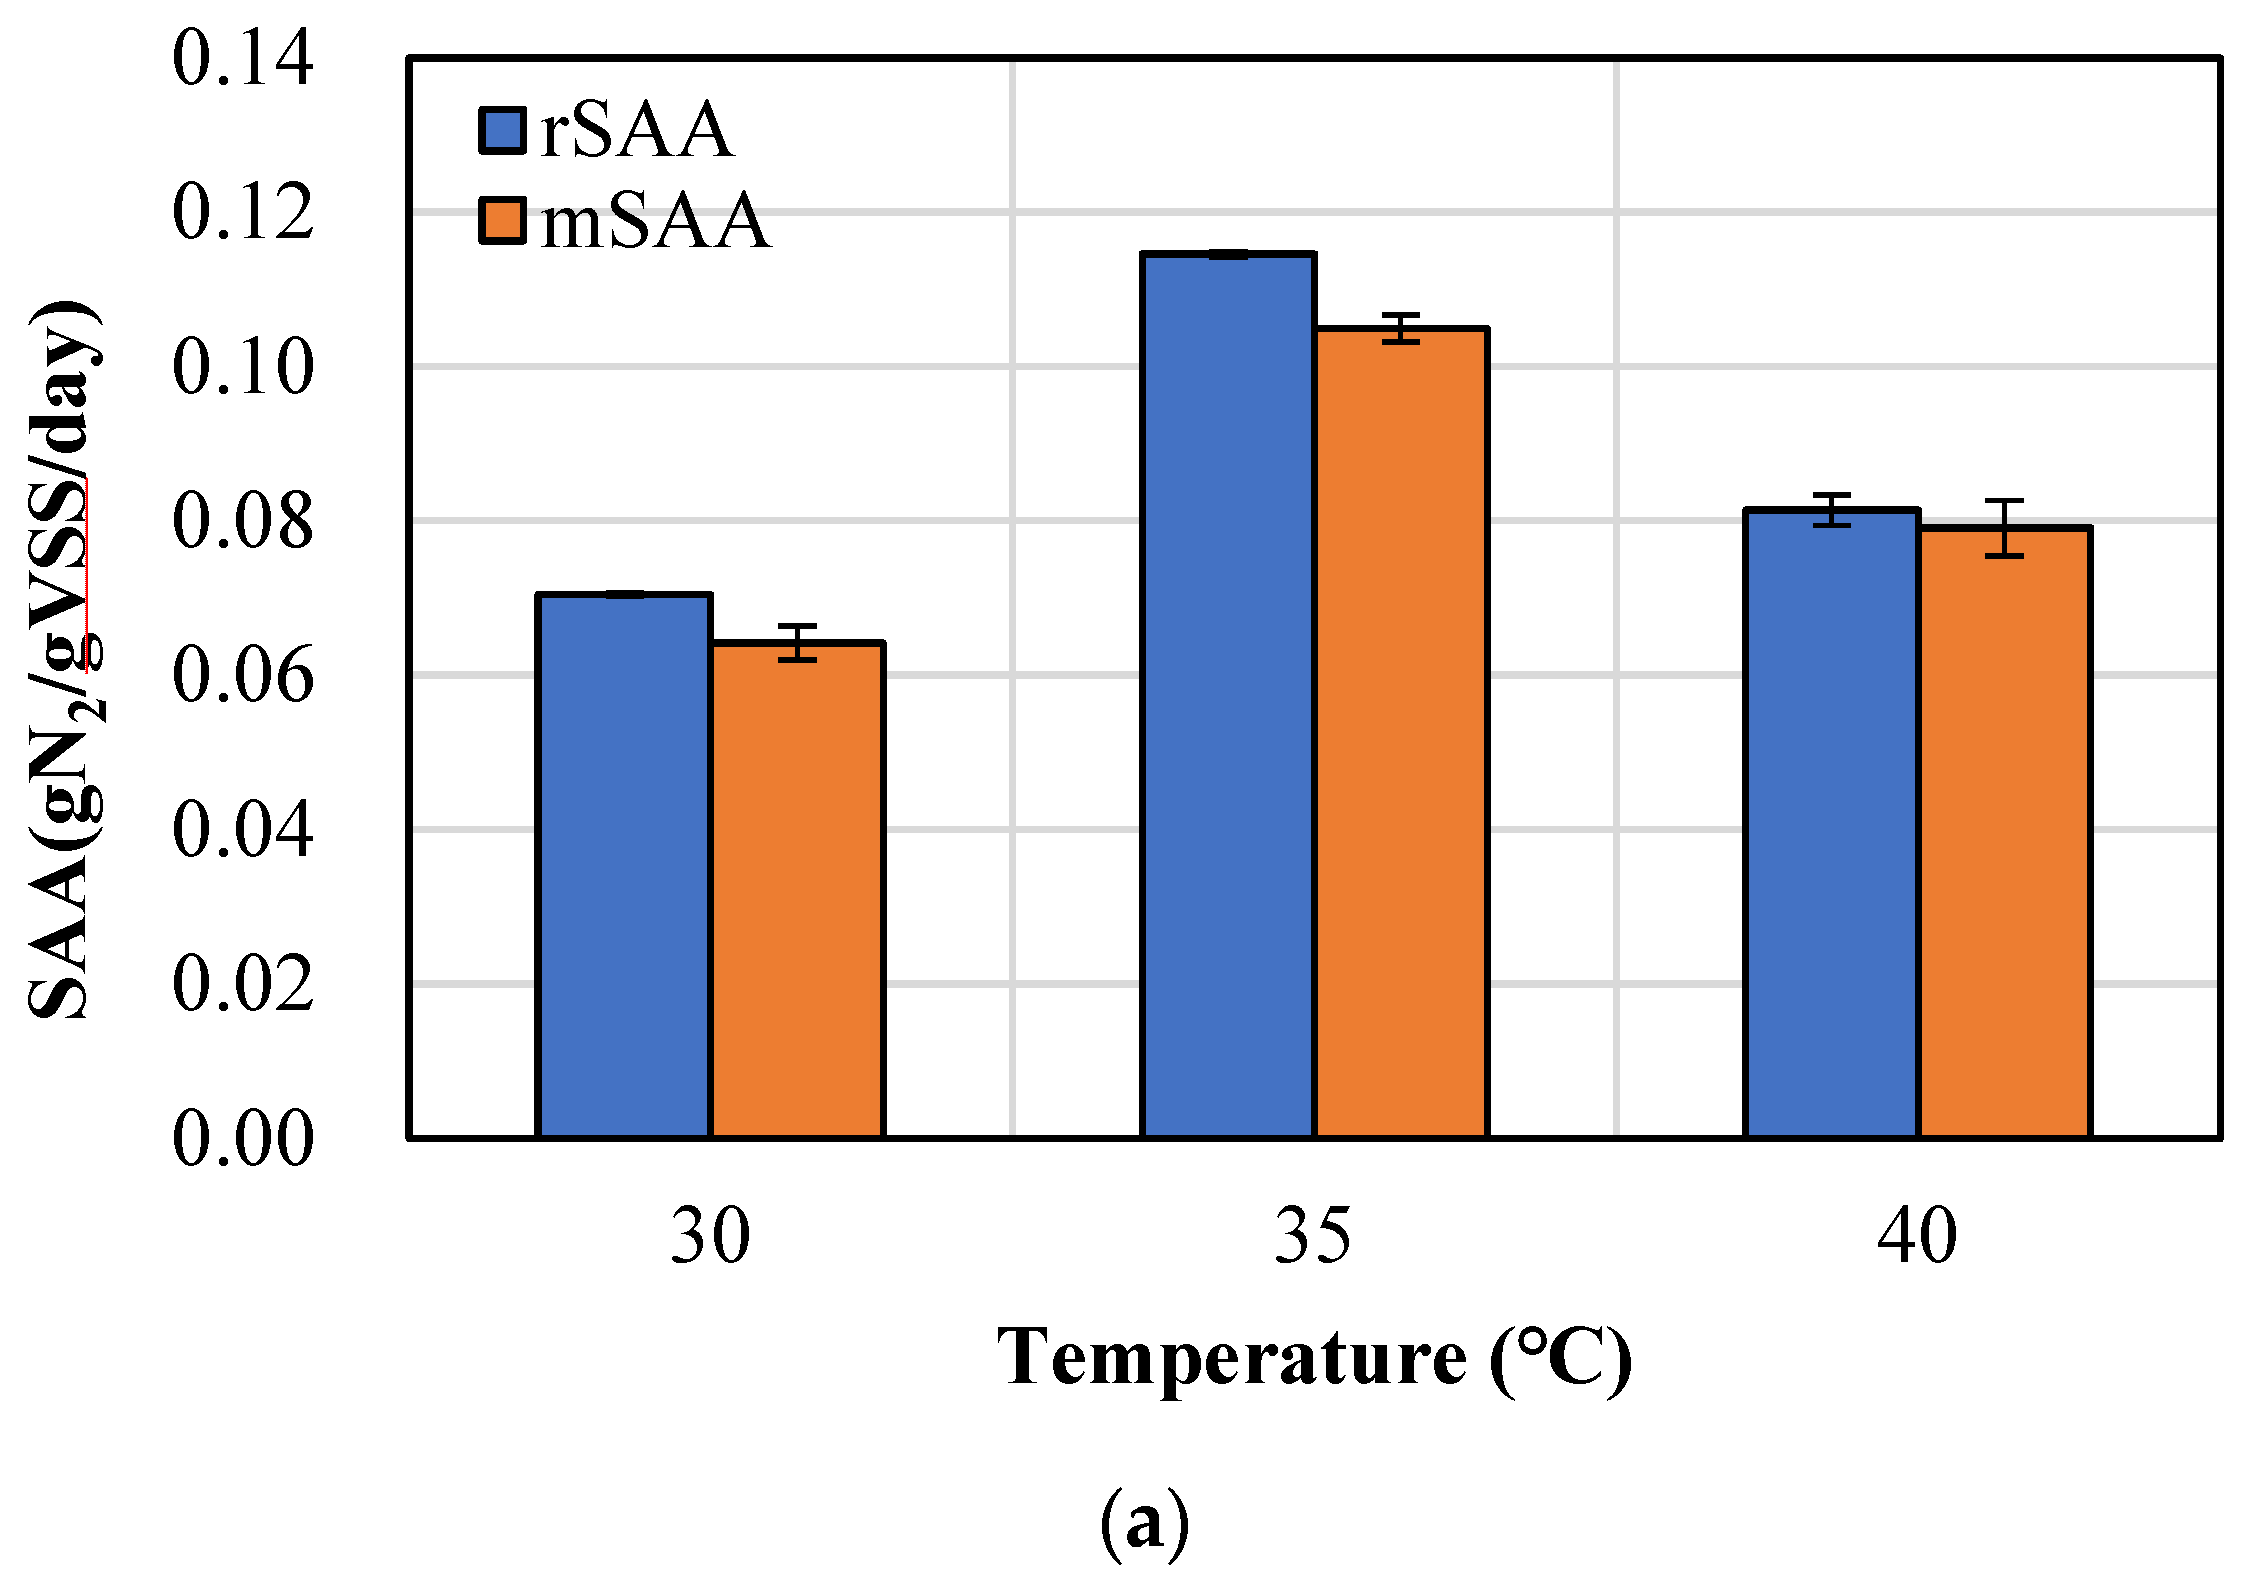
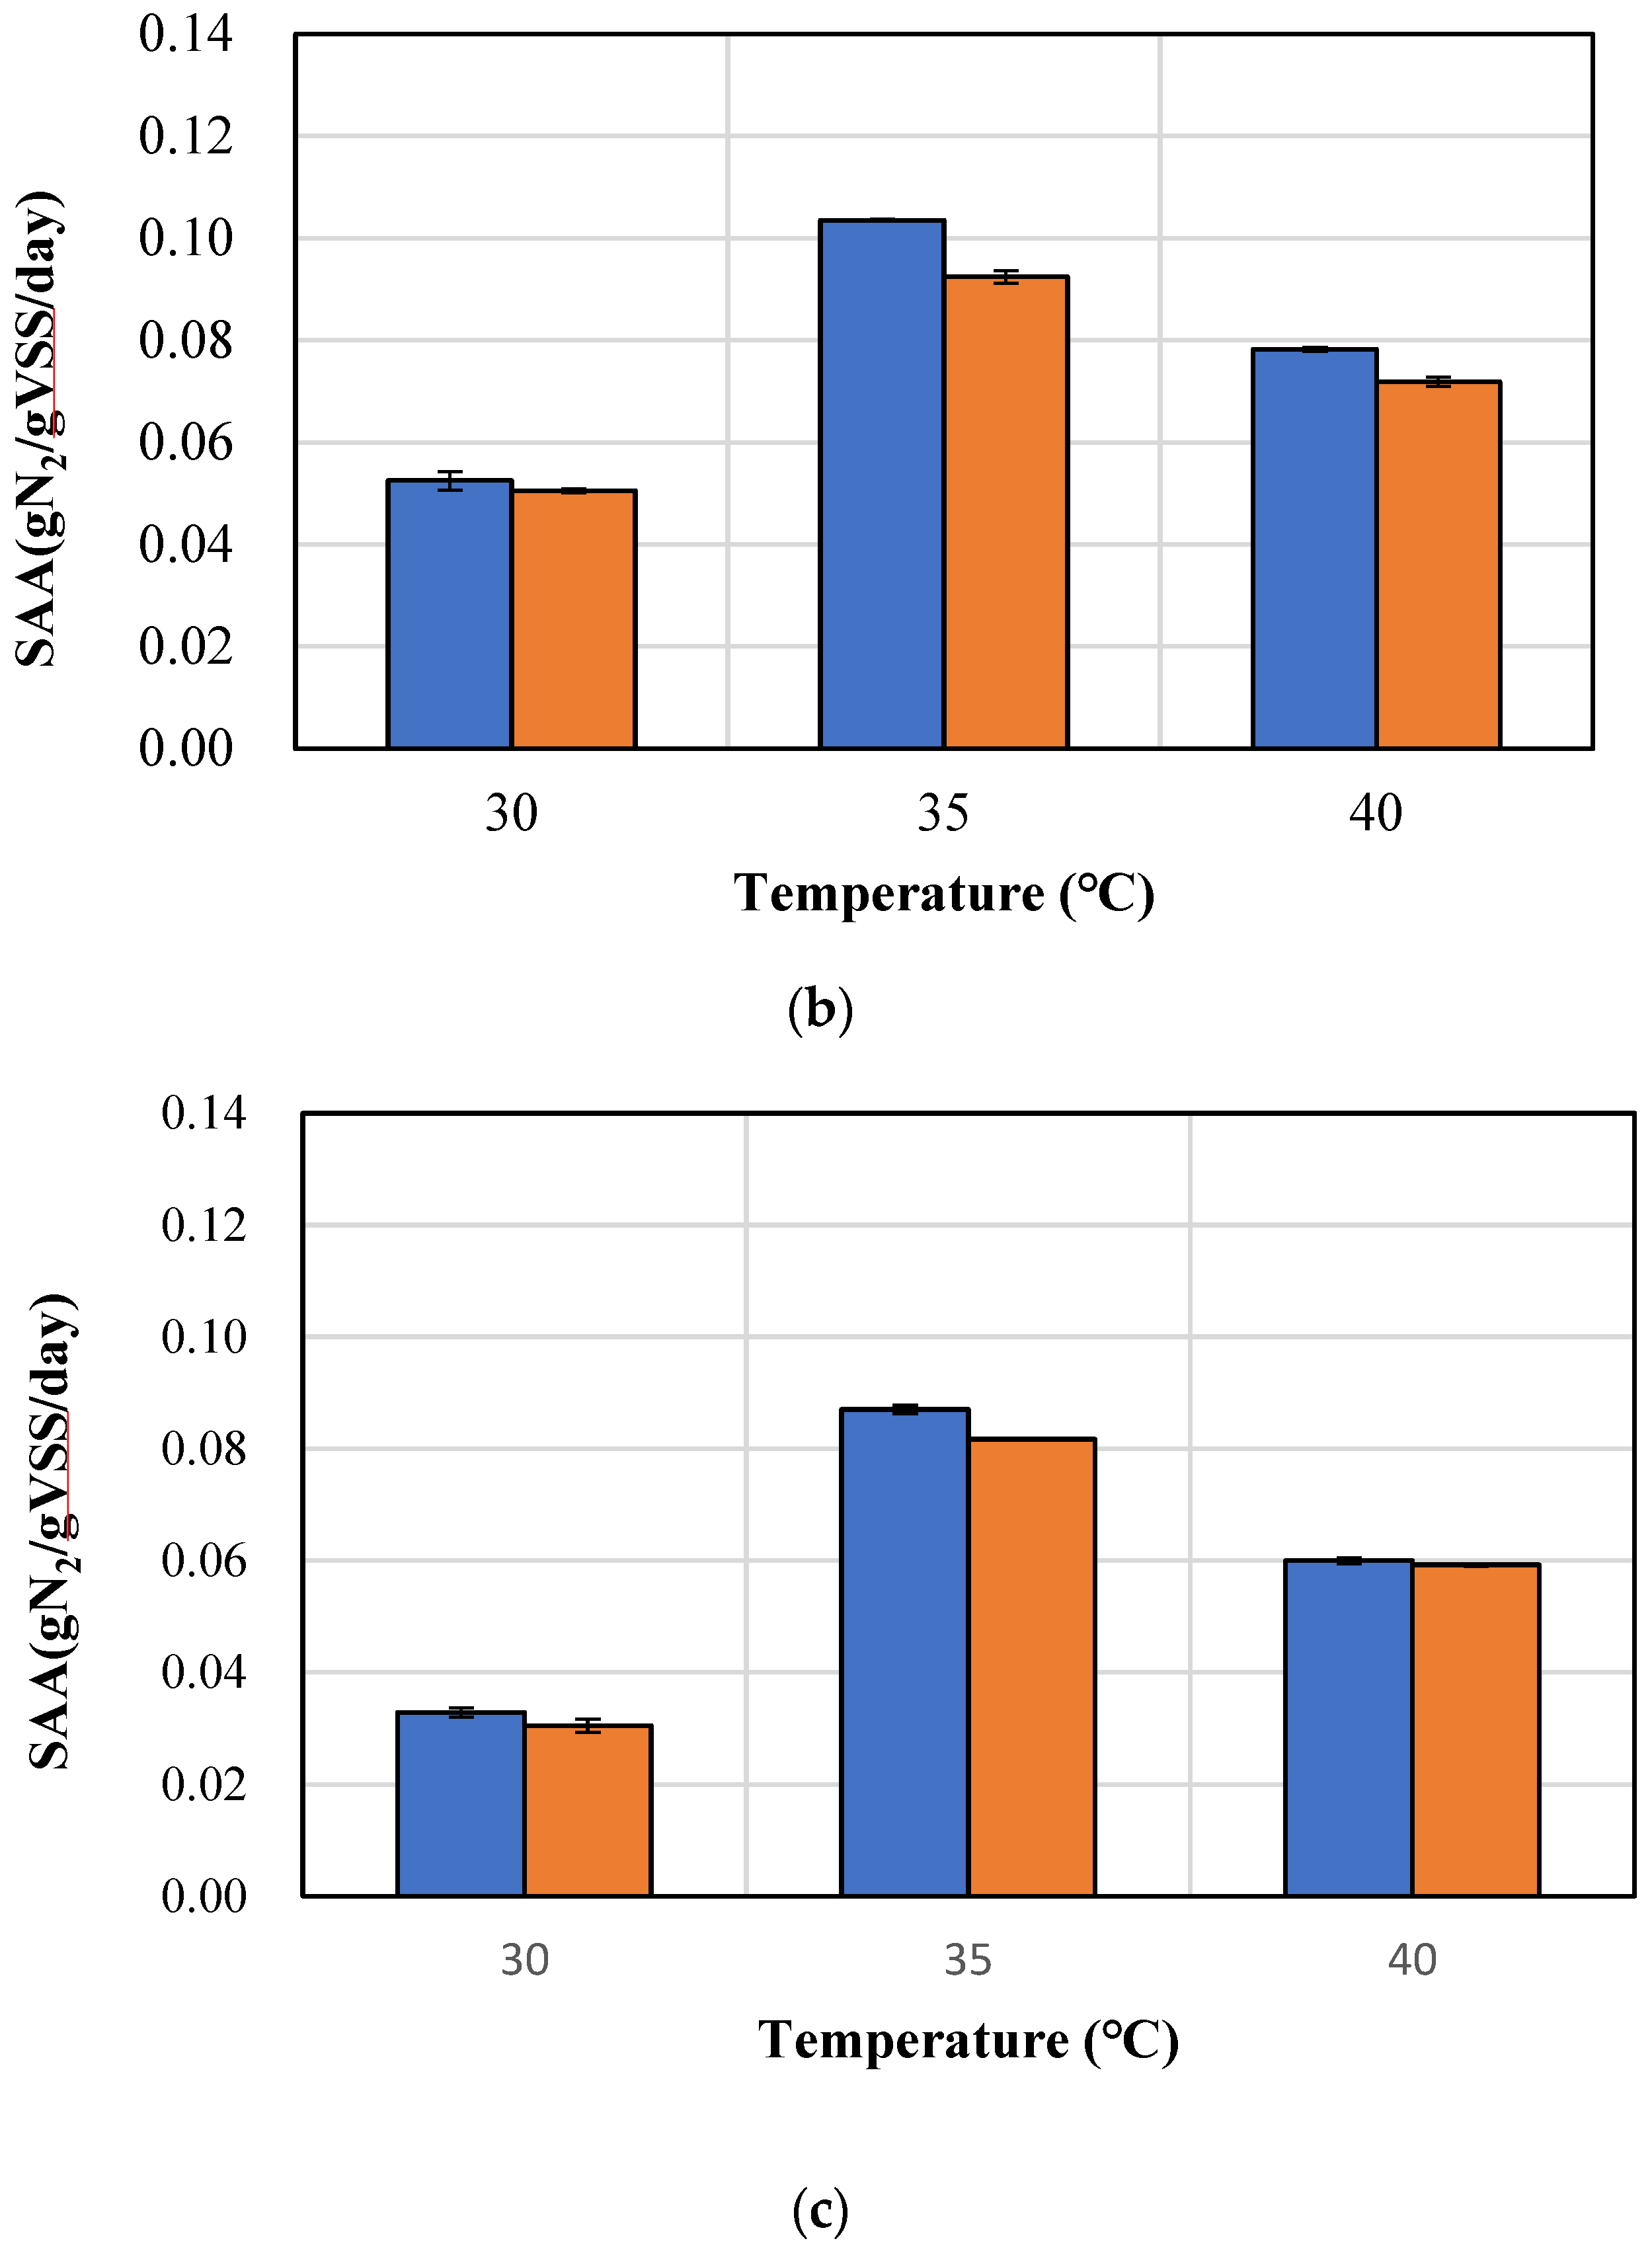
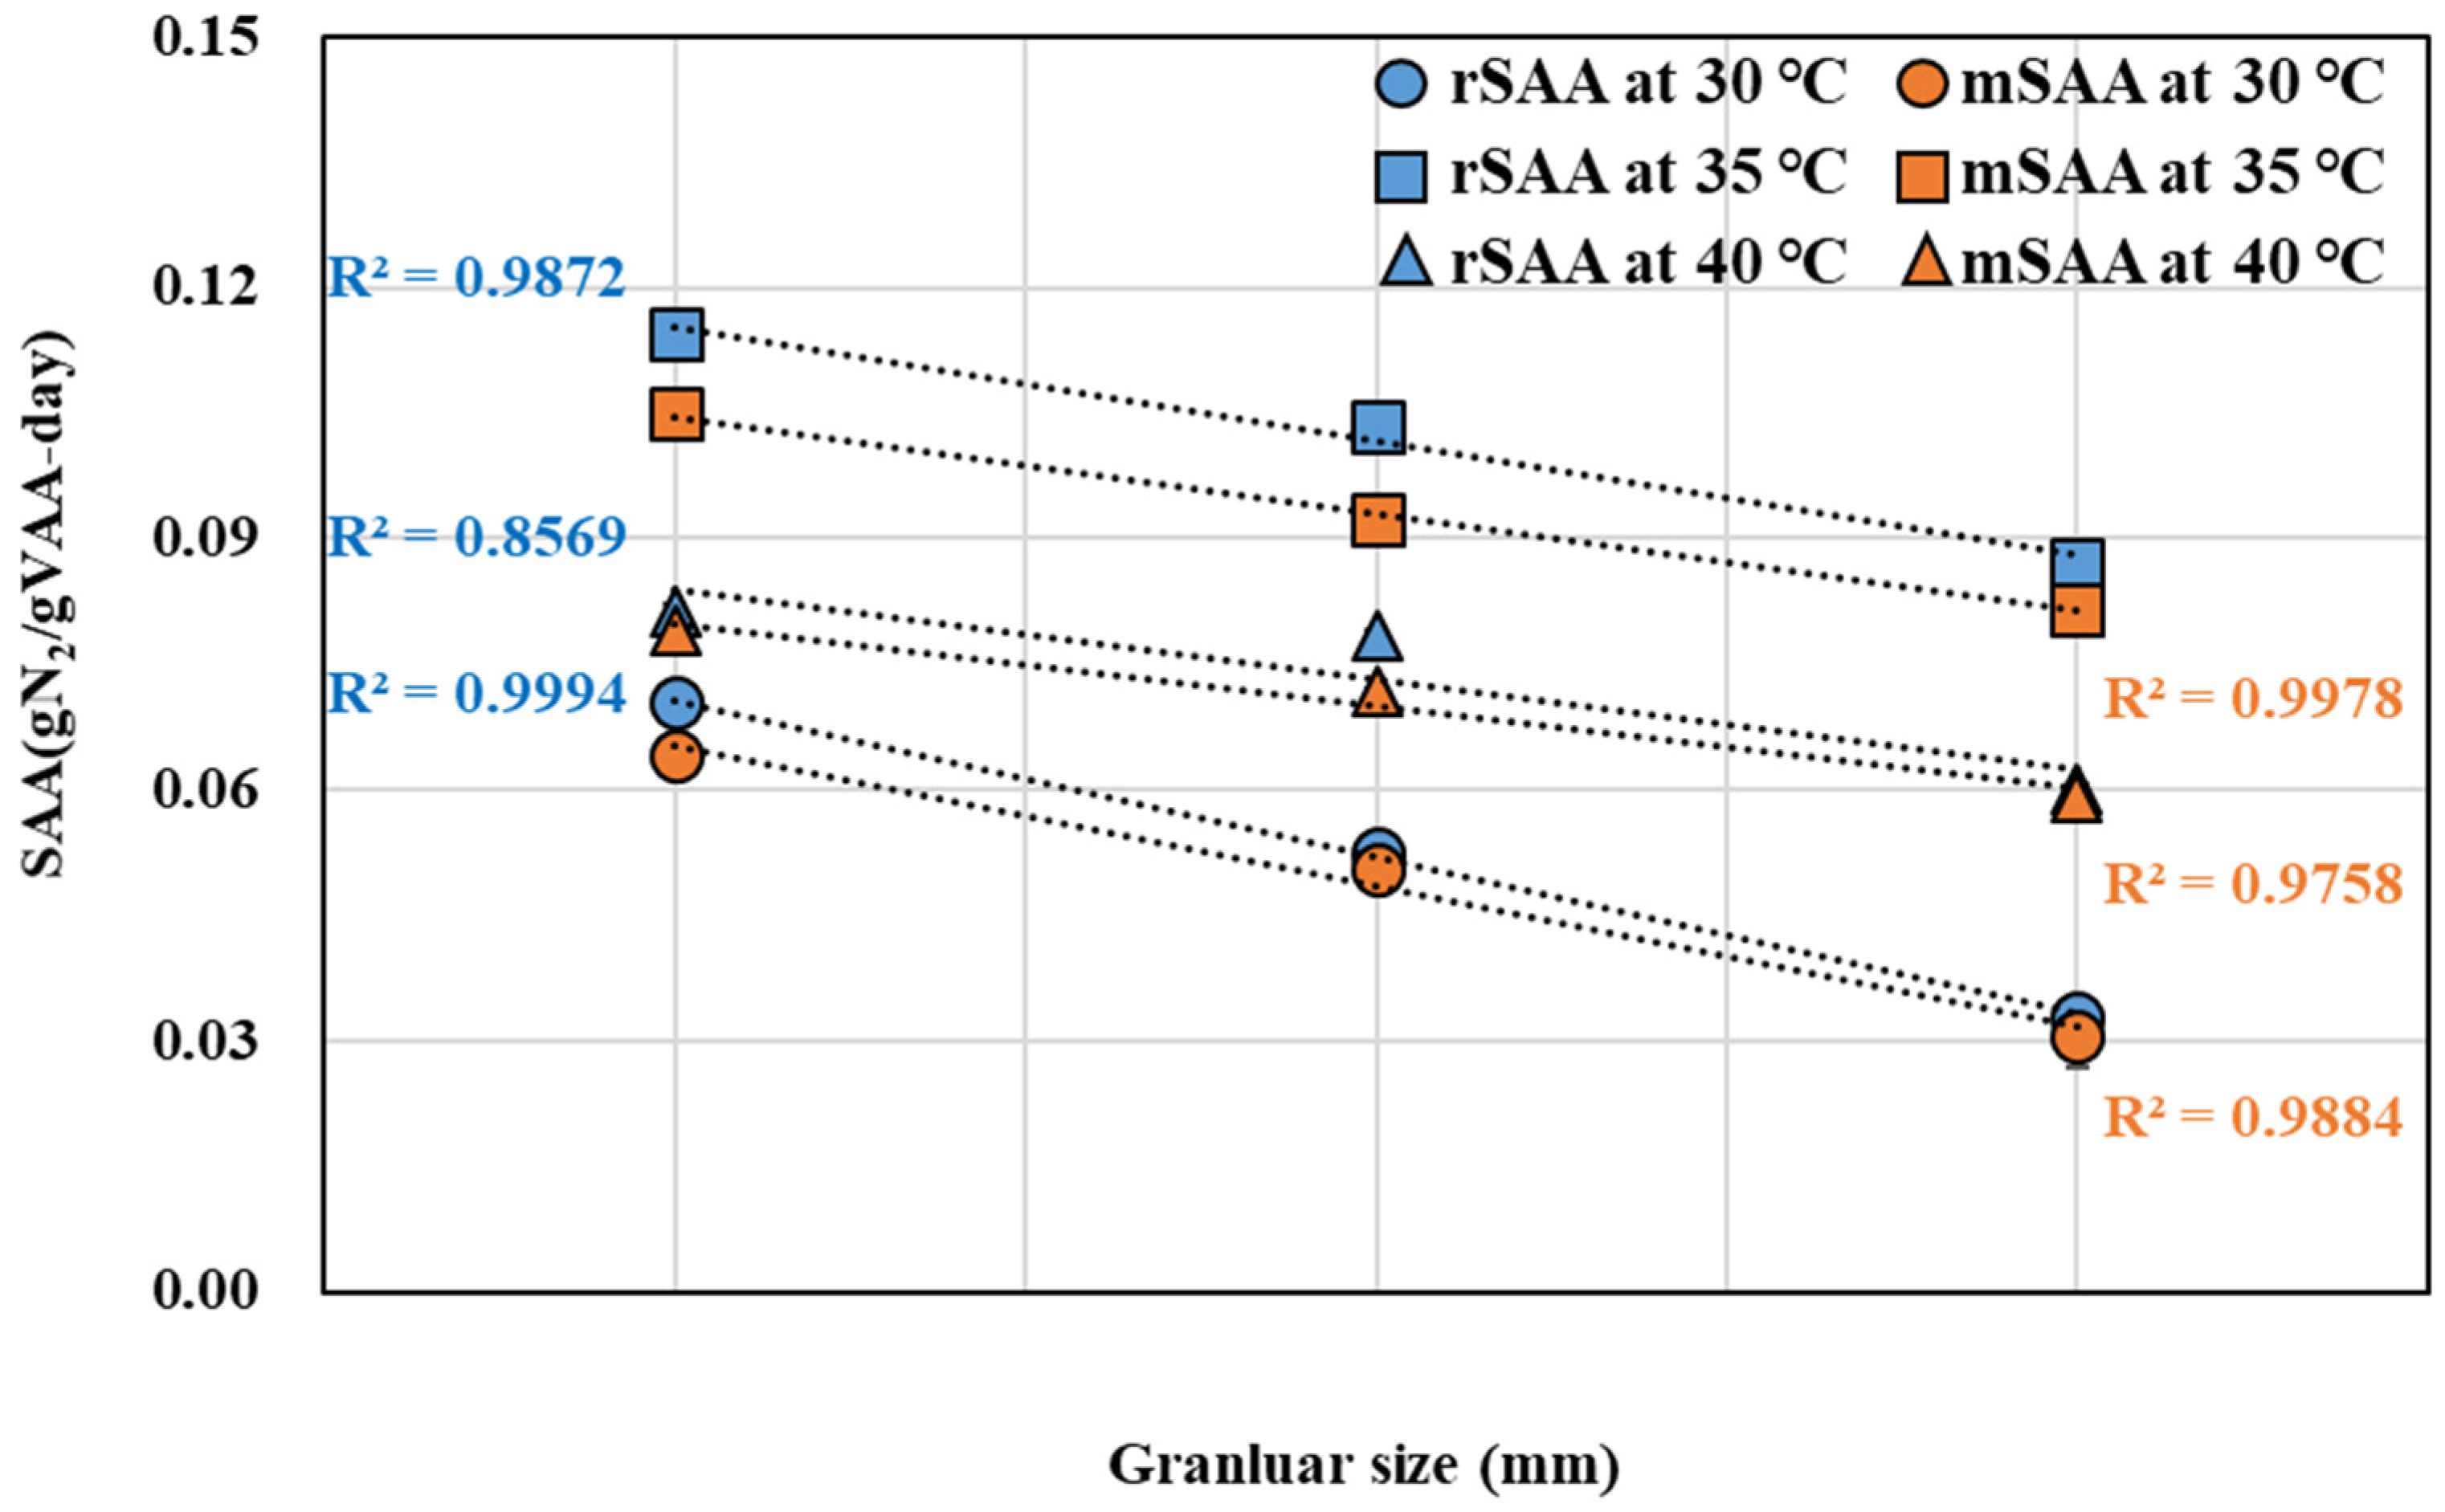
3.2. Comparison of rSAA and mSAA According to Temperature and Granule Size

The reliability and accuracy of the SAA analysis method using a respirometer were examined. The SAA was analyzed using two methods (rSAA and mSAA) according to granule size and temperature.
Herein, the two methods showed a similar trend according to granule size and temperature. Both rSAA and mSAA showed the highest SAA values at 35 °C regardless of the granule size, followed by 40 and 30 °C (Figure 3). The temperature range, in which the presence and activity of anammox bacteria were detected, was very wide (−5~80 °C). However, the optimal temperature for most of the anammox species used in the wastewater treatment was between 30 and 40 °C [22]. Therefore, the optimal temperature for anammox bacteria is 35 °C.
The SAA decreased with the increasing granule size and showed a strong negative linear relationship, according to the granule size under each temperature condition (Figure 4). A granular size of <1 mm showed the highest SAA regardless of the temperature, followed by 1–2 and >2 mm. Anammox bacteria with a small granular sludge are highly active due to the fact that the nutrients are quickly and actively supplied to the center of the granules. However, a granular sludge larger than 2 mm had a low SAA. The larger granule size causes extensive tunnels and empty spaces inside the granule, which lead to the low activity and reduction of granule stability [23].
The t-test and Wilcoxon rank-sum test were performed to determine if the SAA values using the two methods are significantly different. Prior to this step, a Shapiro–Wilk normality test was performed for the SAA value under each condition (Table 2). All of the data appeared to follow a normal distribution since the p-values resulting from the Shapiro–Wilk normality test were >0.05. All of the datasets showed a normal distribution. However, the t-test and Wilcoxon rank-sum test were performed together since the number of samples was too small (N = 6). At each condition, the p-values from the t-test and Wilcoxon rank-sum test for rSAA and mSAA were <0.05, which indicates that the SAA values using the two methods were similar. Therefore, a respirometer is well-suited for SAA analysis. However, since there is a limit for the evaluation of the process state, it is necessary to use this value as an indirect indicator, along with various factors that can confirm the process state.

4. Conclusions

In conclusion, the SAA values from a respirometer (rSAA) showed a similar pattern to the SAA values (mSAA) from the conventional method, according to granule size and temperature. The best SAA value was shown at 35 °C with a granule size of <1 mm. Moreover, the statistical analysis showed no significant differences between rSAA and mSAA. When measuring SAA using the respiratory, the fact that the anammox reaction occurs predominantly should be sufficiently reviewed in advance, since the gas composition cannot be confirmed. Our findings indicate that since the method using the respiratory system can be simply and efficiently measured in the field, it will be a powerful way to indirectly check the performance of the process easily with only the SAA result.

Author Contributions

J.Y.; Writing—original draft, visualization, writing—reviewing and editing, Y.K.; methodology, formal analysis, investigation, J.K.; investigation, data curation, S.J.; investigation, data curation, S.P.; Resources, T.L.; supervision, funding acquisition, writing—reviewing and editing. All authors have read and agreed to the published version of the manuscript.

Funding

This study was financially supported by the National Research Foundation of Korea (NRF) grant funded by the Korea Government (MIST) (NRF-2018R1D1A1B07046741 and NRF-2021R1A6A1A03039572).

Institutional Review Board Statement

Not applicable.

Informed Consent Statement

Not applicable.

Conflicts of Interest

The authors declare no conflict of interest.

References

  1. Fenu, A.; Smolders, S.; De Gussem, K.; Weemaes, M. Conflicting carbon footprint and energy saving in a side-stream Anammox Process. Biochem. Eng. J. 2019, 151, 107336. [Google Scholar] [CrossRef]
  2. Kosgey, K.; Chandran, K.; Gokal, J.; Kiambi, S.L.; Bux, F.; Kumari, S. Critical Analysis of Biomass Retention Strategies in Mainstream and Sidestream ANAMMOX-Mediated Nitrogen Removal Systems. Environ. Sci. Technol. 2021, 55, 9–24. [Google Scholar] [CrossRef] [PubMed]
  3. Jin, R.; Yang, G.; Yu, J.; Zheng, P. The inhibition of the Anammox process: A review. Chem. Eng. J. 2012, 197, 67–79. [Google Scholar] [CrossRef]
  4. Strous, M.; Heijnen, J.; Kuenen, J.G.; Jetten, M. The sequencing batch reactor as a powerful tool for the study of slowly growing anaerobic ammonium-oxidizing microorganisms. Appl. Microbiol. Biotechnol. 1998, 50, 589–596. [Google Scholar] [CrossRef]
  5. Daverey, A.; Chei, P.C.; Dutta, K.; Lin, J. Statistical analysis to evaluate the effects of temperature and pH on anammox activity. Int. Biodeterior. Biodegrad. 2015, 102, 89–93. [Google Scholar] [CrossRef]
  6. Puyol, D.; Carvajal-Arroyo, J.M.; Garcia, B.; Sierra-Alvarez, R.; Field, J.A. Kinetic characterization of Brocadia spp.-dominated anammox cultures. Bioresour. Technol. 2013, 139, 94–100. [Google Scholar] [CrossRef]
  7. Dsane, V.F.; An, S.; Oh, T.; Hwang, J.; Choi, Y.; Choi, Y. Saline conditions effect on the performance and stress index of anaerobic ammonium oxidizing (anammox) bacteria. Chemosphere 2021, 267, 129227. [Google Scholar] [CrossRef]
  8. Yoong, E.T.; Lant, P.A.; Greenfield, P.F. In situ respirometry in an SBR treating wastewater with high phenol concentrations. Water Res. 2000, 34, 239–245. [Google Scholar] [CrossRef]
  9. Sampson, M.; Blake, R., II. The cell attachment and oxygen consumption of two strains of Thiobacillus ferrooxidans. Miner. Eng. 1999, 12, 671–686. [Google Scholar] [CrossRef]
  10. Harahuc, L.; Lizama, H.M.; Suzuki, I. Selective Inhibition of the Oxidation of Ferrous Iron or Sulfur in Thiobacillus ferrooxidans. Appl. Environ. Microbiol. 2000, 66, 1031–1037. [Google Scholar] [CrossRef] [Green Version]
  11. Buvignier, A.; Peyre-Lavigne, M.; Robin, O.; Bounouba, M.; Patapy, C.; Bertron, A.; Paul, E. Influence of Dissolved-Aluminum Concentration on Sulfur-Oxidizing Bacterial Activity in the Biodeterioration of Concrete. Appl. Environ. Microbiol. 2019, 85. [Google Scholar] [CrossRef] [PubMed] [Green Version]
  12. du Plessis, C.A.; Barnard, P.; Naldrett, K.; de Kock, S.H. Development of respirometry methods to assess the microbial activity of thermophilic bioleaching archaea. J. Microbiol. Methods 2001, 47, 189–198. [Google Scholar] [CrossRef]
  13. Logan, B.E.; Oh, S.-E.; Kim, I.S.; Van Ginkel, S. Biological Hydrogen Production Measured in Batch Anaerobic Respirometers. Environ. Sci. Technol. 2002, 36, 2530–2535. [Google Scholar] [CrossRef] [PubMed]
  14. Díaz-Puente, F.; Schmid, T.; Pelayo, M.; Rodríguez-Rastrero, M.; Herraiz, M.S.; O’Neill, T.; López-Martínez, J. Abiotic factors influencing soil microbial activity in the northern Antarctic Peninsula region. Sci. Total Environ. 2021, 750, 141602. [Google Scholar] [CrossRef] [PubMed]
  15. Rauglas, E.; Martin, S.; Bailey, K.; Magnuson, M.; Phillips, R.; Harper, W.F., Jr. The effect of malathion on the activity, performance, and microbial ecology of activated sludge. J. Environ. Manag. 2016, 183, 220–228. [Google Scholar] [CrossRef] [Green Version]
  16. Raper, E.; Stephenson, T.; Fisher, R.; Anderson, D.R.; Soares, A. Characterisation of thiocyanate degradation in a mixed culture activated sludge process treating coke wastewater. Bioresour. Technol. 2019, 288, 121524. [Google Scholar] [CrossRef] [PubMed]
  17. Amha, Y.M.; Sinha, P.; Lagman, J.; Gregori, M.; Smith, A.L. Elucidating microbial community adaptation to anaerobic co-digestion of fats, oils, and grease and food waste. Water Res. 2017, 123, 277–289. [Google Scholar] [CrossRef]
  18. Echavarri-Bravo, V.; Paterson, L.; Aspray, T.J.; Porter, J.S.; Winson, M.K.; Hartl, M.G. Natural marine bacteria as model organisms for the hazard-assessment of consumer products containing silver nanoparticles. Mar. Environ. Res. 2017, 130, 293–302. [Google Scholar] [CrossRef]
  19. Bonaglia, S.; Broman, E.; Brindefalk, B.; Hedlund, E.; Hjorth, T.; Rolff, C.; Nascimento, F.J.; Udekwu, K.; Gunnarsson, J.S. Activated carbon stimulates microbial diversity and PAH biodegradation under anaerobic conditions in oil-polluted sediments. Chemosphere 2020, 248, 126023. [Google Scholar] [CrossRef]
  20. Ouyang, J.; Li, C.; Wei, L.; Wei, D.; Zhao, M.; Zhao, Z.; Zhang, J.; Chang, C. Activated sludge and other aerobic suspended culture processes. Water Environ. Res. 2020, 92, 1717–1725. [Google Scholar] [CrossRef] [PubMed]
  21. R.C. Team. R: A Language and Environment for Statistical Computing; RC Team: Vienna, Austria, 2013. [Google Scholar]
  22. Tomaszewski, M.; Cema, G.; Ziembińska-Buczyńska, A. Influence of temperature and pH on the anammox process: A review and meta-analysis. Chemosphere 2017, 182, 203–214. [Google Scholar] [CrossRef] [PubMed]
  23. An, P.; Xu, X.; Yang, F.; Li, Z. Comparison of the characteristics of anammox granules of different sizes. Biotechnol. Bioprocess Eng. 2013, 18, 446–454. [Google Scholar] [CrossRef]
Figure 1. Batch test for SAA analysis using a respirometer.
Applsci 12 01121 g001
Figure 2. Changes in nitrogen gas amount (bar) as a function of time (min) and accumulated nitrogen gas amount (line) during the total reaction time. The grey area indicates the standard deviation for accumulated N2 gas production.
Applsci 12 01121 g002
Figure 3. The rSAA and mSAA changes according to the temperature by granular size. (a) Granule size <1 mm, (b) granule size 1~2 mm, and (c) granule size >2 mm.
Applsci 12 01121 g003aApplsci 12 01121 g003b
Figure 4. The rSAA and mSAA changes according to the granule size by temperature.
Applsci 12 01121 g004
Table 1. Changes in the rSAA value over the reaction time.
Time (min)SAA (gN2/gVSS/Day)
600.449 ± 0.133
1200.384 ± 0.083
3600.197 ± 0.033
6000.111 ± 0.022
Table 2. p-values resulting from the Shapiro–Wilk normality, t-test, and Wilcoxon rank-sum test for rSAA and mSAA.
ItemrSAA30°CmSAA30°CrSAA35°CmSAA35°CrSAA40°CmSAA40°C
No. 1666666
N test 20.2760.4020.2320.4300.0510.487
T test0.711 0.223 0.5910.394
W test 3 0.485 0.240
ItemrSAA<1 mmmSAA<1 mmrSAA1–2 mmmSAA1–2 mmrSAA>2 mmmSAA>2 mm
No.666666
N test0.0660.4010.2670.3370.2490.189
T test0.604 0.326 0.6011.000
W test 0.485 0.589
1 No. of samples; 2 Shapiro–Wilk normality test; 3 Wilcoxon rank-sum test.
Publisher’s Note: MDPI stays neutral with regard to jurisdictional claims in published maps and institutional affiliations.

