
Comparative Analysis of Degree of Risk between the Frequency Aspect and Probability Aspect Using Integrated Uncertainty Method Considering Work Type and Accident Type in Construction Industry


Abstract
:Featured Application
Abstract

1. Introduction
2. Literature Review
3. Materials and Methods
3.1. Collection of Fatal Incidents in South Korea
3.2. Classification of Construction Work and Accident Type
3.3. Calculation of Frequency of Fatal Incidents Using Integrated Time Series and Estimation Method
3.4. Calculation of Probability of Fatal Incidents Considering Number of Workers’ Work Days
3.5. Conducting the Statistical Analysis
4. Results and Discussion
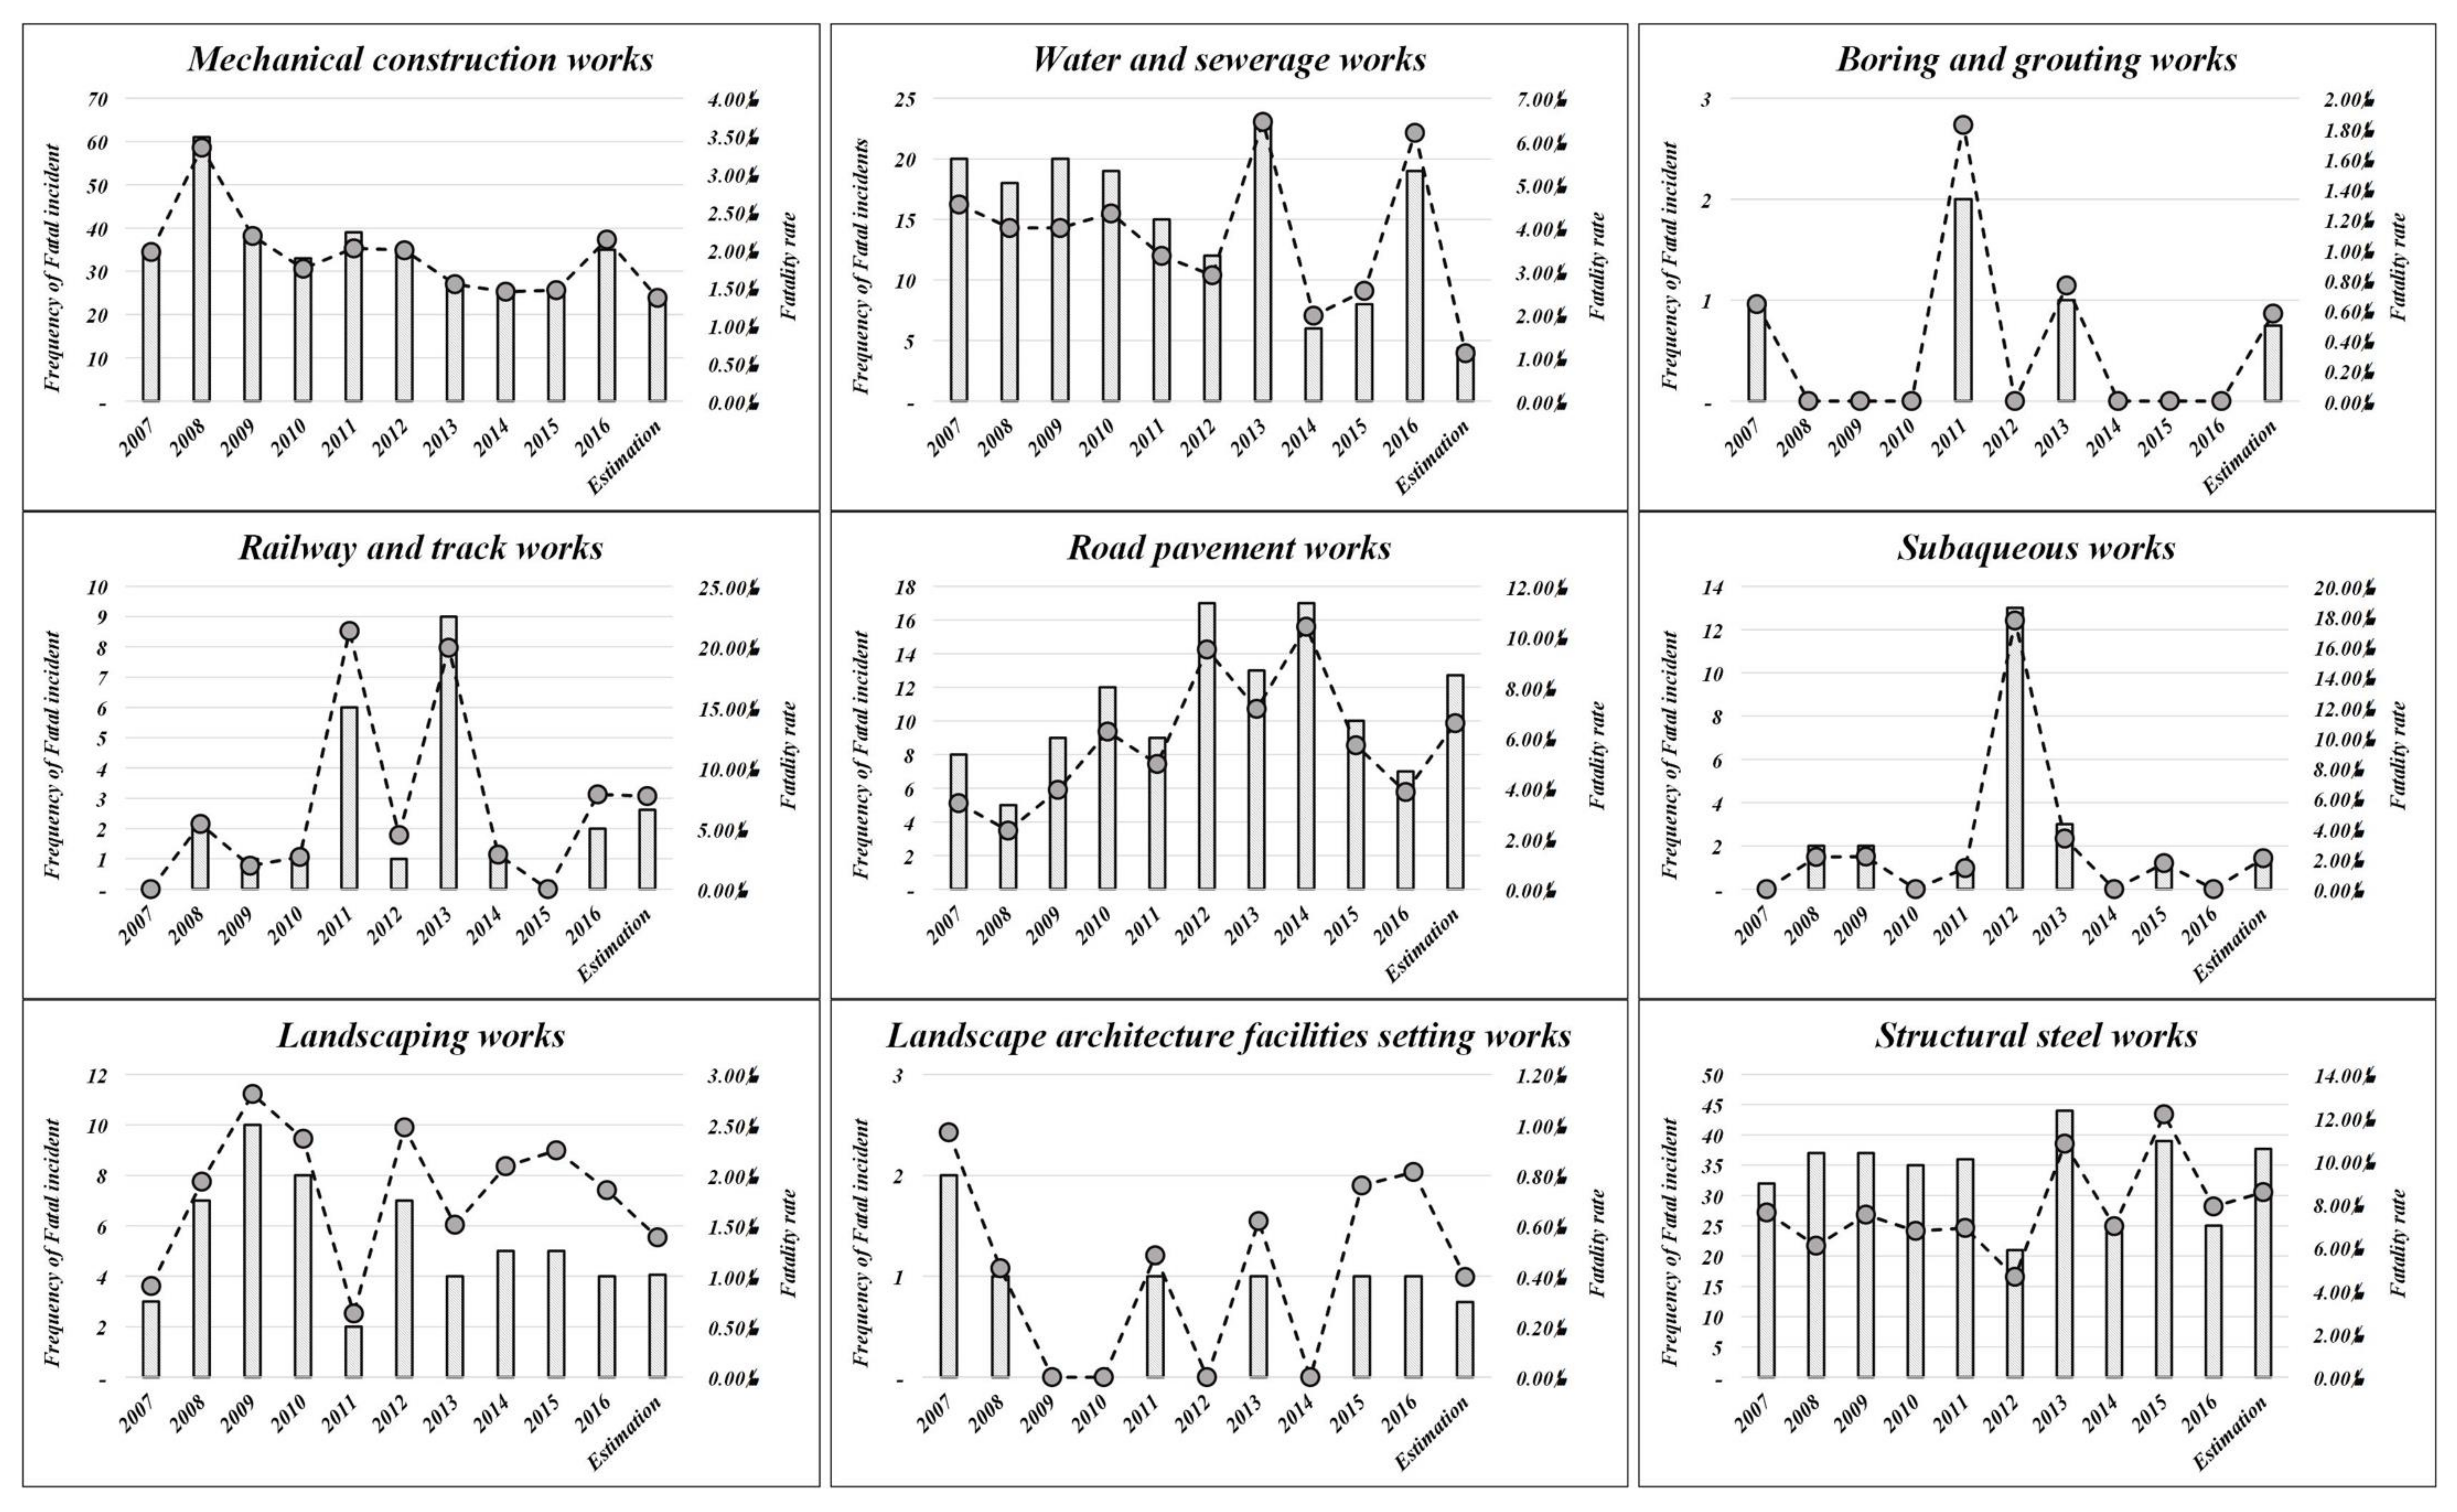
4.1. Analysis of the Frequency of Fatal Incidents for Work Types
4.2. Analysis on the Probability of Fatal Incidents for Construction Work
4.3. Results of the Statistical Analysis
4.4. Analysis on the Accident Type of Fatal Incidents for Construction Work
4.5. Discussion
5. Conclusions
Author Contributions
Funding
Institutional Review Board Statement
Informed Consent Statement
Data Availability Statement
Conflicts of Interest
Nomenclature
| ANOVA | Analysis of variance |
| ETS | Exponential smoothing |
| H0 | Null hypothesis |
| H1 | Alternative hypothesis |
| MC | Monte Carlo simulation |
| MOEL | Ministry of Employment and Labor |
| MOLEG | Ministry of Government Legislation |
| MLIT | Ministry of Land, Infrastructure, Transport, and Tourism |
References
- Soh, J.; Jeong, J.; Jeong, J. Improvements of Design for Safety in Construction through Multi-Participants Perception Analysis. Appl. Sci. 2020, 10, 4550. [Google Scholar] [CrossRef]
- Jeong, J.; Jeong, J. Quantitative Risk Evaluation of Fatal Incidents in Construction Based on Frequency and Probability Analysis. J. Manag. Eng. 2022, 38, 04021089. [Google Scholar] [CrossRef]
- Heidary Dahooie, J.; Vanaki, A.S.; Firoozfar, H.R.; Zavadskas, E.K.; Čereška, A. An extension of the failure mode and effect analysis with hesitant fuzzy sets to assess the occupational hazards in the construction industry. Int. J. Environ. Res. Public Health 2020, 17, 1442. [Google Scholar] [CrossRef] [Green Version]
- Manzoor, B.; Othman, I.; Pomares, J.C.; Chong, H.Y. A Research Framework of Mitigating Construction Accidents in High-Rise Building Projects via Integrating Building Information Modeling with Emerging Digital Technologies. Appl. Sci. 2021, 11, 8359. [Google Scholar] [CrossRef]
- Shafique, M.; Rafiq, M. An overview of construction occupational accidents in Hong Kong: A recent trend and future perspectives. Appl. Sci. 2019, 9, 2069. [Google Scholar] [CrossRef] [Green Version]
- Ministry of Employment and Labor. A Report on Industrial Accidents in 2020, South Korea; Ministry of Employment and Labor: Seoul, Korea, 2021.
- Sawicki, M.; Szóstak, M. Impact of Alcohol on Occupational Health and Safety in the Construction Industry at Workplaces with Scaffoldings. Appl. Sci. 2020, 10, 6690. [Google Scholar] [CrossRef]
- Chi, S.; Han, S. Analyses of systems theory for construction accident prevention with specific reference to OSHA accident reports. Int. J. Proj. Manag. 2013, 31, 1027–1041. [Google Scholar] [CrossRef] [Green Version]
- Kang, L.; Wu, C. Measuring the development of Chinese provincial road safety over the period 2007–2016. Measurement 2021, 175, 109133. [Google Scholar] [CrossRef]
- Lombardi, M.; Fargnoli, M.; Parise, G. Risk profiling from the european statistics on accidents at work (ESAW) accidents’ databases: A case study in construction sites. Int. J. Environ. Res. Public Health 2019, 16, 4748. [Google Scholar] [CrossRef] [Green Version]
- Sadeghi, H.; Mohandes, S.R.; Hosseini, M.R.; Banihashemi, S.; Mahdiyar, A.; Abdullah, A. Developing an ensemble predictive safety risk assessment model: Case of Malaysian construction projects. Int. J. Environ. Res. Public Health 2020, 17, 8395. [Google Scholar] [CrossRef] [PubMed]
- Sawicki, M.; Szóstak, M. Quantitative assessment of the state of threat of working on construction scaffolding. Int. J. Environ. Res. Public Health 2020, 17, 5773. [Google Scholar] [CrossRef] [PubMed]
- Xia, N.; Zou, P.X.; Griffin, M.A.; Wang, X.; Zhong, R. Towards integrating construction risk management and stakeholder management: A systematic literature review and future research agendas. Int. J. Proj. Manag. 2018, 36, 701–715. [Google Scholar] [CrossRef]
- Lee, H.S.; Kim, H.; Park, M.; Ai Lin Teo, E.; Lee, K. P Construction risk assessment using site influence factors. J. Comput. Civ. Eng. 2012, 26, 319–330. [Google Scholar] [CrossRef]
- El-Sayegh, S.M. Risk assessment and allocation in the UAE construction industry. Int. J. Proj. Manag. 2008, 26, 431–438. [Google Scholar] [CrossRef]
- Fung, I.W.; Lo, T.Y.; Tung, K.C. Towards a better reliability of risk assessment: Development of a qualitative and quantitative risk evaluation model (Q2REM) for different trades of construction works in Hong Kong. Accid. Anal. Prev. 2012, 48, 167–184. [Google Scholar] [CrossRef]
- Gómez-de-Gabriel, J.M.; Fernández-Madrigal, J.A.; López-Arquillos, A.; Rubio-Romero, J.C. Monitoring harness use in construction with BLE beacons. Measurement 2019, 131, 329–340. [Google Scholar] [CrossRef]
- Jeong, J.; Jeong, J. Novel Approach of the Integrated Work & Risk Breakdown Structure for Identifying the Hierarchy of Fatal Incident in Construction Industry. J. Build. Eng. 2021, 41, 102406. [Google Scholar] [CrossRef]
- Suárez-Cebador, M.; Rubio-Romero, J.C.; López-Arquillos, A. Severity of electrical accidents in the construction industry in Spain. J. Saf. Res. 2014, 48, 63–70. [Google Scholar] [CrossRef]
- Raviv, G.; Shapira, A.; Fishbain, B. AHP-based analysis of the risk potential of safety incidents: Case study of cranes in the construction industry. Saf. Sci. 2017, 91, 298–309. [Google Scholar] [CrossRef]
- Son, K.S.; Gal, W.M.; Song, I.Y.; Choi, J.N. Formulation for Producing Risk Level of Each Construction Work. J. Korea. Saf. Manag. Sci. 2010, 12, 13–19. [Google Scholar]
- Ale, B.J.; Bellamy, L.J.; Baksteen, H.; Damen, M.; Goossens, L.H.; Hale, A.R.; Whiston, J.Y. Accidents in the construction industry in the Netherlands: An analysis of accident reports using Storybuilder. Reliab. Eng. Syst. Saf. 2008, 93, 1523–1533. [Google Scholar] [CrossRef]
- Amiri, M.; Ardeshir, A.; Zarandi, M.H.F. Risk-based analysis of construction accidents in Iran during 2007–2011-meta analyze study. Iran. J. Public Health 2014, 43, 507. [Google Scholar] [PubMed]
- Woodruff, J.M. Consequence and likelihood in risk estimation: A matter of balance in UK health and safety risk assessment practice. Saf. Sci. 2005, 43, 345–353. [Google Scholar] [CrossRef]
- Lee, J.; Lim, M. Analysis on the degree of risk according to the causes of accidents in construction projects in Korea. Int. J. Appl. Eng. Res. 2017, 12, 2821–2831. [Google Scholar]
- Mohammadi, A.; Tavakolan, M.; Khosravi, Y. Developing safety archetypes of construction industry at project level using system dynamics. J. Saf. Res. 2018, 67, 17–26. [Google Scholar] [CrossRef] [PubMed]
- Kim, Y.R.; Park, M.H.; Jeong, B.Y. Hazardous factors and accident severity of cabling work in telecommunications industry. J. Ergon. Soc. Korea 2016, 35, 155–163. [Google Scholar] [CrossRef] [Green Version]
- Marhavilas, P.K.; Koulouriotis, D.E.; Spartalis, S.H. Harmonic analysis of occupational-accident time-series as a part of the quantified risk evaluation in worksites: Application on electric power industry and construction sector. Reliab. Eng. Syst. Saf. 2013, 112, 8–25. [Google Scholar] [CrossRef]
- Chan, A.P.; Wong, F.K.; Hon, C.K.; Choi, T.N. A Bayesian network model for reducing accident rates of electrical and mechanical (E&M) work. Int. J. Environ. Res. Public Health 2018, 15, 2496. [Google Scholar] [CrossRef] [Green Version]
- Hinze, J.; Gambatese, J. Factors that influence safety performance of specialty contractors. J. Constr. Eng. Manag. 2003, 129, 159–164. [Google Scholar] [CrossRef] [Green Version]
- Marhavilas, P.K.; Vrountas, P.T. Risk Assessment in the Constructions Sector of EU Countries: Application of a Methodological Framework using Quantitative Techniques and Occupational Accidents’ Data throughout the period 1996–2011. J. Eng. Sci. Technol. 2018, 11, 66–73. [Google Scholar] [CrossRef]
- Lee, Y.J.; Kang, S.K.; Yu, H. A Study on Risk Factor Identification by Specialty Construction Industry Sector through Construction Accident Cases: Focused on the Insurance Data of Specialty Construction Worker. J. Korea Ind. Syst. Res. 2019, 24, 45–63. [Google Scholar] [CrossRef]
- Park, H.; Park, H.D.; Jang, J.K. Exposure characteristics of construction painters to organic solvents. Saf. Health Work 2016, 7, 63–71. [Google Scholar] [CrossRef] [PubMed] [Green Version]
- Korean Statistical Information Service (KOSIS). Available online: http://kosis.kr/ (accessed on 19 May 2020).
- Ministry of Employment and Labor (MOEL). Available online: http://www.moel.go.kr/ (accessed on 19 May 2020).
- Ministry of Land, Infrastructure, Transport and Tourism (MLIT). Available online: https://www.mlit.go.jp/ (accessed on 10 September 2020).
- López, M.A.C.; Ritzel, D.O.; Fontaneda, I.; Alcantara, O.J.G. Construction industry accidents in Spain. J. Saf. Res. 2008, 39, 497–507. [Google Scholar] [CrossRef]
- Sanni-Anibire, M.O.; Mahmoud, A.S.; Hassanain, M.A.; Salami, B.A. A risk assessment approach for enhancing construction safety performance. Saf. Sci. 2020, 121, 15–29. [Google Scholar] [CrossRef]
- Ministry of Government Legislation (MOLEG). Available online: https://www.moleg.go.kr/ (accessed on 19 May 2020).
- Sadeghi, N.; Fayek, A.R.; Pedrycz, W. Fuzzy Monte Carlo simulation and risk assessment in construction. Comput. Civ. Infrastruct. Eng. 2010, 25, 238–252. [Google Scholar] [CrossRef]
- Corberán-Vallet, A.; Bermúdez, J.D.; Vercher, E. Forecasting correlated time series with exponential smoothing models. Int. J. Forecast. 2011, 27, 252–265. [Google Scholar] [CrossRef]
- Davies, R.; Coole, T.; Osipyw, D. The application of time series modelling and Monte Carlo simulation: Forecasting volatile inventory requirements. Appl. Math. 2014, 8. [Google Scholar] [CrossRef] [Green Version]
- Sudirman, Y.D.; Rifai, M.F.; Kusuma, D.T.; Purwanto, Y.S.; Fitriani, Y. A Comparison Between Triple Exponential Smoothing and Monte Carlo Methods in The Prediction of Chicken Business Profit at Poultry Farm Livestock of Jatipuro District. J. Phys. Conf. Ser. 2020, 1477, 032006. [Google Scholar] [CrossRef]
- Beisbart, C.; Norton, J.D. Why Monte Carlo simulations are inferences and not experiments. Int. Stud. Philos. Sci. 2012, 26, 403–422. [Google Scholar] [CrossRef] [Green Version]
- Namazian, A.; Yakhchali, S.H.; Yousefi, V.; Tamošaitienė, J. Combining Monte Carlo simulation and Bayesian networks methods for assessing completion time of projects under risk. Int. J. Environ. Res. Public Health 2019, 16, 5024. [Google Scholar] [CrossRef] [PubMed] [Green Version]
- Cox, S.; Cox, T. Safety, Systems, and People; Butterworth-Heinemann: Oxford, UK, 1996. [Google Scholar]
- McGuinness, P. Risk Assessment: A Line Manager’s Guide; The Industrial Society: London, UK, 1995. [Google Scholar]
- Walpole, R.E.; Myers, R.H.; Myers, S.L.; Ye, K. Probability and Statistics for Engineers and Scientists; Macmillan: New York, NY, USA, 1993; Volume 5. [Google Scholar]
- Jeong, J.; Hong, T.; Ji, C.; Kim, J.; Lee, M.; Jeong, K. Development of an evaluation process for green and non-green buildings focused on energy performance of G-SEED and LEED. Build. Environ. 2016, 105, 172–184. [Google Scholar] [CrossRef]
- Jeong, J.; Hong, T.; Ji, C.; Kim, J.; Lee, M.; Jeong, K. Development of an integrated energy benchmark for a multi-family housing complex using district heating. Appl. Energy 2016, 179, 1048–1061. [Google Scholar] [CrossRef]
- Jeong, J.; Hong, T.; Ji, C.; Kim, J.; Lee, M.; Jeong, K.; Koo, C. Development of a prediction model for the cost saving potentials in implementing the building energy efficiency rating certification. Appl. Energy 2017, 189, 257–270. [Google Scholar] [CrossRef]
- Jeong, J.; Hong, T.; Ji, C.; Kim, J.; Lee, M.; Jeong, K.; Koo, C. Improvements of the operational rating system for existing residential buildings. Appl. Energy 2017, 193, 112–124. [Google Scholar] [CrossRef]
- Zimmerman, D.W. A note on preliminary tests of equality of variances. Br. J. Math. Stat. Psychol. 2004, 57, 173–181. [Google Scholar] [CrossRef] [PubMed]
- Huang, X.; Hinze, J. Analysis of construction worker fall accidents. J. Constr. Eng. Manag. 2003, 129, 262–271. [Google Scholar] [CrossRef]


| Work Type | Accident Type | |||
|---|---|---|---|---|
| Author | Frequency | Probability | Frequency | Probability |
| Jeong and Jeong (2022) [2] | ● | ● | ||
| Sawicki and Szóstak 2020 [12] | ● | |||
| Lee et al. (2012) [14] | ● | |||
| Fung et al. (2012) [16] | ● | |||
| Suárez-Cebador et al. (2014) [19] | ● | |||
| Son et al. (2010) [21] | ● | |||
| Ale et al. (2008) [23] | ● | |||
| Amiri et al. (2014) [24] | ● | ● | ||
| Lee and Lim (2017) [26] | ● | |||
| Marhavilas and Vrountas (2018) [32] | ● | ● | ||
| Lee et al. (2019) [33] | ● | |||
| Number | Project Name | Type of Facility | Gender | Age | Type of Job | Area | Hour | Type of Accident | Description of the Fatal Incident |
|---|---|---|---|---|---|---|---|---|---|
| 1 | ‘A’ plant construction | Plant | Man | 46 | Unskilled labor | Jincheon | 14:00 | Collision | As the slope of the excavation surface collapsed, laborers were buried. |
| 2 | ‘B’ plant construction | Plant | Man | 59 | Unskilled labor | Okchoen | 10:00 | Fall | While removing the waste on the temporary site, the laborer lost his balance and fell into the ground. |
| 4336 | ‘A’ apartment construction | Residential building | Man | 53 | Plasterer | Busan | 17:00 | Fall | When the laborer moved his position for wall painting, he lost his balance and fell to the second basement floor. |
| 4337 | ‘B’ apartment construction | Residential building | Man | 34 | Welder | Jeonju | 14:00 | Explosion | Explosion while cutting the drum with an oxy-acetylene torch. |
| Author | Interior Construction Work | Earth Work | Plaster, Waterproof, and Masonry Construction Work | Stone Work | Painting Work | Scaffold and Demolition Work | Metal Structure and Window Construction Work | Roofing Sheet Metal and Fabrication Work | Reinforced Concrete Construction Work |
|---|---|---|---|---|---|---|---|---|---|
| Framework Act On The Construction Industry * [39] | ● | ● | ● | ● | ● | ● | ● | ● | ● |
| MLIT * [36] | ● | ● | ● | ● | ● | ● | ● | ● | ● |
| Fung et al. (2012) ** [16] | ● | ● | ● | ● | ● | ||||
| Lee et al. (2012) ** [14] | ● | ● | ● | ● | ● | ● | ● | ● | ● |
| Author | Mechanical Construction Work | Water and Sewerage Work | Boring and Grouting Work | Railway and Track Work | Road Pavement Work | Subaqueous Work | Landscaping Work | Landscape Architecture Facilities Setting Work | Structural Steel Work |
| Framework Act On The Construction Industry * [39] | ● | ● | ● | ● | ● | ● | ● | ● | ● |
| MLIT * [36] | ● | ● | ● | ● | ● | ● | ● | ● | |
| Fung et al. (2012) ** [16] | ● | ● | |||||||
| Lee et al. (2012) ** [14] | ● | ● | |||||||
| Author | Cableway Installation Work | Dredging Work | Elevator and Escalator Installation Work | Gas Facility Construction Work | Heating System Construction Work | Facilities Maintenance Work | Electrical Installation Work | Information and Communication Construction Work | Firefighting System Installation Work |
| Framework Act On The Construction Industry * [39] | ● | ● | ● | ● | ● | ● | |||
| Electrical Construction Business Act * [39] | ● | ||||||||
| Information and Communication Construction Business Act * [39] | ● | ||||||||
| Fire Fighting System Installation Business Act * [39] | ● | ||||||||
| MLIT * [36] | ● | ● | ● | ● | ● | ● | ● | ||
| Fung et al. (2012) ** [16] | ● | ||||||||
| Lee et al. (2012) ** [14] | ● |
| Author | Electrical Shock | Slip | Fall | Hit | Collision | Jammed | Chemical Spill or Contact | Fire | Bumped |
|---|---|---|---|---|---|---|---|---|---|
| Fung et al. (2012) * [16] | ● | ● | ● | ● | ● | ● | ● | ● | |
| Jeong and Jeong. (2021) * [18] | ● | ● | ● | ● | ● | ● | ● | ● | ● |
| Kim et al. (2016) * [27] | ● | ● | ● | ● | ● | ● | ● | ● | |
| López et al. (2008) * [35] | ● | ● | ● | ● | ● | ● | |||
| Sanni-Anibire et al. (2020) * [38] | ● | ● | ● | ● | ● | ● | ● | ||
| Author | Drowned | Explosion | Hypoxia | Violence | Contact of Abnormal Temperature | Cut | Animal Injury | Fall Beneath | Non-categorization |
| Fung et al. (2012) * [16] | ● | ● | ● | ● | |||||
| Jeong and Jeong. (2021) * [18] | ● | ● | ● | ● | ● | ● | ● | ● | |
| Kim et al. (2016) * [27] | ● | ● | ● | ● | ● | ● | ● | ● | |
| López et al. (2008) * [35] | ● | ● | ● | ● | |||||
| Sanni-Anibire et al. (2020) * [38] | ● | ● | ● |
| The Frequency of Fatal Incidents | 2007 | 2008 | 2009 | 2010 | 2011 | 2012 | 2013 | 2014 | 2015 | 2016 | Estimated Approach (Rank) |
|---|---|---|---|---|---|---|---|---|---|---|---|
| National data | 630 | 669 | 606 | 611 | 621 | 496 | 567 | 434 | 437 | 499 | - |
| Interior construction work | 2 | 3 | 5 | 1 | 5 | 2 | 2 | 5 | 2 | 6 | 2.8 (18) |
| Earth work | 30 | 31 | 30 | 33 | 43 | 31 | 35 | 16 | 27 | 29 | 25.8 (7) |
| Plaster, waterproof, and masonry construction work | 30 | 28 | 25 | 31 | 35 | 36 | 28 | 24 | 32 | 31 | 31.4 (5) |
| Stone work | 7 | 1 | 9 | 6 | 8 | 7 | 9 | 7 | 2 | 8 | 7.8 (13) |
| Painting work | 21 | 25 | 25 | 24 | 19 | 23 | 19 | 21 | 21 | 21 | 21.4 (10) |
| Scaffold and demolition work | 60 | 60 | 51 | 63 | 56 | 60 | 64 | 40 | 62 | 61 | 57.2 (2) |
| Metal structure and window construction work | 25 | 28 | 18 | 24 | 26 | 19 | 16 | 17 | 19 | 18 | 15.2 (10) |
| Roofing, sheet metal, and fabrication construction work | 30 | 41 | 27 | 45 | 34 | 31 | 45 | 44 | 36 | 29 | 36.1 (4) |
| Reinforced concrete construction work | 76 | 63 | 82 | 71 | 74 | 75 | 73 | 61 | 65 | 68 | 66.5 (1) |
| Mechanical construction work | 35 | 61 | 38 | 33 | 39 | 35 | 28 | 25 | 25 | 35 | 24.3 (8) |
| Water and sewerage work | 20 | 18 | 20 | 19 | 15 | 12 | 23 | 6 | 8 | 19 | 4.4 (14) |
| Boring and grouting work | 1 | - | - | - | 2 | - | 1 | - | - | - | 0.7 (23) |
| Railway and track work | - | 2 | 1 | 1 | 6 | 1 | 9 | 1 | - | 2 | 2.6 (19) |
| Road pavement work | 8 | 5 | 9 | 12 | 9 | 17 | 13 | 17 | 10 | 7 | 12.7 (11) |
| Subaqueous work | - | 2 | 2 | - | 1 | 13 | 3 | - | 1 | - | 1.6 (22) |
| Landscaping work | 3 | 7 | 10 | 8 | 2 | 7 | 4 | 5 | 5 | 4 | 4.1 (16) |
| Landscape architectural facilities setting work | 2 | 1 | - | - | 1 | - | 1 | - | 1 | 1 | 0.7 (24) |
| Structural steel work | 32 | 37 | 37 | 35 | 36 | 21 | 44 | 24 | 39 | 25 | 37.7 (3) |
| Cableway installation work | 1 | - | - | - | - | - | - | - | - | - | 0.1 (27) |
| Dredging work | - | - | 3 | - | 1 | 2 | 2 | - | 4 | 1 | 1.8 (20) |
| Elevator and escalator installation work | 4 | 7 | - | 3 | - | 2 | 4 | 4 | 4 | 4 | 3.6 (17) |
| Gas facility construction work | 7 | 2 | 2 | - | 3 | 2 | 3 | 3 | 2 | 5 | 4.3 (15) |
| Heating system construction work | 2 | - | 1 | 3 | 2 | 1 | 1 | 2 | - | - | 0.4 (26) |
| Facilities maintenance work | 7 | 1 | 2 | 2 | 9 | 2 | 3 | 4 | - | 2 | 1.7 (21) |
| Electrical installation work | 37 | 37 | 33 | 34 | 25 | 20 | 23 | 24 | 23 | 33 | 30.5 (6) |
| Information and communication construction work | 11 | 6 | 4 | 9 | 10 | 11 | 9 | 5 | 7 | 9 | 8.0 (12) |
| Firefighting system installation work | - | 1 | - | 1 | 1 | 3 | 1 | - | 1 | - | 0.7 (8) |
| Sum | 451 | 467 | 434 | 458 | 462 | 433 | 463 | 355 | 396 | 418 | 400.9 |
| Fatality Rate (Unit: ‱) | 2007 | 2008 | 2009 | 2010 | 2011 | 2012 | 2013 | 2014 | 2015 | 2016 | Estimated Approach (Rank) |
|---|---|---|---|---|---|---|---|---|---|---|---|
| National data | 2.18 | 2.06 | 1.89 | 1.91 | 2.01 | 1.78 | 2.21 | 1.34 | 1.30 | 1.58 | - |
| Interior construction work | 0.16 | 0.25 | 0.45 | 0.09 | 0.45 | 0.20 | 0.20 | 0.50 | 0.21 | 0.62 | 0.24 (26) |
| Earth work | 1.76 | 1.72 | 1.75 | 1.90 | 2.53 | 2.10 | 2.60 | 1.29 | 2.11 | 2.37 | 1.70 (16) |
| Plaster, waterproof, and masonry construction work | 6.41 | 6.40 | 5.86 | 8.63 | 10.15 | 11.55 | 8.21 | 6.60 | 8.97 | 8.53 | 8.32 (7) |
| Stone work | 2.11 | 0.32 | 2.81 | 2.27 | 3.34 | 3.41 | 4.57 | 3.99 | 1.22 | 4.45 | 3.25 (12) |
| Painting work | 8.98 | 11.27 | 12.57 | 12.57 | 9.93 | 13.37 | 11.14 | 11.80 | 11.77 | 12.42 | 9.47 (4) |
| Scaffold and demolition work | 27.66 | 24.85 | 25.76 | 32.74 | 30.23 | 30.59 | 35.42 | 22.89 | 31.65 | 28.22 | 28.65 (1) |
| Metal structure and window construction work | 2.63 | 2.88 | 1.89 | 2.69 | 3.08 | 2.35 | 2.00 | 2.26 | 2.63 | 2.44 | 1.80 (15) |
| Roofing, sheet metal, and fabrication construction work | 18.75 | 23.16 | 17.18 | 25.86 | 18.20 | 18.19 | 24.86 | 23.27 | 21.39 | 16.68 | 20.80 (2) |
| Reinforced concrete construction work | 3.89 | 3.38 | 4.90 | 4.91 | 5.35 | 5.38 | 4.97 | 4.34 | 4.58 | 4.45 | 4.28 (10) |
| Mechanical construction work | 1.97 | 3.35 | 2.18 | 1.75 | 2.02 | 1.99 | 1.54 | 1.44 | 1.47 | 2.14 | 1.36 (18) |
| Water and sewerage work | 4.55 | 4.01 | 4.00 | 4.34 | 3.36 | 2.91 | 6.46 | 1.97 | 2.55 | 6.21 | 1.11 (11) |
| Boring and grouting work | 0.64 | 0.00 | 0.00 | 0.00 | 1.83 | 0.00 | 0.76 | 0.00 | 0.00 | 0.00 | 0.58 (22) |
| Railway and track work | 0.00 | 5.38 | 1.93 | 2.66 | 21.31 | 4.46 | 19.93 | 2.85 | 0.00 | 7.82 | 7.68 (8) |
| Road pavement work | 3.41 | 2.32 | 3.94 | 6.24 | 4.96 | 9.49 | 7.14 | 10.40 | 5.70 | 3.85 | 6.57 (9) |
| Subaqueous work | 0.00 | 2.13 | 2.16 | 0.00 | 1.39 | 17.74 | 3.34 | 0.00 | 1.72 | 0.00 | 2.05 (14) |
| Landscaping work | 0.90 | 1.94 | 2.81 | 2.36 | 0.63 | 2.47 | 1.51 | 2.09 | 2.25 | 1.85 | 1.38 (17) |
| Landscape architectural facilities setting work | 0.97 | 0.43 | 0.00 | 0.00 | 0.48 | 0.00 | 0.62 | 0.00 | 0.76 | 0.81 | 0.40 (23) |
| Structural steel work | 7.61 | 6.07 | 7.51 | 6.76 | 6.90 | 4.64 | 10.79 | 6.98 | 12.15 | 7.88 | 8.55 (6) |
| Cableway installation work | 127.21 | 0.00 | 0.00 | 0.00 | 0.00 | 0.00 | 0.00 | 0.00 | 0.00 | 0.00 | 8.82 (5) |
| Dredging work | 0.00 | 0.00 | 5.76 | 0.00 | 1.43 | 5.82 | 6.64 | 0.00 | 18.13 | 3.60 | 4.18 (11) |
| Elevator and escalator installation work | 13.74 | 23.74 | 0.00 | 10.89 | 0.00 | 7.69 | 14.86 | 15.95 | 12.80 | 11.12 | 12.83 (3) |
| Gas facility construction work | 1.70 | 0.45 | 0.41 | 0.00 | 1.07 | 0.62 | 0.90 | 0.90 | 0.59 | 1.40 | 1.13 (19) |
| Heating system construction work | 1.62 | 0.00 | 0.81 | 1.94 | 1.27 | 0.66 | 0.72 | 1.53 | 0.00 | 0.00 | 0.30 (25) |
| Facilities maintenance work | 1.82 | 0.21 | 0.36 | 0.37 | 1.74 | 0.37 | 0.59 | 0.83 | 0.00 | 0.37 | 0.33 (24) |
| Electrical installation work | 2.71 | 2.50 | 2.36 | 2.77 | 2.09 | 1.81 | 2.09 | 2.11 | 1.95 | 2.95 | 2.48 (13) |
| Information and communication construction work | 1.07 | 0.57 | 0.39 | 0.86 | 1.00 | 1.10 | 0.94 | 0.52 | 0.80 | 1.15 | 0.83 (21) |
| Firefighting system installation work | 0.00 | 0.21 | 0.00 | 0.22 | 0.22 | 0.71 | 0.22 | 0.00 | 0.21 | 0.00 | 0.15 (27) |
| Average | 3.78 | 3.77 | 3.66 | 3.99 | 4.18 | 4.21 | 4.56 | 3.68 | 4.13 | 4.36 | 3.68 |
| Criteria | Levene’s Test for the Equality of Variances | Welch’s Test | ||||||
|---|---|---|---|---|---|---|---|---|
| Independent Variable: Fatal Incident | ||||||||
| F | df1 | df2 | Sig. | Statistic | df1 | df2 | Sig. | |
| Frequency of fatal incident | 5.160 | 26 | 243 | 0.000 | 152.051 | 26 | 86.29 | 0.00 |
| Probability of fatal incident | 4.682 | 26 | 243 | 0.000 | 94.733 | 26 | 86.86 | 0.00 |
| Accident Type (The Number of Fatal Incidents) | Electrical Shock | Slip | Fall | Hit | Collision | Jammed | Chemical Spill or Contact | Fire | Bumped | Drowned |
|---|---|---|---|---|---|---|---|---|---|---|
| Interior construction work | - | 2 | 23 | 3 | 1 | 2 | - | 1 | - | - |
| Earth work | 5 | 8 | 48 | 45 | 85 | 29 | 1 | - | 50 | 1 |
| Plaster, waterproof, and masonry construction work | 6 | 9 | 237 | 10 | 7 | 5 | 3 | 7 | 3 | 2 |
| Stone work | - | - | 33 | 13 | 6 | 2 | - | - | 7 | - |
| Painting work | 7 | 3 | 188 | 2 | 1 | 7 | 1 | 1 | 2 | 4 |
| Scaffold and demolition work | 14 | 12 | 357 | 55 | 64 | 22 | 1 | 4 | 14 | 5 |
| Metal structure and window construction work | 6 | 3 | 173 | 9 | 4 | 3 | - | 2 | 1 | - |
| Roofing, sheet metal, and fabrication construction work | 5 | 4 | 335 | 7 | 5 | 2 | - | 2 | - | - |
| Reinforced concrete construction work | 14 | 20 | 408 | 62 | 82 | 20 | 7 | 2 | 27 | 9 |
| Mechanical construction work | 18 | 3 | 162 | 13 | 5 | 28 | 16 | 22 | 8 | 5 |
| Water and sewerage work | 2 | 2 | 10 | 19 | 68 | 9 | 4 | 5 | 15 | 10 |
| Boring and grouting work | 1 | - | 1 | - | 1 | - | - | - | - | 1 |
| Railway and track work | - | - | 4 | - | 1 | - | - | - | 11 | 7 |
| Road pavement work | 2 | 5 | 9 | 8 | 2 | 11 | 1 | - | 61 | - |
| Subaqueous work | - | 1 | 1 | 2 | 1 | 3 | - | - | 1 | 13 |
| Landscaping work | 2 | 3 | 21 | 7 | 1 | 1 | - | - | 10 | - |
| Landscape architectural facilities setting work | - | 2 | 2 | 1 | 1 | - | - | - | 1 | - |
| Structural steel work | 2 | 5 | 259 | 26 | 18 | 6 | - | - | 6 | - |
| Cableway installation work | - | - | - | 1 | - | - | - | - | - | - |
| Dredging work | 1 | - | 2 | 1 | 3 | - | - | - | 1 | 4 |
| Elevator and escalator installation work | 1 | - | 26 | 4 | - | - | - | 1 | - | - |
| Gas facility construction work | - | - | 10 | 1 | 3 | 1 | 3 | 5 | 3 | 1 |
| Heating system construction work | 1 | 1 | 5 | 1 | - | 2 | - | - | 1 | - |
| Facilities maintenance work | 1 | - | 20 | 2 | 4 | 1 | - | 1 | - | 1 |
| Electrical installation work | 99 | 6 | 128 | 6 | 6 | 8 | 2 | 3 | 13 | - |
| Information and communication construction work | 11 | 1 | 50 | 5 | 2 | 1 | 2 | - | 5 | 1 |
| Firefighting system installation work | 1 | - | 3 | - | 1 | 1 | - | - | - | - |
| Sum | 199 | 90 | 2515 | 303 | 372 | 164 | 41 | 56 | 240 | 64 |
| Accident Type (The Number of Fatal Incidents) | Explosion | Hypoxia | Violence | Contact of Abnormal Temperature | Cut | Animal Injury | Fall Beneath | Non- Categorization | Sum | |
| Interior construction work | - | - | - | - | - | - | 1 | - | 33 | |
| Earth work | 2 | - | - | - | 1 | 3 | 27 | - | 305 | |
| Plaster, waterproof, and masonry construction work | 5 | - | - | - | - | - | 5 | 1 | 300 | |
| Stone work | - | - | - | - | - | 1 | 2 | - | 64 | |
| Painting work | - | 1 | - | 1 | - | - | 1 | - | 219 | |
| Scaffold and demolition work | 4 | 2 | - | - | 1 | 2 | 20 | - | 577 | |
| Metal structure and window construction work | 8 | - | - | - | - | - | 1 | - | 210 | |
| Roofing, sheet metal, and fabrication construction work | - | - | - | - | - | - | 2 | - | 362 | |
| Reinforced concrete construction work | 6 | 4 | 1 | 1 | 7 | - | 36 | 2 | 708 | |
| Mechanical construction work | 41 | 15 | - | 5 | 2 | - | 10 | 1 | 354 | |
| Water and sewerage work | - | 9 | - | - | 1 | - | 6 | - | 160 | |
| Boring and grouting work | - | - | - | - | - | - | - | - | 4 | |
| Railway and track work | - | - | - | - | - | - | - | - | 23 | |
| Road pavement work | - | - | - | 1 | - | 1 | 6 | - | 107 | |
| Subaqueous work | - | - | - | - | - | - | - | - | 22 | |
| Landscaping work | - | - | - | - | - | 2 | 8 | - | 55 | |
| Landscape architectural facilities setting work | - | - | - | - | - | - | - | - | 7 | |
| Structural steel work | - | - | - | 1 | 1 | - | 6 | - | 330 | |
| Cableway installation work | - | - | - | - | - | - | - | - | 1 | |
| Dredging work | - | - | - | - | - | - | 1 | - | 13 | |
| Elevator and escalator installation work | - | - | - | - | - | - | - | - | 32 | |
| Gas facility construction work | 2 | - | - | - | - | - | - | - | 29 | |
| Heating system construction work | - | - | - | 1 | - | - | - | - | 12 | |
| Facilities maintenance work | - | - | - | - | - | 1 | - | 1 | 32 | |
| Electrical installation work | 2 | - | - | 2 | - | 1 | 13 | - | 289 | |
| Information and communication construction work | - | 1 | - | - | - | 1 | 1 | - | 81 | |
| Firefighting system installation work | 1 | - | - | - | - | - | 1 | - | 8 | |
| Sum | 71 | 32 | 1 | 12 | 13 | 12 | 147 | 5 | 4337 | |
| Accident Type (Unit: ‱) | Electrical Shock | Slip | Fall | Hit | Collision | Jammed | Chemical Spill or Contact | Fire | Bumped | Drowned |
|---|---|---|---|---|---|---|---|---|---|---|
| Interior construction work | 0.00‱ | 0.02‱ | 0.22‱ | 0.03‱ | 0.01‱ | 0.02‱ | 0.00‱ | 0.01‱ | 0.00‱ | 0.00‱ |
| Earth work | 0.03‱ | 0.05‱ | 0.32‱ | 0.30‱ | 0.56‱ | 0.19‱ | 0.01‱ | 0.00‱ | 0.33‱ | 0.01‱ |
| Plaster, waterproof, and masonry construction work | 0.16‱ | 0.24‱ | 6.28‱ | 0.27‱ | 0.19‱ | 0.13‱ | 0.08‱ | 0.19‱ | 0.08‱ | 0.05‱ |
| Stone work | 0.00‱ | 0.00‱ | 1.38‱ | 0.54‱ | 0.25‱ | 0.08‱ | 0.00‱ | 0.00‱ | 0.29‱ | 0.00‱ |
| Painting work | 0.37‱ | 0.16‱ | 9.87‱ | 0.10‱ | 0.05‱ | 0.37‱ | 0.05‱ | 0.05‱ | 0.10‱ | 0.21‱ |
| Scaffold and demolition work | 0.70‱ | 0.60‱ | 17.87‱ | 2.75‱ | 3.20‱ | 1.10‱ | 0.05‱ | 0.20‱ | 0.70‱ | 0.25‱ |
| Metal structure and window construction work | 0.07‱ | 0.04‱ | 2.05‱ | 0.11‱ | 0.05‱ | 0.04‱ | 0.00‱ | 0.02‱ | 0.01‱ | 0.00‱ |
| Roofing, sheet metal, and fabrication construction work | 0.29‱ | 0.23‱ | 19.28‱ | 0.40‱ | 0.29‱ | 0.12‱ | 0.00‱ | 0.12‱ | 0.00‱ | 0.00‱ |
| Reinforced concrete construction work | 0.09‱ | 0.13‱ | 2.63‱ | 0.40‱ | 0.53‱ | 0.13‱ | 0.05‱ | 0.01‱ | 0.17‱ | 0.06‱ |
| Mechanical construction work | 0.10‱ | 0.02‱ | 0.91‱ | 0.07‱ | 0.03‱ | 0.16‱ | 0.09‱ | 0.12‱ | 0.04‱ | 0.03‱ |
| Water and sewerage work | 0.05‱ | 0.05‱ | 0.25‱ | 0.48‱ | 1.72‱ | 0.23‱ | 0.10‱ | 0.13‱ | 0.38‱ | 0.25‱ |
| Boring and grouting work | 0.08‱ | 0.00‱ | 0.08‱ | 0.00‱ | 0.08‱ | 0.00‱ | 0.00‱ | 0.00‱ | 0.00‱ | 0.08‱ |
| Railway and track work | 0.00‱ | 0.00‱ | 1.17‱ | 0.00‱ | 0.29‱ | 0.00‱ | 0.00‱ | 0.00‱ | 3.22‱ | 2.05‱ |
| Road pavement work | 0.10‱ | 0.26‱ | 0.47‱ | 0.41‱ | 0.10‱ | 0.57‱ | 0.05‱ | 0.00‱ | 3.15‱ | 0.00‱ |
| Subaqueous work | 0.00‱ | 0.13‱ | 0.13‱ | 0.25‱ | 0.13‱ | 0.38‱ | 0.00‱ | 0.00‱ | 0.13‱ | 1.63‱ |
| Landscaping work | 0.07‱ | 0.10‱ | 0.72‱ | 0.24‱ | 0.03‱ | 0.03‱ | 0.00‱ | 0.00‱ | 0.34‱ | 0.00‱ |
| Landscape architectural facilities setting work | 0.00‱ | 0.11‱ | 0.11‱ | 0.05‱ | 0.05‱ | 0.00‱ | 0.00‱ | 0.00‱ | 0.05‱ | 0.00‱ |
| Structural steel work | 0.05‱ | 0.11‱ | 5.88‱ | 0.59‱ | 0.41‱ | 0.14‱ | 0.00‱ | 0.00‱ | 0.14‱ | 0.00‱ |
| Cableway installation work | 0.00‱ | 0.00‱ | 0.00‱ | 14.91‱ | 0.00‱ | 0.00‱ | 0.00‱ | 0.00‱ | 0.00‱ | 0.00‱ |
| Dredging work | 0.23‱ | 0.00‱ | 0.46‱ | 0.23‱ | 0.70‱ | 0.00‱ | 0.00‱ | 0.00‱ | 0.23‱ | 0.93‱ |
| Elevator and escalator installation work | 0.35‱ | 0.00‱ | 9.15‱ | 1.41‱ | 0.00‱ | 0.00‱ | 0.00‱ | 0.35‱ | 0.00‱ | 0.00‱ |
| Gas facility construction work | 0.00‱ | 0.00‱ | 0.27‱ | 0.03‱ | 0.08‱ | 0.03‱ | 0.08‱ | 0.13‱ | 0.08‱ | 0.03‱ |
| Heating system construction work | 0.07‱ | 0.07‱ | 0.37‱ | 0.07‱ | 0.00‱ | 0.15‱ | 0.00‱ | 0.00‱ | 0.07‱ | 0.00‱ |
| Facilities maintenance work | 0.02‱ | 0.00‱ | 0.39‱ | 0.04‱ | 0.08‱ | 0.02‱ | 0.00‱ | 0.02‱ | 0.00‱ | 0.02‱ |
| Electrical installation work | 0.81‱ | 0.05‱ | 1.04‱ | 0.05‱ | 0.05‱ | 0.07‱ | 0.02‱ | 0.02‱ | 0.11‱ | 0.00‱ |
| Information and communication construction work | 0.11‱ | 0.01‱ | 0.51‱ | 0.05‱ | 0.02‱ | 0.01‱ | 0.02‱ | 0.00‱ | 0.05‱ | 0.01‱ |
| Firefighting system installation work | 0.02‱ | 0.00‱ | 0.06‱ | 0.00‱ | 0.02‱ | 0.02‱ | 0.00‱ | 0.00‱ | 0.00‱ | 0.00‱ |
| Average | 0.18‱ | 0.08‱ | 2.33‱ | 0.28‱ | 0.34‱ | 0.15‱ | 0.04‱ | 0.05‱ | 0.22‱ | 0.06‱ |
| Accident Type (Unit: ‱) | Explosion | Hypoxia | Violence | Contact of Abnormal Temperature | Cut | Animal Injury | Fall Beneath | Non- Categorization | Sum | |
| Interior construction work | 0.00‱ | 0.00‱ | 0.00‱ | 0.00‱ | 0.00‱ | 0.00‱ | 0.01‱ | 0.00‱ | 0.31‱ | |
| Earth work | 0.01‱ | 0.00‱ | 0.00‱ | 0.00‱ | 0.01‱ | 0.02‱ | 0.18‱ | 0.00‱ | 2.00‱ | |
| Plaster, waterproof, and masonry construction work | 0.13‱ | 0.00‱ | 0.00‱ | 0.00‱ | 0.00‱ | 0.00‱ | 0.13‱ | 0.03‱ | 7.95‱ | |
| Stone work | 0.00‱ | 0.00‱ | 0.00‱ | 0.00‱ | 0.00‱ | 0.04‱ | 0.08‱ | 0.00‱ | 2.68‱ | |
| Painting work | 0.00‱ | 0.05‱ | 0.00‱ | 0.05‱ | 0.00‱ | 0.00‱ | 0.05‱ | 0.00‱ | 11.50‱ | |
| Scaffold and demolition work | 0.20‱ | 0.10‱ | 0.00‱ | 0.00‱ | 0.05‱ | 0.10‱ | 1.00‱ | 0.00‱ | 28.88‱ | |
| Metal structure and window construction work | 0.09‱ | 0.00‱ | 0.00‱ | 0.00‱ | 0.00‱ | 0.00‱ | 0.01‱ | 0.00‱ | 2.49‱ | |
| Roofing, sheet metal, and fabrication construction work | 0.00‱ | 0.00‱ | 0.00‱ | 0.00‱ | 0.00‱ | 0.00‱ | 0.12‱ | 0.00‱ | 20.83‱ | |
| Reinforced concrete construction work | 0.04‱ | 0.03‱ | 0.01‱ | 0.01‱ | 0.05‱ | 0.00‱ | 0.23‱ | 0.01‱ | 4.56‱ | |
| Mechanical construction work | 0.23‱ | 0.08‱ | 0.00‱ | 0.03‱ | 0.01‱ | 0.00‱ | 0.06‱ | 0.01‱ | 1.99‱ | |
| Water and sewerage work | 0.00‱ | 0.23‱ | 0.00‱ | 0.00‱ | 0.03‱ | 0.00‱ | 0.15‱ | 0.00‱ | 4.04‱ | |
| Boring and grouting work | 0.00‱ | 0.00‱ | 0.00‱ | 0.00‱ | 0.00‱ | 0.00‱ | 0.00‱ | 0.00‱ | 0.31‱ | |
| Railway and track work | 0.00‱ | 0.00‱ | 0.00‱ | 0.00‱ | 0.00‱ | 0.00‱ | 0.00‱ | 0.00‱ | 6.74‱ | |
| Road pavement work | 0.00‱ | 0.00‱ | 0.00‱ | 0.05‱ | 0.00‱ | 0.05‱ | 0.31‱ | 0.00‱ | 5.53‱ | |
| Subaqueous work | 0.00‱ | 0.00‱ | 0.00‱ | 0.00‱ | 0.00‱ | 0.00‱ | 0.00‱ | 0.00‱ | 2.76‱ | |
| Landscaping work | 0.00‱ | 0.00‱ | 0.00‱ | 0.00‱ | 0.00‱ | 0.07‱ | 0.27‱ | 0.00‱ | 1.88‱ | |
| Landscape architectural facilities setting work | 0.00‱ | 0.00‱ | 0.00‱ | 0.00‱ | 0.00‱ | 0.00‱ | 0.00‱ | 0.00‱ | 0.37‱ | |
| Structural steel work | 0.00‱ | 0.00‱ | 0.00‱ | 0.02‱ | 0.02‱ | 0.00‱ | 0.14‱ | 0.00‱ | 7.49‱ | |
| Cableway installation work | 0.00‱ | 0.00‱ | 0.00‱ | 0.00‱ | 0.00‱ | 0.00‱ | 0.00‱ | 0.00‱ | 14.91‱ | |
| Dredging work | 0.00‱ | 0.00‱ | 0.00‱ | 0.00‱ | 0.00‱ | 0.00‱ | 0.23‱ | 0.00‱ | 3.02‱ | |
| Elevator and escalator installation work | 0.00‱ | 0.00‱ | 0.00‱ | 0.00‱ | 0.00‱ | 0.00‱ | 0.00‱ | 0.00‱ | 11.27‱ | |
| Gas facility construction work | 0.05‱ | 0.00‱ | 0.00‱ | 0.00‱ | 0.00‱ | 0.00‱ | 0.00‱ | 0.00‱ | 0.77‱ | |
| Heating system construction work | 0.00‱ | 0.00‱ | 0.00‱ | 0.07‱ | 0.00‱ | 0.00‱ | 0.00‱ | 0.00‱ | 0.89‱ | |
| Facilities maintenance work | 0.00‱ | 0.00‱ | 0.00‱ | 0.00‱ | 0.00‱ | 0.02‱ | 0.00‱ | 0.02‱ | 0.63‱ | |
| Electrical installation work | 0.02‱ | 0.00‱ | 0.00‱ | 0.02‱ | 0.00‱ | 0.01‱ | 0.11‱ | 0.00‱ | 2.35‱ | |
| Information and communication construction work | 0.00‱ | 0.01‱ | 0.00‱ | 0.00‱ | 0.00‱ | 0.01‱ | 0.01‱ | 0.00‱ | 0.83‱ | |
| Firefighting system installation work | 0.02‱ | 0.00‱ | 0.00‱ | 0.00‱ | 0.00‱ | 0.00‱ | 0.02‱ | 0.00‱ | 0.17‱ | |
| Average | 0.07‱ | 0.03‱ | 0.00‱ | 0.01‱ | 0.01‱ | 0.01‱ | 0.14‱ | 0.00‱ | 4.02‱ | |
Publisher’s Note: MDPI stays neutral with regard to jurisdictional claims in published maps and institutional affiliations. |
© 2022 by the authors. Licensee MDPI, Basel, Switzerland. This article is an open access article distributed under the terms and conditions of the Creative Commons Attribution (CC BY) license (https://creativecommons.org/licenses/by/4.0/).
Share and Cite
Jeong, J.; Jeong, J. Comparative Analysis of Degree of Risk between the Frequency Aspect and Probability Aspect Using Integrated Uncertainty Method Considering Work Type and Accident Type in Construction Industry. Appl. Sci. 2022, 12, 1131. https://doi.org/10.3390/app12031131
Jeong J, Jeong J. Comparative Analysis of Degree of Risk between the Frequency Aspect and Probability Aspect Using Integrated Uncertainty Method Considering Work Type and Accident Type in Construction Industry. Applied Sciences. 2022; 12(3):1131. https://doi.org/10.3390/app12031131
Chicago/Turabian StyleJeong, Jaemin, and Jaewook Jeong. 2022. "Comparative Analysis of Degree of Risk between the Frequency Aspect and Probability Aspect Using Integrated Uncertainty Method Considering Work Type and Accident Type in Construction Industry" Applied Sciences 12, no. 3: 1131. https://doi.org/10.3390/app12031131