
Evolution of Shear Band in Plane Strain Compression of Naturally Structured Clay with a High Sensitivity


Abstract
:1. Introduction
2. Materials and Methods
2.1. DIC Technique
2.2. Material
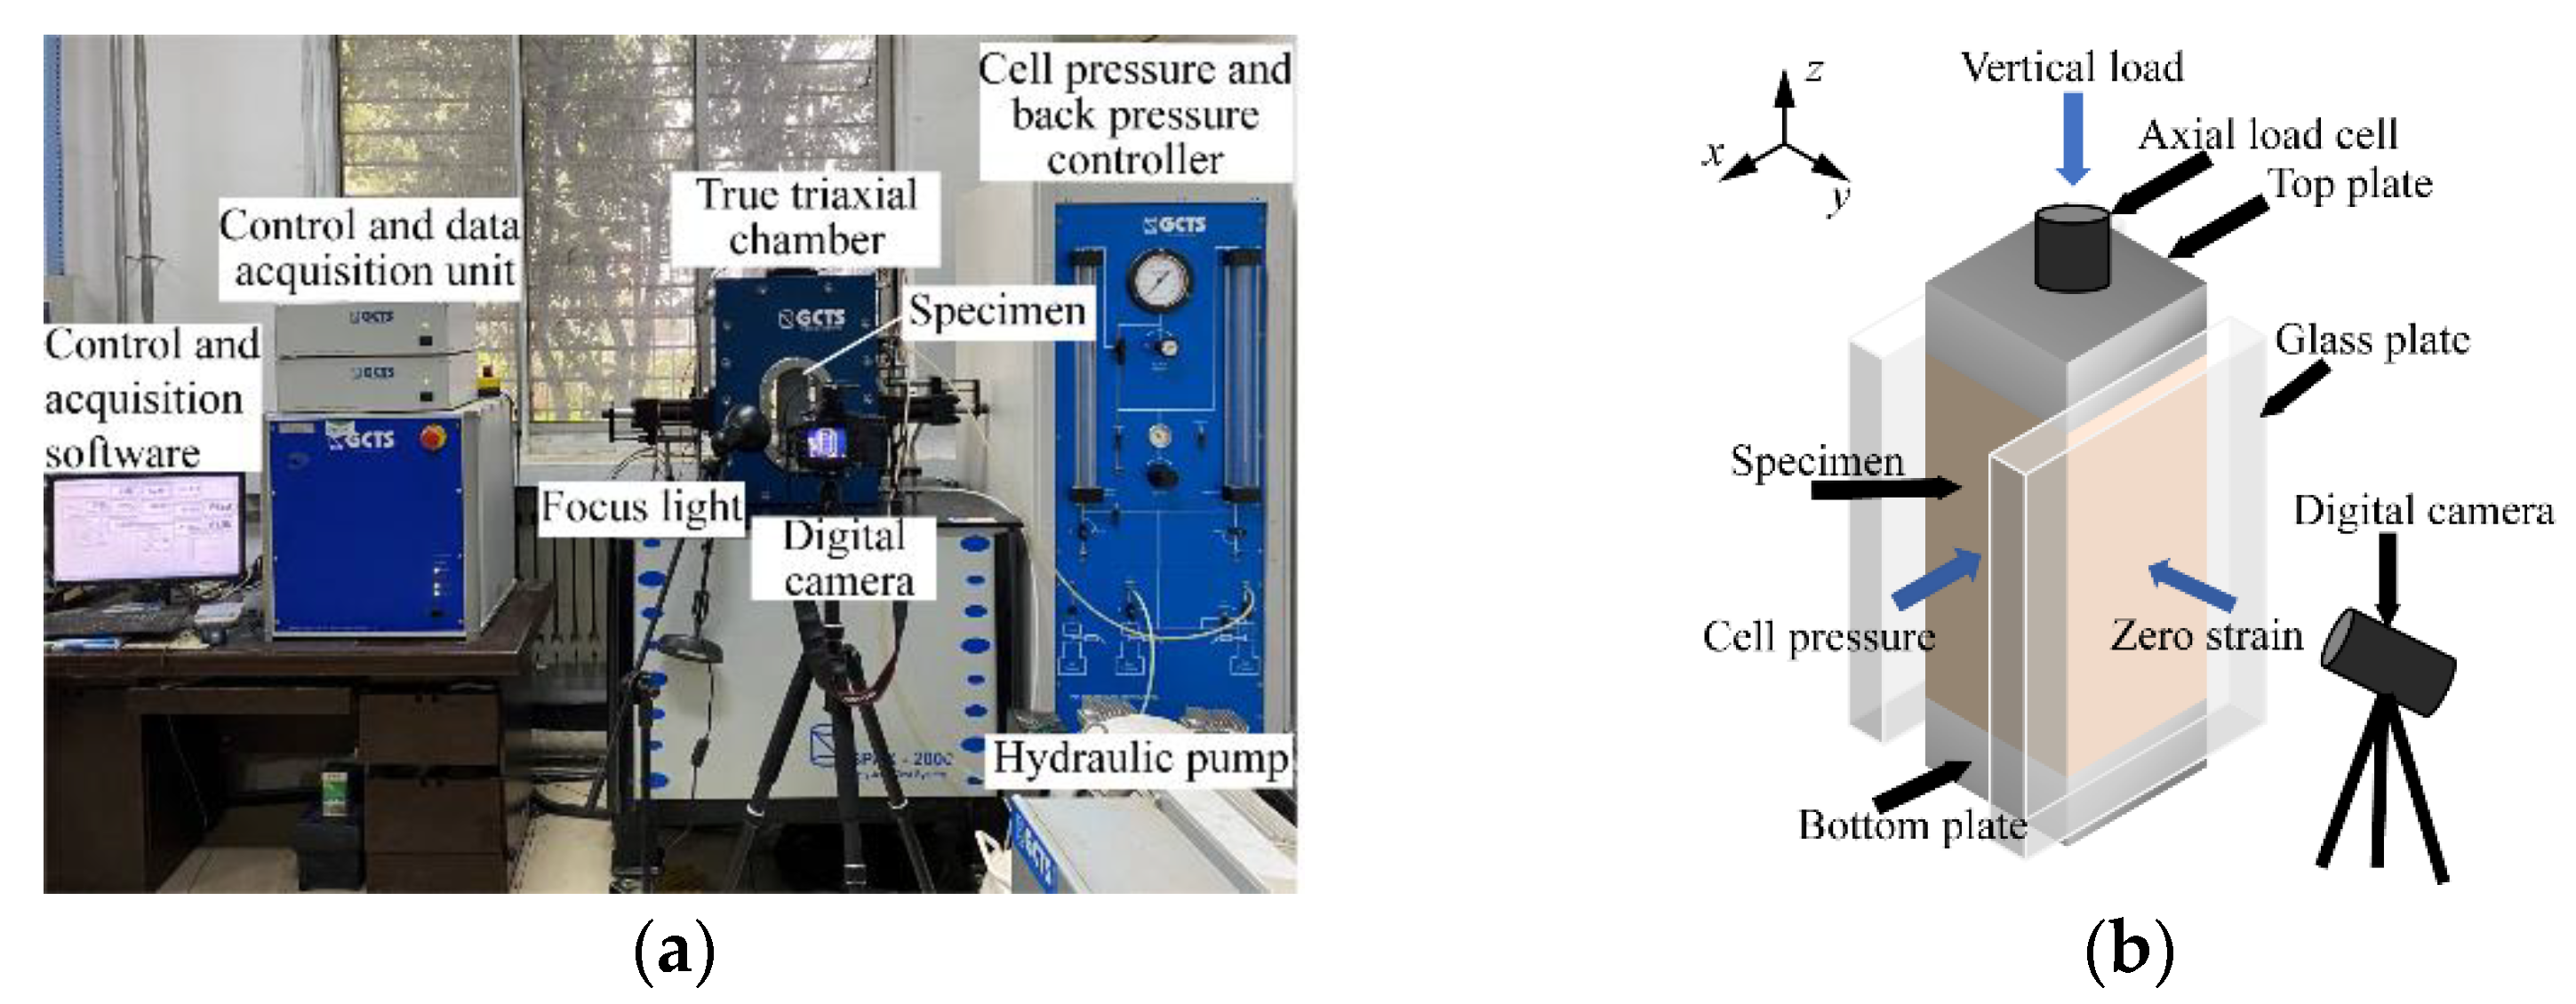
2.3. Test Apparatus
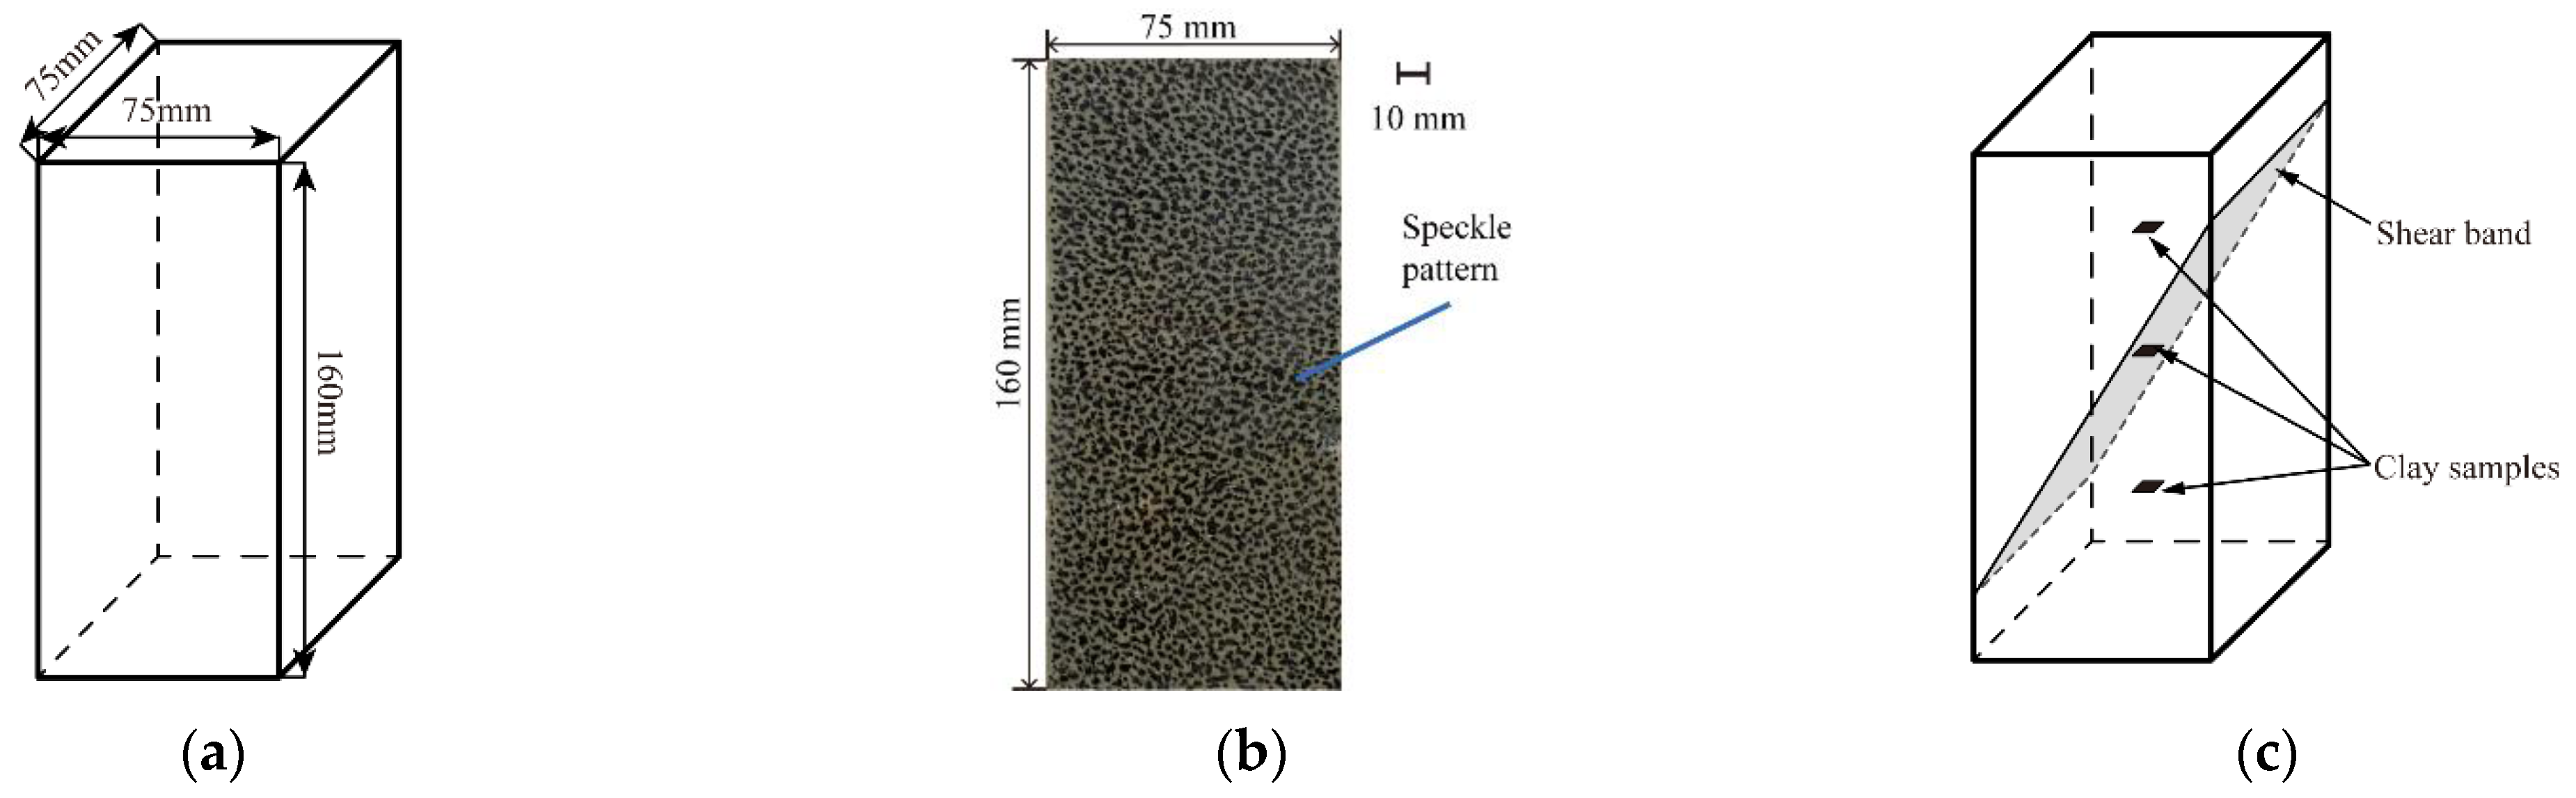
2.4. Sample Preparation and Test Procedure
3. Results
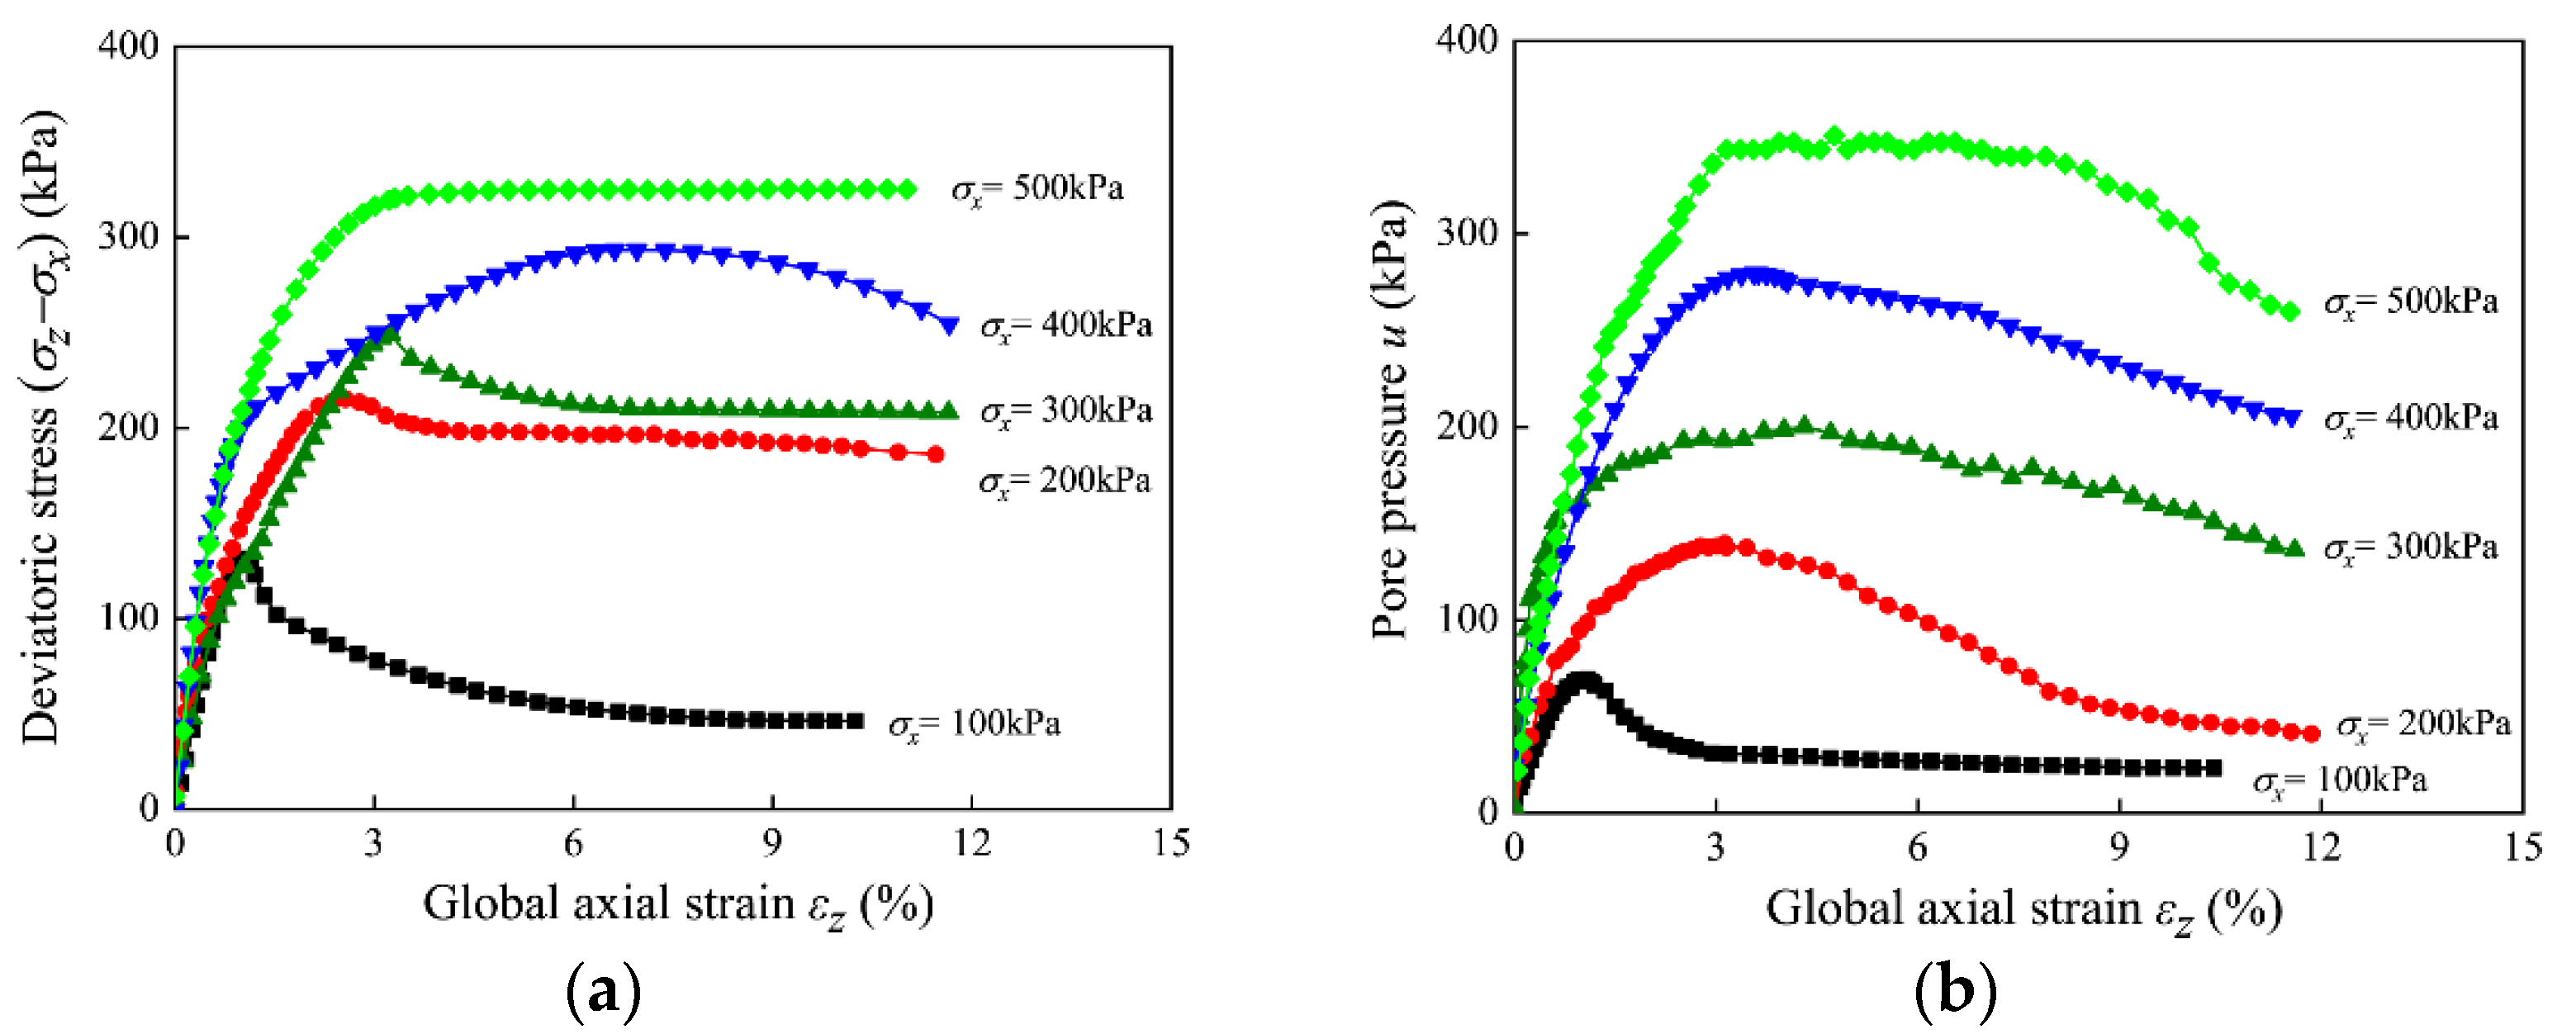
3.1. Stress–Strain and Pore Water Pressure Behavior
3.2. Characteristics of Shear Band
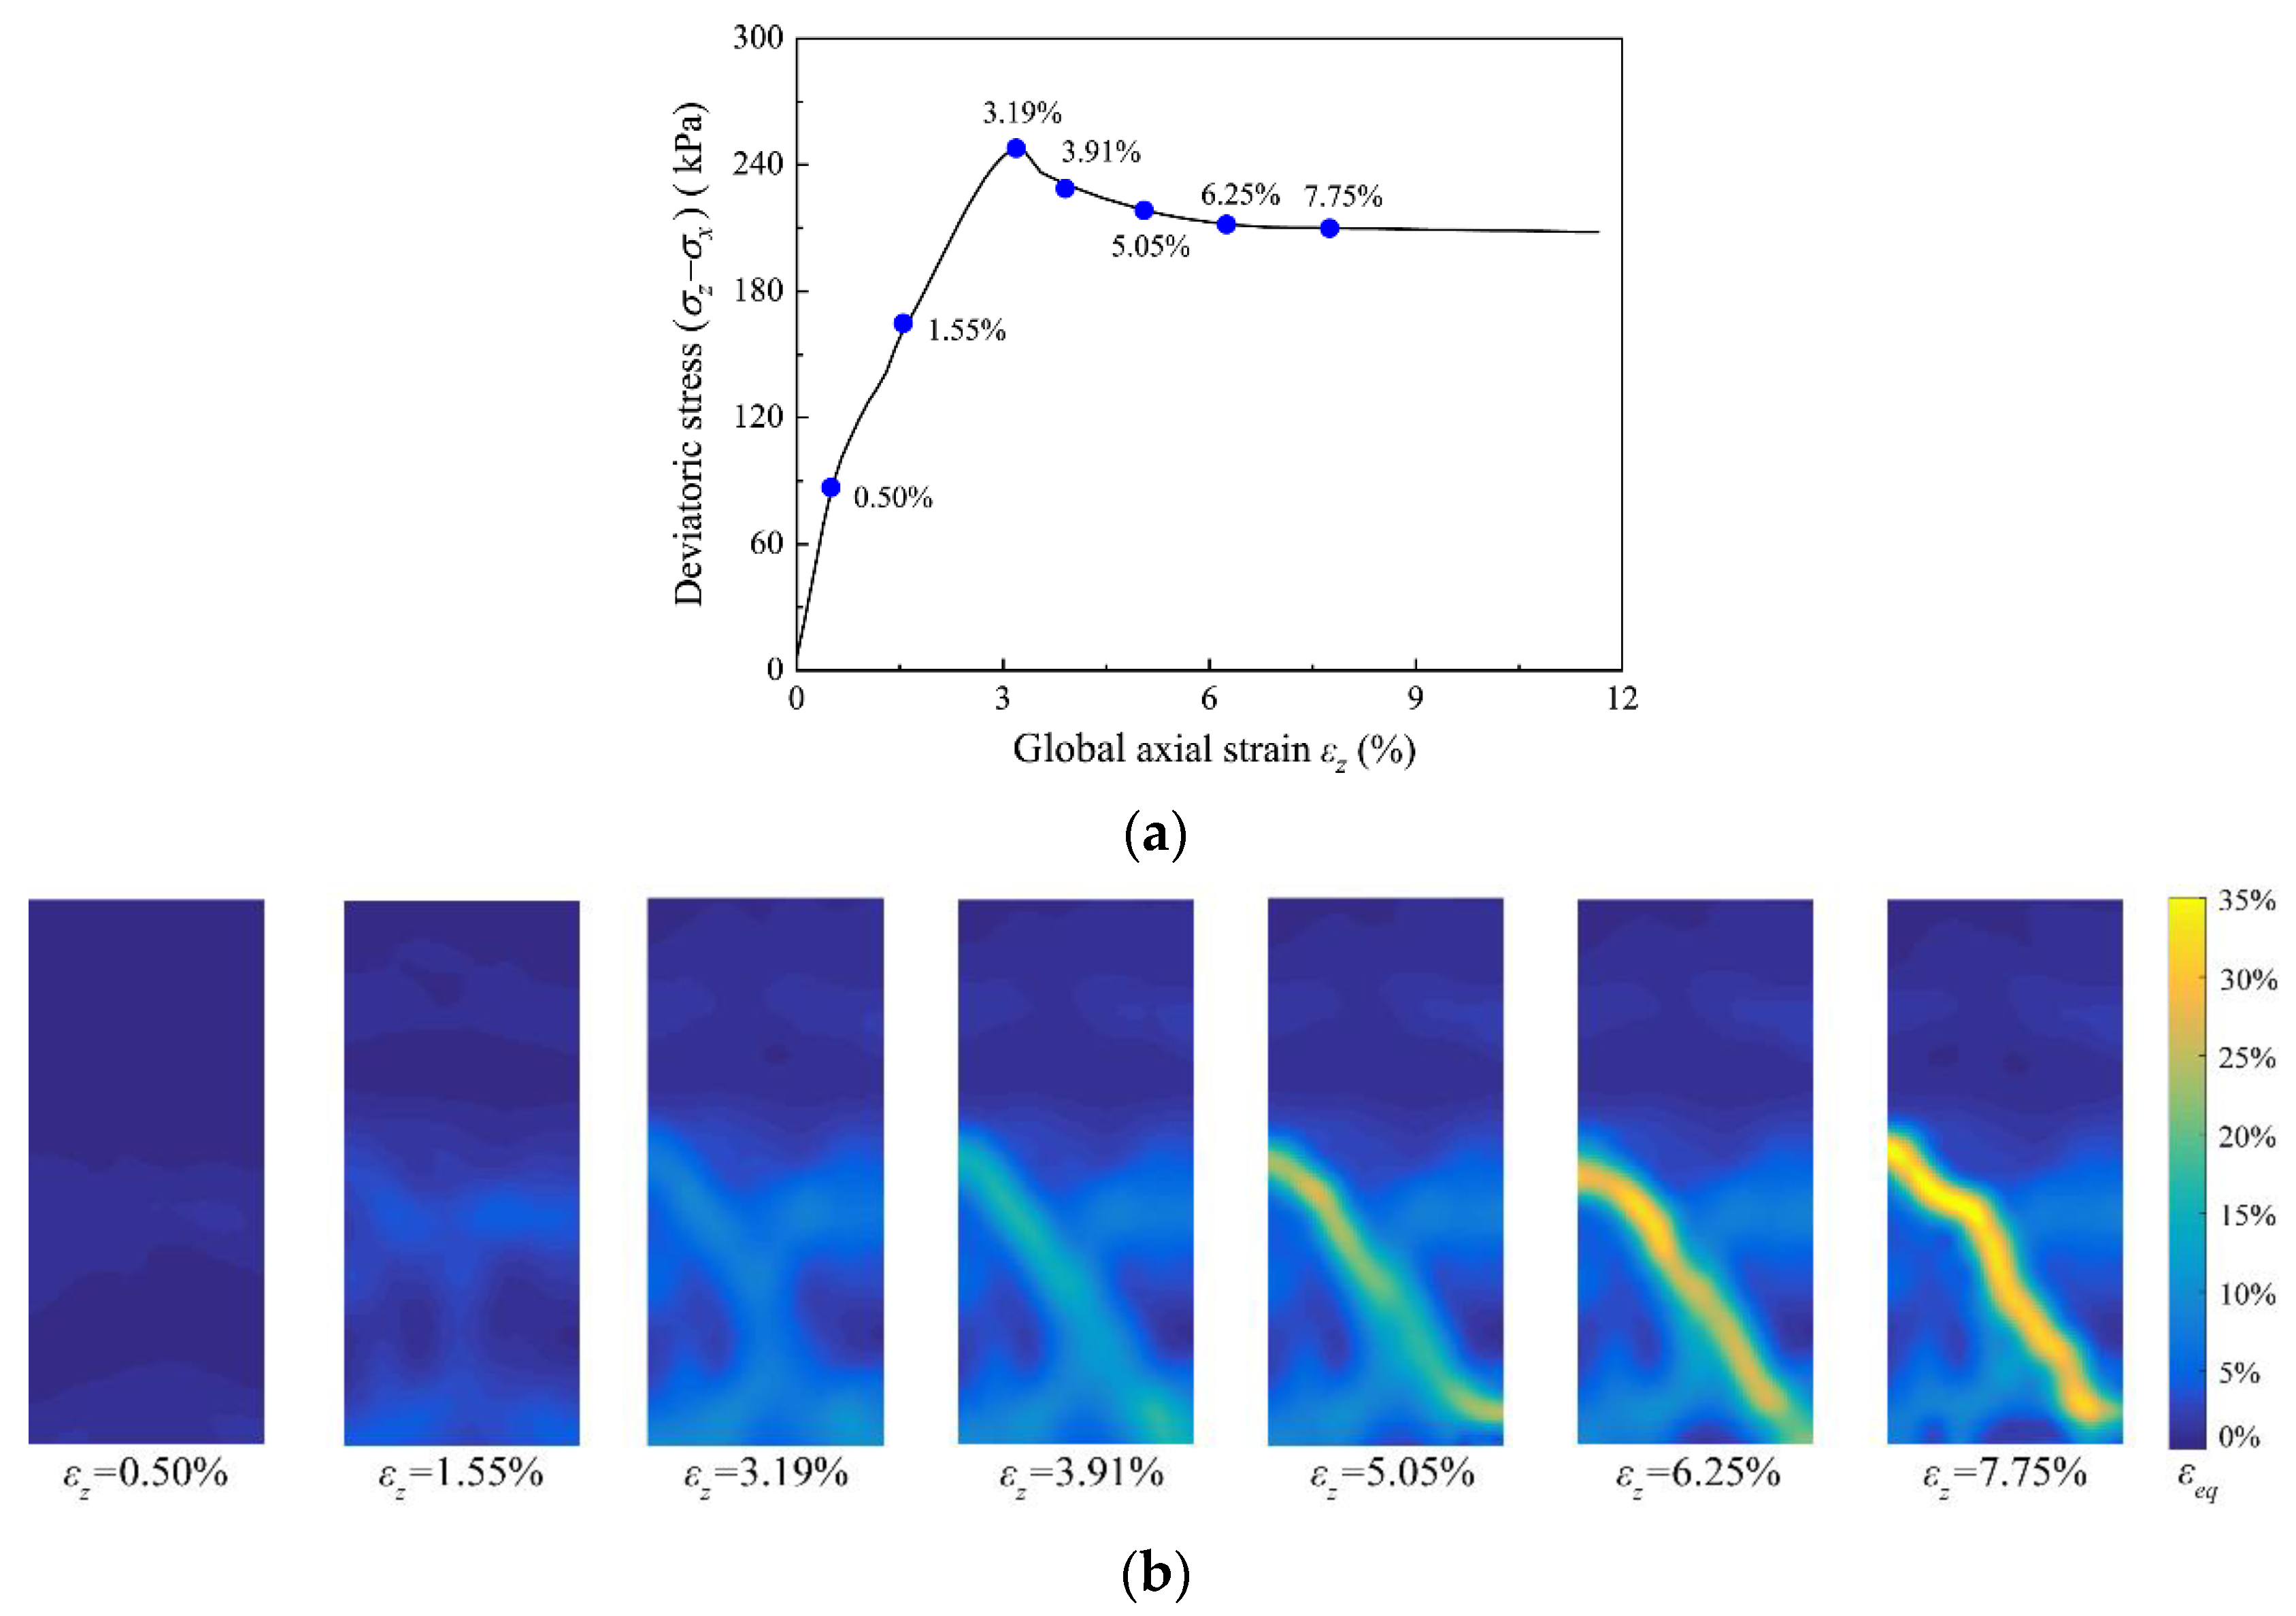
3.2.1. Evolution of Shear Bands
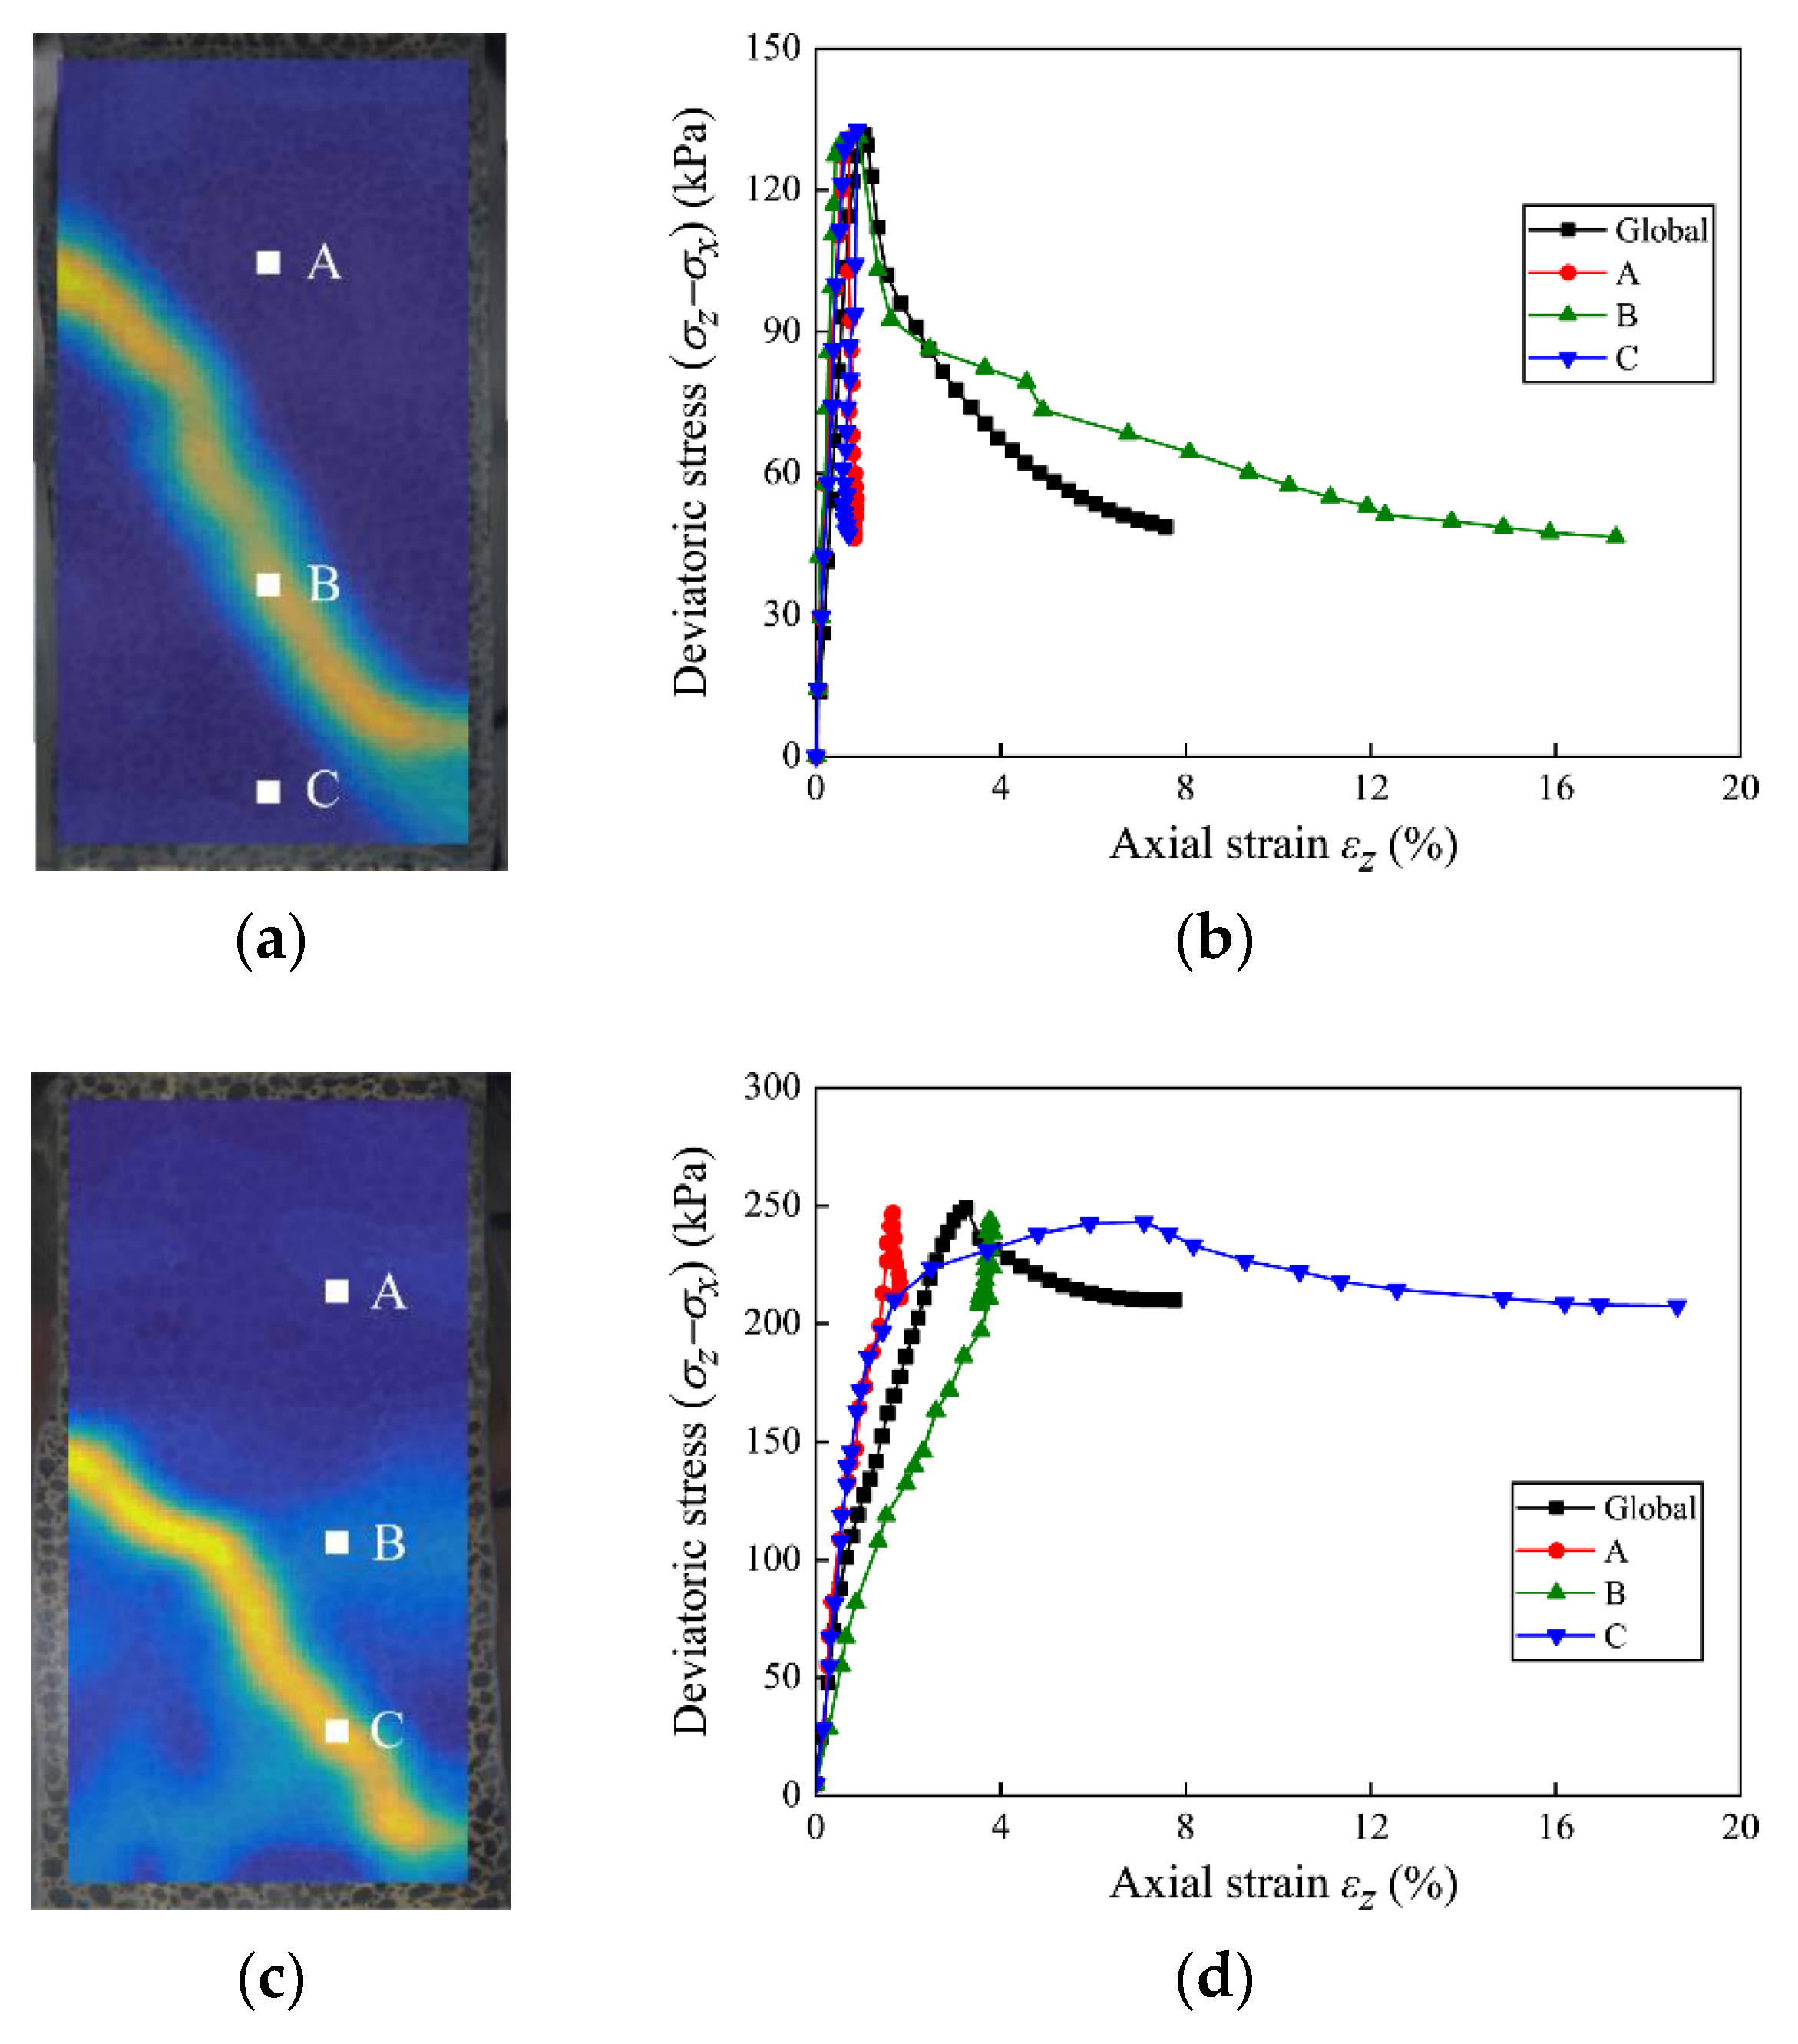
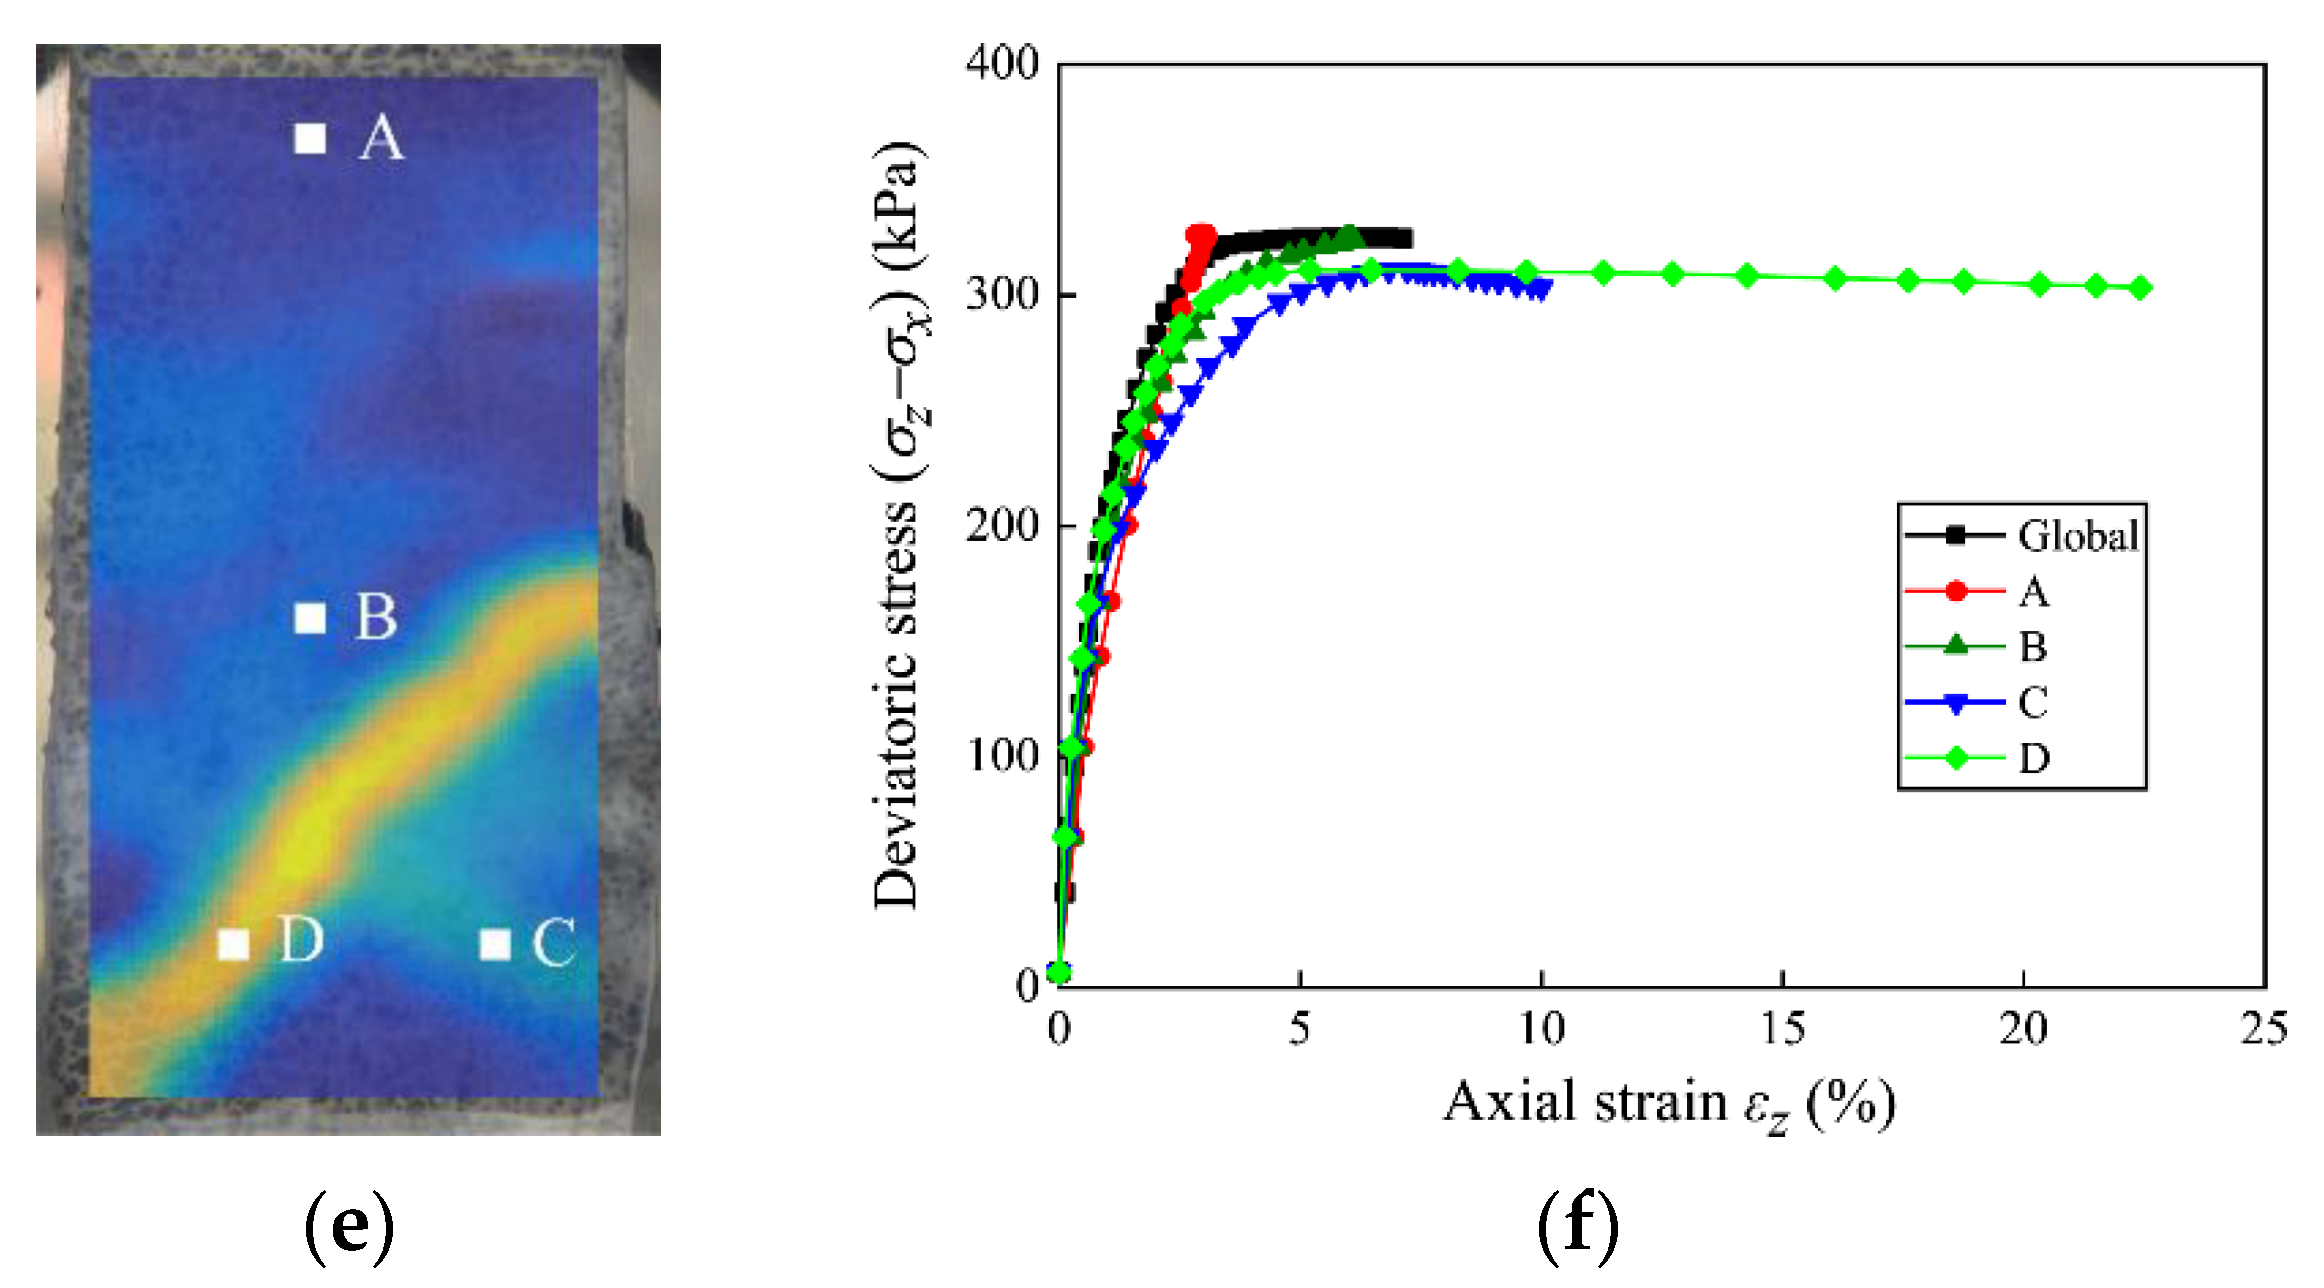
3.2.2. Local Stress–Strain Relationship
3.2.3. Inclinations of Shear Bands
4. Discussion
5. Conclusions
- (1)
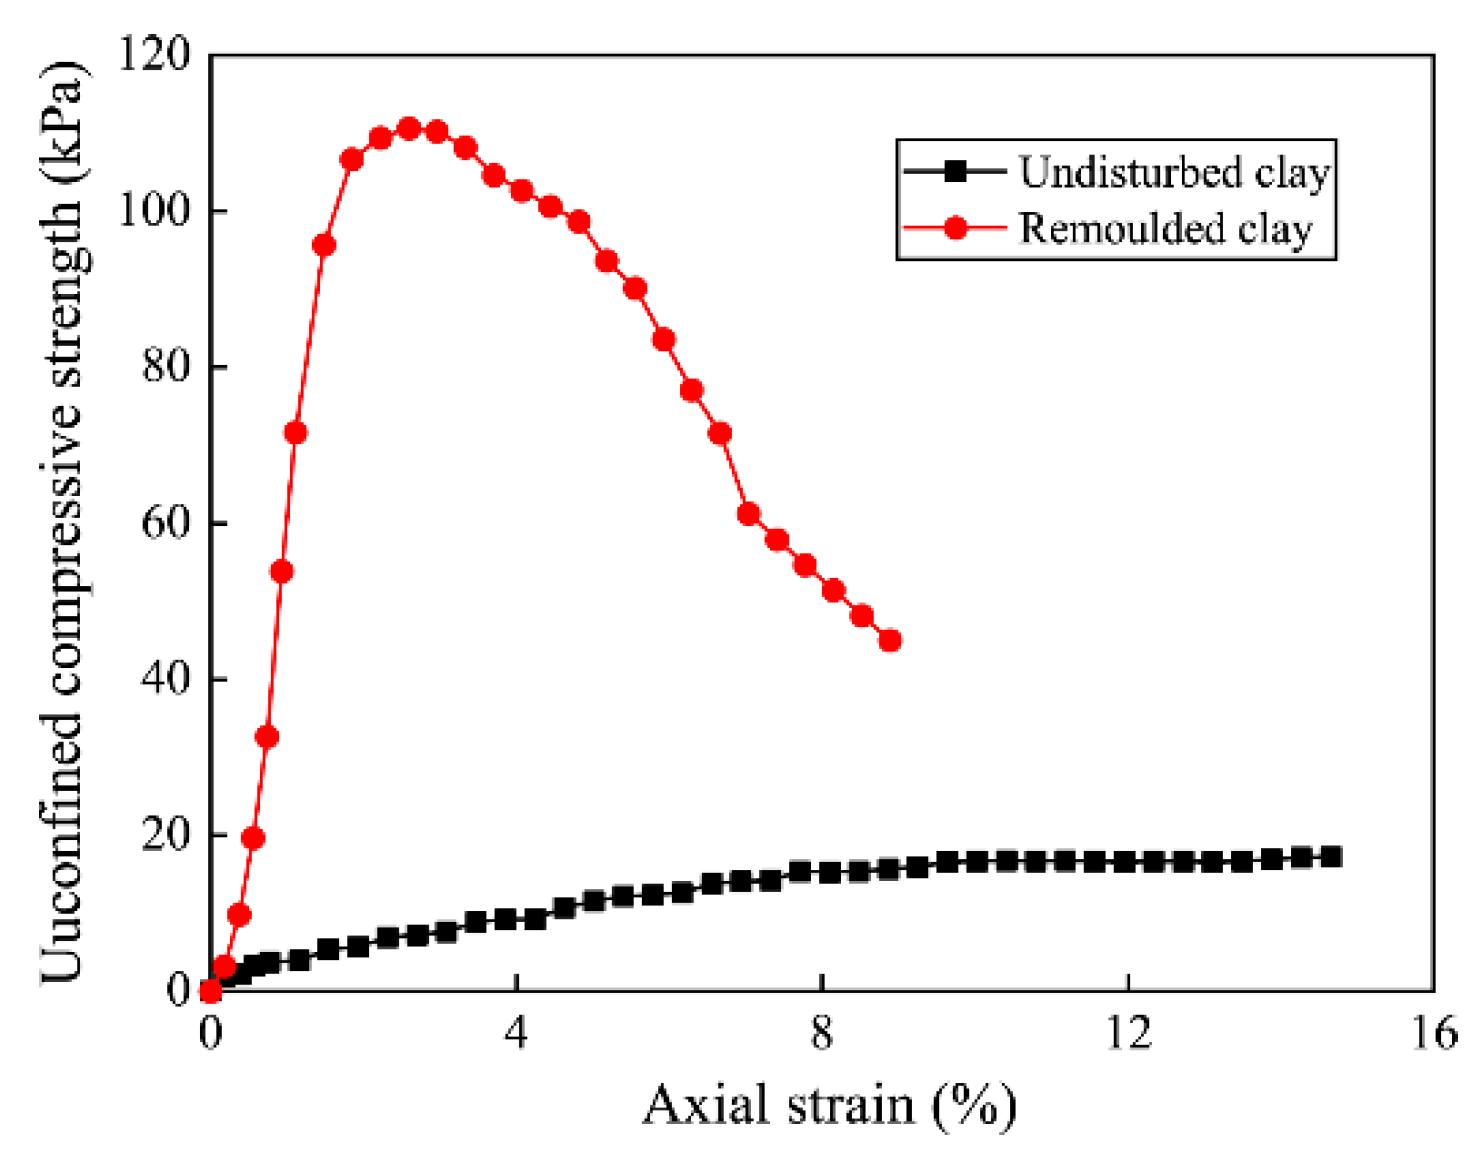
- The basic mechanical properties and representative stress–strain behavior indicates that Zhanjiang clay is a typical naturally structured clay. The mechanical properties of specimens under consolidation stress lower and higher than yield stress differ significantly.
- (2)
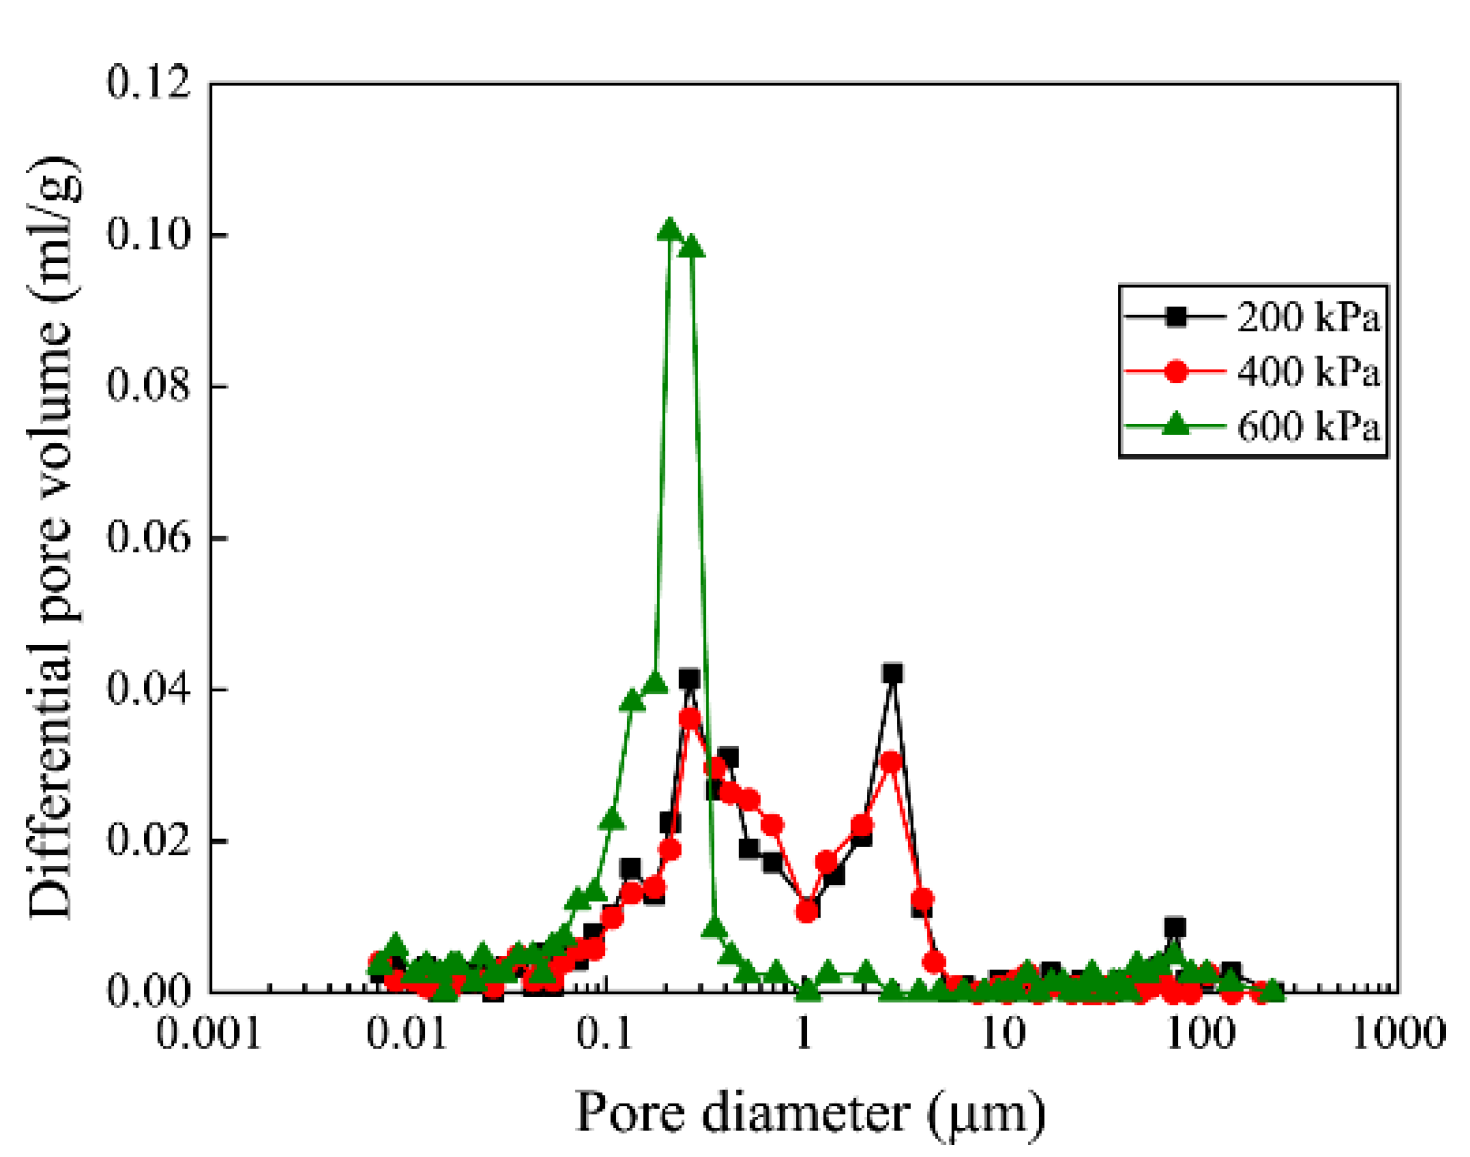
- When = 100 kPa, only one localized shear band appears in the specimen. However, when = 300 and 500 kPa, several localized shear bands appear in the specimens during the plane strain compression tests, and the shear strain distribution is much more complicated when = 500 kPa. When the specimens fail, only one shear band is fully developed for all specimens, and the shear strain in the developed shear band is much larger than those in the other localized shear bands. Based on the results of MIP tests, the change in pore size distribution might have contributed to the different strain distributions in the specimens consolidated at different confining pressures. The measured inclination of the shear bands in the T1, T3, and T5 tests are similar to the inclinations calculated based on the Mohr–Coulomb theory.
- (3)
- Before the peak deviatoric stress, the local strain in the specimens is relatively uniform, and the local stress–strain curves for regions inside and outside the shear band are similar. However, strain localization emerges subsequently, and the local stress–strain curves for regions inside and outside the shear band are distinct after the peak deviatoric stress.
- (4)
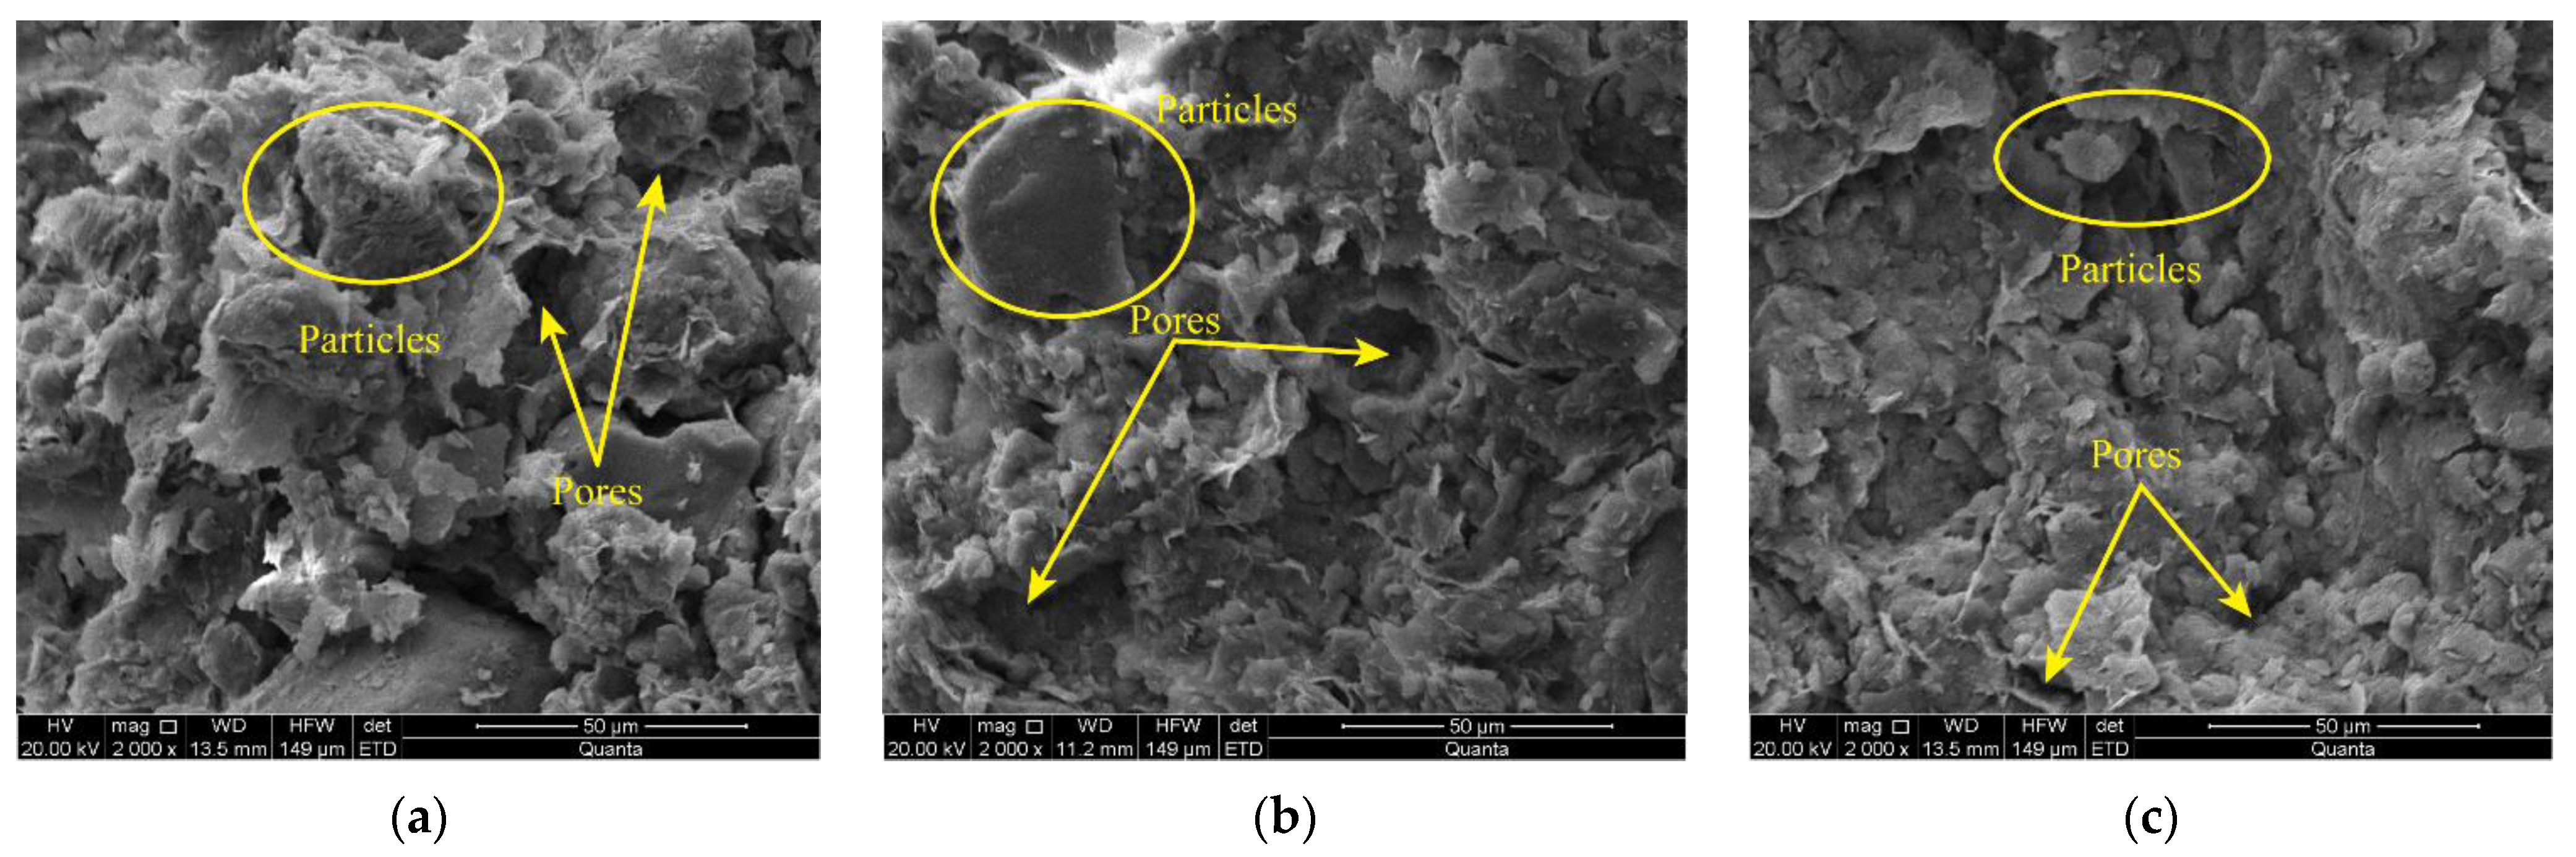
- The SEM results indicate that the micro-structures inside and outside the shear band can be distinguished. The overall particle size and pore size outside the shear band are larger than those in the shear band, and the number of particles outside the shear band is lower than that in the shear band, owing to strain localization and development of the shear band.
Author Contributions
Funding
Institutional Review Board Statement
Informed Consent Statement
Data Availability Statement
Conflicts of Interest
References
- Alshibli, K.A.; Sture, S. Shear band formation in plane strain experiments of sand. J. Geotech. Geoenviron. Eng. 2000, 126, 495–503. [Google Scholar] [CrossRef]
- Torabi, A.; Braathen, A.; Cuisiat, F.; Fossen, H. Shear zones in porous sand: Insights from ring-shear experiments and naturally deformed sandstones. Tectonophysics 2007, 437, 37–50. [Google Scholar] [CrossRef] [Green Version]
- Sadrekarimi, A.; Olson, S.M. Shear Band Formation Observed in Ring Shear Tests on Sandy Soils. J. Geotech. Geoenviron. Eng. 2010, 136, 366–375. [Google Scholar] [CrossRef]
- Wang, P.; Sang, Y.; Shao, L.; Guo, X. Measurement of the deformation of sand in a plane strain compression experiment using incremental digital image correlation. Acta Geotech. 2019, 14, 547–557. [Google Scholar] [CrossRef]
- Chai, J.C.; Jia, R.; Nie, J.X.; Aiga, K.; Negami, T.; Hino, T. 1D deformation induced permeability and microstructural anisotropy of Ariake clays. Geomech. Eng. 2015, 8, 81–95. [Google Scholar] [CrossRef]
- Leroueil, S.; Kabbaj, M.; Tavenas, F.; Bouchard, R. Stress-strain strain rate relation for the compressibility of sensitive natural clays. Geotechnique 1985, 35, 159–180. [Google Scholar] [CrossRef]
- Burland, J.B.; Rampello, S.; Georgiannou, V.N.; Calabresi, G. A laboratory study of the strength of four stiff clays. Geotechnique 1996, 46, 491–514. [Google Scholar] [CrossRef]
- Zhi, Y.; Kong, L.; Guo, A.; Tan, L. Occurrence and engineering properties of structural soft clay in Zhanjiang area. Rock Soil Mech. 2004, 25, 1879–1884. [Google Scholar]
- Wang, D.X.; Korkiala-Tanttu, L. On the normalized behavior of naturally and artificially structured clays. Eng. Geol. 2016, 214, 20–28. [Google Scholar] [CrossRef]
- Zhou, H.B.; Cai, L.B.; Gao, W.J. Statistical analysis of the accidents of foundation pit of the urban mass rail transit station. Hydrogeol. Eng. Geol. 2009, 36, 67–71. [Google Scholar]
- Wei, L.T.; Qiang, X.; Wang, S.Y.; Wang, C.L.; Xu, J. The morphology evolution of the shear band in slope: Insights from physical modelling using transparent soil. Bull. Eng. Geol. Environ. 2020, 79, 1849–1860. [Google Scholar] [CrossRef]
- Elkamhawy, E.; Wang, H.; Zhou, B.; Yang, Z. Failure mechanism of a slope with a thin soft band triggered by intensive rainfall. Environ. Earth Sci. 2018, 77, 340. [Google Scholar] [CrossRef]
- Zhang, G.; Hu, Y.; Wang, L.P. Behaviour and mechanism of failure process of soil slopes. Environ. Earth Sci. 2015, 73, 1701–1713. [Google Scholar] [CrossRef]
- Saada, A.S.; Bianchini, G.F.; Liang, L.Q. Cracks, bifurcation and shear bands propagation in saturated clays. Geotechnique 1994, 44, 35–64. [Google Scholar] [CrossRef]
- Gylland, A.; Jostad, H.; Nordal, S. Experimental study of strain localization in sensitive clays. Acta Geotech. 2014, 9, 227–240. [Google Scholar] [CrossRef]
- Zhang, W.C.; Wang, D. Stability analysis of cut slope with shear band propagation along a weak layer. Comput. Geotech. 2020, 125, 103676. [Google Scholar] [CrossRef]
- Thomas, T.Y. Plastic flow and fracture in solids. J. Math. Mech. 1958, 7, 291–322. [Google Scholar] [CrossRef]
- Li, B.; Zhao, X.; Dong, J. Experimental study on shear band inclination in Shanghai clay. Rock Soil Mech. 2002, 23, 423–427. [Google Scholar]
- Yuan, J.; Zhang, Q.; Li, B.; Zhao, X. Experimental analysis of shear band formation in plane strain tests on Shanghai silty clay. Bull. Eng. Geol. Environ. 2013, 72, 107–114. [Google Scholar] [CrossRef]
- Feng, Z.K.; Xu, W.J.; Meng, Q.S. Mechanical behaviors of interaction between coral sand and structure surface. J. Cent. South Univ. 2020, 27, 3436–3449. [Google Scholar] [CrossRef]
- Gylland, A.S.; Rueslatten, H.; Paniagua, P.; Nordal, S. Microscopy Techniques for Viewing the Inner Structure of Shear Bands in Sensitive Clays. Geotech. Test. J. 2016, 39, 688–694. [Google Scholar] [CrossRef]
- Li, C.; Shu, R. Accurate and simple digital volume correlation using pre-interpolation. Meas. Sci. Technol. 2020, 31, 095201. [Google Scholar] [CrossRef]
- Li, C.S.; Kong, L.W.; Shu, R.J.; An, R.; Jia, H.B. Dynamic three-dimensional imaging and digital volume correlation analysis to quantify shear bands in grus. Mech. Mater. 2020, 151, 10364. [Google Scholar] [CrossRef]
- Alikarami, R.; Ando, E.; Gkiousas-Kapnisis, M.; Torabi, A.; Viggiani, G. Strain localisation and grain breakage in sand under shearing at high mean stress: Insights from in situ X-ray tomography. Acta Geotech. 2015, 10, 15–30. [Google Scholar] [CrossRef]
- Cheng, Z.; Wang, J.F. Experimental investigation of inter-particle contact evolution of sheared granular materials using X-ray micro-tomography. Soils Found. 2018, 58, 1492–1510. [Google Scholar] [CrossRef]
- Thakur, V.; Nordal, S.; Viggiani, G.; Charrier, P. Shear bands in undrained plane strain compression of Norwegian quick clays. Can. Geotech. J. 2018, 55, 45–56. [Google Scholar] [CrossRef] [Green Version]
- Rudnicki, J.W.; Rice, J.R. Conditions for localization of deformation in pressure-sensitive dilatant materials. J. Mech. Phys. Solids 1975, 23, 371–394. [Google Scholar] [CrossRef]
- Wanatowski, D.; Chu, J.; Loke, W.L. Drained instability of sand in plane strain. Can. Geotech. J. 2010, 47, 400–412. [Google Scholar] [CrossRef]
- Chu, J.; Wanatowski, D. Instability conditions of loose sand in plane strain. J. Geotech. Geoenviron. Eng. 2008, 134, 136–142. [Google Scholar] [CrossRef]
- Hong, Z.S.; Zeng, L.L.; Cui, Y.J.; Cai, Y.Q.; Lin, C. Compression behaviour of natural and reconstituted clays. Geotechnique 2012, 62, 291–301. [Google Scholar] [CrossRef] [Green Version]
- Rosenqvist, I.T. Considerations on the Sensitivity of Norwegian Quick-Clays. Geotechnique 1953, 3, 195–200. [Google Scholar] [CrossRef]
- Zhang, X.W.; Kong, L.W.; Cui, X.L.; Yin, S. Occurrence characteristics of free iron oxides in soil microstructure: Evidence from XRD, SEM and EDS. Bull. Eng. Geol. Environ. 2016, 75, 1493–1503. [Google Scholar] [CrossRef]
- Kong, L.W.; Zang, M.; Guo, A.G.; Tuo, Y.F. Effect of stress path on strength properties of Zhanjiang strong structured clay. Rock Soil Mech. 2015, 36, 19–24. [Google Scholar]
- Roscoe, K.H. The Influence of Strains in Soil Mechanics. Geotechnique 1970, 20, 129–170. [Google Scholar] [CrossRef]
- Arthur, J.R.F.; Dunstan, T.; Alani, Q.; Assadi, A. Plastic-deformation and failure in granular media. Geotechnique 1977, 27, 53–74. [Google Scholar] [CrossRef]
- Hicher, P.Y.; Wahyudi, H.; Tessier, D. Microstructural analysis of strain localization in clay. Comput. Geotech. 1994, 16, 205–222. [Google Scholar] [CrossRef]
- Jiang, M.; Peng, L.; Zhu, H.; Lin, Y.; Huang, L. Microscopic investigation on shear band of marine clay in Zhuhai, China. Rock Soil Mech. 2010, 31, 102–108. [Google Scholar]
- Zhang, X.; Kong, L.; Guo, A.; Tuo, Y. Experiment study of pore distribution of strong structural clay under different consolidation pressures. Rock Soil Mech. 2014, 35, 2794–2800. [Google Scholar]


| Sampling Depth (m) | Natural Density (g/cm3) | Void Ratio | Moisture Content (%) | Liquid Limit (%) | Plastic Limit (%) | Hydraulic Conductivity (cm/s) | Grain Size Distribution (%) | |
|---|---|---|---|---|---|---|---|---|
| 0.005– 0.075 mm | <0.005 mm | |||||||
| 10–12 | 1.75 | 1.45 | 54.92 | 62.2 | 28.8 | 2.7 × 10⁻⁸ | 59.1 | 40.9 |
| Overburden Pressure (kPa) | Yield Stress (kPa) | Unconfined Compressive Strength of Undisturbed Clay (kPa) | Unconfined Compressive Strength of Remolded Clay (kPa) | Sensitivity |
|---|---|---|---|---|
| 200 | 350 | 110.6 | 17.2 | 6.4 |
| Number of Tests | Confining Pressure (kPa) | Shearing Rate (mm/min) | Testing Conditions |
|---|---|---|---|
| T1 | 100 | ||
| T2 | 200 | ||
| T3 | 300 | 0.075 | undrained |
| T4 | 400 | ||
| T5 | 500 |
| Number of Tests | Confining Pressure (kPa) | ||||
|---|---|---|---|---|---|
| T1 | 100 | 57.9 | 56.9 | 54.3 | 55.6 |
| T3 | 300 | 52.1 | 56.9 | 56.2 | 56.6 |
| T5 | 500 | 51.0 | 56.9 | 60.4 | 58.7 |
| Consolidation Pressures (kPa) | Percentage of Pore Volume (%) | Percentage of Pore Volume with Different Diameters (%) | |||
|---|---|---|---|---|---|
| d > 10 μm | 1 μm < d < 10 μm | 0.1 μm < d < 1 μm | d < 0.1 μm | ||
| 200 | 59.41 | 9.1 | 26.7 | 50.9 | 13.3 |
| 400 | 57.65 | 4.1 | 27.5 | 54.6 | 13.8 |
| 600 | 53.10 | 7.3 | 1.1 | 72.1 | 19.5 |
Publisher’s Note: MDPI stays neutral with regard to jurisdictional claims in published maps and institutional affiliations. |
© 2022 by the authors. Licensee MDPI, Basel, Switzerland. This article is an open access article distributed under the terms and conditions of the Creative Commons Attribution (CC BY) license (https://creativecommons.org/licenses/by/4.0/).
Share and Cite
Liu, B.; Kong, L.; Li, C.; Wang, J. Evolution of Shear Band in Plane Strain Compression of Naturally Structured Clay with a High Sensitivity. Appl. Sci. 2022, 12, 1180. https://doi.org/10.3390/app12031180
Liu B, Kong L, Li C, Wang J. Evolution of Shear Band in Plane Strain Compression of Naturally Structured Clay with a High Sensitivity. Applied Sciences. 2022; 12(3):1180. https://doi.org/10.3390/app12031180
Chicago/Turabian StyleLiu, Bingheng, Lingwei Kong, Chengsheng Li, and Juntao Wang. 2022. "Evolution of Shear Band in Plane Strain Compression of Naturally Structured Clay with a High Sensitivity" Applied Sciences 12, no. 3: 1180. https://doi.org/10.3390/app12031180