Article

Performance Comparison between Mini-LED Backlit LCD and OLED Display for 15.6-Inch Notebook Computers

College of Optics and Photonics, University of Central Florida, Orlando, FL 32816, USA
*
Author to whom correspondence should be addressed.
The authors contributed equally to this work.
Appl. Sci. 2022, 12(3), 1239; https://doi.org/10.3390/app12031239
Submission received: 30 December 2021 / Revised: 17 January 2022 / Accepted: 21 January 2022 / Published: 25 January 2022
(This article belongs to the Section Applied Physics General)

Abstract

:
We evaluated and compared the performance of a 15.6-inch mini-LED backlit LCD (mLCD) with a commercial OLED (organic light-emitting diode) panel. Both displays exhibited outstanding properties, but the mLCD had advantages in peak brightness, gamma curve, luminance uniformity at low gray scales, color volume, power consumption, and ambient contrast ratio. In comparison with previous measurement methods, our color measurement adopted the reference method recently recommended by the International Committee for Display Metrology (ICDM). The LMK imaging photometer with a high-resolution CMOS sensor was employed to characterize the halo effect and reconstruct the real luminance profiles based on the non-ideal luminance profile of the OLED display. We also proposed a novel strategy to measure the point spread function of the backlight module.

1. Introduction

High dynamic range (HDR) is a key performance metric for display devices. According to the Dolby Research standard [1], HDR displays should exhibit a peak brightness of more than 4000 nits, a dark state of less than 0.005 nits, and at least a 10-bit depth of gray levels. HDR displays are in high demand for TVs, computers, smartphones, augmented reality, and virtual reality [2,3,4,5,6,7,8]. Lately, the competition between liquid crystal displays (LCDs) and organic light-emitting diode (OLED) displays is getting fierce [9]. To compete with OLED displays [10] and other emerging displays, such as micro-LED displays [11,12,13,14,15,16], the mini-LED backlit LCDs (abbreviated as mLCDs) have been rapidly developed in recent years. Through two-dimensional (2D) local dimming [17,18,19,20,21], mLCDs can greatly improve the contrast ratio, bit depth, and power consumption. In contrast, OLED displays offer an unprecedented contrast ratio, faster response time, thin profile, and excellent flexibility, but the tradeoff between brightness and lifetime remains to be overcome [22,23].
In this study, we systematically measured and compared the display performance of Nichia’s 15.6″ mLCD panel with a 15.6″ commercial OLED notebook computer (Dell XPS 15 7590). We evaluated their brightness, gamma curve, color volume, color shift, power consumption, ambient contrast ratio, and halo. Based on our measured data, the mLCD exhibited a higher peak brightness, a more accurate gamma curve, better brightness uniformity at low gray levels, larger color volume, lower power consumption, and higher ambient contrast ratio. The confining reflector wall [21] in Nichia’s mLCD backlight helped to reduce the zone crosstalk and the halo effect. In comparison with previous methods, our color measurement adopted the reference method recently recommended by the International Committee for Display Metrology (ICDM), and the 3D display gamut envelopes were created from 602 measured surface colors. Furthermore, we used the LMK imaging photometer (TechnoTeam Vision) with a high-resolution CMOS (complementary metal-oxide semiconductor) image sensor to characterize the halo effect and reconstruct the real luminance profiles based on the non-ideal profile of the OLED display. The point spread function (PSF) of the backlight module was also measured using a novel strategy without requiring physical separation between the backlight and the liquid crystal (LC) module.

2. Performance Metrics

In this section, we present the results of some key display characteristics, namely, luminance and gamma curve, color gamut and color shift, power consumption, and ambient contrast ratio, of Nichia’s 15.6-inch mLCD prototype against a commercial 15.6-inch premium grade OLED notebook computer.

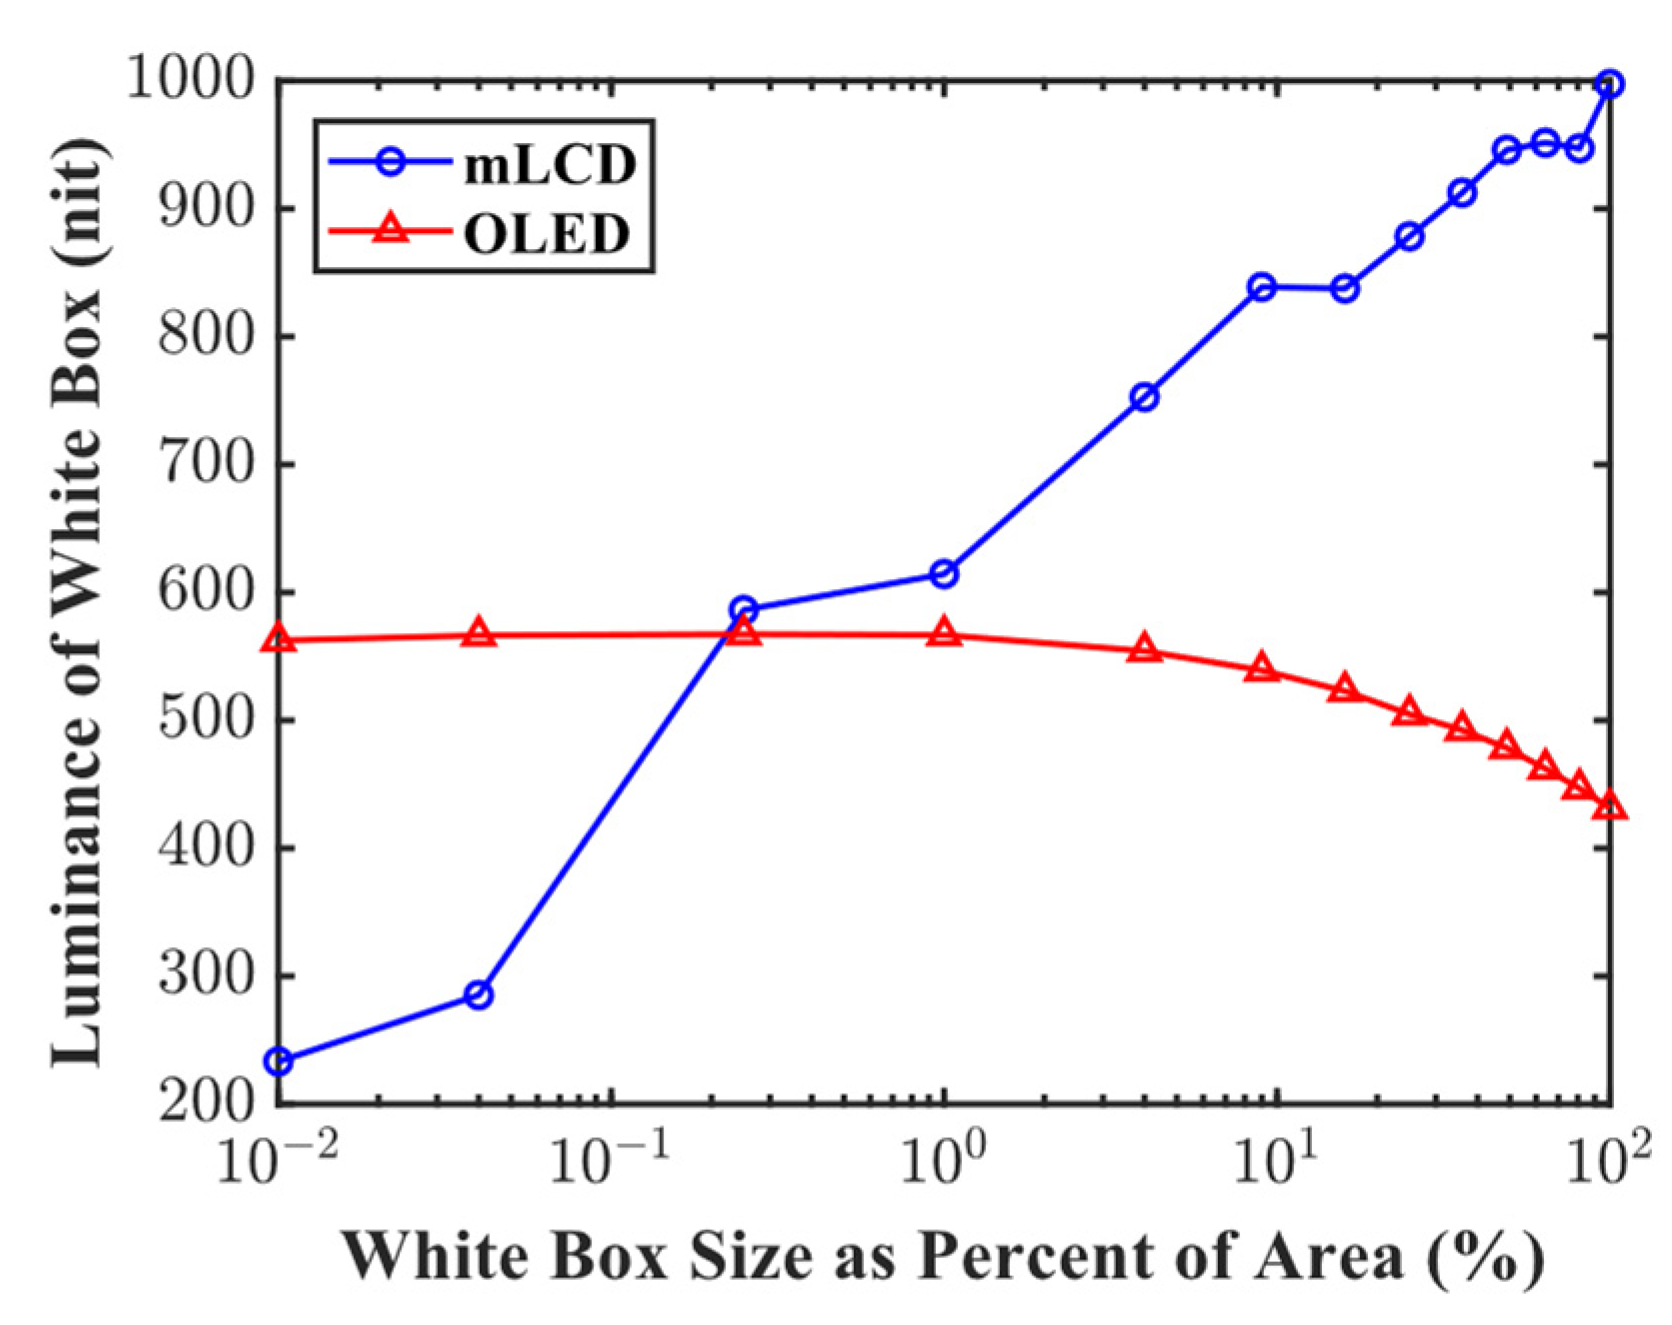
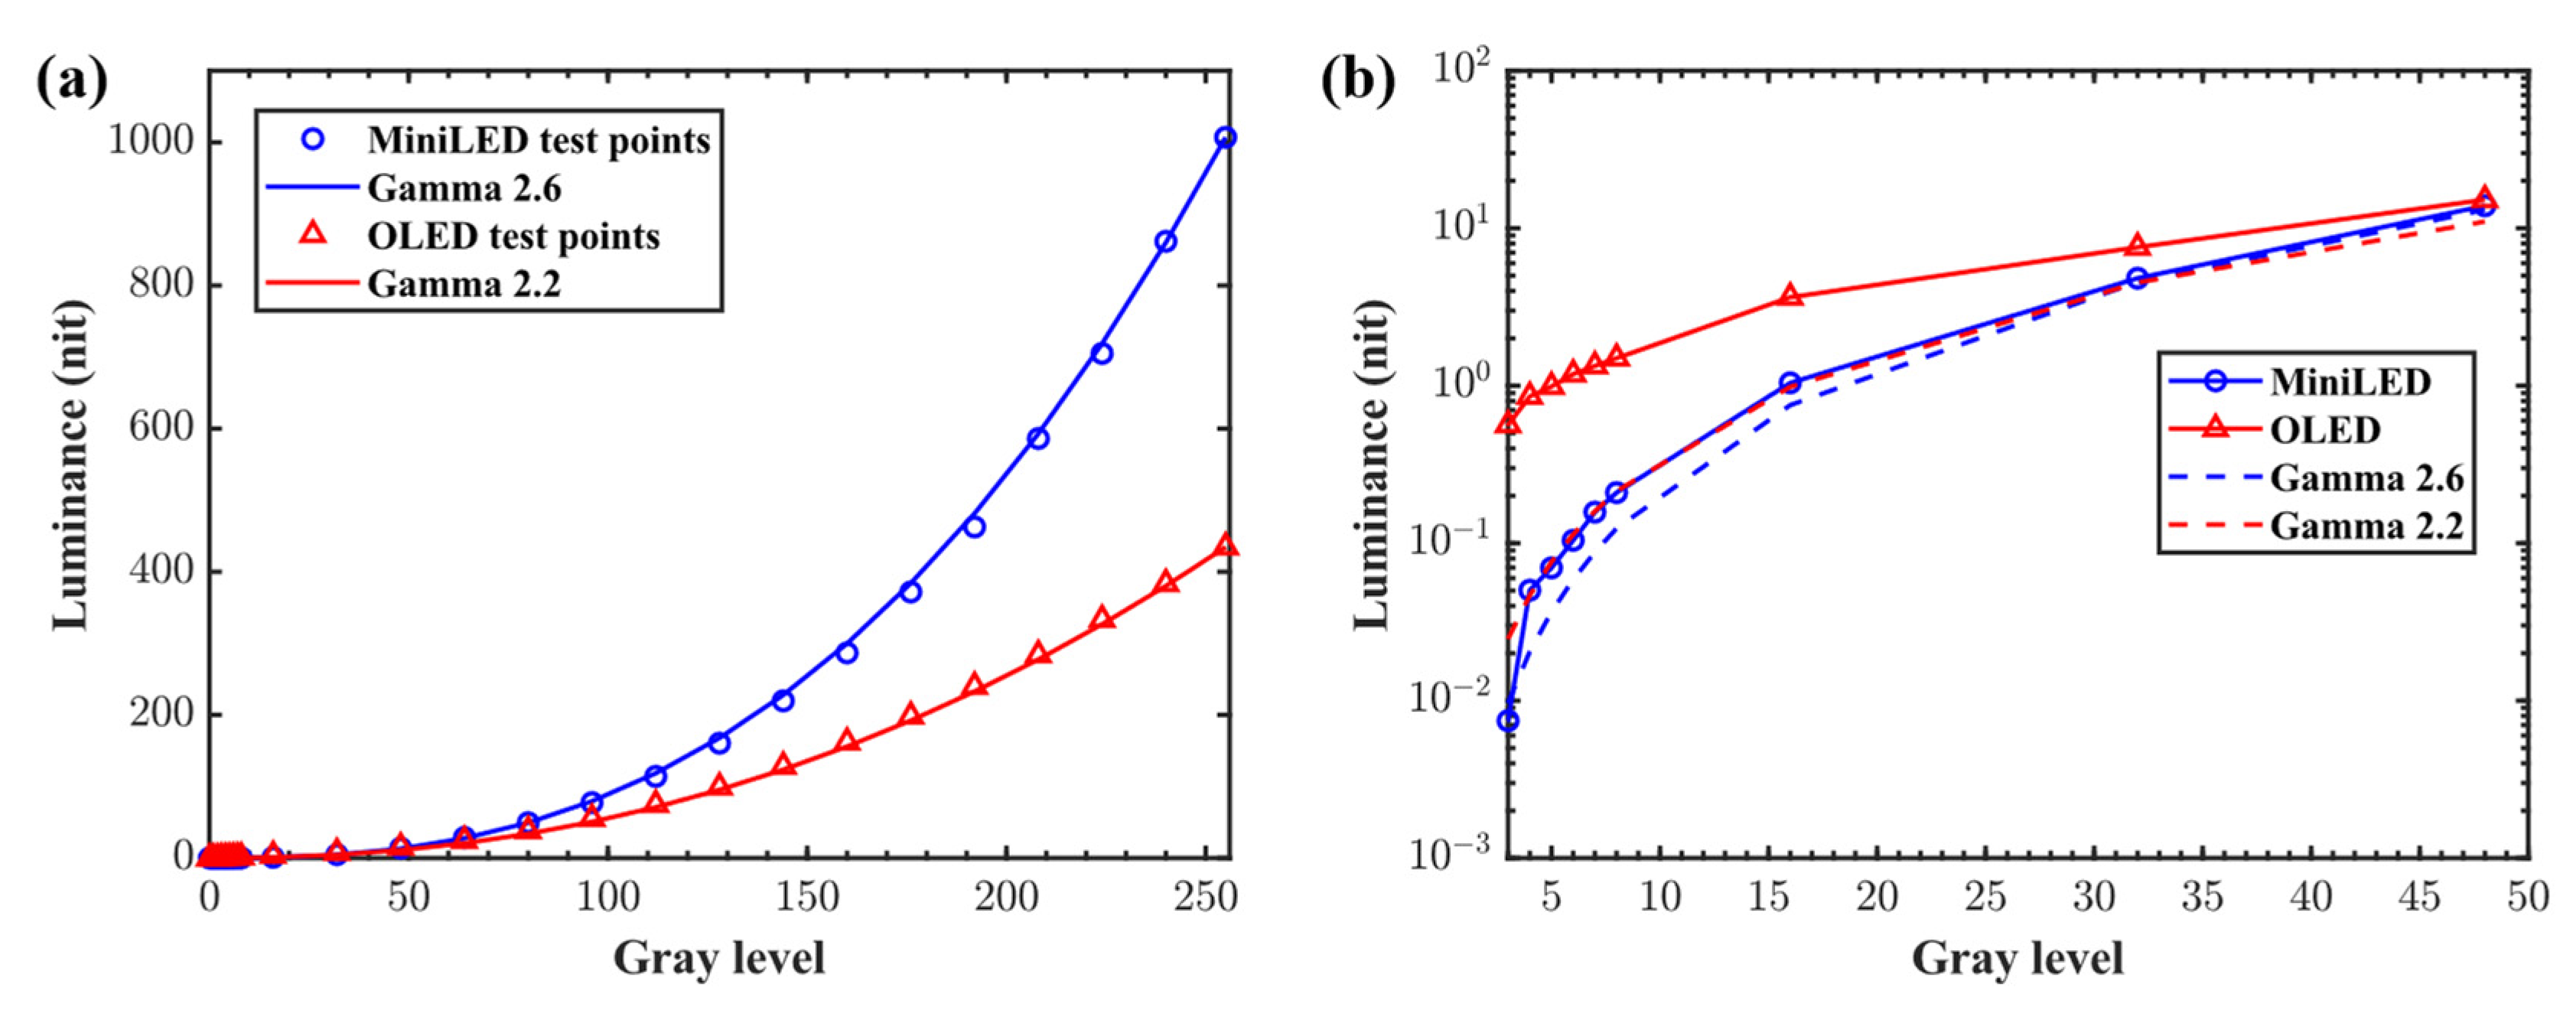
2.1. Luminance and Gamma Curve

To characterize the effect of luminance loading, the luminance of a white box with a black background was measured using the LMK when the white box size varied from a small fraction to the full screen. The white area size ratio (average pixel level (APL)) ranging from 0.01% to 1% can be used to imitate the shining stars in a black sky. According to Figure 1, the mLCD showed a higher brightness than the OLED display when APL ≥ 1%. As the APL increased from 0.01% to 100%, the OLED brightness decreased from 562 nits to 431 nits, while the mLCD increased from 233 nits to 997 nits. When the bright area shrunk to a very small size, the zone crosstalk became more evident. For this reason, the mLCD brightness was adjusted to a relatively low value. For most of the image contents with APL ≥ 1%, the mLCD had a much better HDR performance.
The gamma curves of the mLCD and the OLED display panels were obtained by measuring the luminance at gray levels ranging from 0 to 255. In Figure 2a, the dots represent the measured data and the solid lines are the fitting curves. The fitted gamma values of the mLCD and the OLED display were 2.6 and 2.2, respectively. Figure 2b shows the luminance values and gamma curves at low gray levels. The OLED display deviated from the expected gamma 2.2 curve noticeably due to its much higher luminance values at the third to the eighth gray levels. As for the brightness uniformity, we used the LMK to measure the 2D luminance distributions. Taking the second gray level as an example, the mLCD panel showed a better brightness uniformity than the OLED display, as shown in Figure 3a,b. To quantitatively describe the grayscale uniformity, the root mean square (RMS) and the standard deviation (SD) were calculated. The RMS and SD values for the mLCD and the OLED display were [0.0087, 0.0138] and [0.0222, 0.0176], respectively. From Figure 3b, it can be inferred that the current control at low gray levels for the OLED display was position-dependent, leading to a relatively large luminance fluctuation.

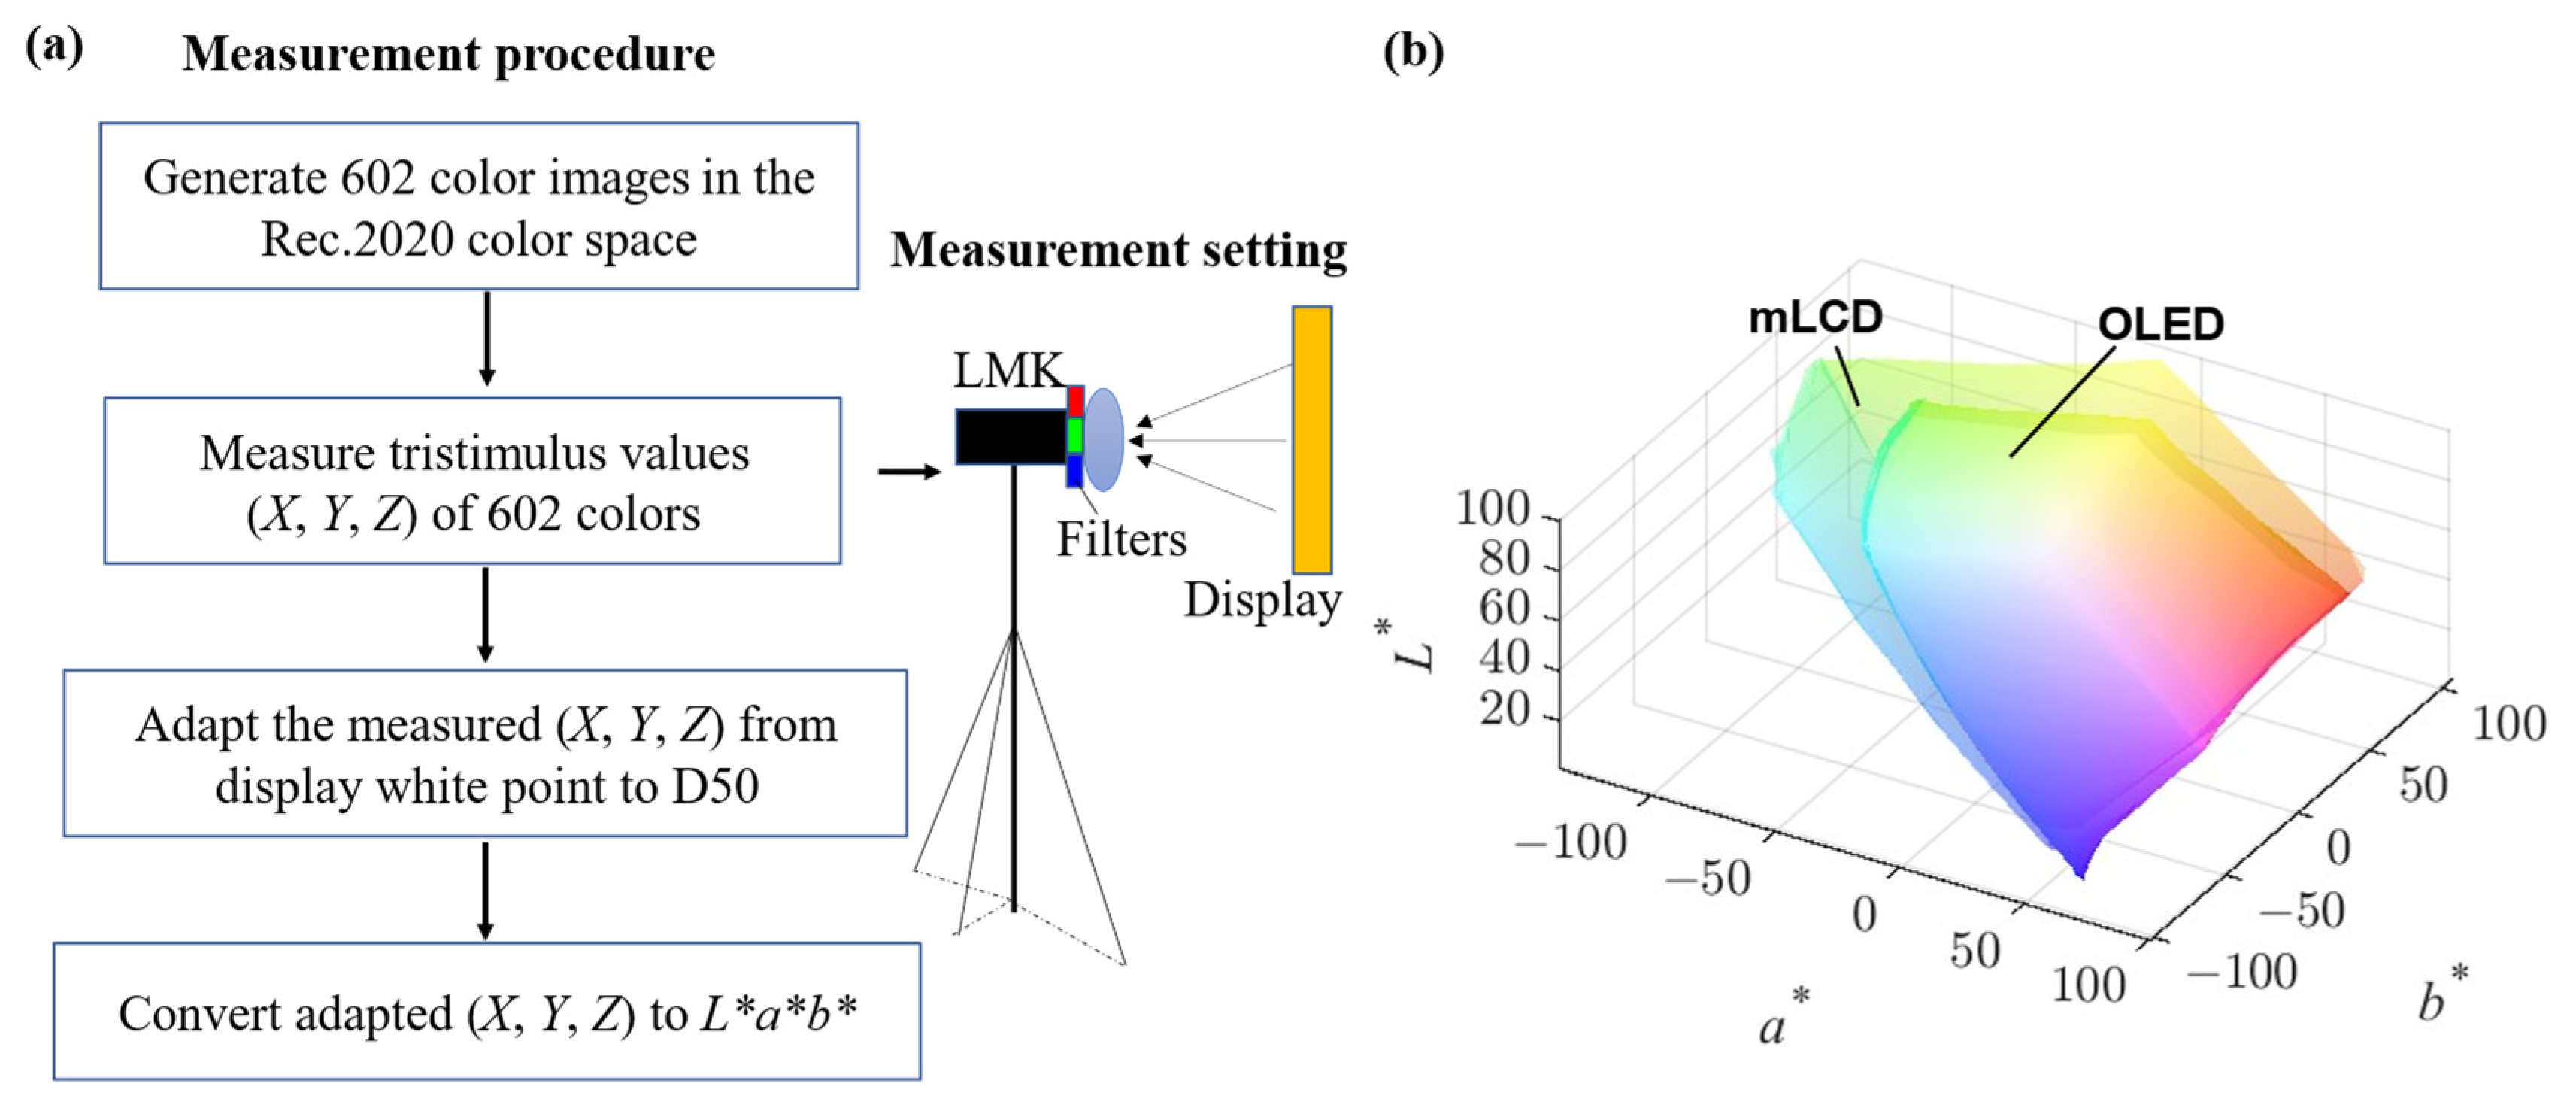
2.2. Color Gamut and Color Shift

Color gamut and color shift are two important metrics to evaluate the color performances of a display panel. A good display should exhibit a wide color gamut and a weak color shift. The color gamut of a display is better represented by a 3D volume instead of a chromaticity gamut area. The gamut envelope is calculated in the human perceptual color space CIE 1976 L*a*b* due to its good perceptual homogeneity. Our measurement procedure follows the reference method that the ICDM recommends. In this method, the full 602-color reference sets should be used if the behavior of the display panel is not well known. The measurement procedure and setting are explicitly illustrated in Figure 4a. The first step was to generate 602 color images in the Rec.2020 color space. These 602 unique colors were evenly distributed on the linear RGB (red, green, blue) signal space. Then, we measured the tristimulus values (X, Y, Z) of each color using the LMK with full glass filters for color matching functions. Next, a chromatic-adaptation transform was built to adapt the measured values from the display white point to the standard illuminant D50 using the modified Bradford adaptation transform method. The last step was to calculate the CIE 1976 D50 L*a*b* coordinates from the converted tristimulus values as follows:
L * = 116 × f ( Y Y n ) 16 ,
a * = 500 × [ f ( X X n ) f ( Y Y n ) ] ,
b * = 200 × [ f ( Y Y n   ) f ( Z Z n ) ] ,
f ( t ) = { t 1 / 3                                         t > ( 6 / 29 ) 3 1 3 ( 29 6 ) 2 t + 16 116       otherwise
where (Xn, Yn, Zn) is the D50 with a certain white luminance. To compare the color gamut volumes of the mLCD and the OLED display, their different brightnesses should be considered as well. For this reason, the white luminance was set to the white brightness of the mLCD to reflect that the brightness can greatly impact the color gamut volume. The color gamut volumes of the mLCD and the OLED display are shown in Figure 4b. According to the gamut envelope, the color space of the mLCD and the OLED display had a CIELAB gamut volume of 1191300 Δ E 3 and 650680 Δ E 3 , respectively. In terms of the reference Rec.2020 color space, the percentages of coverage for the mLCD and the OLED display were 64.3% and 35.0%, respectively. The mLCD exhibited a larger color gamut volume than the OLED display due to its higher peak brightness.
Color shift is another important parameter to evaluate the color uniformity of a display panel. The angular color shift can be impacted by both the variations of primary RGB colors and unmatched angular distributions of primary colors according to the color mixing principles. For an mLCD, its angular color shift arises from the angle-dependent accumulated phase retardation in the birefringent LC layer. When the incident light transverses the LC layer at different angles, the accumulated phase retardation varies, giving rise to the angle-dependent transmittance and color shift. For this reason, the color coordinates of primary colors vary with viewing angles. For an OLED display, the variations of primary colors are attributed to the cavity effect. As the viewing angle increases, the emission spectrum shifts toward a shorter wavelength because of the reduced effective cavity length. On the other hand, if the angular distributions of primary colors are not matched well, the mixed colors will vary with the viewing angle due to angle-dependent RGB ratios [24,25].
The experimental procedure to measure color shift is described as follows: we first measured the white spectrum using a high-resolution spectrometer (HR2000CG-UV-NIR); then, we rotated the angle of the optical fiber used for collecting white light into the spectrometer and measured the white spectrum again at different viewing angles. Figure 5a shows the measured white spectra of the mLCD and the OLED display at 0° and 60° viewing angles. From Figure 5a, we can see that the mLCD backlight adopted two phosphors to widen the color gamut, while the blue shift caused by the cavity effect was noticeable for the OLED panel. As Figure 5b depicts, the mLCD exhibited a weaker color shift than the OLED display. The weaker color shift of the mLCD benefited from the small color shift of the fringing field switching (FFS) mode [26]. It should be mentioned that the color shift remains indistinguishable by human eyes if Δu′v′ < 0.02. This means that both panels are fine in terms of color shift within the 60° viewing cone.

2.3. Power Consumption

Low power consumption is highly desirable for mobile display devices, such as note-book computers and smartphones, since the operation time is determined by the battery. Figure 6 shows the measured power consumption of the 15.6″ mLCD and OLED display panels, where the luminance level was controlled at 200 nits. When the pixels were turned off, the power consumption mainly came from the power source circuitry and peripheral circuits for driving the pixels. The power consumption of the mLCD and OLED panels at APL = 0% and APL = 100% was about [1.10 W, 2.53 W] and [3.45 W, 8.83 W], respectively. This means that the mLCD and the OLED display consumed 2.35 W and 6.30 W, respectively, at APL = 100% without considering the peripheral circuits. The mLCD showed a much lower power consumption than the OLED display, which helped to increase the operating time of the display devices.

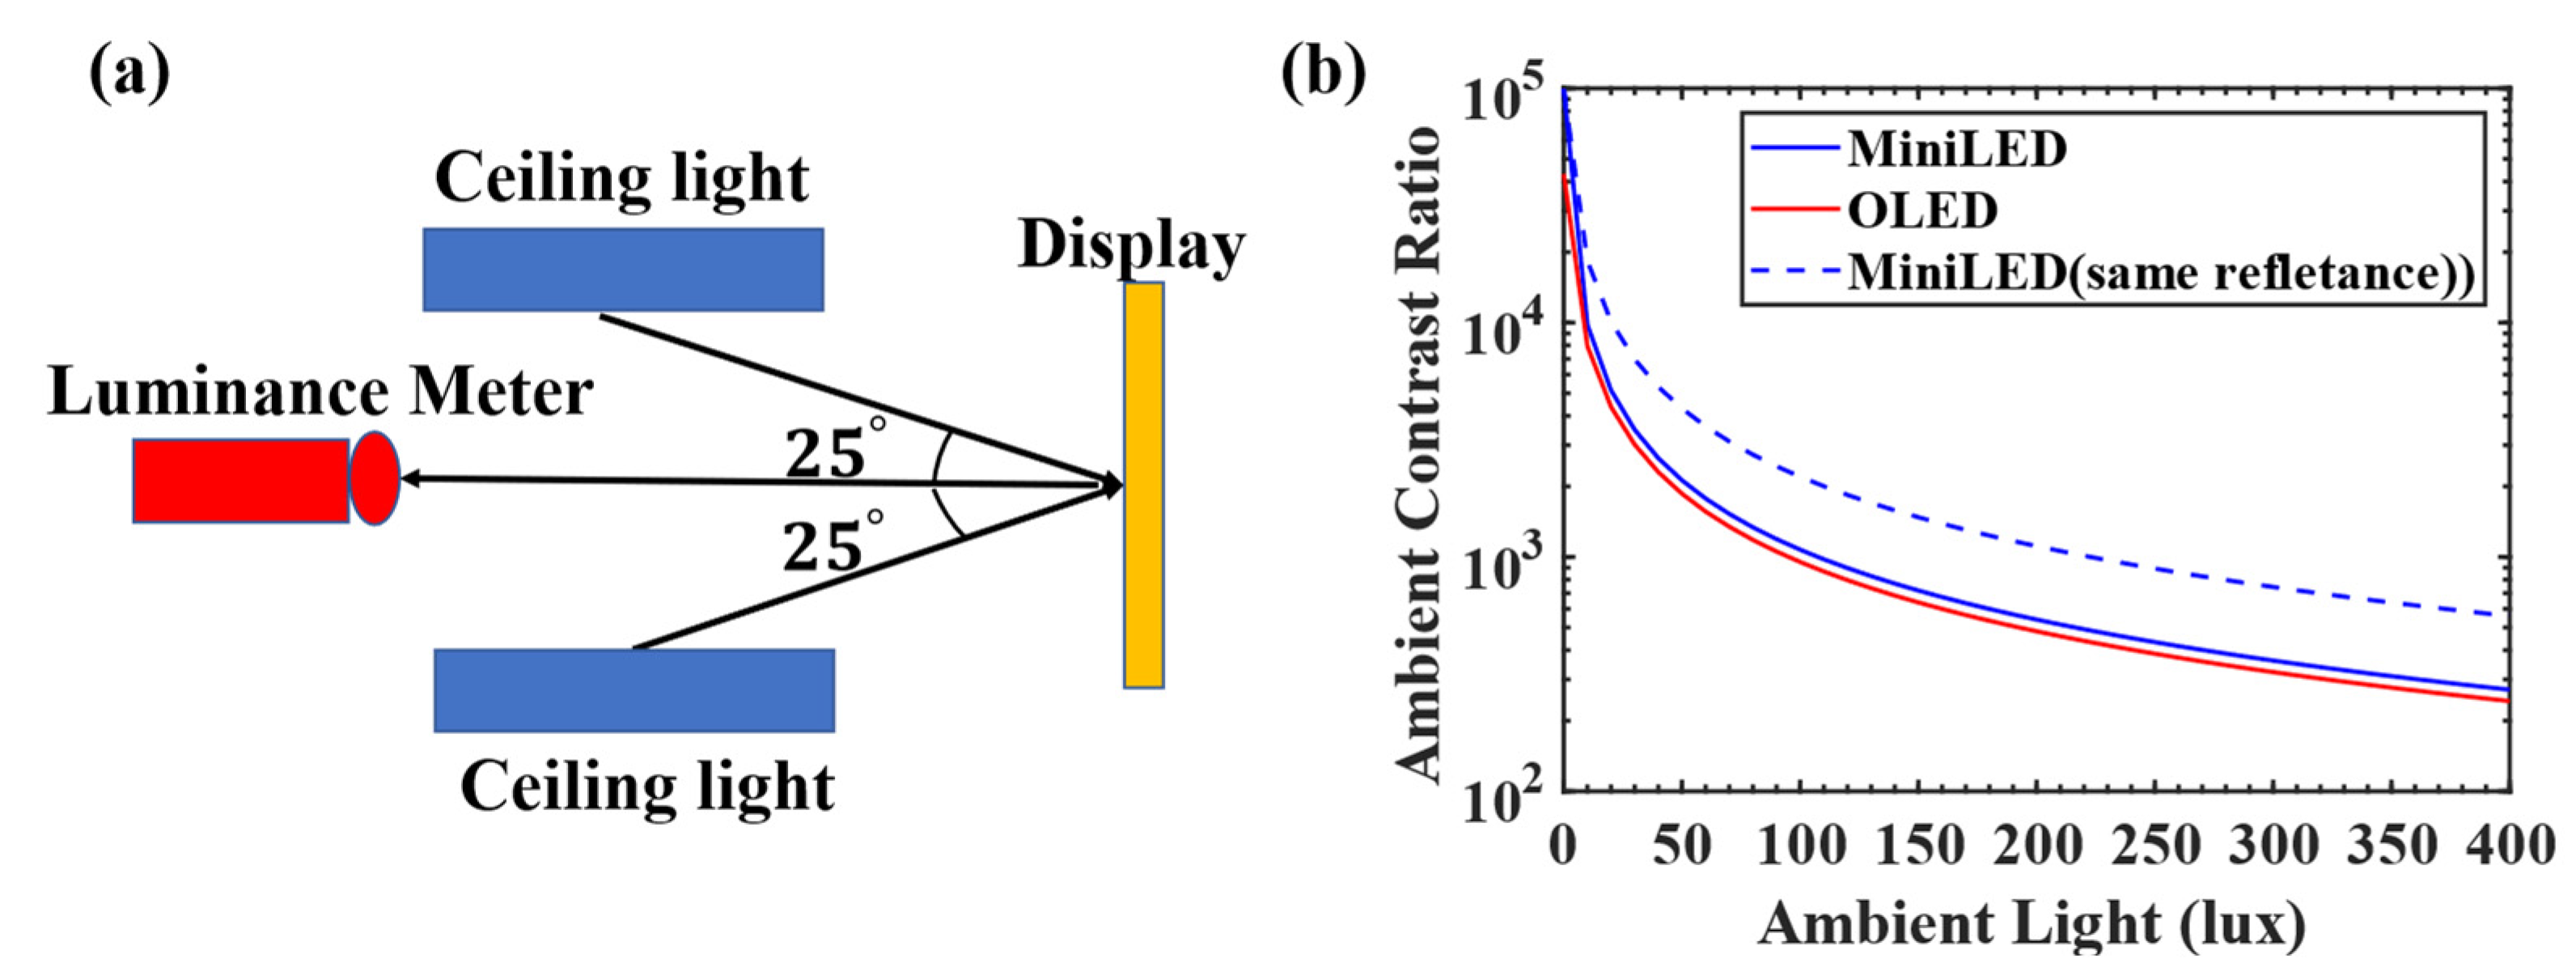
2.4. Ambient Contrast Ratio
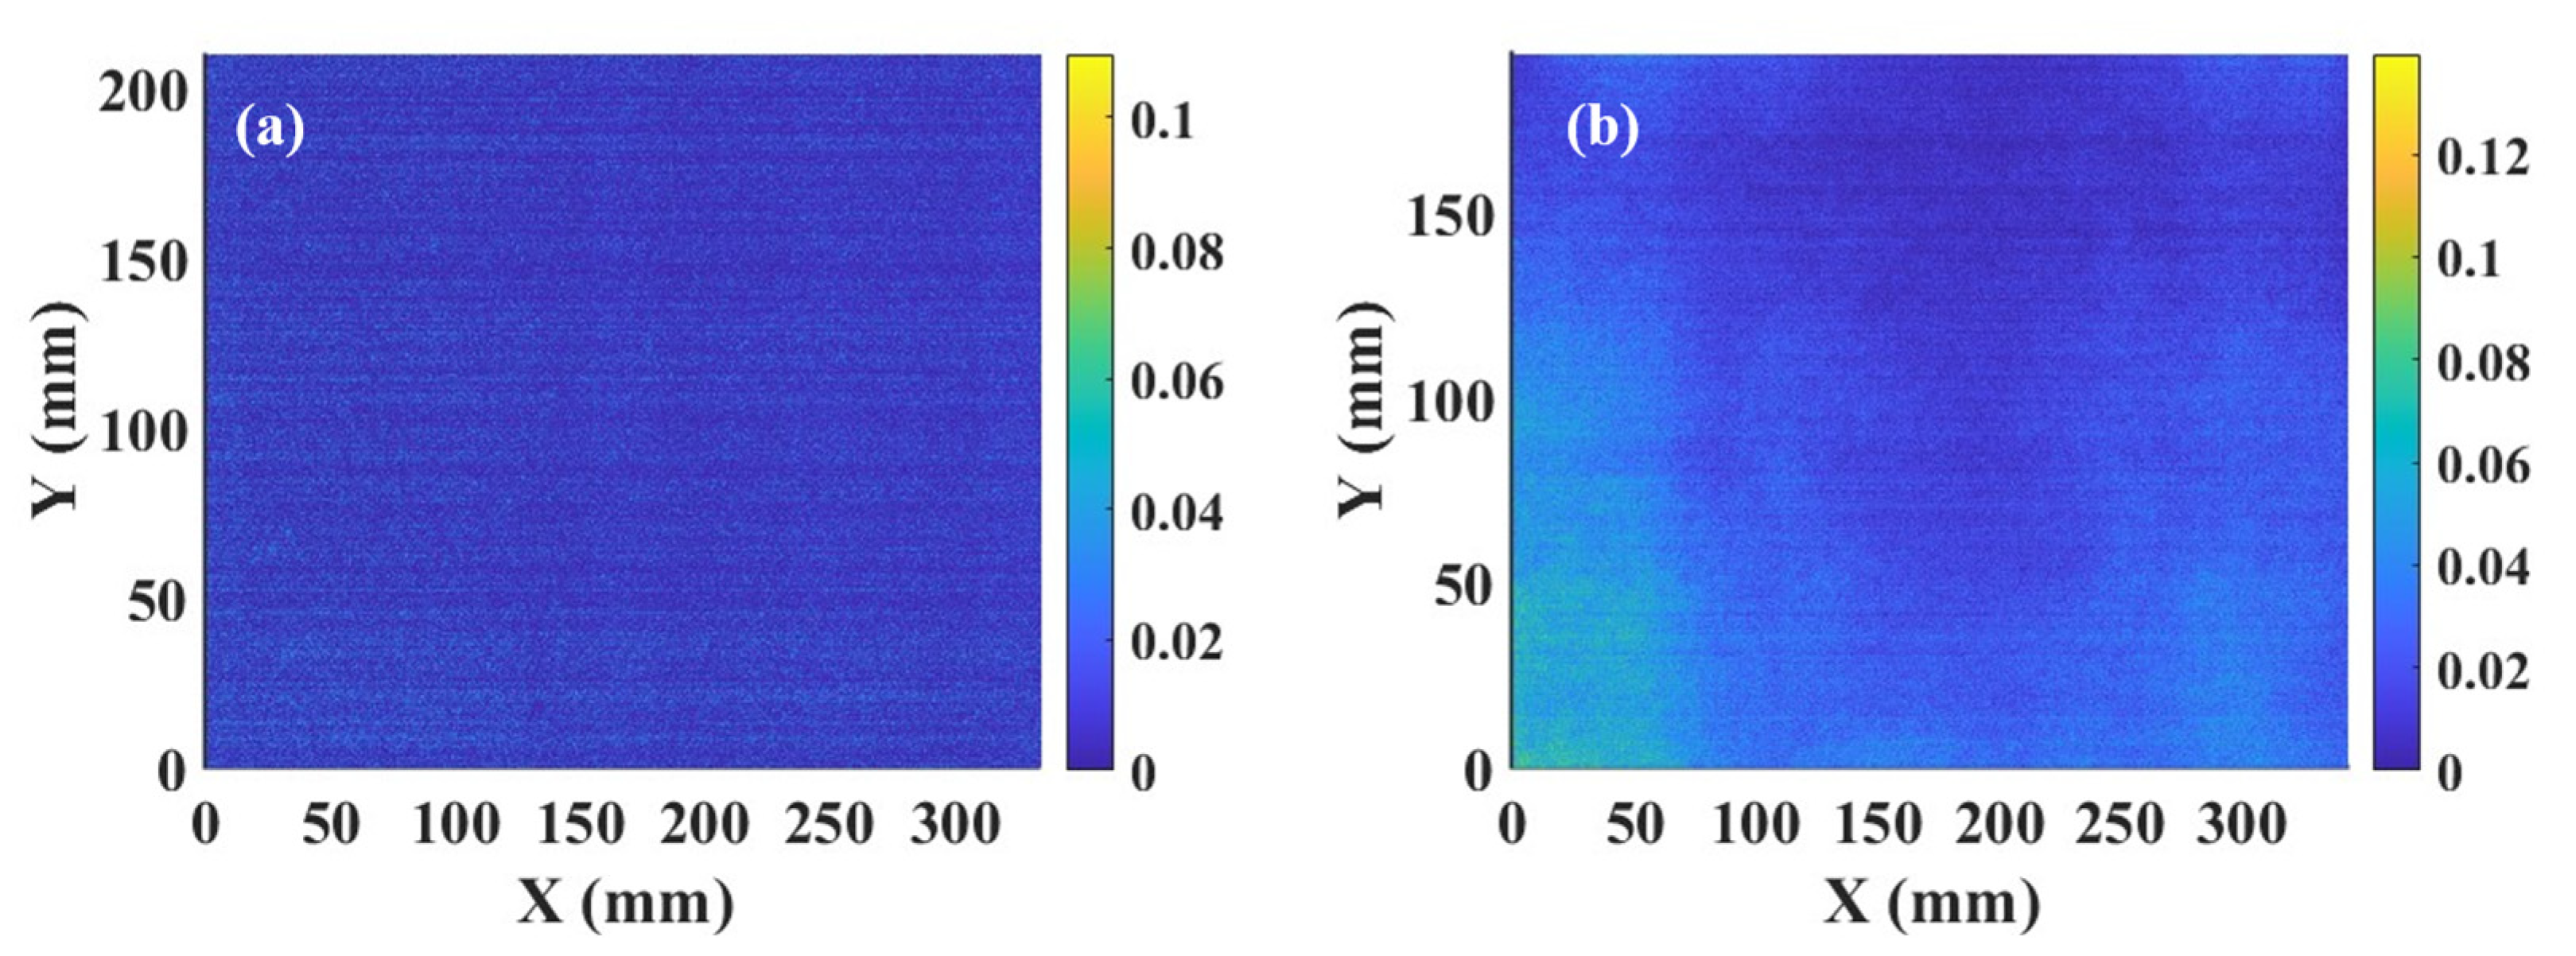
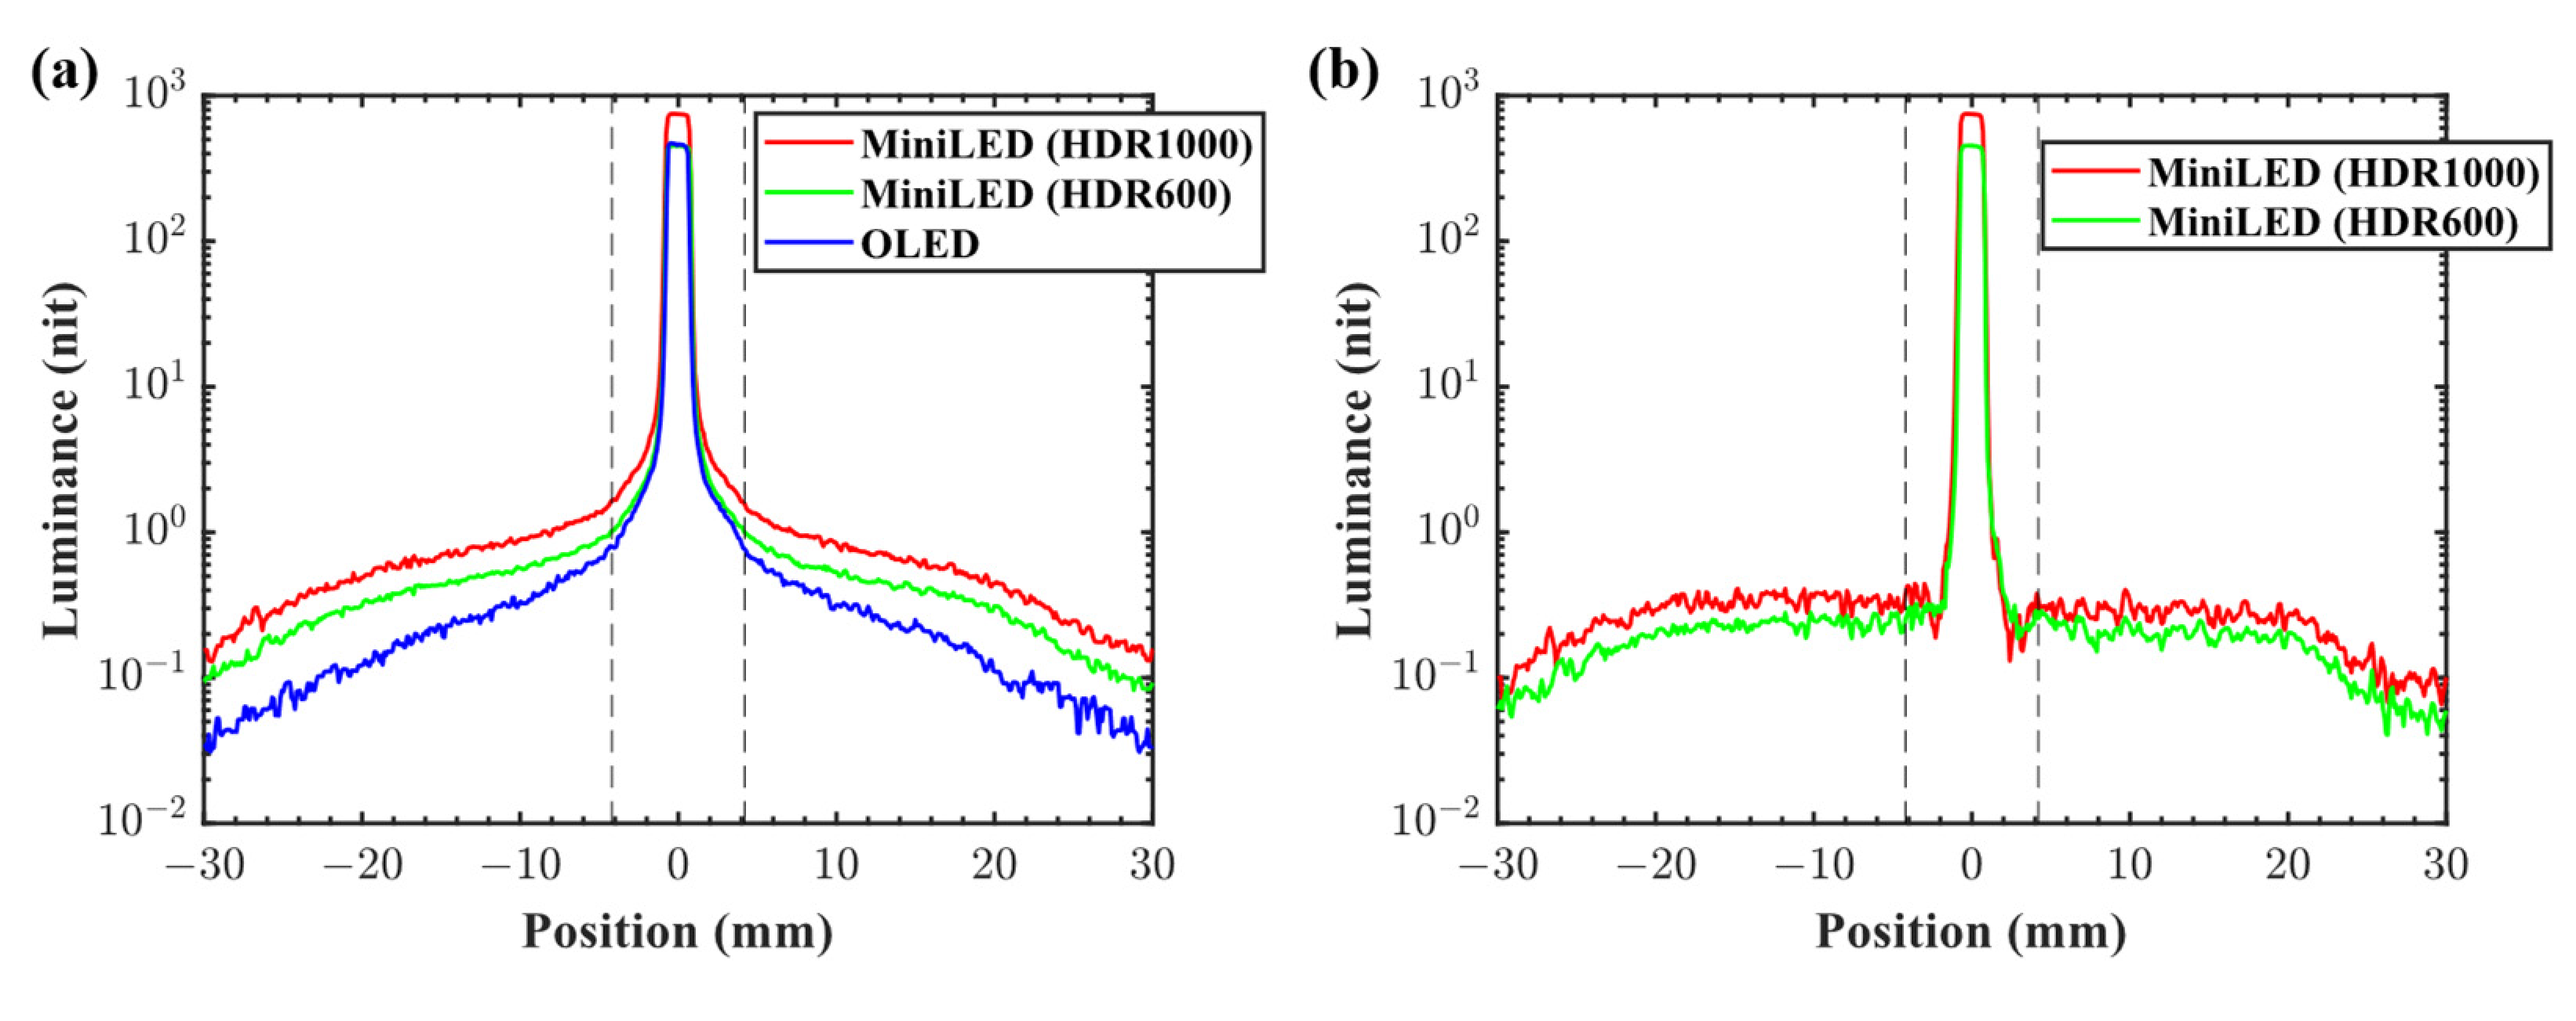
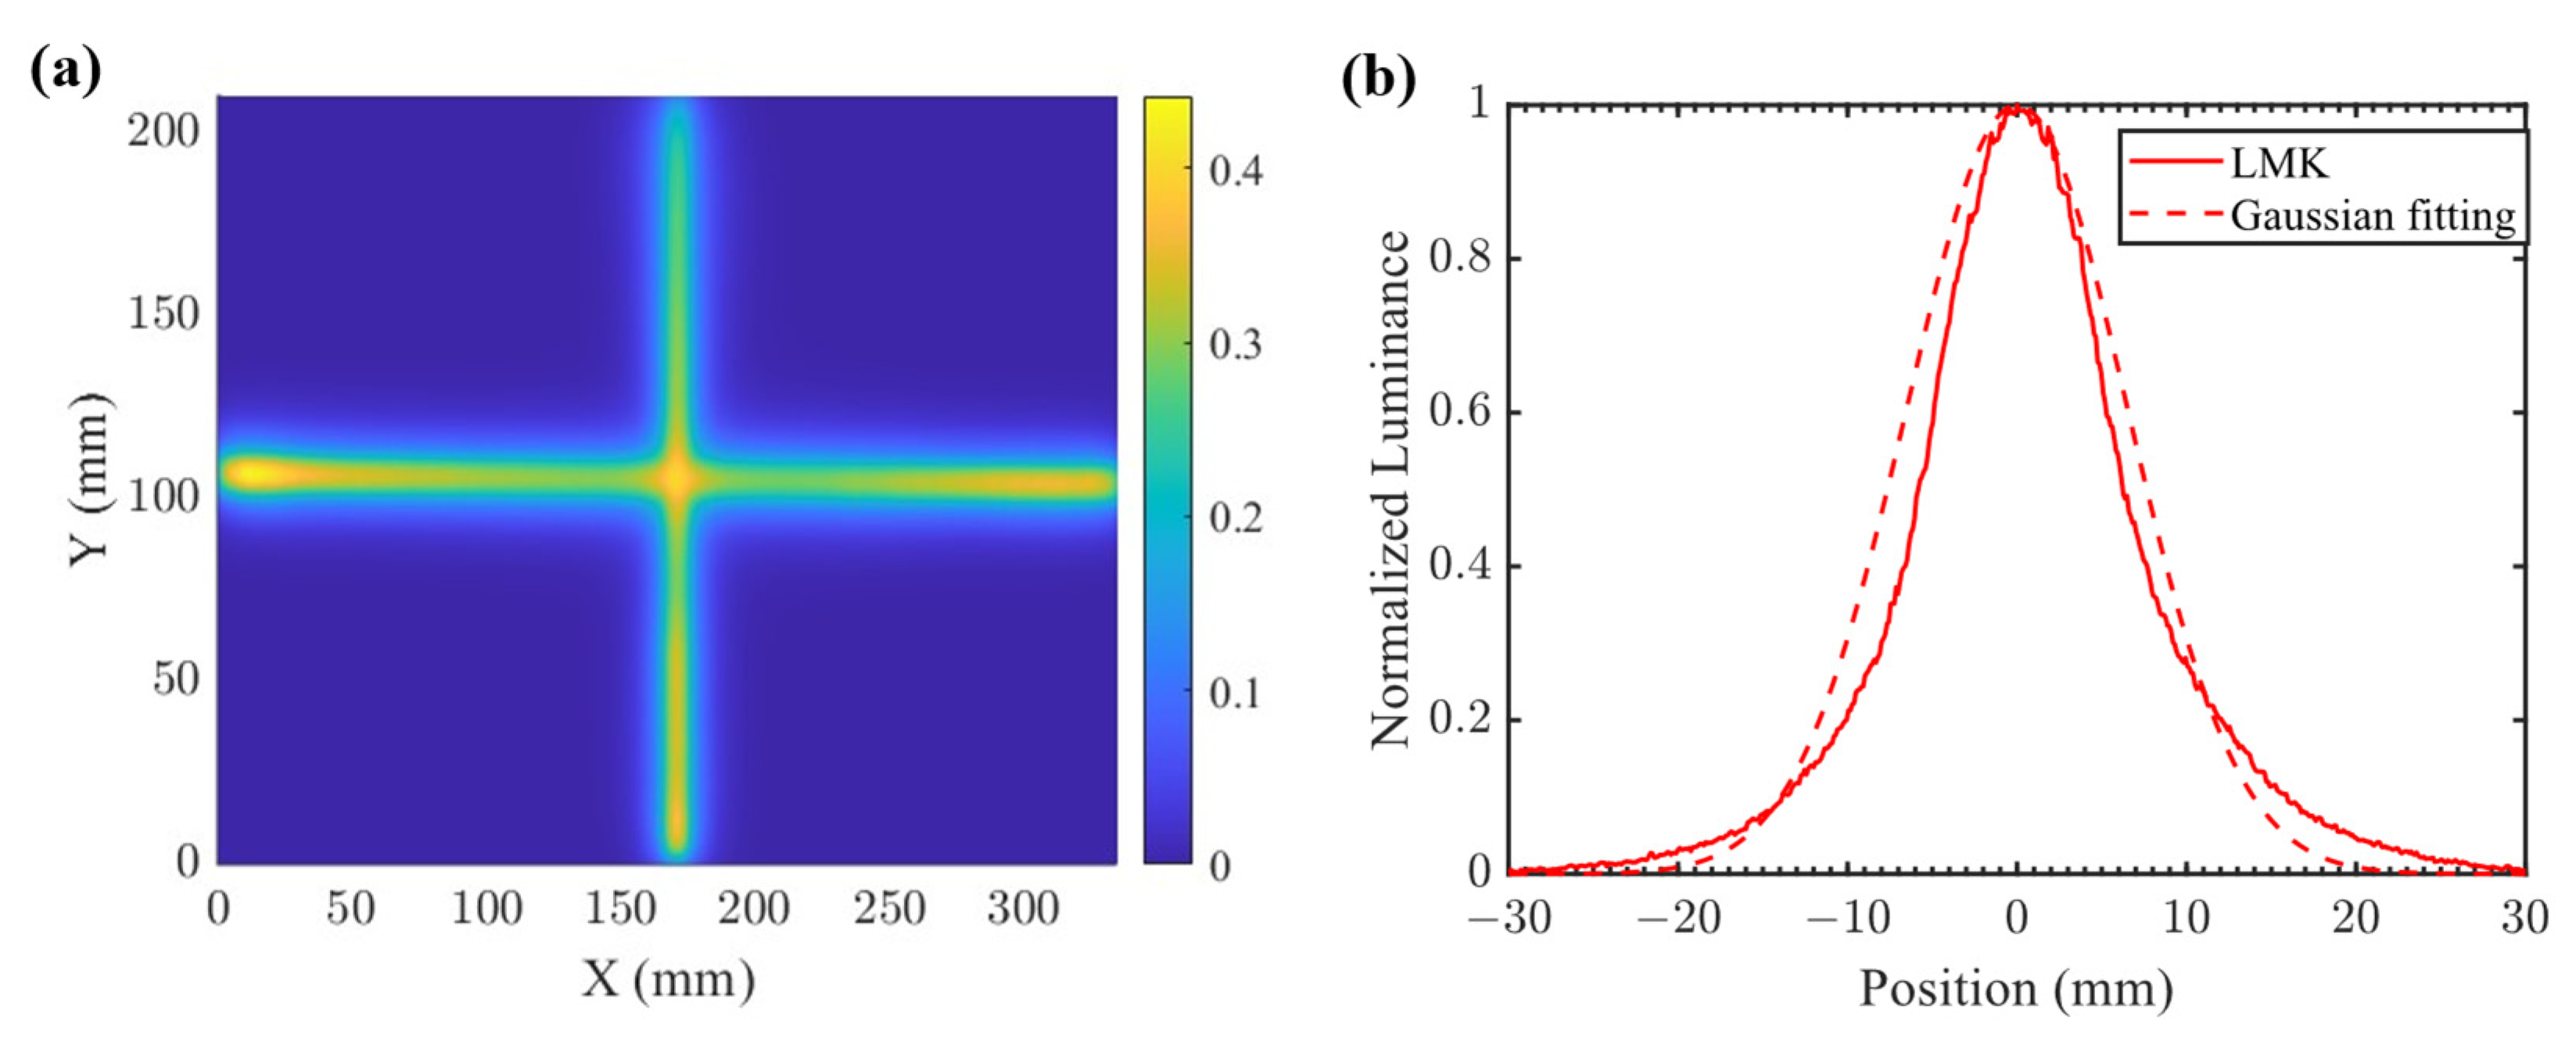
Contrast ratio is a key display metric to enable a high dynamic range. Without any ambient light, the intrinsic contrast ratio of both the mLCD and OLED display panels could be higher than 106:1. However, in practical applications, the ambient light will degrade the contrast ratio due to the surface reflectivity of the display panel. A typical illuminance of a family room and an office room is about 100 lux and 300–500 lux, respectively. The ambient contrast ratio (ACR) is defined as follows [27]:
ACR = L o n + L a m × R L L o f f + L a m × R L   ,
where Lon (Loff) represents the on (off)-state luminance of the display panel, Lam refers to the ambient luminance, and RL is the ambient luminous reflectance of the display panel. Since the illumination conditions can greatly impact the reflectance and ACR, they should be explicitly defined. Figure 7a shows the top view of the measurement setting where two ceiling lights act as ambient light sources. The center of the ceiling light intersects with the center of the display panel at an azimuthal angle of 25° and a polar angle of 45°. By measuring the brightness and ambient reflectance, the ACR as a function of ambient illuminance can be determined.
We used a luminance meter (KONICA MINOLTA LS-110) to measure the brightness of the display panel. When the two ceiling lights were off, the full-screen white brightnesses of the mLCD and the OLED display were 997 nits and 431 nits, respectively. When the two ceiling lights were on, the ambient illuminance was 250 lux, as measured by the illuminance meter LX1330B. The ambient illuminance can be converted to ambient luminance by dividing a factor of π. Therefore, the ambient luminance was 79.6 nits. When the panel was in the dark state and the two ceiling lights were on, the brightnesses of the mLCD and the OLED display were 2.3 nits and 1.1 nits, respectively. Therefore, the mLCD and the OLED display exhibited luminous reflectances of 2.89% and 1.39%, respectively. Such a low reflectance for the OLED display resulted from its excellent anti-reflection coating. Figure 7b shows that the mLCD still exhibited a slightly larger ACR than the OLED panel due to its higher peak brightness, even though its surface reflectivity was twice as high. If the mLCD adopted the same anti-reflection treatment (assume that the ambient reflectance was the same), its ACR would be ~2.3 times higher than that of the OLED display at the ambient illuminance of 380 lux. Therefore, a high brightness has advantages under a high ambient lighting environment.

3. Halo Effect

The halo artifact usually appears around a bright object on a black background due to the light leakage and the zone crosstalk in an mLCD panel. The experimental procedure to quantitatively characterize the halo effect is illustrated in Figure 8. We first inputted a test pattern with a white cross on a black background [28]. Then, we used the LMK to obtain a luminance distribution image. A halo image could finally be generated by excluding the luminance pattern of the cross from the luminance distribution image, where the halo artifacts surrounding the cross were more visible. Based on the measured RMS and SD values, we could quantitatively analyze and compare the halo effect for the generated halo images. The values of the RMS and SD for the mLCD driven in the HDR1000 and HDR600 modes and the OLED display were [0.2379, 0.2339], [0.1916, 0.1893], and [0.1830, 0.1811], respectively. The halo of an OLED display is caused by the measurement instrument, such as an imaging lens. Such a halo is analogous to the eye halo [29].
So far, we have characterized and compared the halo effect by obtaining the images on the CMOS sensor. The cross-section luminance profiles are shown in Figure 9a, where the luminance profile for the OLED display is non-ideal and the lines are all broadened due to a gradient drop in the 1D luminance distribution caused by the imaging instruments. To obtain the real luminance profiles for the displayed images, the non-ideal luminance profile for the OLED display can be used as a background reference and accordingly subtracted in the region outside the displayed line. In this way, an ideal luminance profile for the OLED display should be a rectangular function from zero to the maximum luminance. For the mLCD, its luminance profile was also narrowed to a rectangular line with the same method. The difference lies that the luminance outside the line will not quickly drop to zero, depending on how many zones are lit, because the contrast ratio in those lit zones is still limited by the LC layer. Figure 9b shows the real luminance profiles for the mLCDs driven in the HDR1000 and HDR600 modes. Taking the HDR600 driving mode as an example, the maximum and minimum luminances in the lit zones were 490 nits and 0.2 nits, respectively, indicating a contrast ratio of 2450:1. This contrast ratio was quite close to that of the FFS mode, whose CR was about 2500:1, which validated our methods for obtaining the real luminance profiles from imaging instruments. Furthermore, it can be inferred that five zones were lit in this selected cross-section due to the nearly constant value of 0.2 nits, ranging approximately from −20 mm to 20 mm. The five lit zones were possible if the selected cross-section was very close to the center portion of the cross. It should be mentioned that for the HDR1000 driving mode, a scaling luminance factor should be considered due to a significant luminance difference between the mLCD driven in the HDR1000 mode and the OLED display.
As mentioned before, the contrast ratio inside the lit zones is limited by the intrinsic CR of the LC mode. In the boundary areas between lit zones and closed zones, it is also hard to obtain a sharp transition of the luminance profile due to the zone crosstalk characterized by the point spread function. To measure the point spread function of the backlight module, we first inputted a display pattern of two thin lines to make sure that just one zone was lit in the direction perpendicular to the line. Next, we adopted a novel strategy without requiring the physical separation between the LC layer and the backlight module. This method takes advantage of a limited contrast ratio of the FFS mode and a very bright backlight. Furthermore, this method is enabled because the backlight is independent of the LC driving signal. For this reason, instead of removing the LC layer, we turned off the voltage applied on the LCs, and then the LCs at the dark state exerted a uniform modulation on the pattern of the mini-LED backlight. The luminance profile of the backlight modulated by the LCs was detectable by the LMK because its luminance value was still within the measurement range. Therefore, we used the LMK to measure the point spread function of the backlight module by obtaining the luminance distribution image, as shown in Figure 10a. The point spread function of a zone along the y-axis at x = 1 mm is shown in Figure 10b. In Nichia’s mLCD, each zone contained one mini-LED; therefore, we could equate the light profile of a single mini-LED with the point spread function of a zone. The Gaussian function can be used to approximate the light profile of a mini-LED [30]:
I ( x L E D ) exp [ ( x L E D x L E D , c ) 2 2 σ 2 ]
where x L E D ,   c is the locus of the LED source and σ is an expansion characteristic parameter. Good fitting was obtained with σ = 6.5 mm. A small σ value helps to confine light inside the zone.
According to Figure 10a, the luminance distributions along two perpendicular lines were not totally uniform, especially in the edge corners. For example, at x = 251 mm, the full-width half maximum (FWHM) of the luminance profile along the y-axis was about 11 mm. Such a narrow FWHM arose from the confining reflector wall in Nichia’s mLCD backlight, contributing to forming a flattop light distribution and reducing the zone crosstalk.

4. Conclusions

Using quantitative measurement data, Nichia’s 15.6-inch mLCD showed several advantages over the commercial OLED display panel in peak brightness, luminance uniformity at low gray scales, color gamut volume, power consumption, and ambient contrast ratio. Their color shifts remained indistinguishable by human eyes when the viewing zone was within 60°. The LMK with a high-resolution CMOS sensor was employed to characterize the halo effect and reconstruct the real luminance profiles. We also adopted a novel strategy to measure the point spread function of the backlight module.

Author Contributions

Methodology, Z.Y. and E.-L.H.; experiments, Z.Y., Y.Q. and E.-L.H.; writing—original draft preparation, Z.Y.; writing—review and editing, S.-T.W.; supervision, S.-T.W. All authors have read and agreed to the published version of the manuscript.

Funding

Nichia Corporation.

Institutional Review Board Statement

Not applicable.

Informed Consent Statement

Not applicable.

Data Availability Statement

The data presented in this study are available from the authors upon reasonable request.

Acknowledgments

The authors are indebted to Jason Adams for valuable discussions and the TechnoTeam Vision for loaning us the LMK.

Conflicts of Interest

The authors declare no conflict of interest.

References

  1. Hsiang, E.L.; Yang, Z.; Yang, Q.; Lan, Y.F.; Wu, S.T. Prospects and challenges of mini-LED, OLED, and micro-LED displays. J. Soc. Inf. Disp. 2021, 29, 446–465. [Google Scholar] [CrossRef]
  2. Liu, W.; Mu, L.; Xu, A.; Zhang, Y.; Qiao, M. 17-6: Invited Paper: 4K HDR “Stacked-Panel” TV Based on Dual-Cell LCD. SID Symp. Dig. Tech. Pap. 2020, 51, 243–245. [Google Scholar] [CrossRef]
  3. Zheng, B.; Deng, Z.; Zheng, J.; Wu, L.; Yang, W.; Lin, Z.; Wang, H.; Shen, P.; Li, J. 41-2: Invited Paper: An Advanced High-Dynamic-Range LCD for Smartphones. SID Symp. Dig. Tech. Pap. 2019, 50, 566–568. [Google Scholar] [CrossRef]
  4. Xiong, J.; Hsiang, E.L.; He, Z.; Zhan, T.; Wu, S.T. Augmented reality and virtual reality displays: Emerging technologies and future perspectives. Light Sci. Appl. 2021, 10, 216. [Google Scholar] [CrossRef] [PubMed]
  5. Hsiang, E.L.; Yang, Z.; Zhan, T.; Zou, J.; Akimoto, H.; Wu, S.T. Optimizing the display performance for virtual reality systems. OSA Continuum. 2021, 4, 3052–3067. [Google Scholar] [CrossRef]
  6. Xu, M.; Hua, H. High dynamic range head mounted display based on dual-layer spatial modulation. Opt. Express 2017, 25, 23320–23333. [Google Scholar] [CrossRef] [Green Version]
  7. Li, Y.; Zhan, T.; Yang, Z.; Xu, C.; LiKamWa, P.L.; Li, K.; Wu, S.T. Broadband cholesteric liquid crystal lens for chromatic aberration correction in catadioptric virtual reality optics. Opt. Express 2021, 29, 6011–6020. [Google Scholar] [CrossRef]
  8. Zhan, T.; Zou, J.; Xiong, J.; Liu, X.; Chen, H.; Yang, J.; Liu, S.; Dong, Y.; Wu, S.T. Practical chromatic aberration correction in virtual reality displays enabled by large-size ultra-broadband liquid crystal polymer lenses. Adv. Opt. Mater. 2020, 8, 1901360. [Google Scholar] [CrossRef]
  9. Chen, H.W.; Lee, J.H.; Lin, B.Y.; Chen, S.; Wu, S.T. Liquid crystal display and organic light-emitting diode display: Present status and future perspectives. Light Sci. Appl. 2018, 7, 17168. [Google Scholar] [CrossRef]
  10. Joo, W.J.; Kyoung, J.; Esfandyarpour, M.; Lee, S.H.; Koo, H.; Song, S.; Brongersma, M.L. Metasurface-driven OLED displays beyond 10,000 pixels per inch. Science 2020, 370, 459–463. [Google Scholar] [CrossRef]
  11. Lin, J.Y.; Jiang, H.X. Development of microLED. Appl. Phys. Lett. 2020, 116, 100502. [Google Scholar] [CrossRef]
  12. Wong, M.S.; Nakamura, S.; DenBaars, S.P. Review—progress in high performance III-nitride micro-light-emitting diodes. ECS J. Solid State Sci. Technol. 2020, 9, 015012. [Google Scholar] [CrossRef]
  13. Huang, Y.; Hsiang, E.L.; Deng, M.Y.; Wu, S.T. Mini-LED, Micro-LED and OLED displays: Present status and future perspectives. Light Sci. Appl. 2020, 9, 105. [Google Scholar] [CrossRef] [PubMed]
  14. Wu, T.; Sher, C.W.; Lin, Y.; Lee, C.F.; Liang, S.; Lu, Y.; Chen, Z. Mini-LED and micro-LED: Promising candidates for the next generation display technology. Appl. Sci. 2018, 8, 1557. [Google Scholar] [CrossRef] [Green Version]
  15. Hsiang, E.L.; He, Z.; Yang, Z.; Lan, Y.F.; Wu, S.T. Tailoring the light distribution of micro-LED displays with a compact compound parabolic concentrator and an engineered diffusor. Opt. Express 2021, 29, 39859–39873. [Google Scholar] [CrossRef]
  16. Wu, Y.; Ma, J.; Su, P.; Zhang, L.; Xia, B. Full-Color Realization of Micro-LED Displays. Nanomaterials 2020, 10, 2482. [Google Scholar] [CrossRef]
  17. Kim, S.E.; An, J.Y.; Hong, J.J.; Lee, T.W.; Kim, C.G.; Song, W.J. How to reduce light leakage and clipping in local-dimming liquid-crystal displays. J. Soc. Inf. Disp. 2009, 17, 1051–1057. [Google Scholar] [CrossRef] [Green Version]
  18. Lin, F.C.; Huang, Y.P.; Liao, L.Y.; Liao, C.Y.; Shieh, H.P.; Wang, T.M.; Yeh, S.C. Dynamic backlight gamma on high dynamic range LCD TVs. J. Disp. Technol. 2008, 4, 139–146. [Google Scholar]
  19. Zhang, X.B.; Wang, R.; Dong, D.; Han, J.H.; Wu, H.X. Dynamic backlight adaptation based on the details of image for liquid crystal displays. J. Disp. Technol. 2012, 8, 108–111. [Google Scholar] [CrossRef]
  20. Tan, G.; Huang, Y.; Chen, M.C.; Lee, S.L.; Wu, S.T. High dynamic range liquid crystal displays with a mini-LED backlight. Opt. Express 2018, 26, 16572–16584. [Google Scholar] [CrossRef] [Green Version]
  21. Akimoto, H.; Yamamoto, A.; Washio, H.; Nakano, T. 46-3: Invited Paper: Design and Process of 2D Backlight Beyond HDR 5000 Nits. SID Symp. Dig. Tech. Pap. 2021, 52, 628–631. [Google Scholar] [CrossRef]
  22. Féry, C.; Racine, B.; Vaufrey, D.; Doyeux, H.; Cinà, S. Physical mechanism responsible for the stretched exponential decay behavior of aging organic light-emitting diodes. Appl. Phys. Lett. 2005, 87, 213502. [Google Scholar] [CrossRef]
  23. Lee, J.H.; Chen, C.H.; Lee, P.H.; Lin, H.Y.; Leung, M.K.; Chiu, T.L.; Lin, C.F. Blue organic light-emitting diodes: Current status, challenges, and future outlook. J. Mater. Chem. C 2019, 7, 5874–5888. [Google Scholar] [CrossRef]
  24. Kim, E.; Chung, J.; Lee, J.; Cho, H.; Cho, N.S.; Yoo, S. A systematic approach to reducing angular color shift in cavity-based organic light-emitting diodes. Org. Electron. 2017, 48, 348–356. [Google Scholar] [CrossRef]
  25. Tan, G.; Lee, J.H.; Lin, S.C.; Zhu, R.; Choi, S.H.; Wu, S.T. Analysis and optimization on the angular color shift of RGB OLED displays. Opt. Express 2017, 25, 33629–33642. [Google Scholar] [CrossRef]
  26. Lee, S.H.; Lee, S.L.; Kim, H.Y. Electro-optic characteristics and switching principle of a nematic liquid crystal cell controlled by fringe-field switching. Appl. Phys. Lett. 1998, 73, 2881–2883. [Google Scholar] [CrossRef]
  27. Chen, H.; Tan, G.; Wu, S.T. Ambient contrast ratio of LCDs and OLED displays. Opt. Express 2017, 25, 33643–33656. [Google Scholar] [CrossRef]
  28. Black Uniformity of TVs. Available online: https://www.rtings.com/tv/tests/picture-quality/black-uniformity-clouding-flashlighting (accessed on 30 November 2021).
  29. Hsiang, E.L.; Yang, Q.; He, Z.; Zou, J.; Wu, S.T. Halo effect in high-dynamic-range mini-LED backlit LCDs. Opt. Express 2020, 28, 36822–36837. [Google Scholar] [CrossRef]
  30. Huang, Y.; Tan, G.; Gou, F.; Li, M.C.; Lee, S.L.; Wu, S.T. Prospects and challenges of mini-LED and micro-LED displays. J. Soc. Inf. Disp. 2019, 27, 387–401. [Google Scholar] [CrossRef]
Figure 1. Luminance dependence on the APL.
Applsci 12 01239 g001
Figure 2. (a) Gamma curves for the mLCD and the OLED display and (b) gamma curves at low gray levels.
Applsci 12 01239 g002
Figure 3. Measured 2D luminance distributions at the second gray level of the (a) mLCD and (b) OLED panels.
Applsci 12 01239 g003
Figure 4. (a) Measurement procedure and setting for the color gamut volume and (b) measured color gamut volumes of the mLCD and the OLED display.
Applsci 12 01239 g004
Figure 5. Measured (a) white spectra and (b) color shifts of the mLCD and the OLED panels.
Applsci 12 01239 g005
Figure 6. Power consumption as a function of the APL for the 15.6-inch mLCD and OLED display panels.
Applsci 12 01239 g006
Figure 7. (a) Top view of the ACR measurement setting. (b) Measured ACR of the mLCD and OLED panels.
Applsci 12 01239 g007
Figure 8. Measurement procedure for the halo effect.
Applsci 12 01239 g008
Figure 9. (a) Luminance profiles on the CMOS sensor for the mLCDs driven in the HDR1000 and HDR600 modes and the OLED display. (b) Real luminance profiles on the display screen for the mLCDs driven in the HDR1000 and HDR600 modes.
Applsci 12 01239 g009
Figure 10. (a) Two-dimensional luminance distribution for the backlight. (b) One-dimensional luminance profile.
Applsci 12 01239 g010
Publisher’s Note: MDPI stays neutral with regard to jurisdictional claims in published maps and institutional affiliations.

