
Role of Bimodal Water Retention Curve on the Unsaturated Shear Strength


Abstract
:1. Introduction
2. Investigated Soil and Methodology
2.1. Investigated Soils
2.2. Methodology
3. Mathematical Equation
3.1. Applicable Theory
- θs1 = saturated volumetric water content
- θs2 = volumetric water content related to air-entry value 2
- β1 = 0 when ψ ≤ ψa1; β1 = 1 when ψ > ψa1
- β2 = 0 when ψ ≤ ψa2; β2 = 1 when ψ > ψa2
- Cr = input parameter according to Fredlung and Xing [43] (kPa)
- erfc = the complementary error function,
- ψm1 = parameter related to suction at the inflection point 1 (Figure 1)
- ψm2 = parameter related to suction at the inflection point 2 (Figure 1)
- θr = parameter related to volumetric water content at residual condition (Figure 1)
- s1 = parameter related to standard deviation 1 (Figure 1)
- s2 = parameter related to standard deviation 2 (Figure 1)
- AEV = air-entry value of soil (kPa)
- y and b = fitting parameters.
- Ip = plasticity index.
- n = fitting parameter from Fredlund and Xing [43] equation for fitting WRC
3.2. Proposed Equation
4. Results of Laboratory Testing
5. Discussion
6. Conclusions
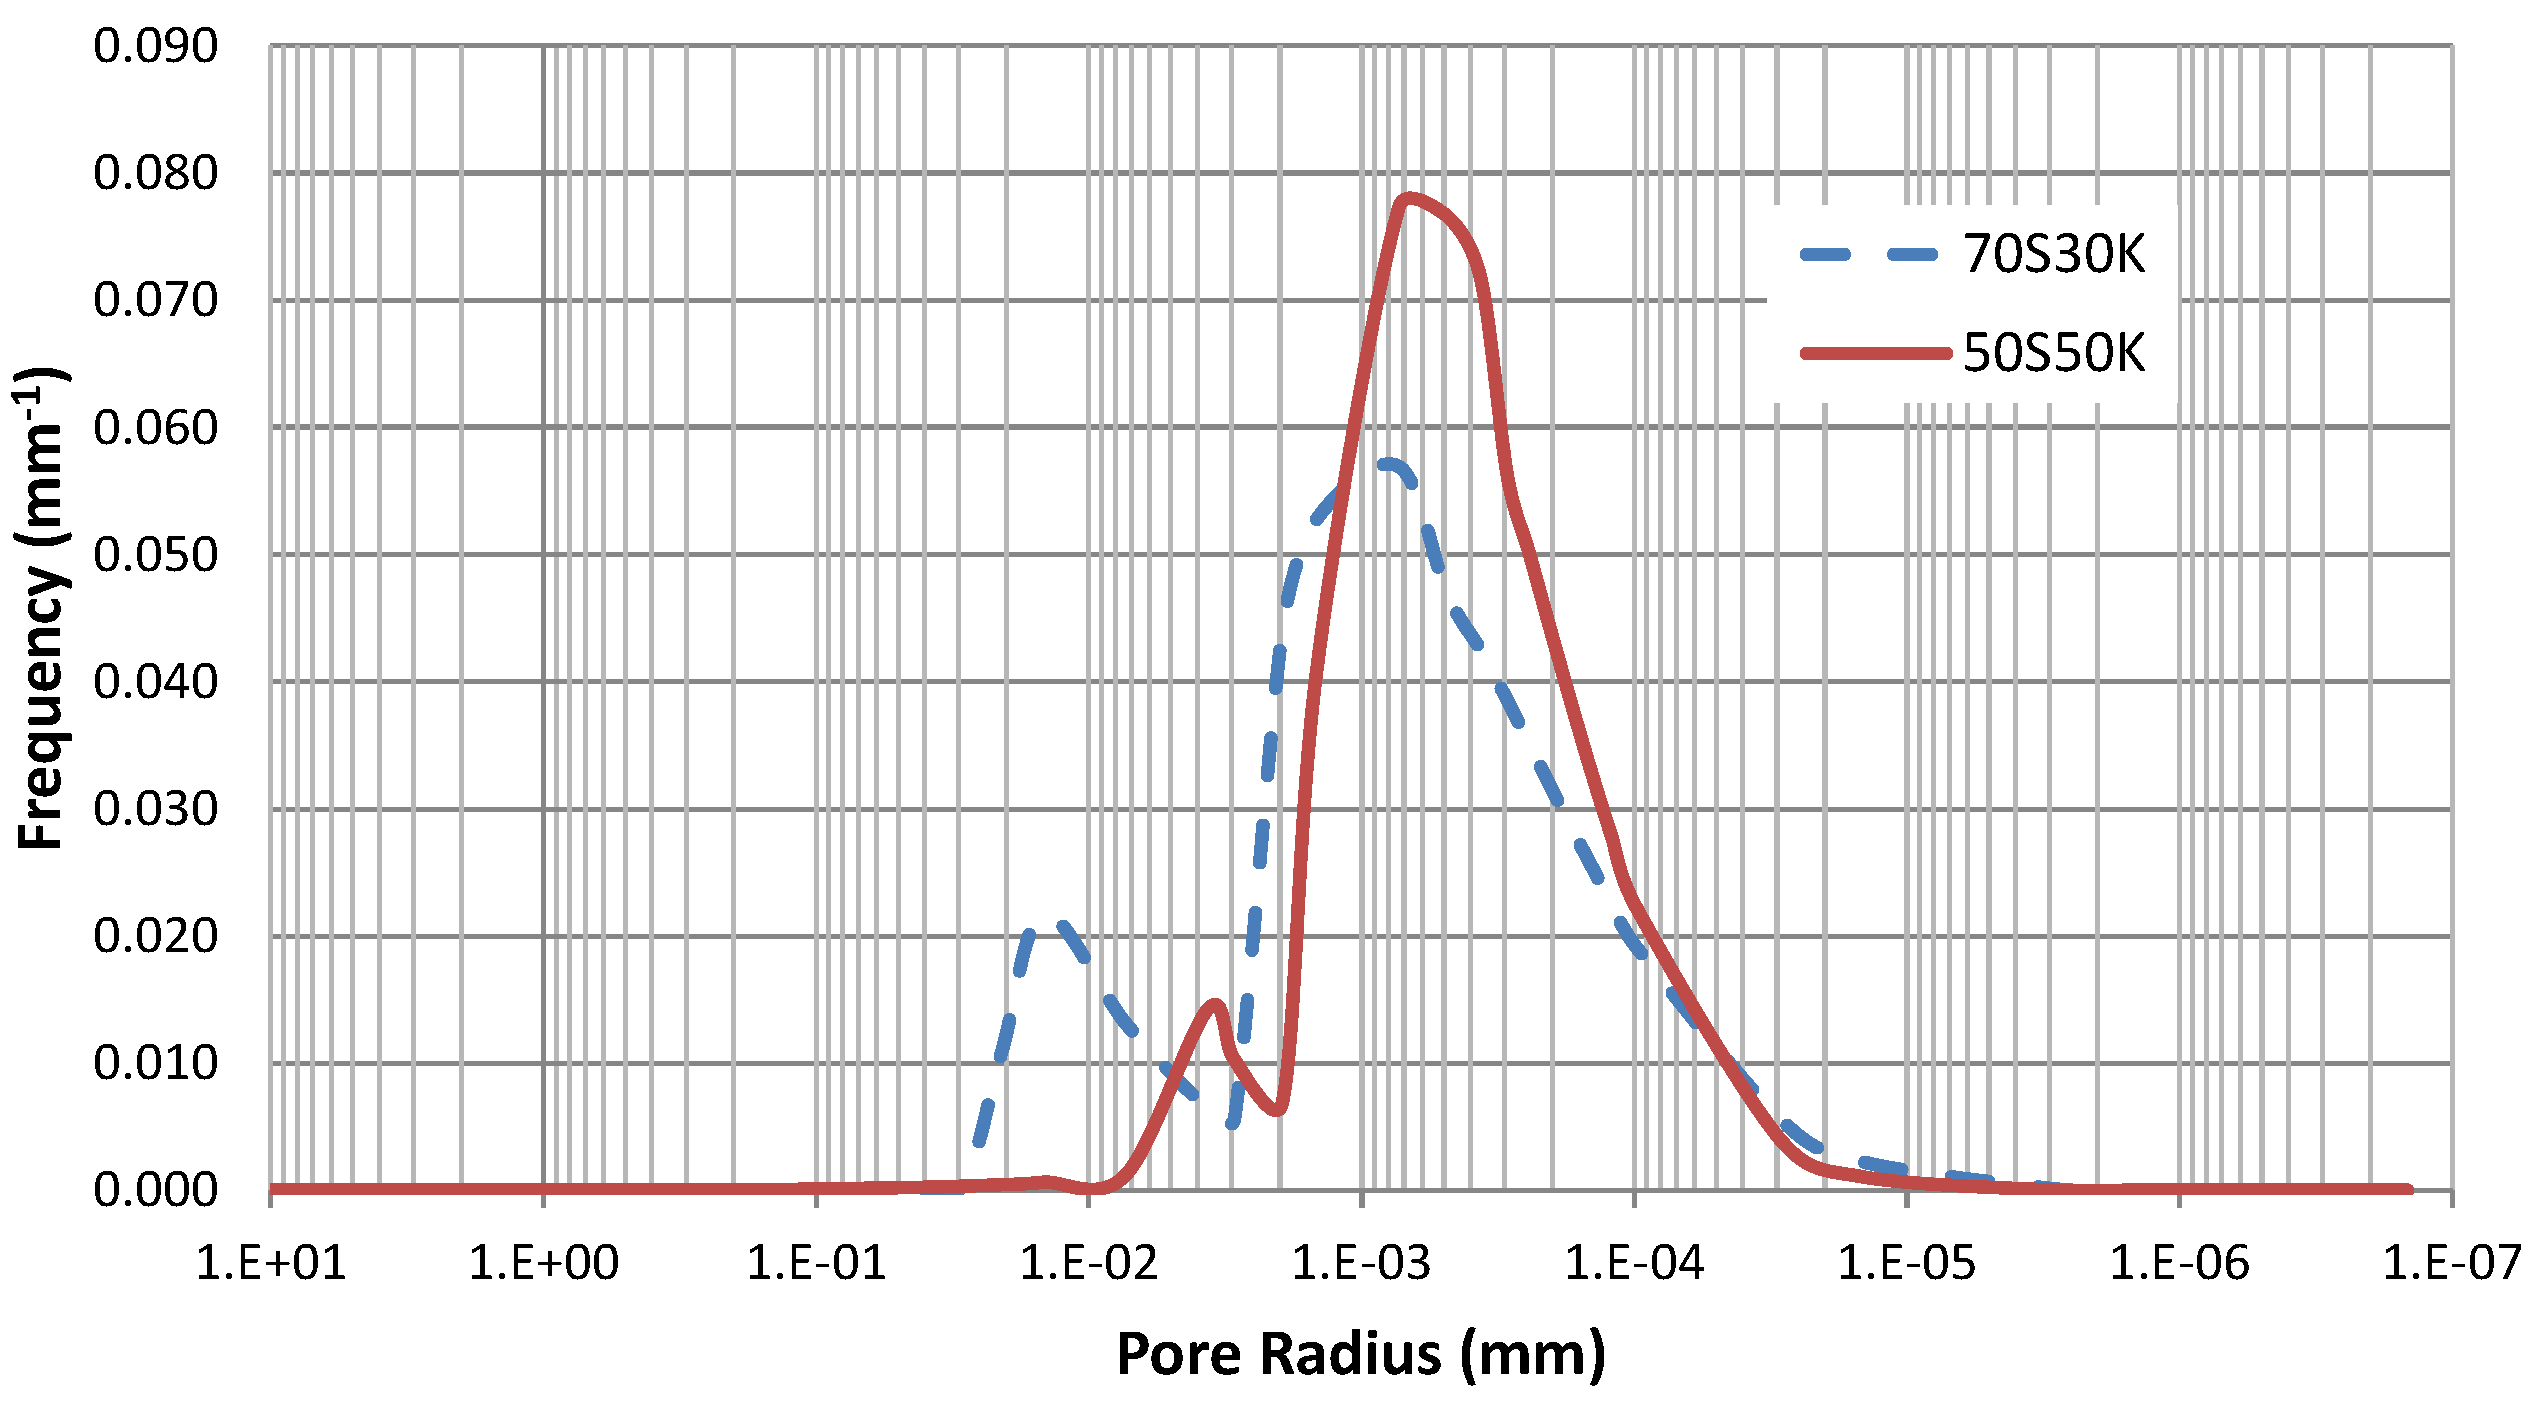
- Lower air-entry value and lower inflection point of soil WRC signify larger sizes of dominant macropore and micropore in PSD of soil.
- Dual porosity structure in PSD is more unlikely if there are higher percentages of fine-grained particles inside the soil.
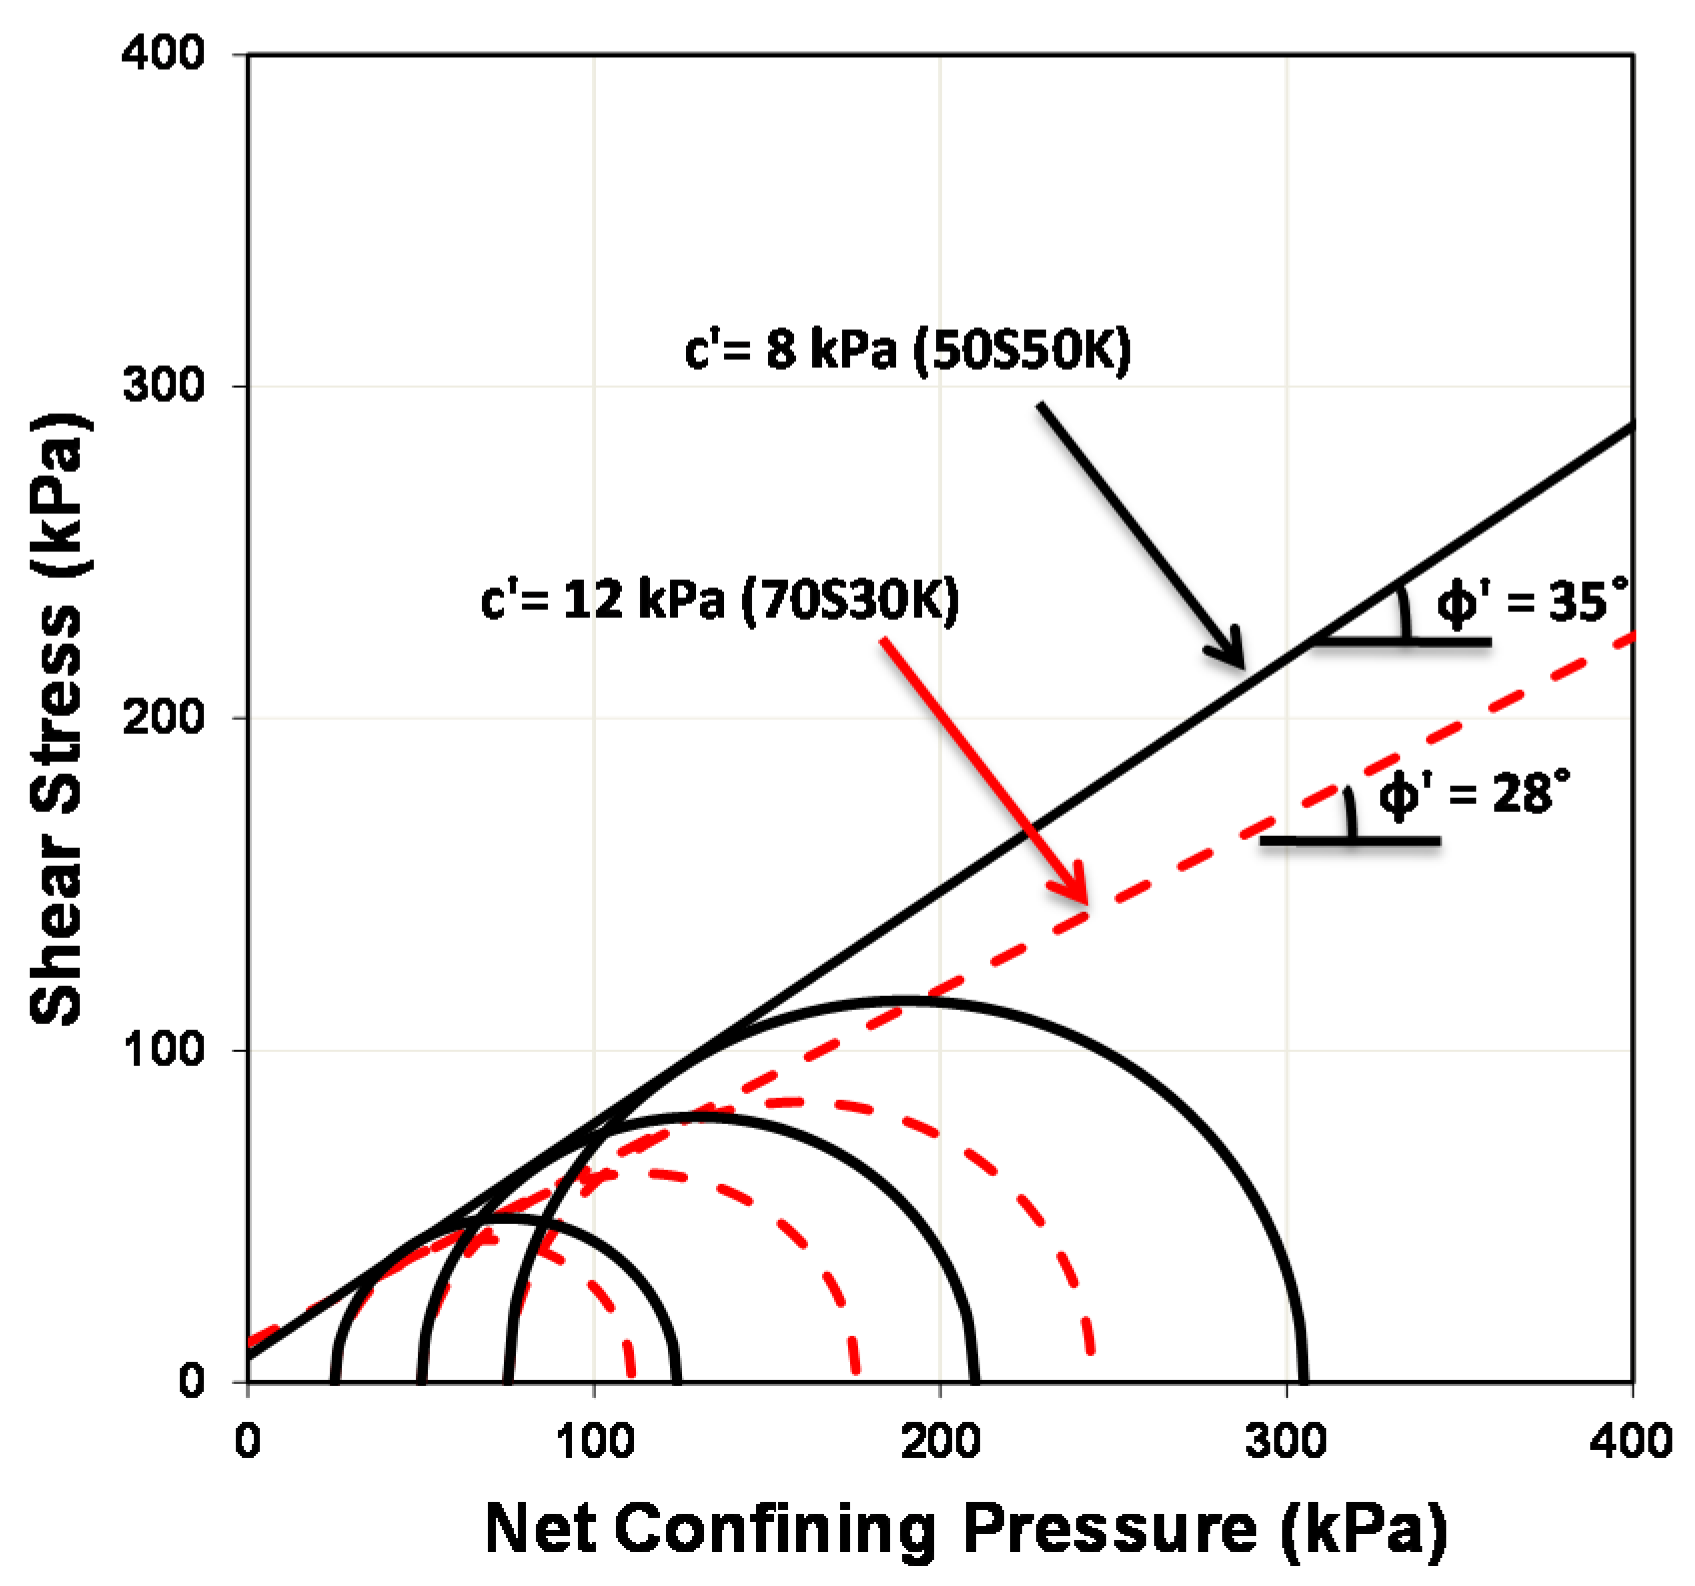
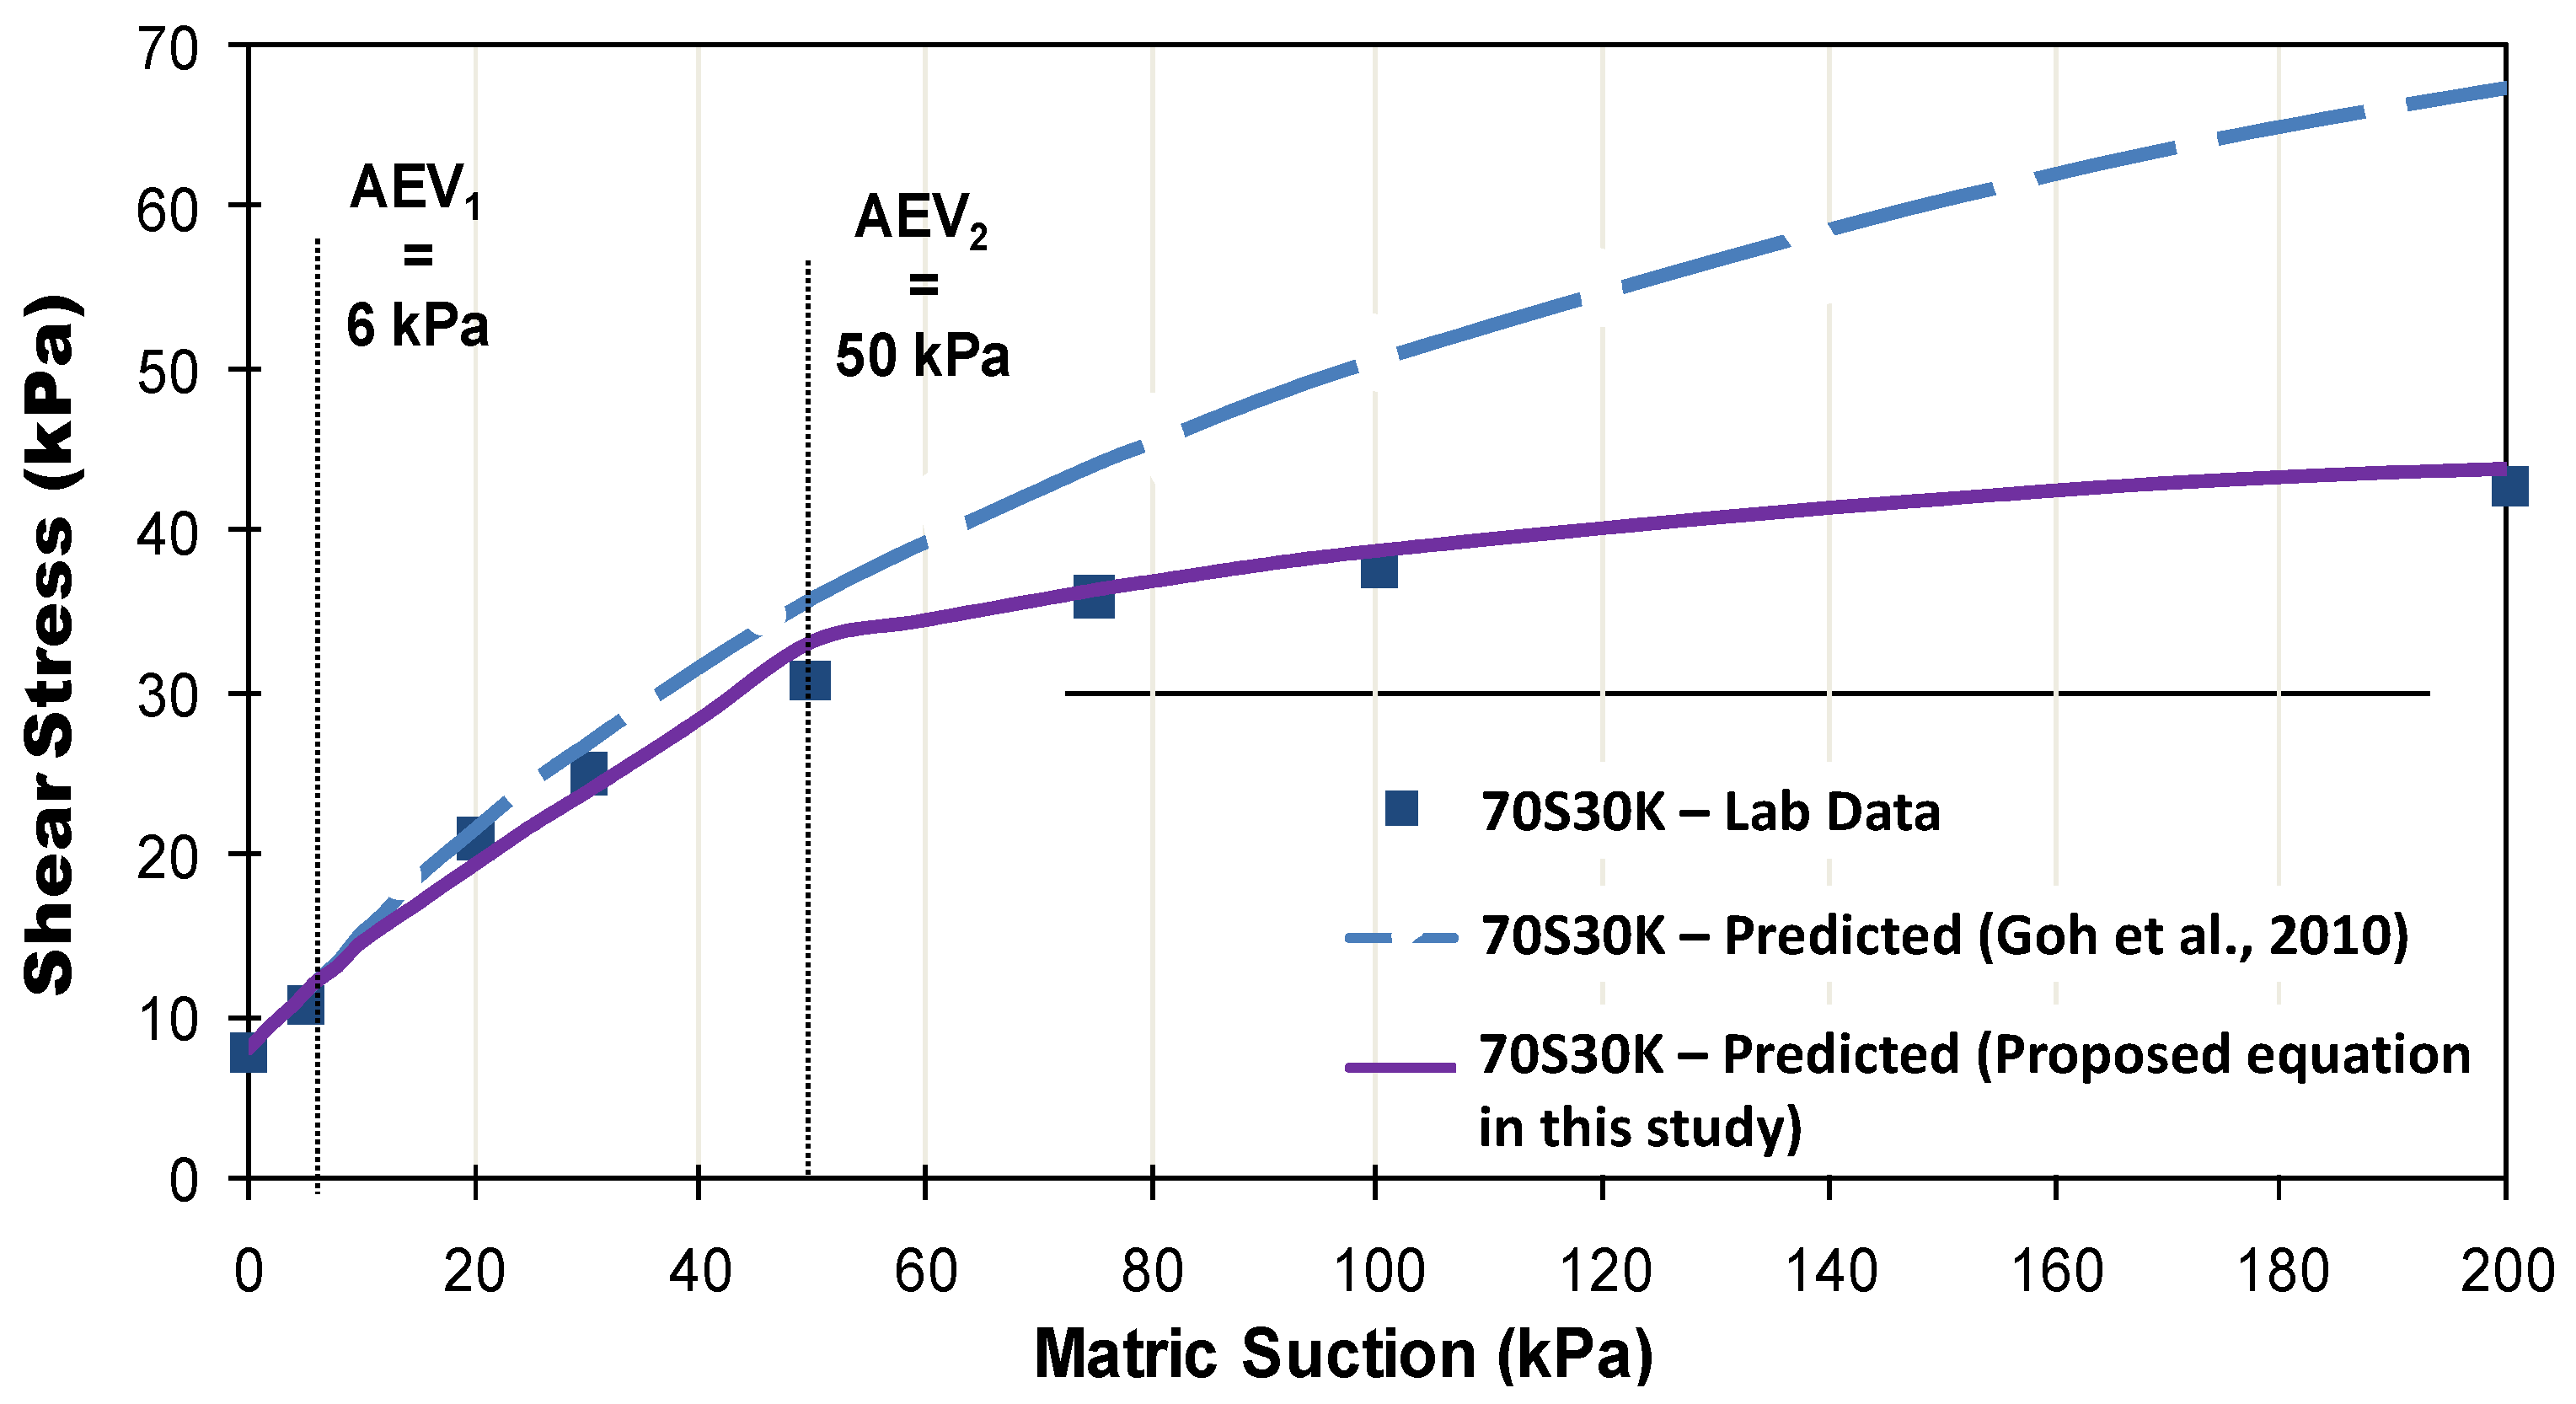
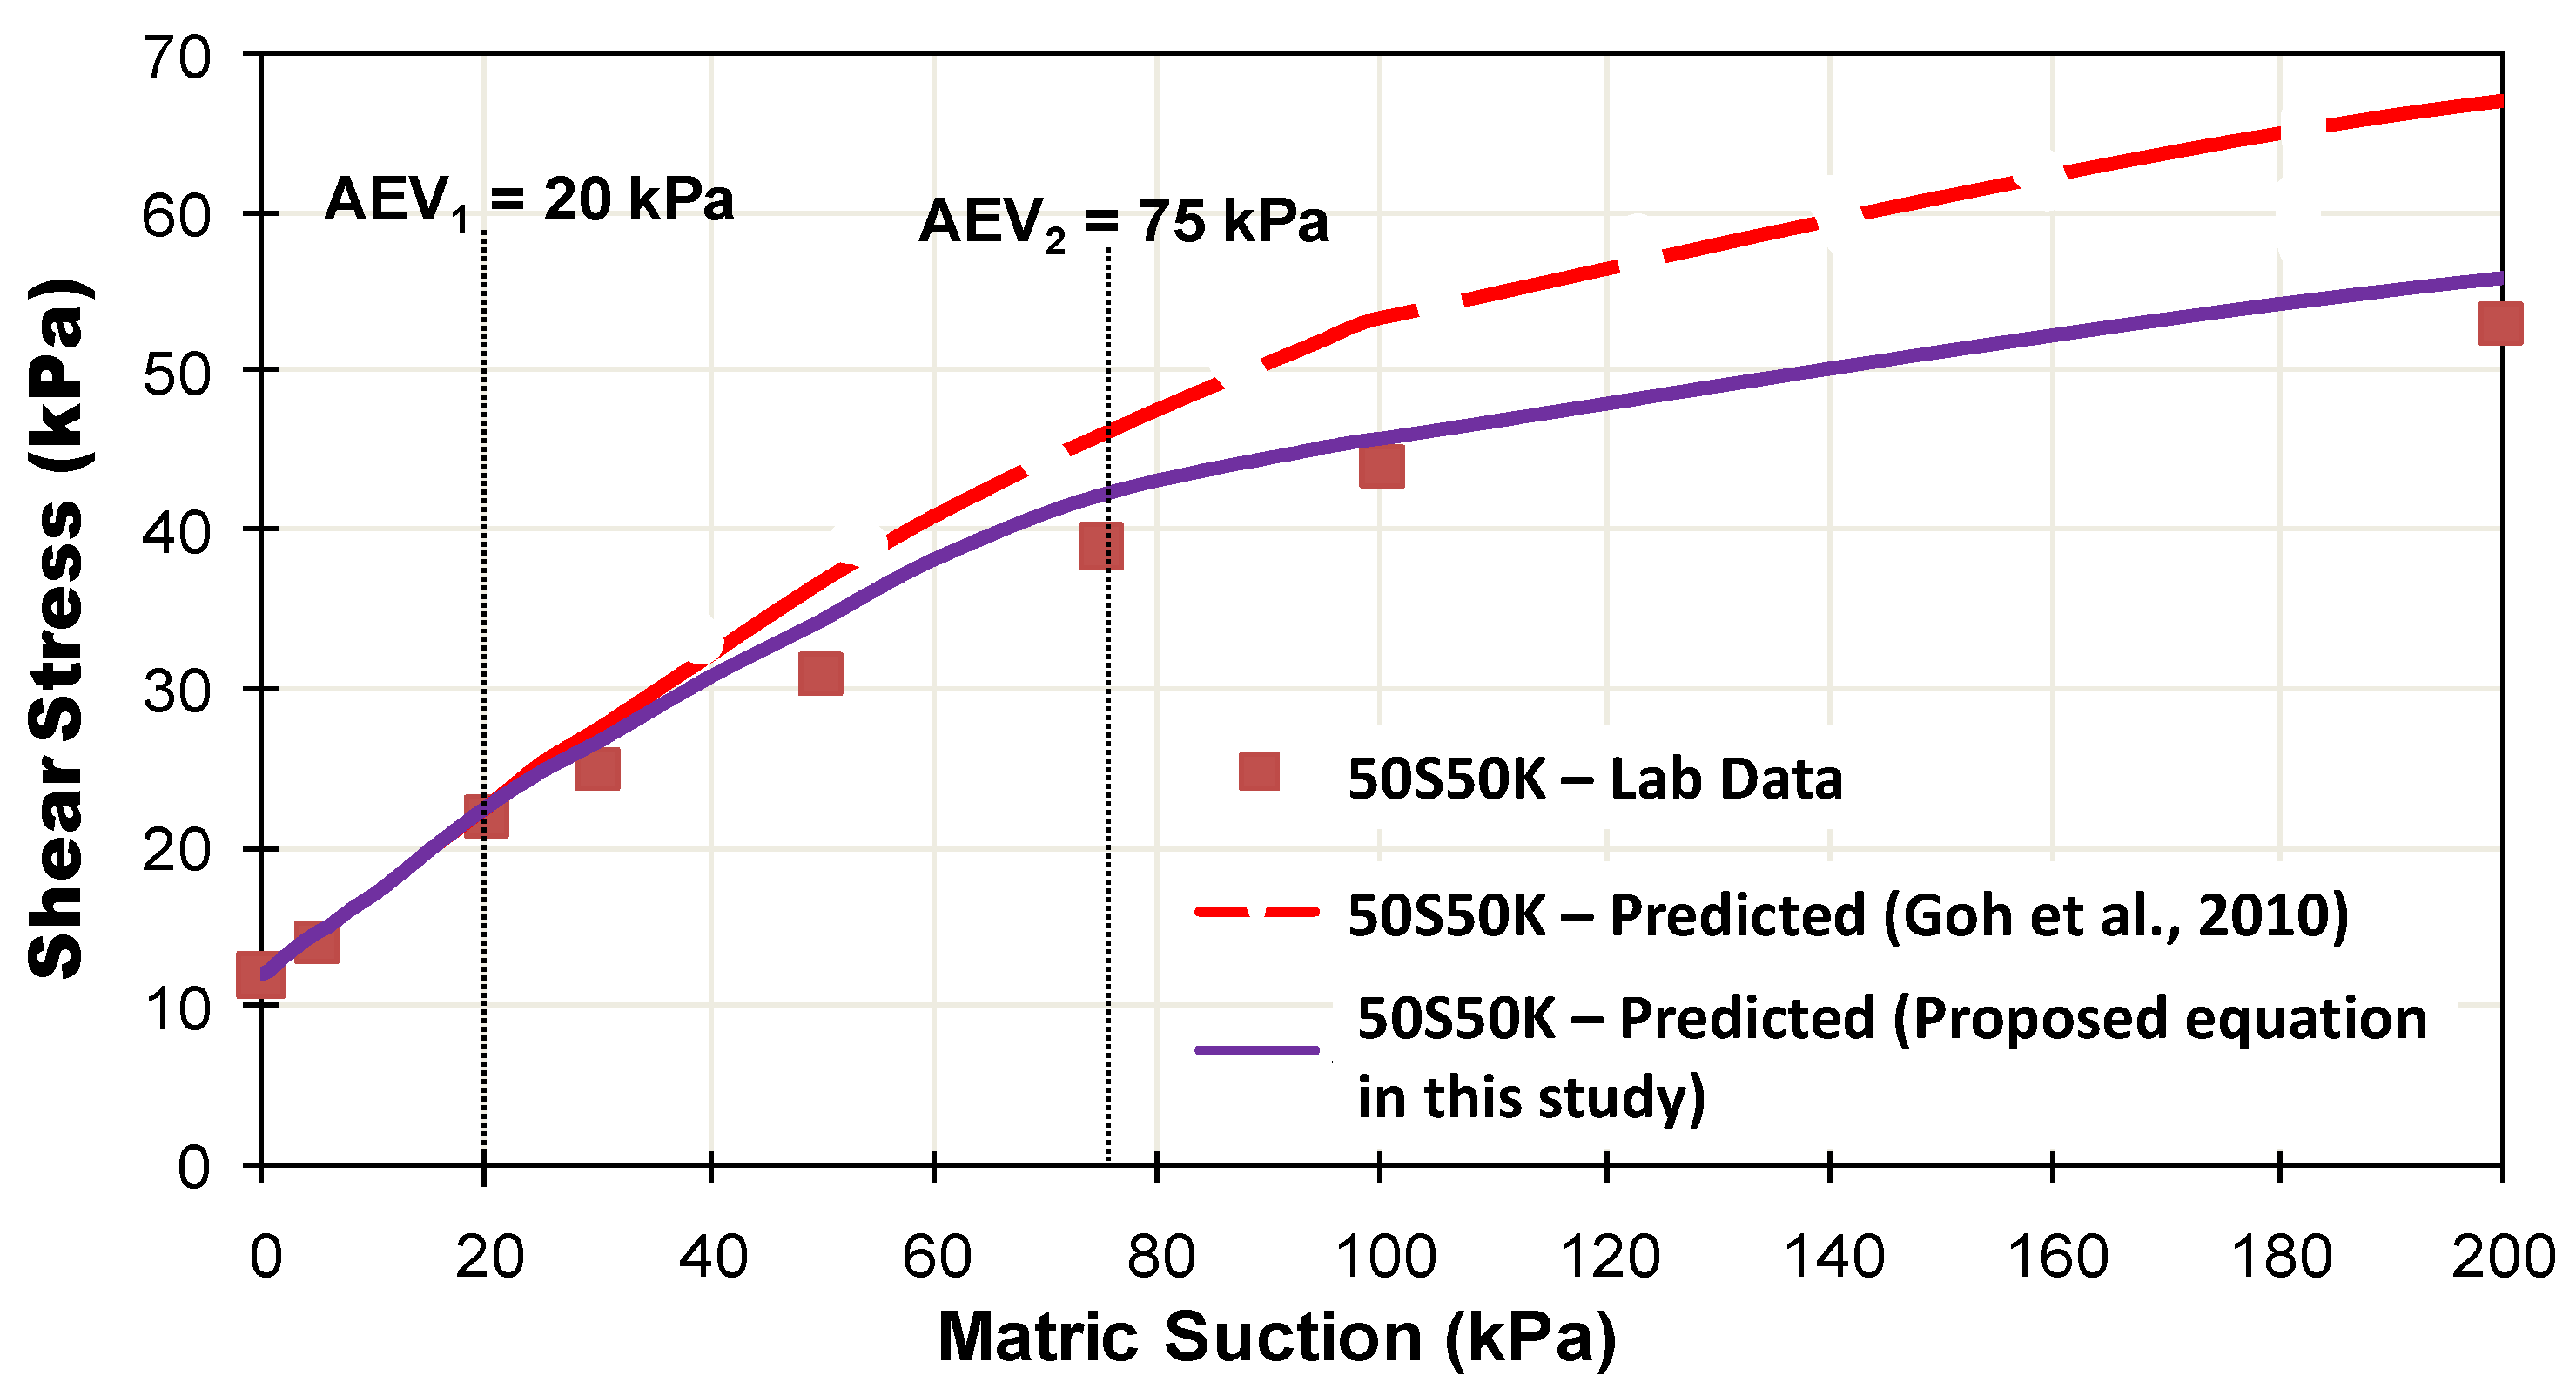
- For matric suctions less than AEV1, the relationship between shear strength and matric suction is linear and ϕb is the same with ϕ′.
- For matric suctions between AEV1 and AEV2, the relationship between shear strength and matric suction is still linear but ϕb is less than ϕ′.
- For matric suctions beyond AEV2, the relationship between shear strength and matric suction is non-linear and ϕb is much smaller than ϕ′.
- A new mathematical equation has been proposed to estimate the unsaturated shear strength of soil with bimodal water retention curve. The proposed equation has been evaluated and it is in agreement with the experimental data of the unsaturated shear strength carried out in this study.
Author Contributions
Funding
Data Availability Statement
Conflicts of Interest
References
- Li, J.H.; Zhang, L.M. Geometric parameters and REV of a crack network in soil. Comput. Geotech. 2010, 37, 466–475. [Google Scholar] [CrossRef]
- Wang, H.B.; Zhou, B.; Wu, S.R.; Shi, J.S.; Li, B. Characteristic analysis of large-scale loess landslides: A case study in Baoji City of Loess Plateau of Northwest China. Nat. Hazards Earth Syst. Sci. 2011, 11, 1829–1837. [Google Scholar] [CrossRef]
- Pu, J.; Wallwork, J.; Khan, A.; Pandey, M.; Pourshahbaz, H.; Satyanaga, A.; Hanmaiahgari, P.; Gough, T. Flood Suspended Sediment Transport: Combined Modelling from Dilute to Hyper-Concentrated Flow. Water 2021, 13, 379. [Google Scholar] [CrossRef]
- Zhanabayeva, A.; Sagidullina, N.; Kim, J.; Satyanaga, A.; Lee, D.; Moon, S.-W. A comparative analysis of Kazakhstani and European design specifications: Raft foundation, pile foundation, and piled raft foundation. Appl. Sci. 2021, 11, 3099. [Google Scholar] [CrossRef]
- Kristo, C.; Rahardjo, H.; Satyanaga, A. Effect of hysteresis on the stability of residual soil slope. Int. Soil Water Conserv. Res. 2019, 7, 226–238. [Google Scholar] [CrossRef]
- Satyanaga, A.; Rahardjo, H. Role of Unsaturated Soil Properties in The Development of Slope Susceptibility Map. Proc. Inst. Civ. Eng.-Geotech. Eng. 2020, 1–44. [Google Scholar] [CrossRef]
- Rahardjo, H.; Satyanaga, A.; Leong, E.C.; Ng, Y.S.; Foo, M.D.; Wang, C.L. Slope failures in Singapore due to rainfall. In Proceedings of the 10th Australia New Zealand Conference on Geomechanics “Common Ground”, Brisbane, Australia, 21–24 October 2007; Volume 2, pp. 704–709. [Google Scholar]
- Nistor, M.M.; Rahardjo, H.; Satyanaga, A.; Koh, Z.H.; Qin, X.; Sham, A.W.L. Investigation of groundwater table distribution using borehole piezometer data interpolation: Case study of Singapore. Eng. Geol. 2020, 271, 105590. [Google Scholar] [CrossRef]
- Satyanaga, A.; Rahardjo, H.; Hua, C.J. Numerical Simulation of Capillary Barrier System under Rainfall Infiltration. ISSMGE Int. J. Geoengin. Case Hist. 2019, 5, 43–54. [Google Scholar]
- Ip, S.C.; Rahardjo, H.; Satyanaga, A. Three-dimensional slope stability analysis incorporating unsaturated soil properties in Singapore. Georisk Assess. Manag. Risk Eng. Syst. Geohazards 2020, 15, 98–112. [Google Scholar] [CrossRef]
- Tamm, T.; Nõges, T.; Järvet, A.; Bouraoui, F. Contributions of DOC from surface and groundflow into Lake Võrtsjärv (Estonia). In European Large Lakes Ecosystem Changes and Their Ecological and Socioeconomic Impacts. Developments in Hydrobiology; Nõges, T., Ed.; Springer: Dordrecht, The Netherlands, 2007; Volume 199. [Google Scholar]
- Zhai, Q.; Rahardjo, H.; Satyanaga, A.; Priono. Effect of bimodal soil-water characteristic curve on the estimation of permeability function. Eng. Geol. 2017, 230, 142–151. [Google Scholar] [CrossRef]
- Rahardjo, H.; Satyanaga, A.; Harnas, F.R.; Leong, E. Use of Dual Capillary Barrier as Cover System for a Sanitary Landfill in Singapore. Indian Geotech. J. 2016, 46, 228–238. [Google Scholar] [CrossRef]
- Syarifudin, A.; Satyanaga, A. Variability of bimodal soil-water characteristic curves under different confining pressure. Appl. Environ. Soil Sci. 2021, 2021, 5569491. [Google Scholar] [CrossRef]
- Wang, D.; Li, C.; Parikh, S.J.; Scow, K.M. Impact of biochar on water retention of two agricultural soils—A multi-scale analysis. Geoderma 2019, 340, 185–191. [Google Scholar] [CrossRef]
- Li, Y.; Satyanaga, A.; Rahardjo, H. Characteristics of unsaturated soil slope covered with capillary barrier system and deep-rooted grass under different rainfall patterns. Int. Soil Water Conserv. Res. 2021, 9, 405–418. [Google Scholar] [CrossRef]
- Satyanaga, A.; Rahardjo, H.; Leong, E.; Wang, J.-Y. Water characteristic curve of soil with bimodal grain-size distribution. Comput. Geotech. 2013, 48, 51–61. [Google Scholar] [CrossRef]
- Wijaya, M.; Leong, E. Equation for unimodal and bimodal soil-water characteristic curves. Soils Found. 2016, 56, 291–300. [Google Scholar] [CrossRef]
- Chen, R.-P.; Liu, P.; Liu, X.-M.; Wang, P.-F.; Kang, X. Pore-scale model for estimating the bimodal soil-water characteristic curve and hydraulic conductivity of compacted soils with different initial densities. Eng. Geol. 2019, 260, 105199. [Google Scholar] [CrossRef]
- Yan, W.; Birle, E.; Cudmani, R. A new framework to determine general multimodal soil water characteristic curves. Acta Geotech. 2021, 16, 3187–3208. [Google Scholar] [CrossRef]
- Yeh, H.-F.; Huang, T.-T.; Lee, J.-W. Effect of Unimodal and Bimodal Soil Hydraulic Properties on Slope Stability Analysis. Water 2021, 13, 1674. [Google Scholar] [CrossRef]
- Rahardjo, H.; Satyanaga, A.; D’Amore, G.A.R.; Leong, E.C. Soil-water Characteristic Curves of Gap-graded Soils. J. Eng. Geol. 2012, 125, 102–107. [Google Scholar] [CrossRef]
- Satyanaga, A.; Zhai, Q.; Rahardjo, H. Estimation of Unimodal Water Characteristic Curve for Gap-graded Soil. Soils Found. 2017, 57, 789–801. [Google Scholar] [CrossRef]
- Rahimi, A.; Rahardjo, H.; Leong, E.-C. Effects of soil–water characteristic curve and Page 18 of 30 relative permeability equations on estimation of unsaturated permeability function. Soils Found. 2015, 55, 1400–1411. [Google Scholar] [CrossRef] [Green Version]
- Zhai, Q.; Rahardjo, H.; Satyanaga, A.; Dai, G.; Zhuang, Y. Framework to estimate the soil-water characteristic curve for soils with different void ratios. Bull. Int. Assoc. Eng. Geol. 2020, 79, 4399–4409. [Google Scholar] [CrossRef]
- Zhai, Q.; Rahardjo, H.; Satyanaga, H.; Priono; Dai, G. Role of the pore-size distribution function on water flow in unsaturated soil. J. Zhejiang Univ. Sci. A 2019, 20, 10–20. [Google Scholar] [CrossRef]
- Zhai, Q.; Rahardjo, H.; Satyanaga, A. A pore-size distribution function based method for estimation of hydraulic properties of sandy soils. Eng. Geol. 2018, 246, 288–292. [Google Scholar] [CrossRef]
- Zhai, Q.; Rahardjo, H.; Satyanaga, A. Variability in unsaturated hydraulic properties of residual soil in Singapore. Eng. Geol. 2016, 209, 21–29. [Google Scholar] [CrossRef]
- Fredlund, D.G.; Rahardjo, H. Soil Mechanics for Unsaturated Soils; Wiley: New York, NY, USA, 1993. [Google Scholar]
- Satyanaga, A.; Rahardjo, H. Unsaturated shear strength of soil with bimodal soil-water characteristic curve. Geotechnique 2019, 69, 828–832. [Google Scholar] [CrossRef]
- Fredlund, D.G.; Rahardjo, H.; Gan, J.K.M. Non-linearity of Strength Envelope for Unsaturated Soils. In Proceedings of the 6th International Conference on Expansive Soils, New Delhi, India, 1–4 December 1987; pp. 49–54. [Google Scholar]
- Vanapalli, S.K.; Fredlund, D.G.; Pufahl, D.E.; Clifton, A.W. Model for the prediction of shear strength with respect to soil suction. Can. Geotech. J. 1996, 33, 379–392. [Google Scholar] [CrossRef]
- Priono; Rahardjo, H.; Leong, E.C.; Chatterjea, K. Effects of mica content on hydraulic anisotropy of unsaturated soil. In Landslides and Engineered Slopes. Experience, Theory and Practice; CRC Press: Boca Raton, FL, USA, 2016; pp. 1675–1683. [Google Scholar]
- Rahardjo, H.; Satyanaga, A.; Mohamed, H.; Ip, S.; Shah, R.S. Comparison of Soil–Water Characteristic Curves from Conventional Testing and Combination of Small-Scale Centrifuge and Dew Point Methods. Geotech. Geol. Eng. 2018, 37, 659–672. [Google Scholar] [CrossRef]
- ASTM D422-63; Standard Test Method for Particle–Size Analysis of Soils. ASTM International: West Conshohocken, PA, USA, 2002.
- ASTM D4318-00; Standard Test Methods for Liquid Limit, Plastic Limit, and Plasticity Index of Soils. ASTM International: West Conshohocken, PA, USA, 2000.
- ASTM D854-02; Standard Test Methods for Specific Gravity of Soil Solids by Water Pycnometer. ASTM International: West Conshohocken, PA, USA, 2002.
- ASTM D698-12E1; Standard Test Methods for Laboratory Compaction Characteristics of Soil Using Standard Effort (12 400 ft-lbf/ft3 (600 kN-m/m3)). ASTM International: West Conshohocken, PA, USA, 2012.
- ASTM D2487-00; Standard Practice for Classification of Soils for Engineering Purposes, Unified Soil Classification System. ASTM International: West Conshohocken, PA, USA, 2000.
- ASTM D6836-16; Standard Test Methods for Determination of the Soil Water Characteristic Curve for Desorption Using Hanging Column, Pressure Extractor, Chilled Mirror Hygrometer, or Centrifuge. ASTM International: West Conshohocken, PA, USA, 2016.
- Satyanaga, A.; Rahardjo, H.; Koh, Z.H.; Mohamed, H. Measurement of a Soil-water Characteristic Curve and Unsaturated Permeability using the Evaporation Method and the Chilled-Mirror Method. J. Zhejiang Univ. Sci. A 2019, 20, 368–375. [Google Scholar] [CrossRef]
- Hilf, J.W. An Investigation of Pore-Water Pressure in Compacted Cohesive Soils; U.S. Department of the Interior, Bureau of Land Reclamation, Design and Construction Division: Denver, CO, USA, 1956; Technical Memoranda No. 654.
- Fredlund, D.; Xing, A. Equations for the soil-water characteristic curve. Can. Geotech. J. 1994, 31, 521–532. [Google Scholar] [CrossRef]
- Goh, S.G.; Rahardjo, H.; Leong, E.C. Closure to “Shear Strength Equations for Unsaturated Soil under Drying and Wetting” by Goh Shin Guan, Harianto Rahardjo, and Leong Eng Choon. J. Geotech. Geoenviron. Eng. 2011, 137, 1313–1315. [Google Scholar] [CrossRef]
- Brooks, R.; Corey, T. HYDRAU uc properties of porous media. Hydrol. Pap. Colo. State Univ. 1964, 24, 37. [Google Scholar]
- Sivakumar, V.; Wheeler, S.J. Influence of Compaction Procedure on the Mechanical Behaviour of an Unsaturated Compacted Clay, Part 1: Wetting and Isotropic Compression. Géotechnique 2000, 50, 359–368. [Google Scholar] [CrossRef]
- Santamarina, J.C.; Fam, M. Changes in dielectric permittivity and shear wave velocity during concentration diffusion. Can. Geotech. J. 1995, 32, 647–659. [Google Scholar] [CrossRef]
- Jang, J.; Santamarina, J.C. Fines Classification Based on Sensitivity to Pore-Fluid Chemistry. J. Geotech. Geoenviron. Eng. 2016, 142, 06015018. [Google Scholar] [CrossRef] [Green Version]
- Santamarina, J.C.; Cho, G.C. Soil behaviour: The role of particle shape. In Advances in Geotechnical Engineering: The Skempton Conference; Jardine, R.J., Potts, D.M., Higgins, K.G., Eds.; Thomas Telford: London, UK, 2004; Volume 1, pp. 604–617. [Google Scholar]
- Santamarina, J.C.; Klein, K.A.; Fam, M.A. Soils and Waves: Particulate Materials Behavior, Characterization and Process Monitoring; Wiley: Chichester, UK, 2001. [Google Scholar]
- Santamarina, J.C.; Shin, H. Friction in Granular Media. Meso-scale Shear Physics in Earthquake and Landslide Mechanics; CRC Press: London, UK, 2009; pp. 157–188. [Google Scholar]
- Santamarina, J.C.; Klein, K.A.; Wang, Y.-H.; Prencke, E. Specific surface: Determination and relevance. Can. Geotech. J. 2002, 39, 233–241. [Google Scholar] [CrossRef]


| Laboratory Testing | ASTM |
|---|---|
| Grain-size distribution | ASTM D422-63 [35] |
| Atterberg limit | ASTM D4318-00 [36] |
| Specific gravity | ASTM D854-02 [37] |
| Standard Proctor | ASTM D698-12e1 [38] |
| Unified soil classification system (USCS) | ASTM D2487-00 [39] |
| Soil Properties | 70S30K | 50S50K |
|---|---|---|
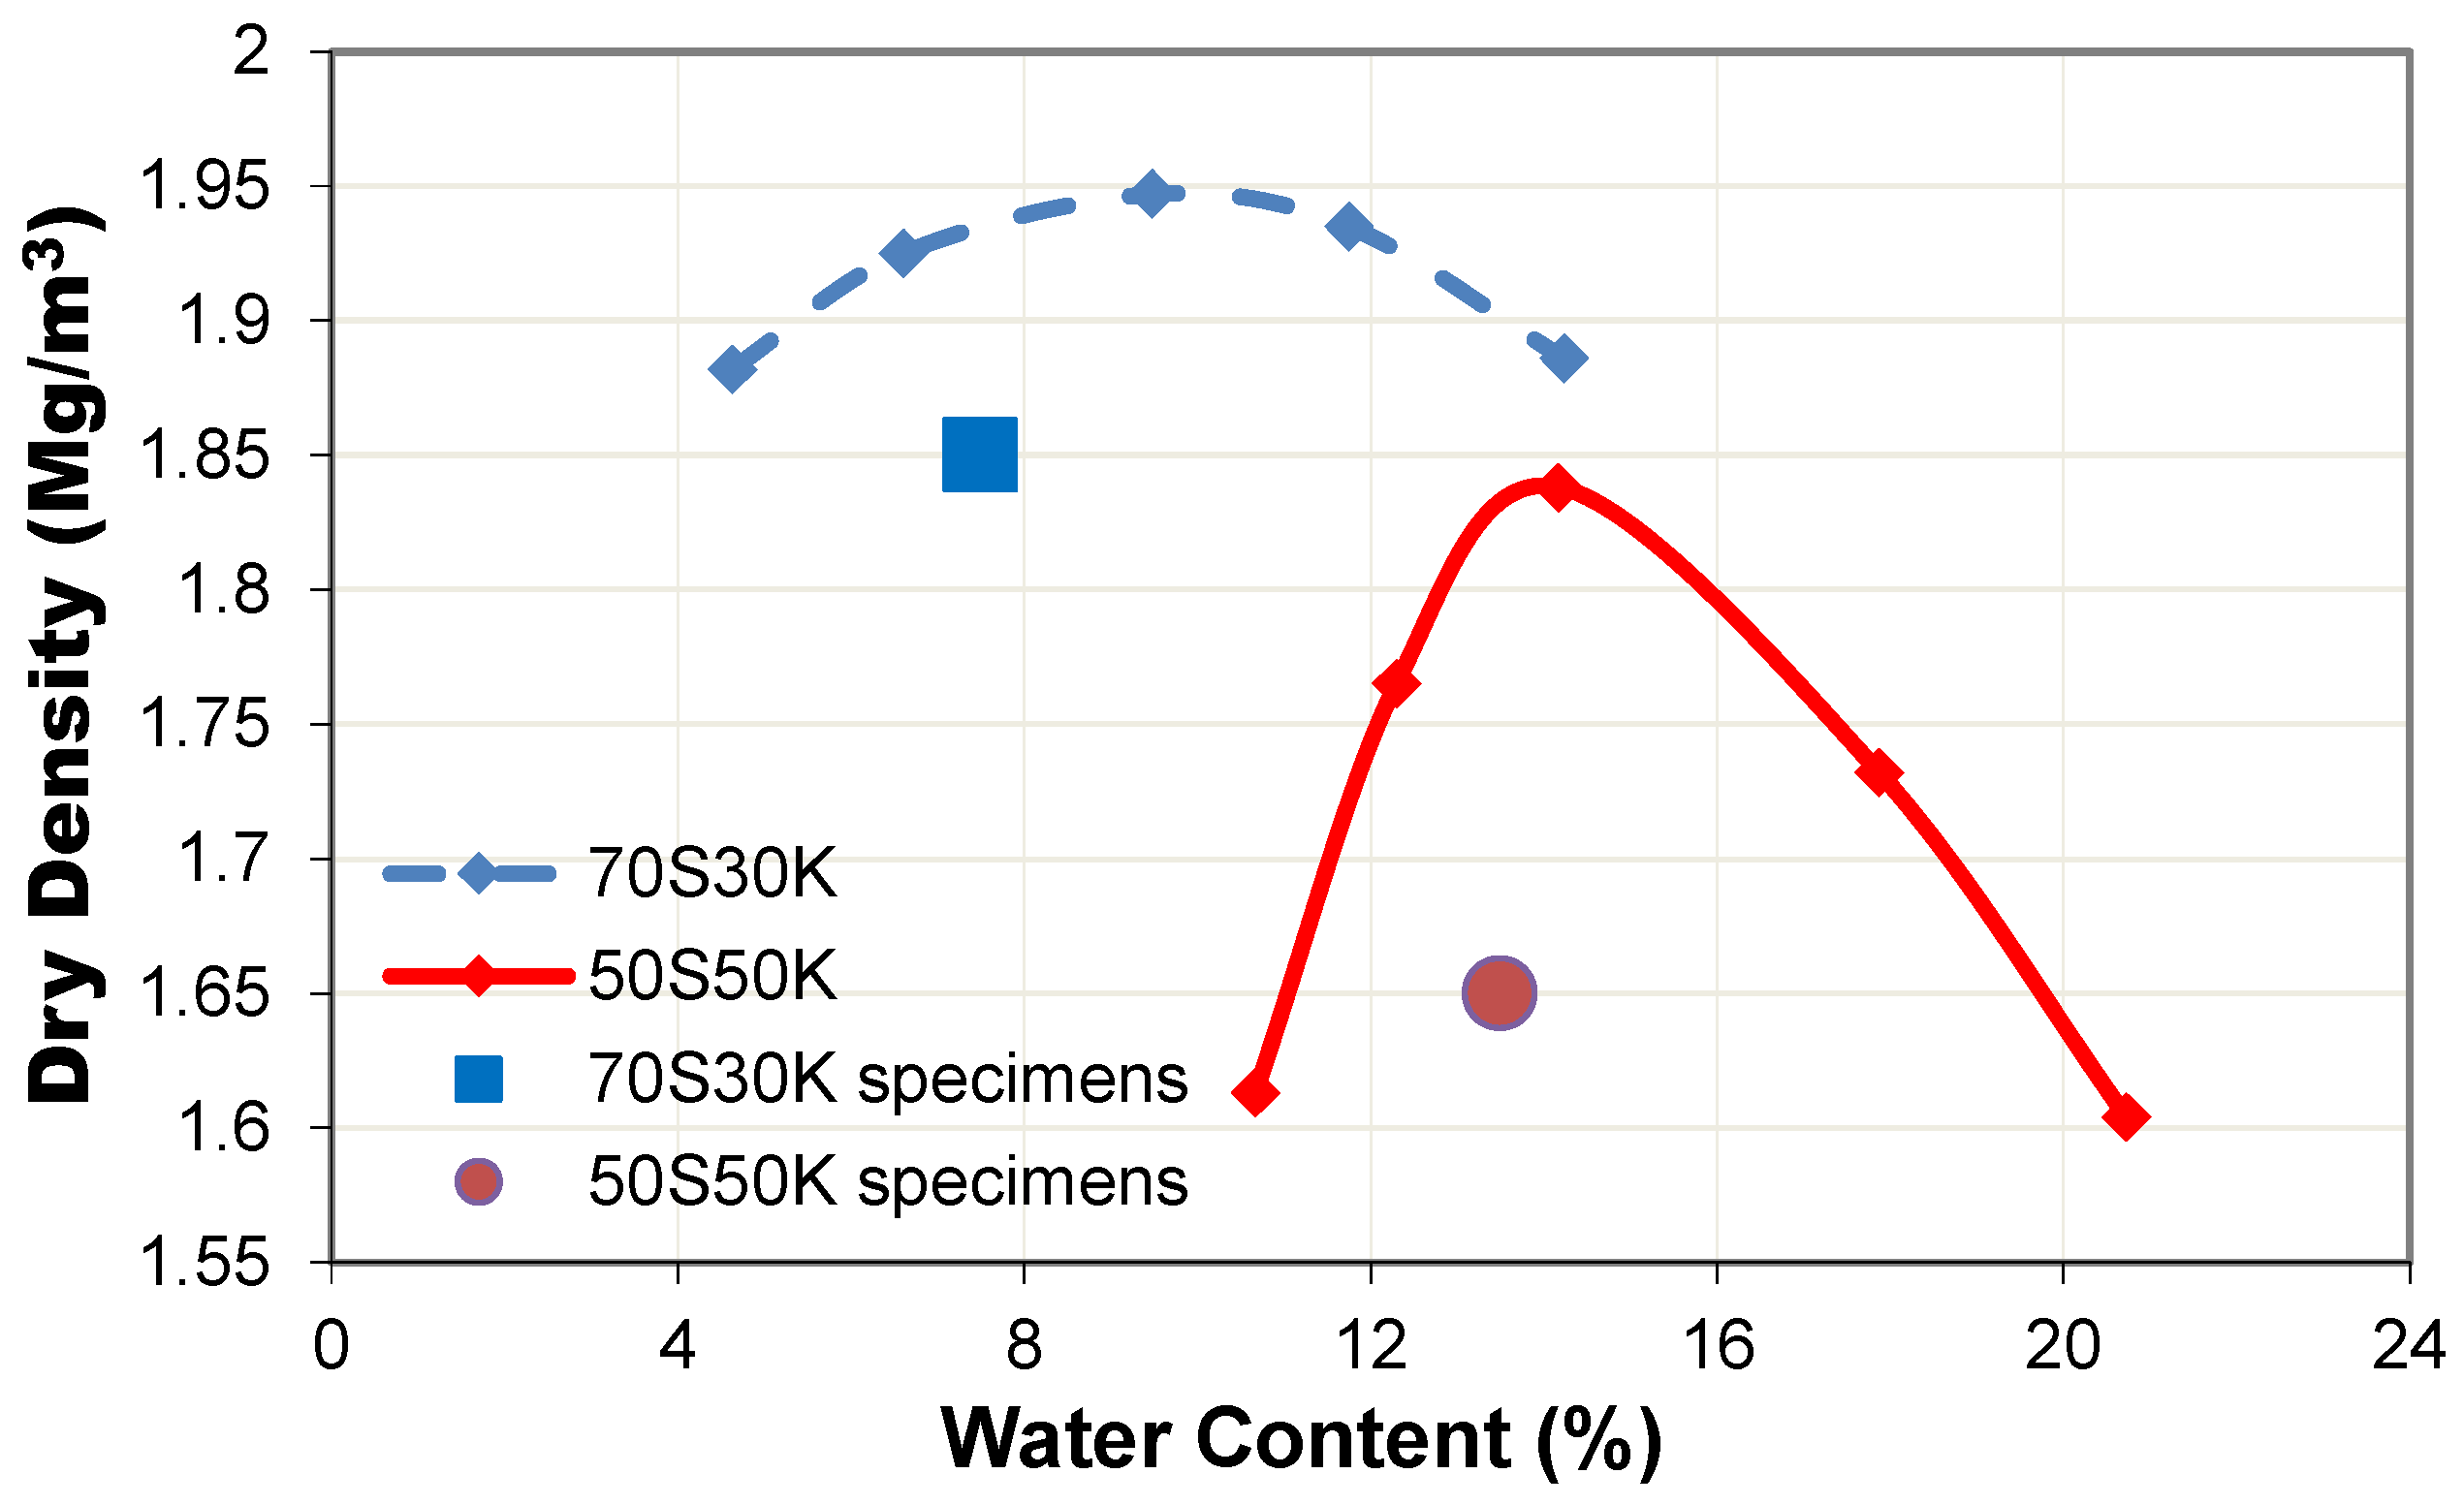
| Dry Density, γd (Mg/m3) | 1.85 | 1.65 |
| Water Content, w (%) | 7.50 | 13.50 |
| Saturated Water Content, wsat (%) | 17.7 | 20.5 |
| Void Ratio, e | 0.43 | 0.64 |
| Liquid Limit, LL (%) | 27.50 | 38.00 |
| Plastic Limit, PL (%) | 14.76 | 19.72 |
| Plasticity Index, Ip (%) | 12.74 | 18.28 |
| Specific Gravity, Gs | 2.61 | 2.59 |
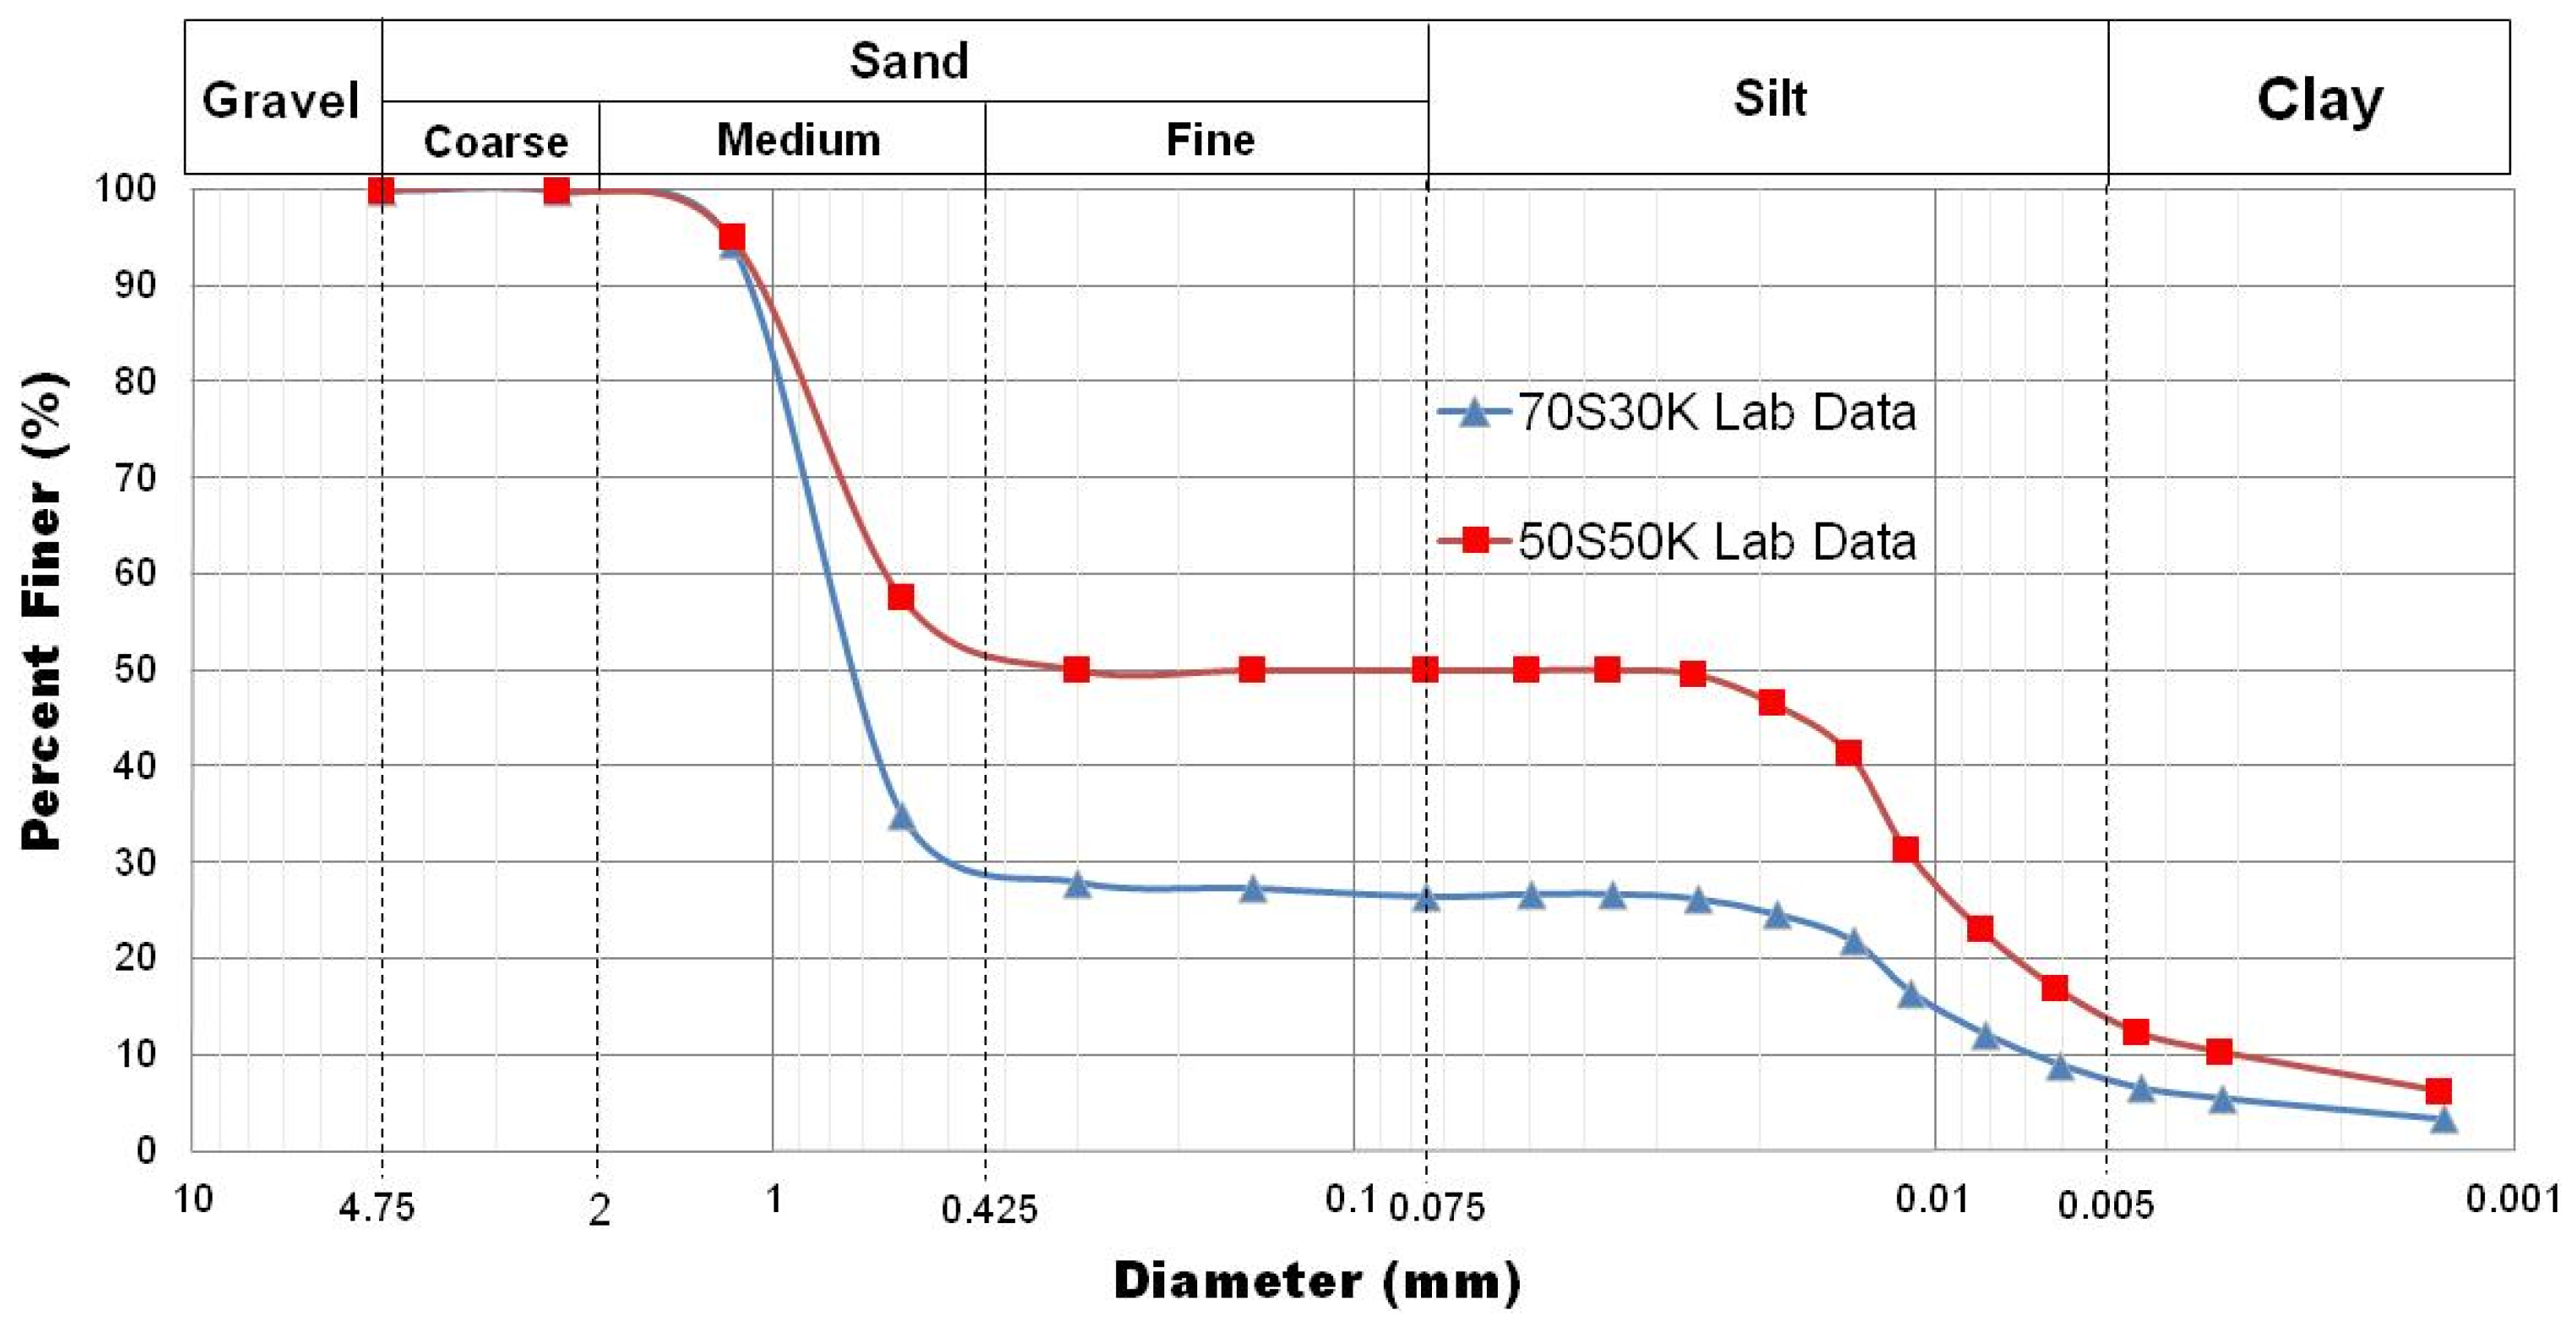
| GSD–Sand (%) | 73.3 | 50.0 |
| GSD–Silt (%) | 19.2 | 36.0 |
| GSD–Clay (%) | 7.5 | 14.0 |
| Unified Soil Classification System (USCS) | SC (Clayey Sand) | CL (Sandy Clay with Low Plasticity) |
| Parameters | 70S30K | 50S50K |
|---|---|---|
| θs1 | 0.310 | 0.341 |
| θs2 | 0.248 | 0.269 |
| ψa1 or AEV1 (kPa) | 6 | 20 |
| ψm1 (kPa) | 10 | 25 |
| s1 | 1.50 | 1.17 |
| θr2 | 0.000 | 0.000 |
| ψa2 or AEV2 (kPa) | 50 | 75 |
| ψm2 (kPa) | 152 | 225 |
| ψr2 (kPa) | 1175 | 1500 |
| s2 | 1.92 | 1.00 |
| R2 | 0.9989 | 0.9985 |
| Parameters | 70S30K | 50S50K |
|---|---|---|
| AEV (kPa) | 15 | 25 |
| Ip (%) | 12.74 | 18.28 |
| c′ (kPa) | 8 | 12 |
| ϕ′ (°) | 35 | 28 |
| n | 2 | 1.59 |
| σ–ua (kPa) | 0 | 0 |
| y | 0.987 | 1.141 |
| b | 0.889 | 0.908 |
| Parameters | 70S30K | 50S50K |
|---|---|---|
| AEV1 (kPa) | 6 | 20 |
| AEV2 (kPa) | 50 | 75 |
| s1 | 1.5 | 1.172 |
| s2 | 1.919 | 1 |
| b1 | 0.814 | 0.806 |
| b2 | 0.447 | 0.428 |
| e | 0.43 | 0.64 |
| fines | 0.267 | 0.5 |
| Zone | Matric Suction (kPa) | 70S30K | 50S50K |
|---|---|---|---|
| ϕb (°) | ϕb (°) | ||
| 1 | <AEV1 | 35 | 28 |
| 2 | AEV1–AEV2 | 20 | 17 |
| 3 | AEV2 | <11 | <10 |
Publisher’s Note: MDPI stays neutral with regard to jurisdictional claims in published maps and institutional affiliations. |
© 2022 by the authors. Licensee MDPI, Basel, Switzerland. This article is an open access article distributed under the terms and conditions of the Creative Commons Attribution (CC BY) license (https://creativecommons.org/licenses/by/4.0/).
Share and Cite
Satyanaga, A.; Bairakhmetov, N.; Kim, J.R.; Moon, S.-W. Role of Bimodal Water Retention Curve on the Unsaturated Shear Strength. Appl. Sci. 2022, 12, 1266. https://doi.org/10.3390/app12031266
Satyanaga A, Bairakhmetov N, Kim JR, Moon S-W. Role of Bimodal Water Retention Curve on the Unsaturated Shear Strength. Applied Sciences. 2022; 12(3):1266. https://doi.org/10.3390/app12031266
Chicago/Turabian StyleSatyanaga, Alfrendo, Nail Bairakhmetov, Jong R. Kim, and Sung-Woo Moon. 2022. "Role of Bimodal Water Retention Curve on the Unsaturated Shear Strength" Applied Sciences 12, no. 3: 1266. https://doi.org/10.3390/app12031266