Article

Influence of Acoustic Black Hole Array Embedded in a Plate on Its Energy Propagation and Sound Radiation

School of Transportation Science and Engineering, Beihang University, Beijing 102200, China
*
Author to whom correspondence should be addressed.
Appl. Sci. 2022, 12(3), 1325; https://doi.org/10.3390/app12031325
Submission received: 10 January 2022 / Revised: 21 January 2022 / Accepted: 22 January 2022 / Published: 26 January 2022
(This article belongs to the Section Acoustics and Vibrations)

Abstract

:
The plate embedded with acoustic black hole (ABH) indentations is potential for structural vibration and noise control. This work focuses on the mid- and low-frequency performance of plates embedded with the array of ABH for energy focalization and vibration and noise suppression. Plates embedded with two-dimensional ABHs are modelled with detailed Finite Element models, and the power flow method is introduced to analyze the energy propagation characteristics arising from the ABH effect. Then, the distribution of average vibration power density along the ABH radius is studied. Next, the energy dissipation effects of the plate model embedded with the ABH array with two types of damping layers are investigated. Finally, the sound pressure levels of the ABH structure are calculated and discussed. This work is helpful to understand the characteristics of plates embedded with the ABH array in reducing vibration and noise radiation. Results show that the ABH array can realize more than 100 times energy focalization effect at some frequencies, which indicates a potential in vibration and noise control when coupled with damping materials.

1. Introduction

There is an increasing need for advanced lightweight and high vibration reduction structures for a wide variety of applications [1]. In particular, vehicle applications often demand methods to meet requirements for interior noise and being lightweight. For a car body, a great deal of damping material is coated to control car interior noise. However, the damping efficiency of these damping layers are relatively low in most cases, which produces a contradiction between noise and vibration control and lightweight idea. Fortunately, ABH (acoustic black hole) structures used in a plate can make the vibration energy concentrate in specific areas, and using less damping material in such high energy-density areas can achieve good effect of vibration and noise control. Therefore, body panels containing ABH indentations can potentially solve this contradiction.
The basic principle of the ABH effect originated from the groundbreaking research of Mironov [2]. He used analytical methods to study the flexural wave propagation in a plate terminated by a wedge having a power-law decreasing thickness profile, as shown in Figure 1. Assuming that the thickness of the wedge end can be reduced to zero, Mironov found that when the incident flexural wave is propagating along the x axis, its wave speed will gradually decrease to zero, so that the flexural wave will never reach the end and is “trapped” in this structure. About 20 years after, Krylov [3] embedded axisymmetric circular pits with power-law varying thickness into plates, and the concept of this structure was extended to a two-dimensional case. He found that this two-dimensional structure can also reduce the speed of flexural waves like the wedge structure and called it “acoustic black hole”. However, the main problem in utilizing this effect is that an ideal ABH structure is difficult to be realized because of the existing machining capability, that is, a truncation must be included to the edge of the plate. As a result, the reflection of the flexural wave in the plate greatly increases and the ABH effect remarkably weakens. Fortunately, the presence of a small amount of damping material on the surfaces of wedges with power-law profile can reduce the reflection coefficients significantly, despite the truncations [3,4]. In addition, it has been demonstrated by using experimental investigation [5], and it also showed appealing potential in sound radiation control [6,7].
A two-dimensional ABH is materialized by a cylindrically symmetrical indentation of power-law profile whose exponent is equal or larger than two. An important advantage of a two-dimensional ABH is that it can be embedded in a plate structure, which can widen the range of application. Many works on single two-dimensional ABHs have been done by using an analytical method. Yan et al. [8] and Krylov [9] applied the geometrical acoustic theory to calculate the beam trajectories in the region of a two-dimensional ABH structure, and results showed that rays of waves propagated through the two-dimensional ABH region deflect to its central area. O’Boy and Krylov et al. [10,11] used the exact solution of the corresponding flexural wave equation to analyze the frequency response for circular and rectangular plates with and without ABH. They found that, despite the imperfect thickness profile, two-dimensional ABH structures with appropriate damping layers can also absorb a substantial amount of wave energy [9,10,11]. Huang et al. [12] proposed a numerical integration scheme of the flexural ray equation to predict the ray trajectories of waves and investigated the wave focalization properties in two-dimensional ABHs. The plate embedded with a single two-dimensional ABH can address vibration absorption characteristics at higher frequencies where the plate bending wavelengths are smaller than the ABH characteristic dimension. However, for the vehicle body structure demanding better vibration and noise control performance at lower frequencies, the size of an ABH is limited by the size and shape of body panels. These limit the applicability of embedded ABHs as vibration and noise control solutions. Fortunately, a ABH array has the potential to improve the low-frequency vibration control performance of plate structure [5]. To understand the mechanisms of the flexural wave propagating in the ABH area, an analytical method can be used. However, it is difficult to analyze complex structures by this method such as a plate embedded with multiple two-dimensional ABHs.
Numerical simulation based on the finite element method (FEM) can overcome the shortcoming of the analytical method and can be applied to both frequency domain analysis and time-domain analysis of ABH structures. Conlon et al. [13,14] used the finite element and boundary element models to investigate the vibration and noise performance of plates embedded with periodic grids of embedded two-dimensional ABHs, and pointed out that the periodic ABH array may improve the low-frequency vibration control performance of the structure. Methods for enhancing low-frequency performance of the ABH effect were illustrated by Conlon et al. [6,14]. Besides, they also investigated the role that local ABH cell modes/modal density played in vibration suppression. Huang et al. [15] investigated the influence of structural parameters on energy focalization positions of the bending wave by using FEM. Prill et al. [16] established a FE model of a car main floor embedded with 10 ABHs, and its vibration response under a wind load excitation was studied. Results of simulation showed that noise reduction was found in the whole frequency range above 200 Hz.
In these studies, most researchers used radiated sound power or vibration acceleration to express the energy focalization characteristics of ABH structures. However, the visualization research on the vibration energy propagation process in ABH areas is limited still. In addition, the characteristics of energy propagation in a plate embedded with a two-dimensional ABH array have not been investigated systematically. In general, the systematic theory and method of two-dimensional ABH array design have not yet been formed, and the research on low-frequency vibration reduction performance of the ABH array is not enough. Therefore, it is difficult to design body panels by ABH theory which can achieve both vibration and noise control and be lightweight.
Aiming at these problems, in this paper, a thin-plate embedded with an array of five ABHs is designed, and its energy propagation and sound radiation performance due to concentrated load is examined using FEM. The structural intensity is computed in order to quantitatively evaluate the plate structure’s energy focalization performance. The overall goal of this work was to develop detailed results for the energy propagation and focalization effects of the ABH plate, to investigate the energy distribution of the high-energy density areas of the individual ABH cell of the array, to study the influence of damping materials and plate boundary conditions on energy propagation, and to explore the sound radiation performance of the plate embedded with the ABH array. This work has potential for solving the contradiction between vibration suppression and automobile lightweight, which can provide a reference for body panel design.

2. Modeling and Simulation Analysis of Plate Embedded with Two-Dimensional ABH Array

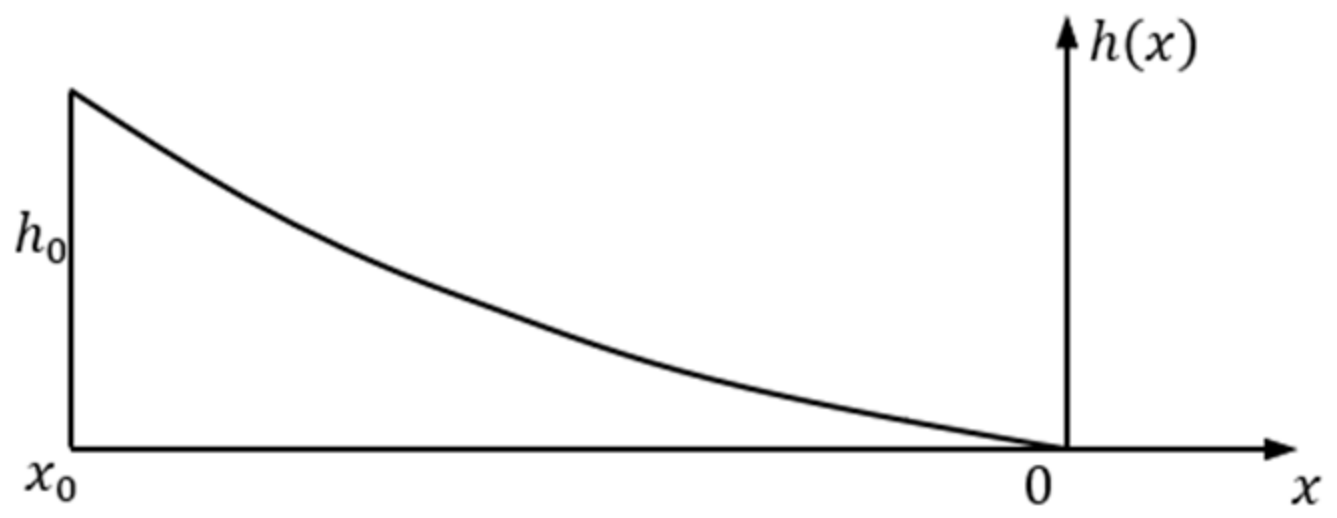
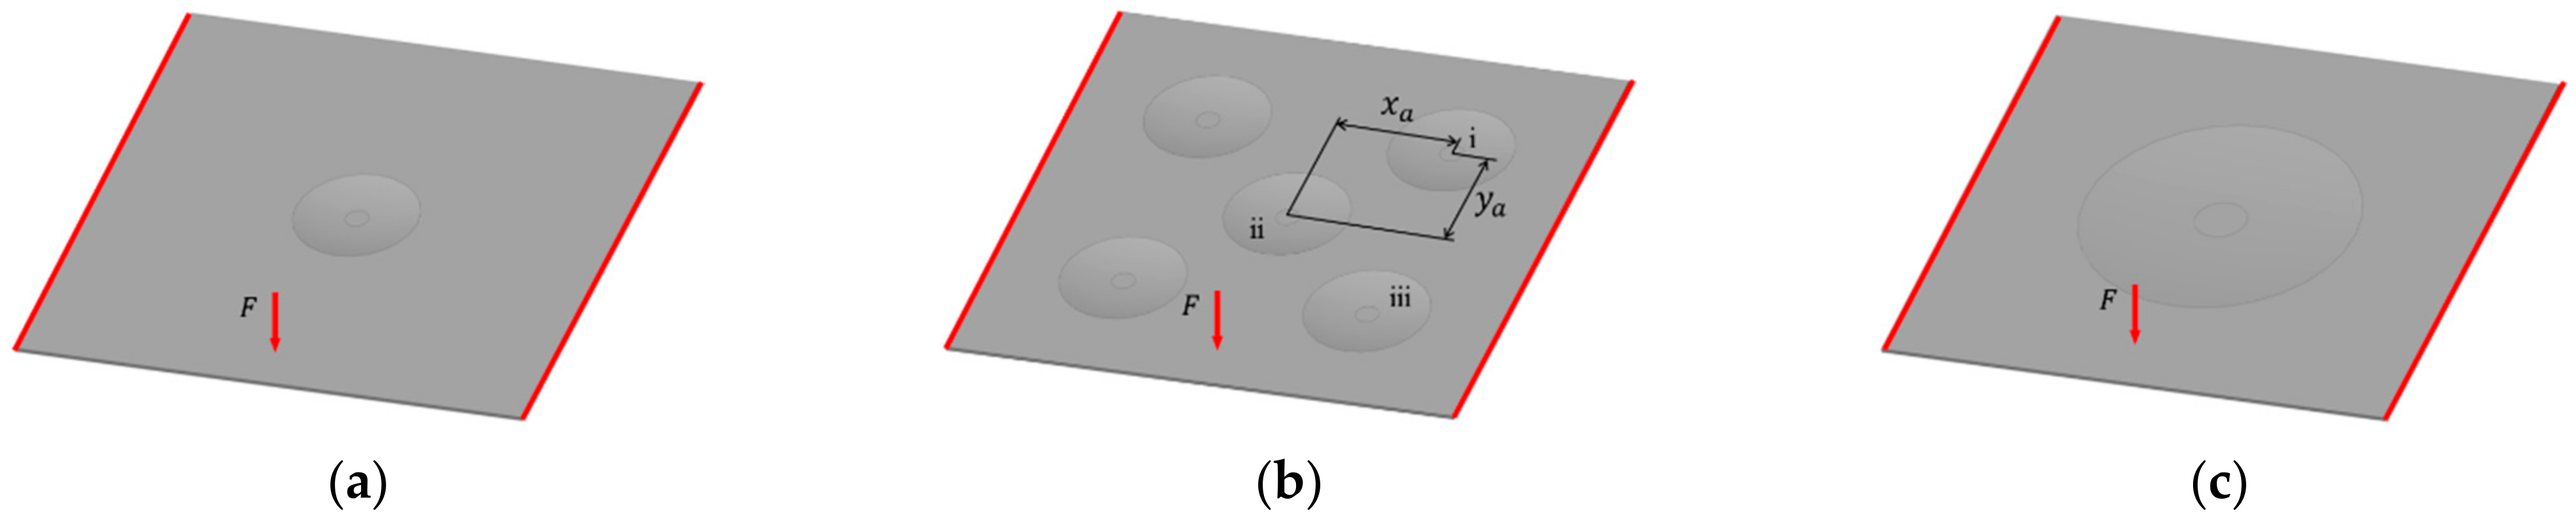
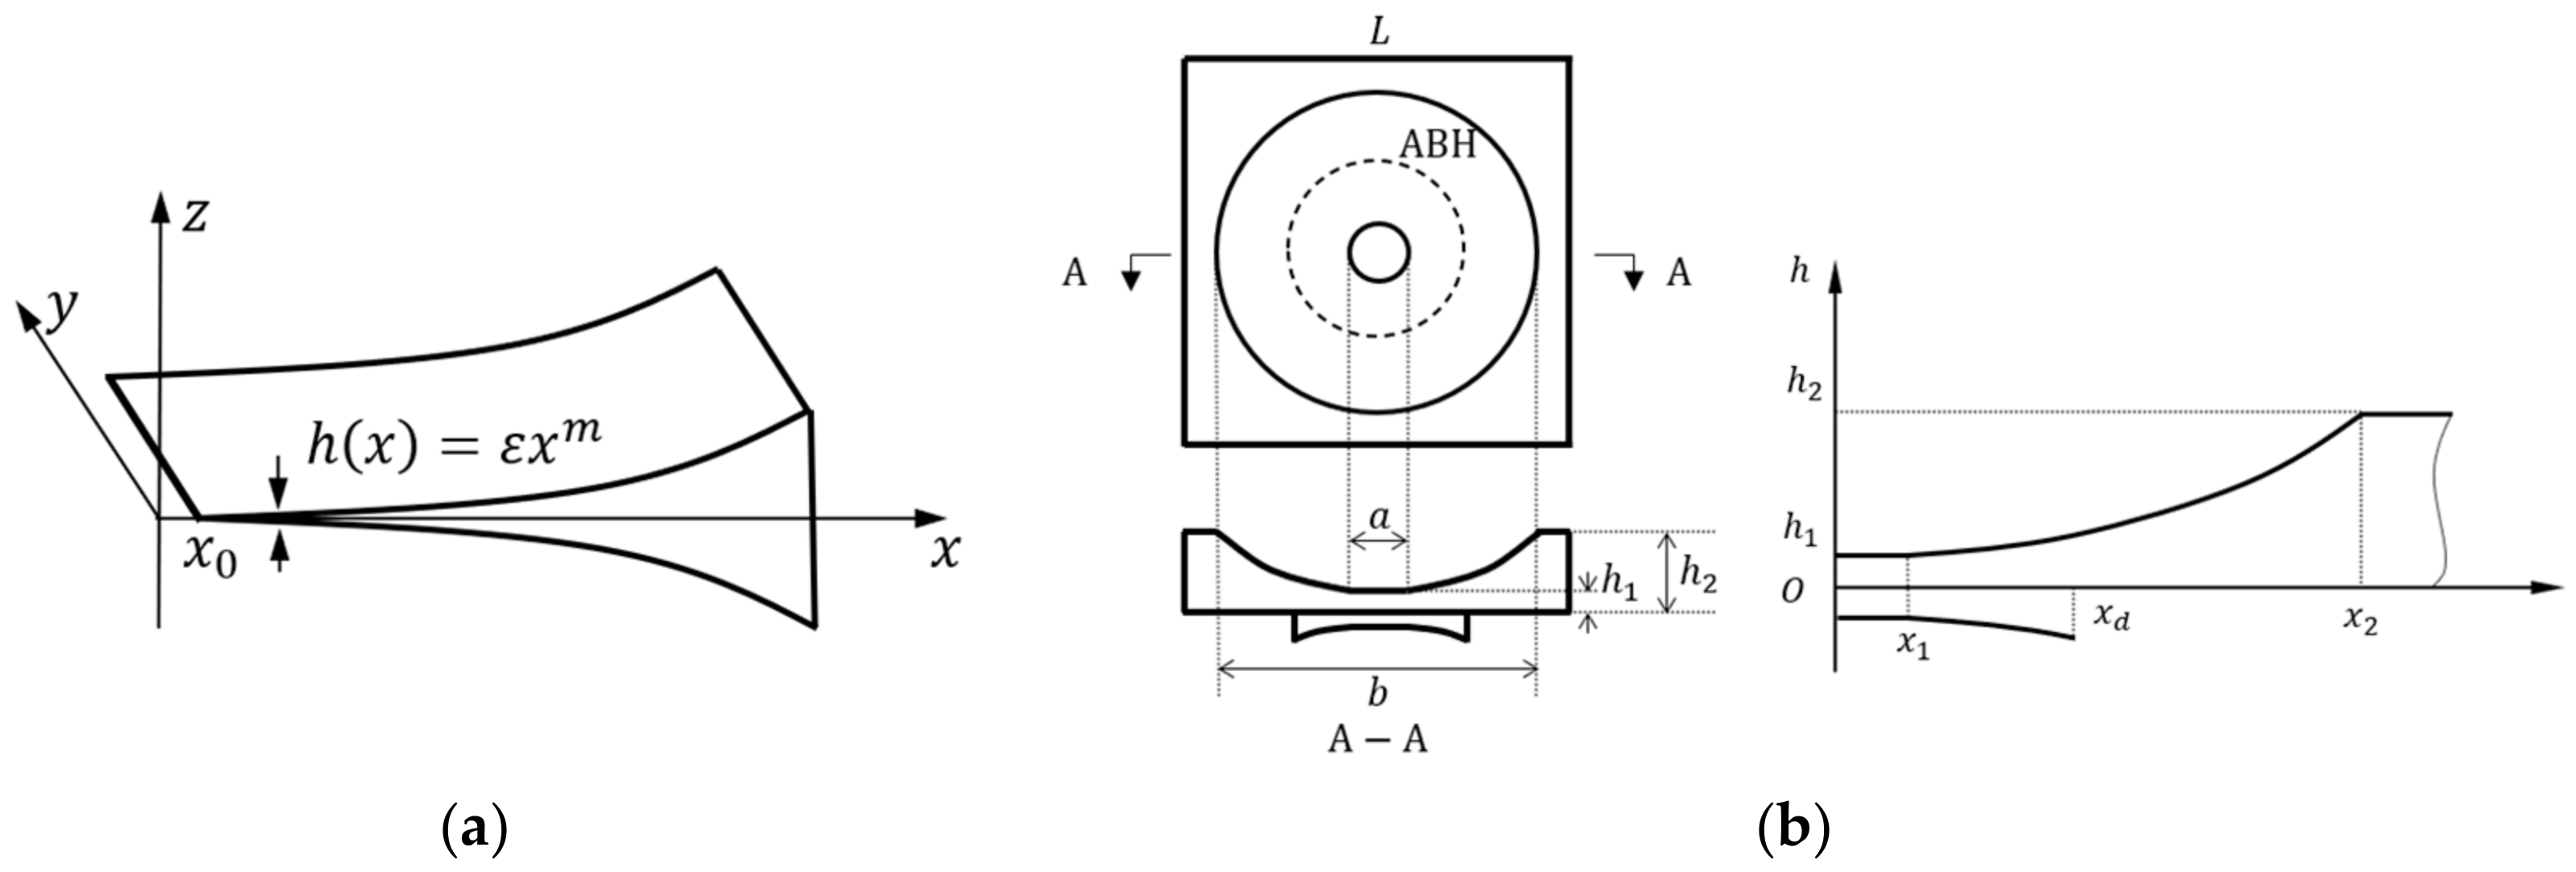
2.1. Finite Element Model of Plate Embedded with ABH Array

According to existing machining capability, an ideal ABH structure is impossible to be realized. Therefore, typical two-dimensional ABH structures usually contain a hole or a circular plateau of constant thickness at the center of the indentation [12], that is, there must be a residual thickness h 1 at the bottom of the ABH indentation. The profile of a two-dimensional ABH indentation is schematically shown in Figure 2. In this paper, two-dimensional ABHs are embedded in a uniform plate with thickness of h 2   =   0.004   m and the geometry dimension of the plate is 0.5 m × 0.5 m × 0.004 m (length × width × thickness). The outer radius of ABH is x 2 , the thickness of the central plateau (residual thickness) is h 1 , its radius is x 1 and the power index m is set as 2.2, then the variable ε can be calculated. The thickness profile of ABH can be described as:
h ( x ) = h 1 , x x 1 ε x 2.2 , x 1 x x 2
Cut-on frequency [6] is an indicative frequency at which the wavelength of the incident bending waves starts to be equal to the characteristic dimension (the diameter in this case) of the ABH pit. It can be defined as:
f c u t o n = π h 2 ( R A B H ) 2 E p 12 ρ p ( 1 ν p 2 )
where h represents the thickness of the uniform part of the plate; R A B H denotes the radius of the ABH indentation; E p is the Young’s modulus of the plate material; ρ p represents mass density and ν p is the Poisson’s ratio.
According to Equation (2), an ABH indentation with a larger radius will have lower cut-on frequency and may have better energy focalization performance at lower frequency. To investigate the potential advantages of the ABH array at lower frequency, 3 plate models are established, as shown in Figure 3. That is, a plate with a single ABH (Figure 3a), a plate with an array of five ABHs (Figure 3b) and a plate with a big ABH (Figure 3c). Parameters h 1 and h 2 of the big ABH (Figure 3c) are the same as those of the small ABH (Figure 3a). In addition, Radius x 2 of the big ABH is 0.1342 m to ensure that the plate with a big ABH has the same mass as the plate embedded with 5 ABHs.
Commercial finite element code Abaqus is adopted for the computation of vibration response in the plate models subject to a harmonic point force with a value of 1 N and normal to the surface, as shown in Figure 3. The ABH plates are discretized using C3D8R solid elements in ABAQUS, which is a first-order element with 8 nodes. The frequency range is from 5 to 5000 Hz. Finer meshes are used in the central area of the ABHs to ensure more than ten elements per local wavelength at twice the maximum frequency of interest and the element size is from 0.1 mm to 1 mm. Moreover, the resulting element numbers are 1,084,720, 1,420,592 and 1,104,189, and the resulting DOFs are 8,411,952, 11,913,756 and 9,088,884 for the three ABH plates, respectively. The geometric parameters of the small ABH and the big ABH in this simulation are described in Table 1. The left and right edges of the plate model are fixed and the material properties of the plate used in this paper are shown in Table 2.
As the ABH array structure is symmetrical, this paper focused on three typical ABHs in Figure 3b, named ABH(i), ABH(ii) and ABH(iii), respectively. The center of ABH(ii) is located on the center of the whole plate structure, and the coordinates of ABH(i) are ( x a , y a ) = ( 0.12   m , 0.12   m ) relative to ABH(ii), while the relative coordinates of ABH(iii) are ( 0.12   m , 0.12   m ) . The harmonic point force is applied at ( 0.12   m , 0.21   m ) relative to ABH(ii).

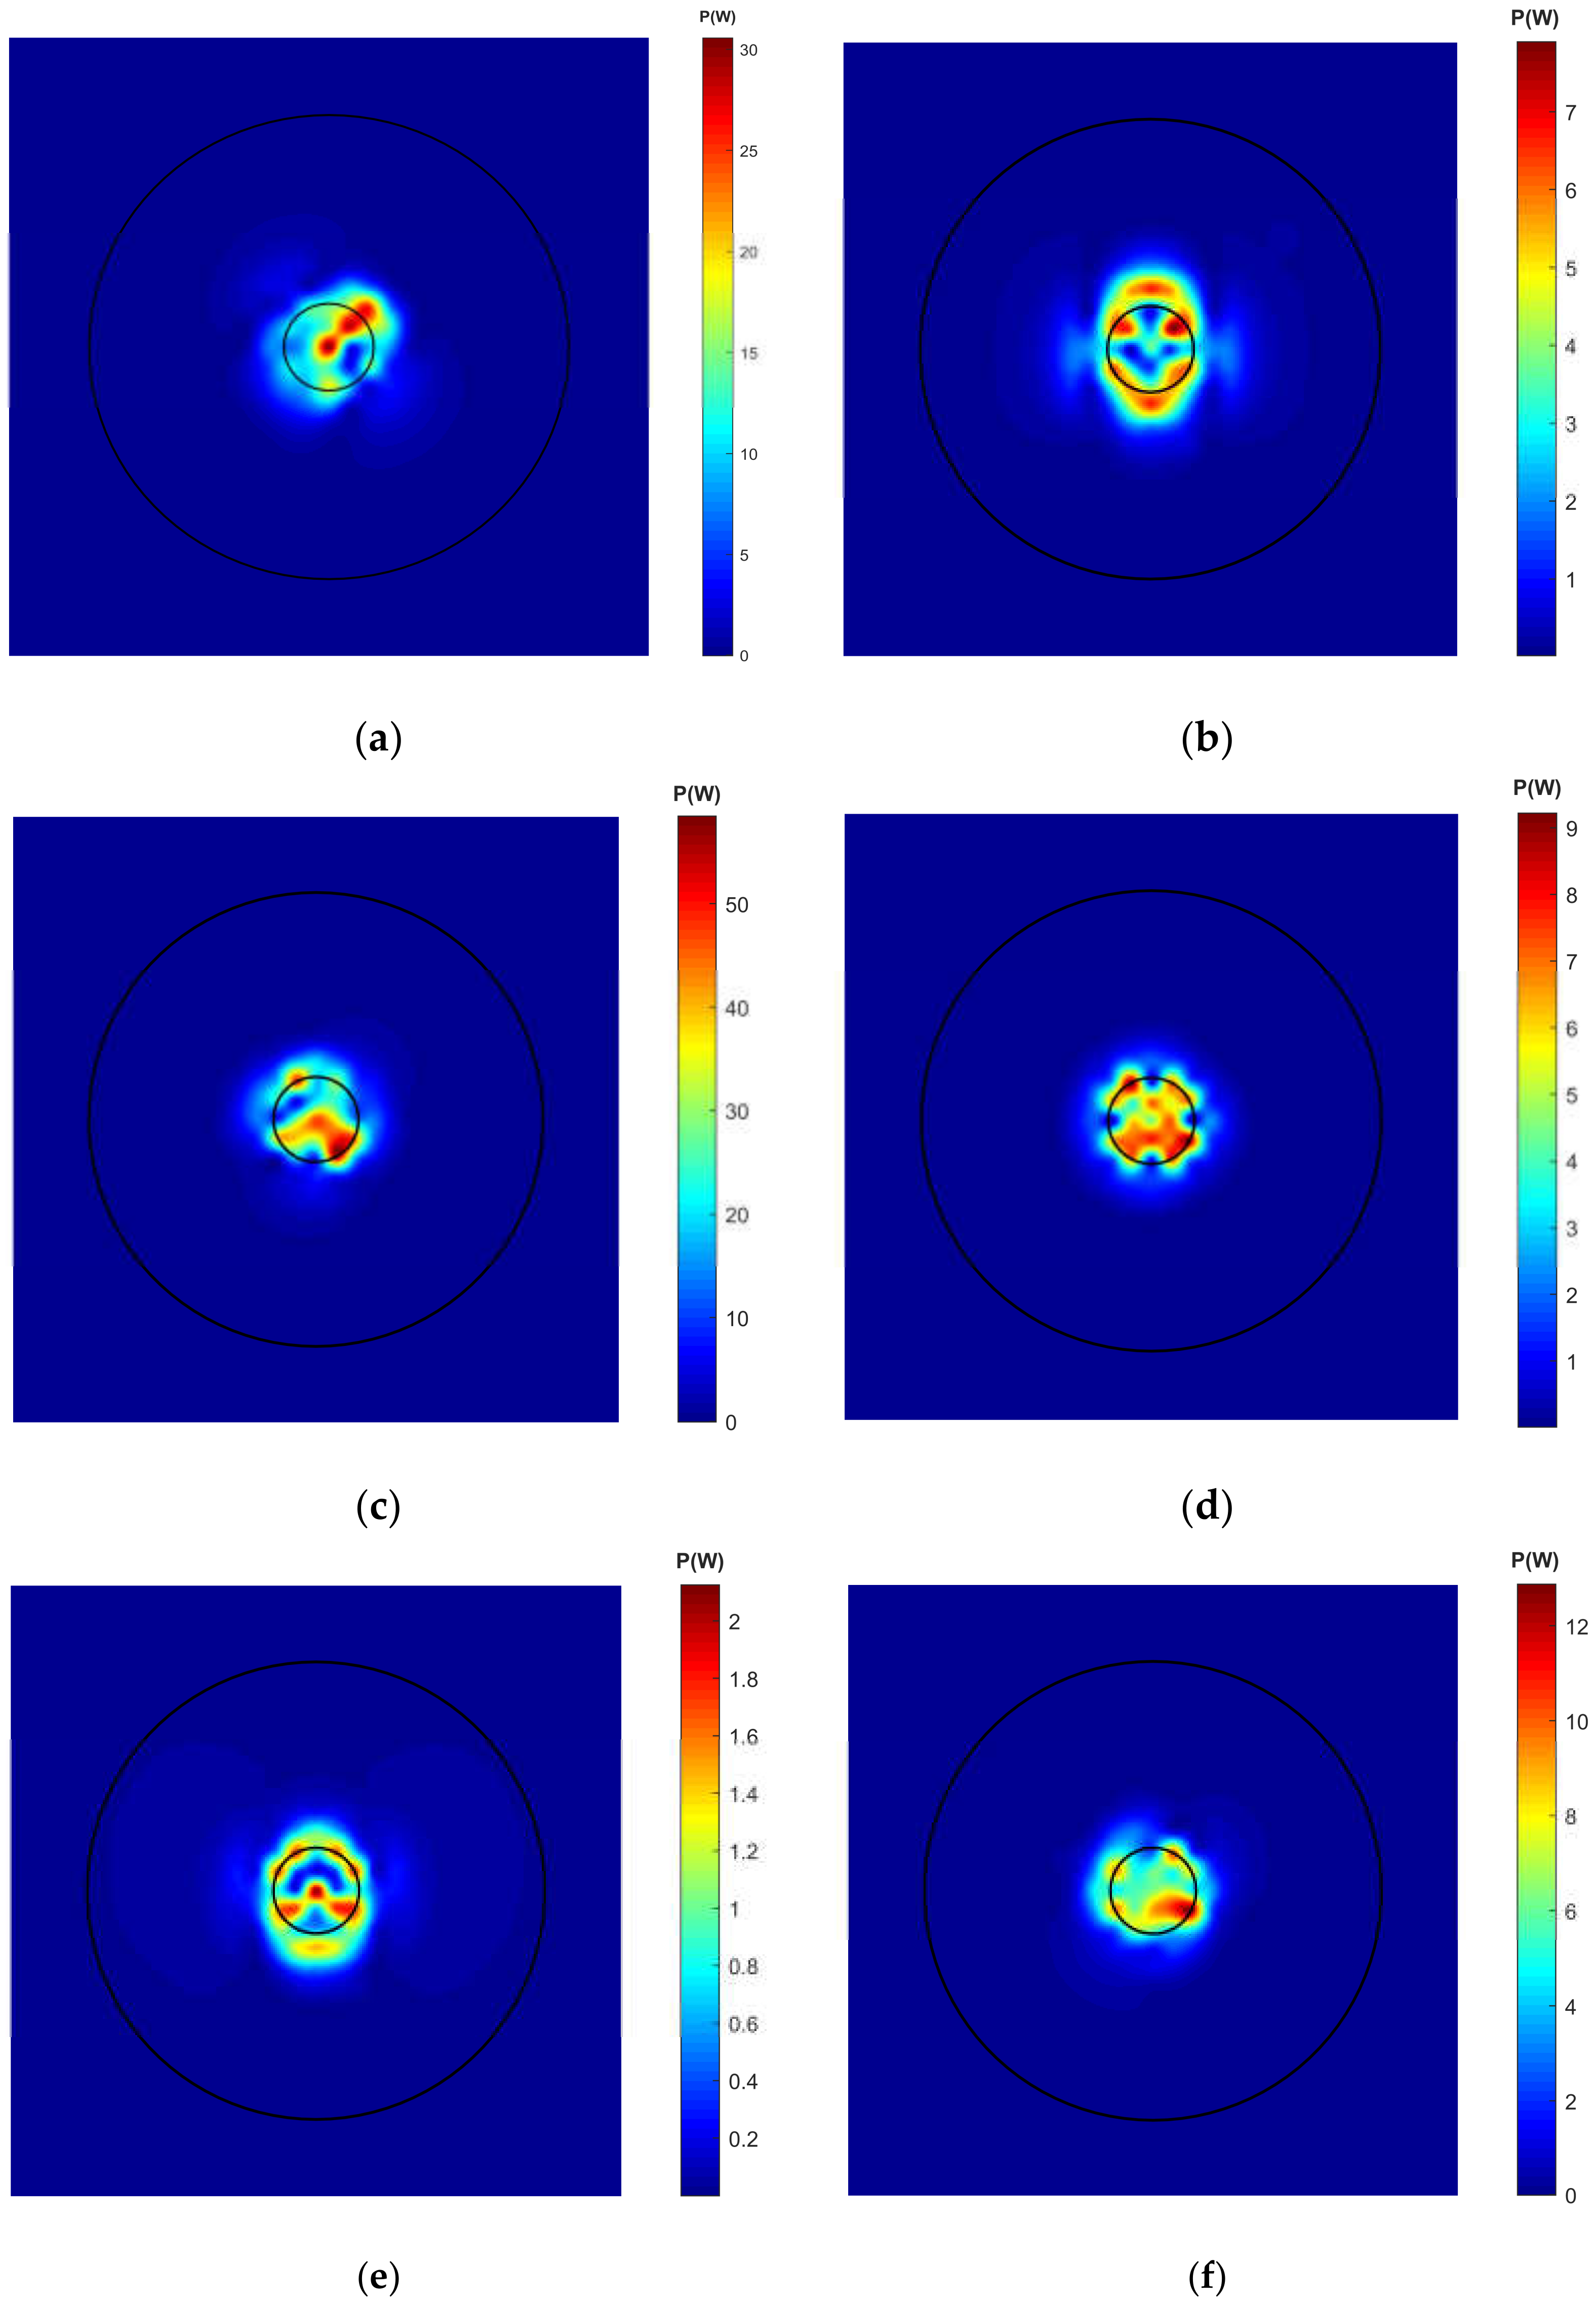
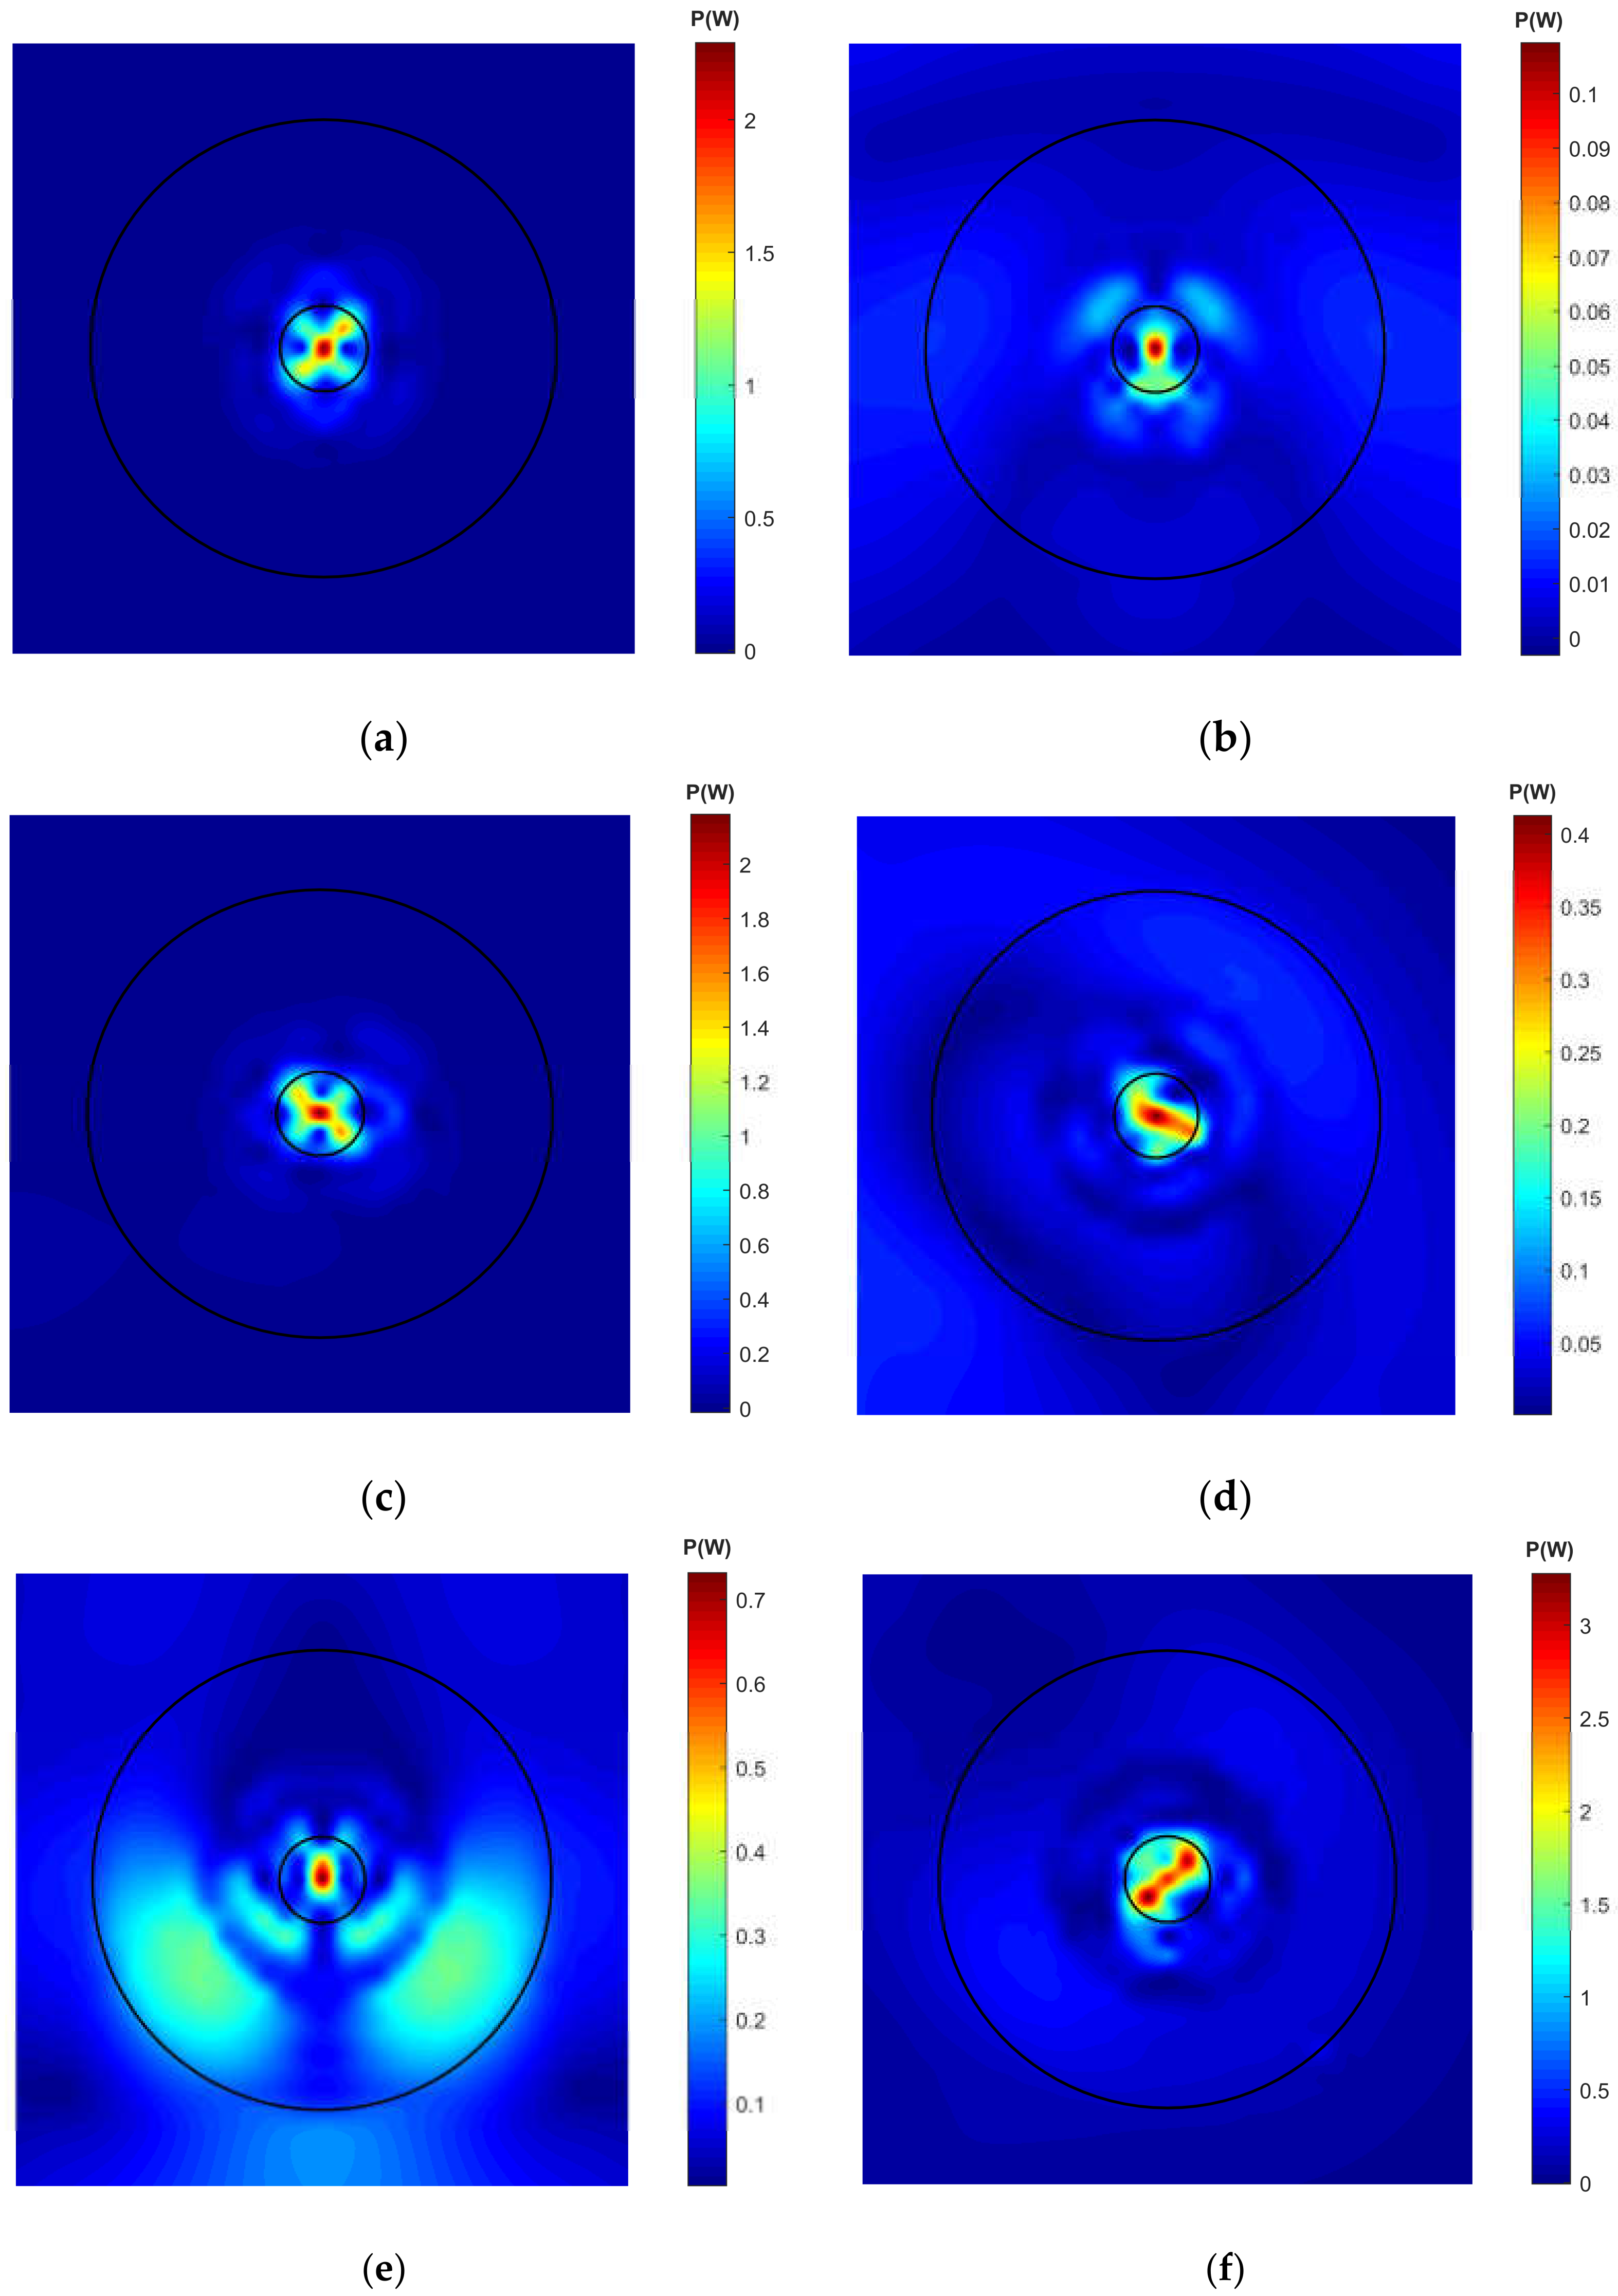
2.2. Energy Focalization Analysis of Different ABH Configurations

The power flow method is very useful for the investigation of energy propagation in a structure [17,18], and it can be used to describe the energy distribution and propagation. The energy focalization in the ABH areas can be analyzed by using the structural power flow method [15].
Structure power flow represents the energy dissipation ability of the structure per unit time. The instantaneous power flow is defined as the product of the force and the velocity in the same direction and phase, and for FE simulation, the stress state at any point in the elastic body can be represented by six stress components, namely, normal stress σ x , σ y , σ z , and shear stress τ x y , τ y z , τ z x . Structural intensity defined as power flow per unit area can be expressed as [19]:
I n = 1 2 Re ( σ n v n * + τ n 1 v 1 * + τ n 2 v 2 * )  
where σ n represents normal stress in the normal direction; τ n 1 and τ n 2 are shear stress in the direction of 1 and 2, v n * , v 1 * and v 2 * indicate complex conjugate of velocities in the normal n, 1 and 2 direction, respectively.
By FE simulation of the plate embedded with ABHs (Figure 3) excited by a harmonic force, the nodal velocity vector v = v x , v y , v z and the nodal displacement vector u = u x , u y , u z (where u is v / i ω ) can be calculated. Then, for a single solid element, the structural intensity of direction x, y and z can be expressed as:
I x = ω 2 Im ( σ x u x * + τ x y u y * + τ x z u z * ) I y = ω 2 Im ( σ y u y * + τ y x u x * + τ y z u z * ) I z = ω 2 Im ( σ z u z * + τ z x u x * + τ z y u y * ) p d i = I x 2 + I y 2 + I z 2
where I x , I y and I z indicate the structural intensity in the x, y and z directions, respectively; p d i is the modulus of structural intensity at a certain node; ω is the circular frequency, u x * , u y * and u z * indicate complex conjugate of displacement in the normal x, y and z directions, respectively.
Real and imaginary parts of values of stress components σ x , σ y , σ z , τ x y , τ y z , τ z x and values of displacement components u x * , u y * , u z * in the frequency domain can be obtained from FE results. Then, the structural intensity of each node in the ABH central plateau can be calculated. Higher vibration energy means higher dissipation efficiency when damping layers are coated. Therefore, the energy focalization ability can describe the performance of different ABH plates in Figure 3. The vibration energy gathered in the ABH central plateau as defined in Equation (5) is calculated in the frequency band of 10–5000 Hz, the results are shown in Figure 4.
W p f = S c p d i N c  
where W p f represents the vibration energy (average power flow) in a certain area per unit time; p d i represents structural intensity at the ith node; N c is the number of total nodes at ABH central plateau and S c is the area of the central plateau.
The cut-on frequency of the big ABH is 559.5 Hz and that of the small ABH is 2790.5 Hz according to Equation (2). Figure 4a shows that, in the frequency band of 200–2200 Hz, the overall level of vibration energy of the central plateau of the big ABH is the highest, followed by the plate embedded with the ABH array and the plate with a small ABH. Above the cut-on frequency of the small ABH (2790.5 Hz), the energy focalization performance of the ABH array is gradually better than that of the big ABH, which shows the potential for vibration and noise control at high frequencies. However, it can be seen from Figure 4b that, in the lower frequency band of 50–180 Hz, the first resonant peak of the ABH array is slightly higher than that of the big ABH and is about 16 dB higher than that of the small single ABH. In the same frequency band, the other resonant peaks of the ABH array can be higher than those of the big ABH and single ABH by 1–7 dB. The better energy gathering performance may be attributed to the low-order modes of the plate embedded with the ABH array. For the low-frequency excitation cases, compared with the ABH with a large radius, the arrangement of the plate embedded with the ABH array is more flexible, which is conducive to its application in compact structures such as vehicle body panels.

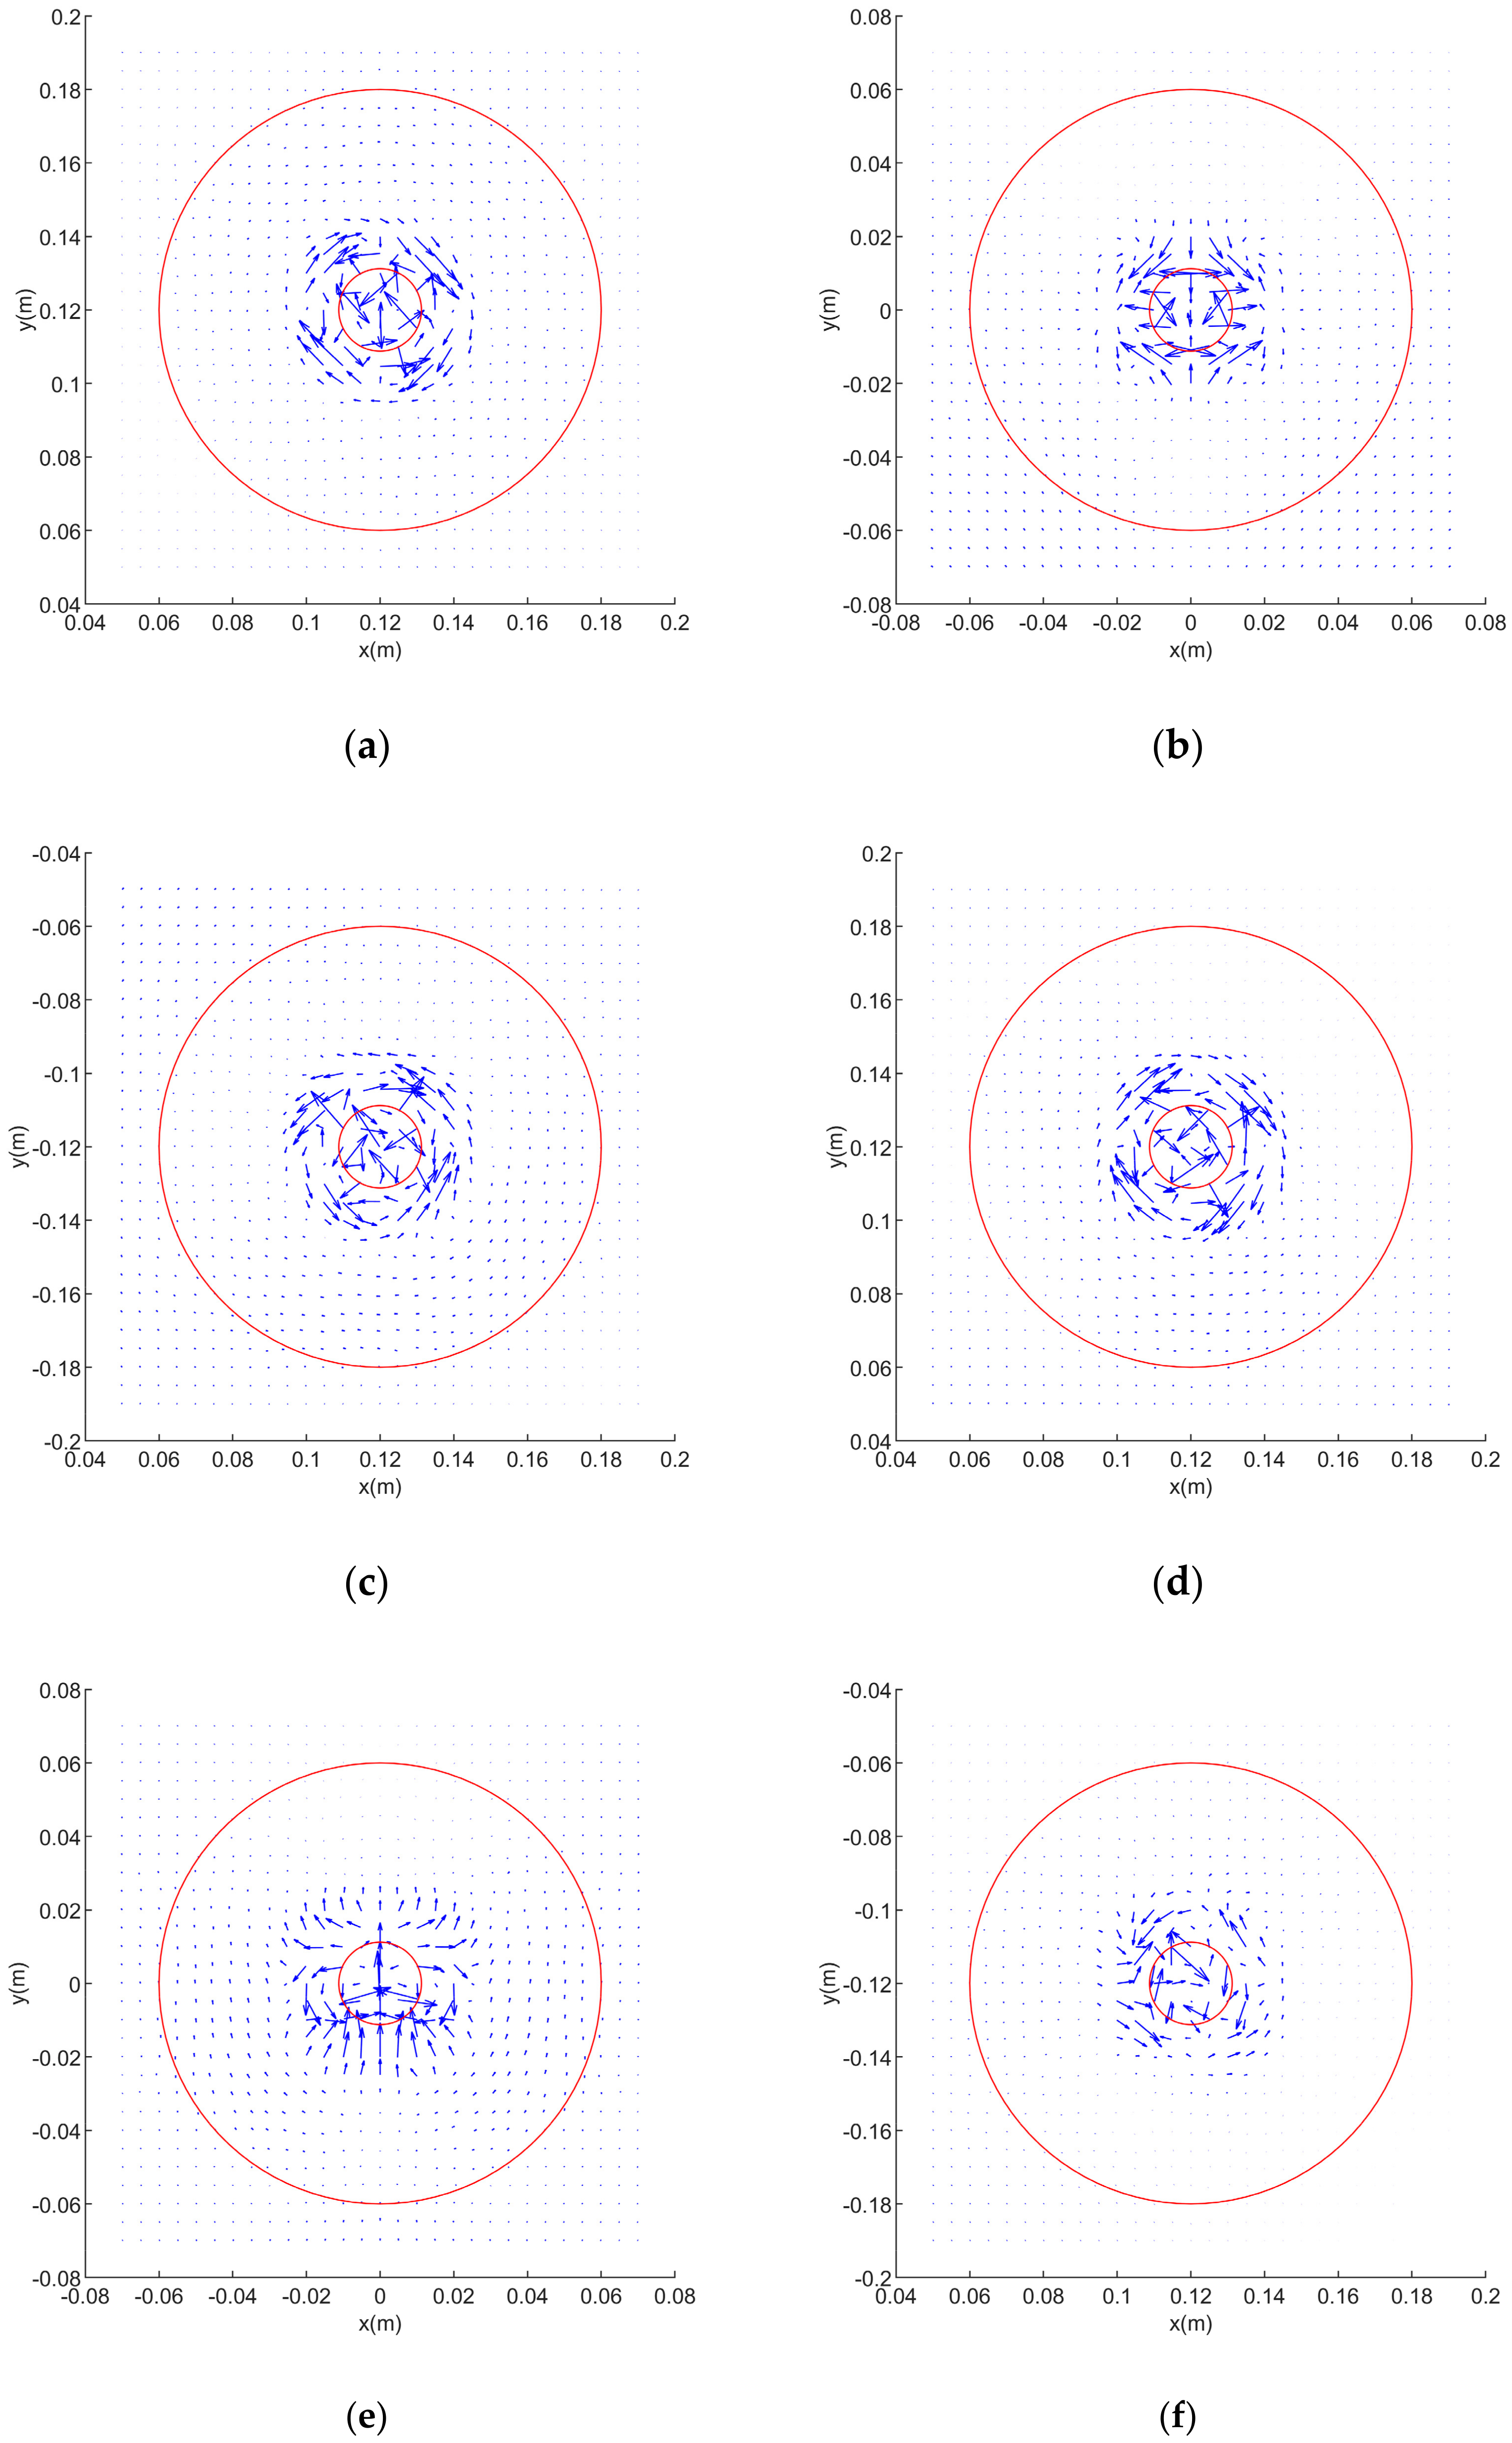
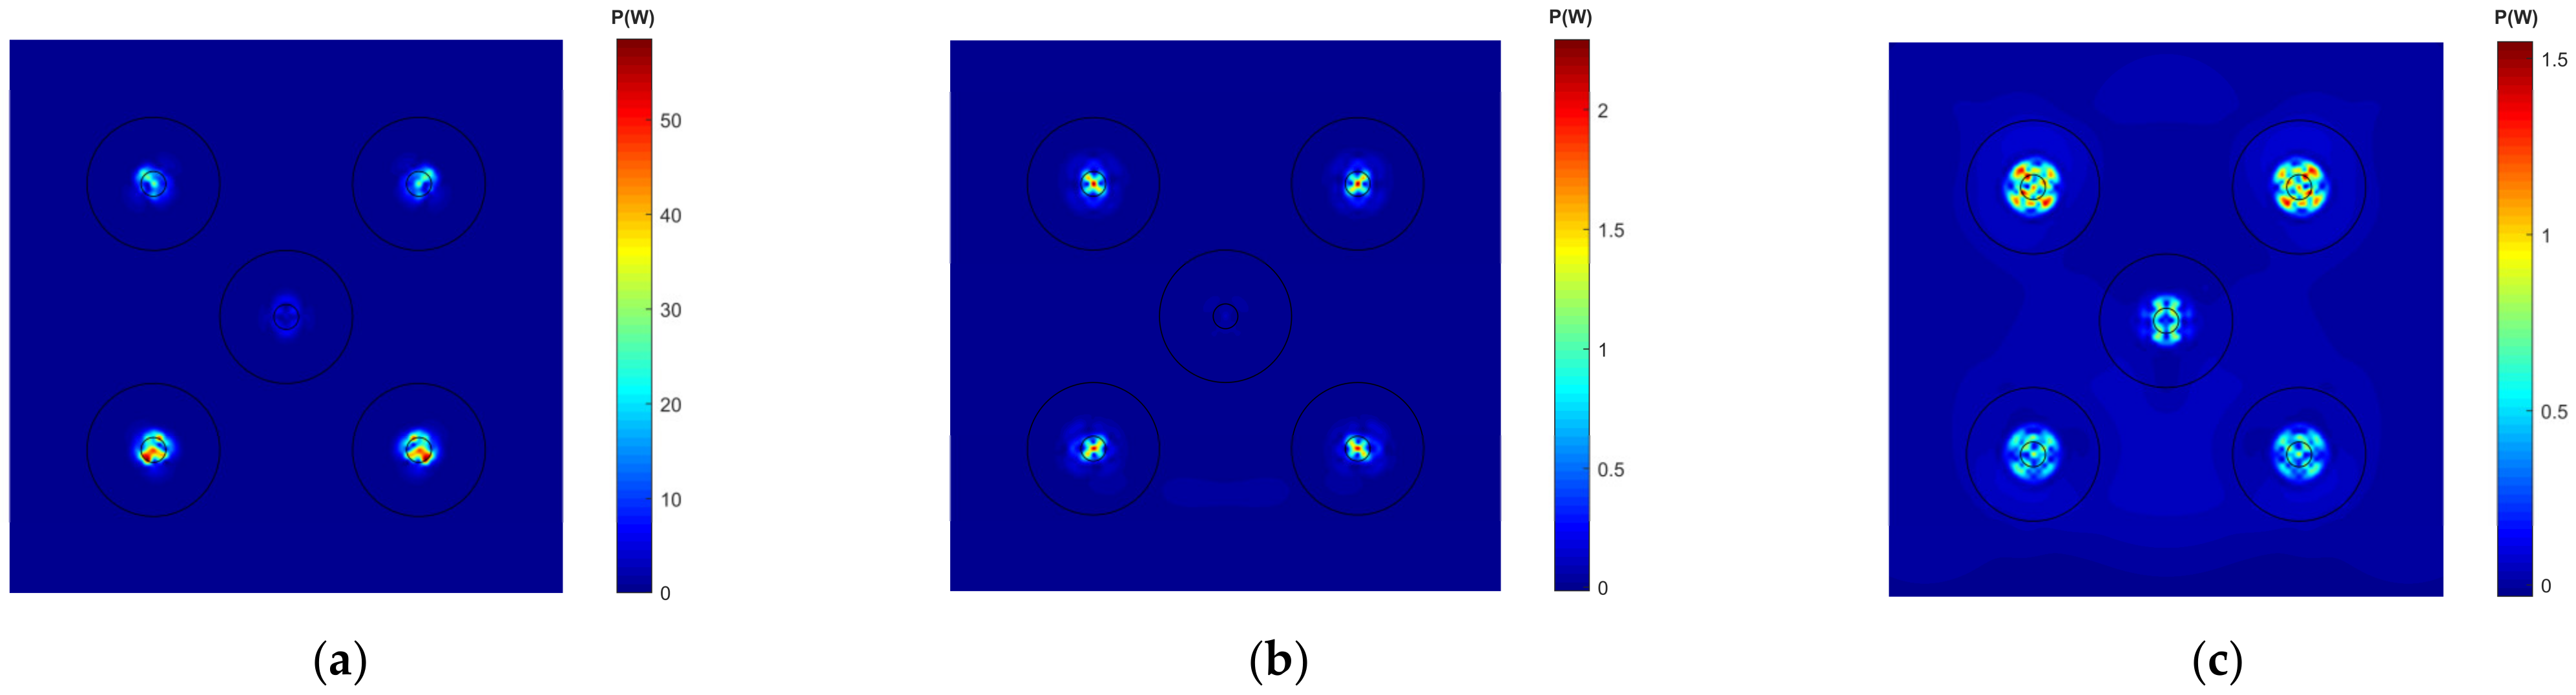
2.3. Analysis of Energy Propagation in Plate Embedded with ABH Array

According to the simulation data of the nodes within each ABH area (ABH(i), ABH(ii) and ABH(iii)) and Equation (4), the structural intensity I x , I y and I z can be calculated. To reflect the power flow propagation characteristics in the x–y plane, a series of power flow transmission graphs can be obtained by using I x and I y in MATLAB. In this section, two boundary conditions (BC 1: right and left edges of the plate are fixed, BC 2: all edges are fixed) are considered, as shown in Figure 5. For the plate embedded with the ABH array, as shown in Figure 3b, under two different boundary conditions and at different excitation frequencies (1000 Hz, 1050 Hz, and 1100 Hz), power flow transmission graphs of ABH(i), (ii) and (iii) in the x–y plane are shown in Figure A1, Figure A2 and Figure A3 in Appendix A. The length of arrows in these graphs represents the relative magnitude of power flow density (power flow per unit area) vector, while the orientation of arrows indicates the direction of power flow.
Figure A1, Figure A2 and Figure A3 show that the vibration power flows to the ABH area obviously when passing through. For the ABH plate with both boundary conditions, power flow density vectors near the central plateau of ABH are obviously larger than those in other positions, especially in the uniform part of the plate. The power flow transmission graphs with different boundary conditions are similar at the frequency of 1000 Hz and 1100 Hz. However, at 1050 Hz, the power flow density vectors in locations other than the central plateau with BC 2 is much larger than those of the ABH plate with BC 1, which may be due to the natural frequency. The modal analysis results show that, for the plate with BC 1, its natural frequencies near 1050 Hz are 1029.1 Hz and 1053.3 Hz; however, the natural frequencies of the plate with BC 2 near 1050 Hz are 1046.4 Hz and 1053.9 Hz. That is, for the plate with BC 2, the excitation frequency 1050 Hz is between two close natural frequencies, which leads to overall vibration of the whole plate. However, even in that case, the ABH area still gathers a certain amount of energy. That is, the vibration energy is focused on the central area of the ABH structure and the ABH effect is significant in various excitation frequencies and boundary conditions.
According to the structural intensity p d i calculated at nodes within ABH areas by Equation (4), the structural intensity contours of ABH(i), (ii) and (iii) with different boundary conditions and at different excitation frequencies can be drawn, as shown in Figure A4, Figure A5 and Figure A6 in Appendix A. Besides, structural intensity contours of ABHs in corresponding positions of the plate with two boundary conditions at 1000 Hz, 1050 Hz and 1100 Hz are shown in Figure A7 and Figure A8 in Appendix A.
Figure A4, Figure A5 and Figure A6 show that high structural intensity areas appear near the central plateau for every ABH pit, which indicates that vibration energy can indeed be focused near the central areas even if the ABH pit is imperfect. In this way, the damping materials pasted on such high energy density areas can generate an efficient energy dissipation. Additionally, the area of high energy density is similar in size under both boundary conditions. As shown in Figure A7 and Figure A8, although energy focalization is realized in every ABH pit, the amount of energy focused is related to the position of ABH. For the plate model under BC 1, most of the vibration energy is focalized to the surrounding four ABHs except in the case of 1100 Hz. However, for the plate model under BC 2, most of the vibration energy is focalized to the two ABHs on the lower side except in the case of 1000 Hz.
That is, under certain excitation force, the energy focalization effect of the plate embedded with the ABH array is related to the excitation frequency, the boundary condition and the ABH position, which should be studied further.

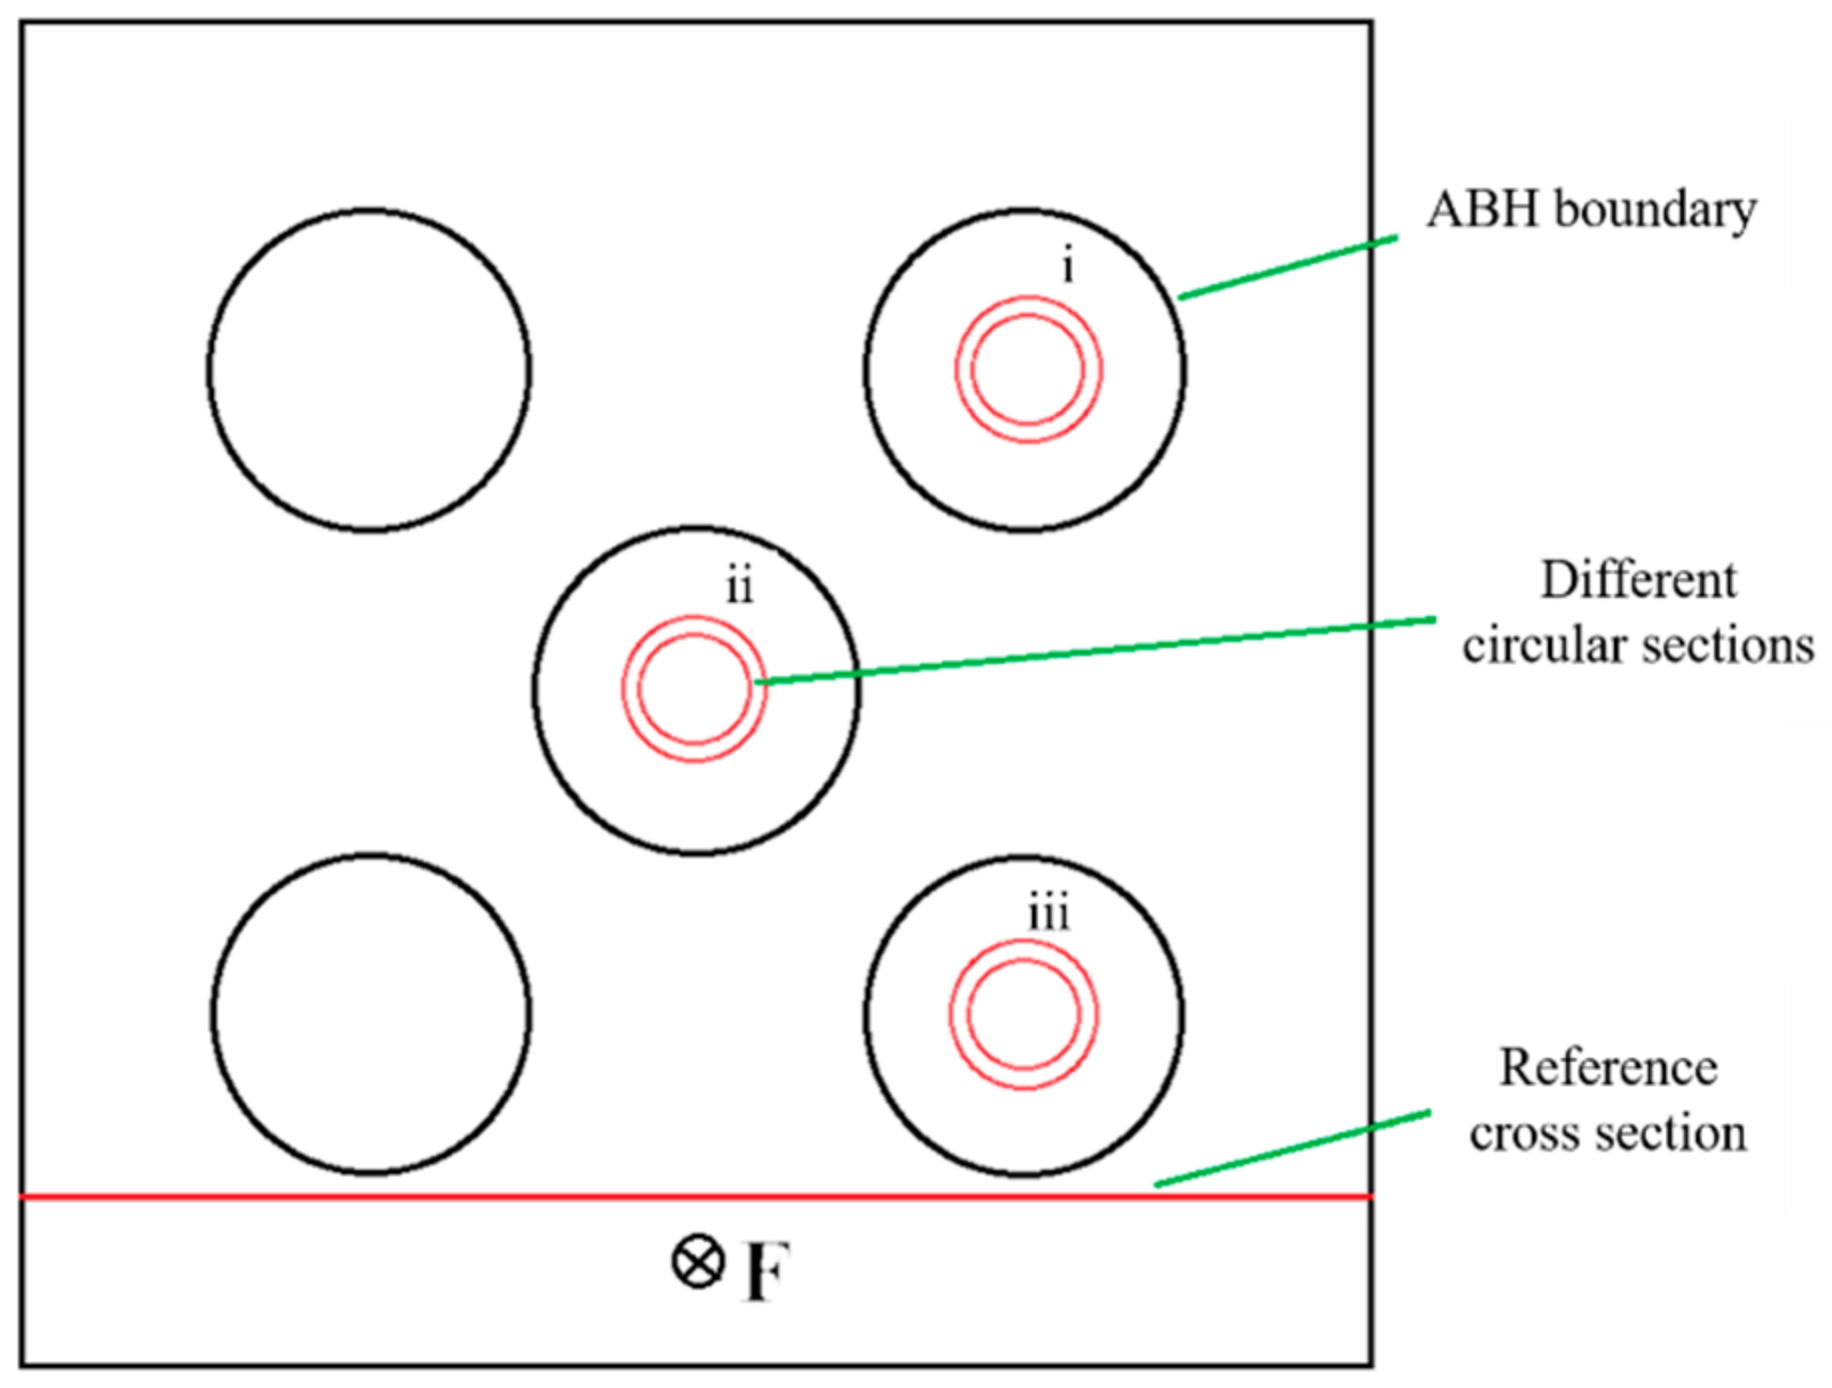
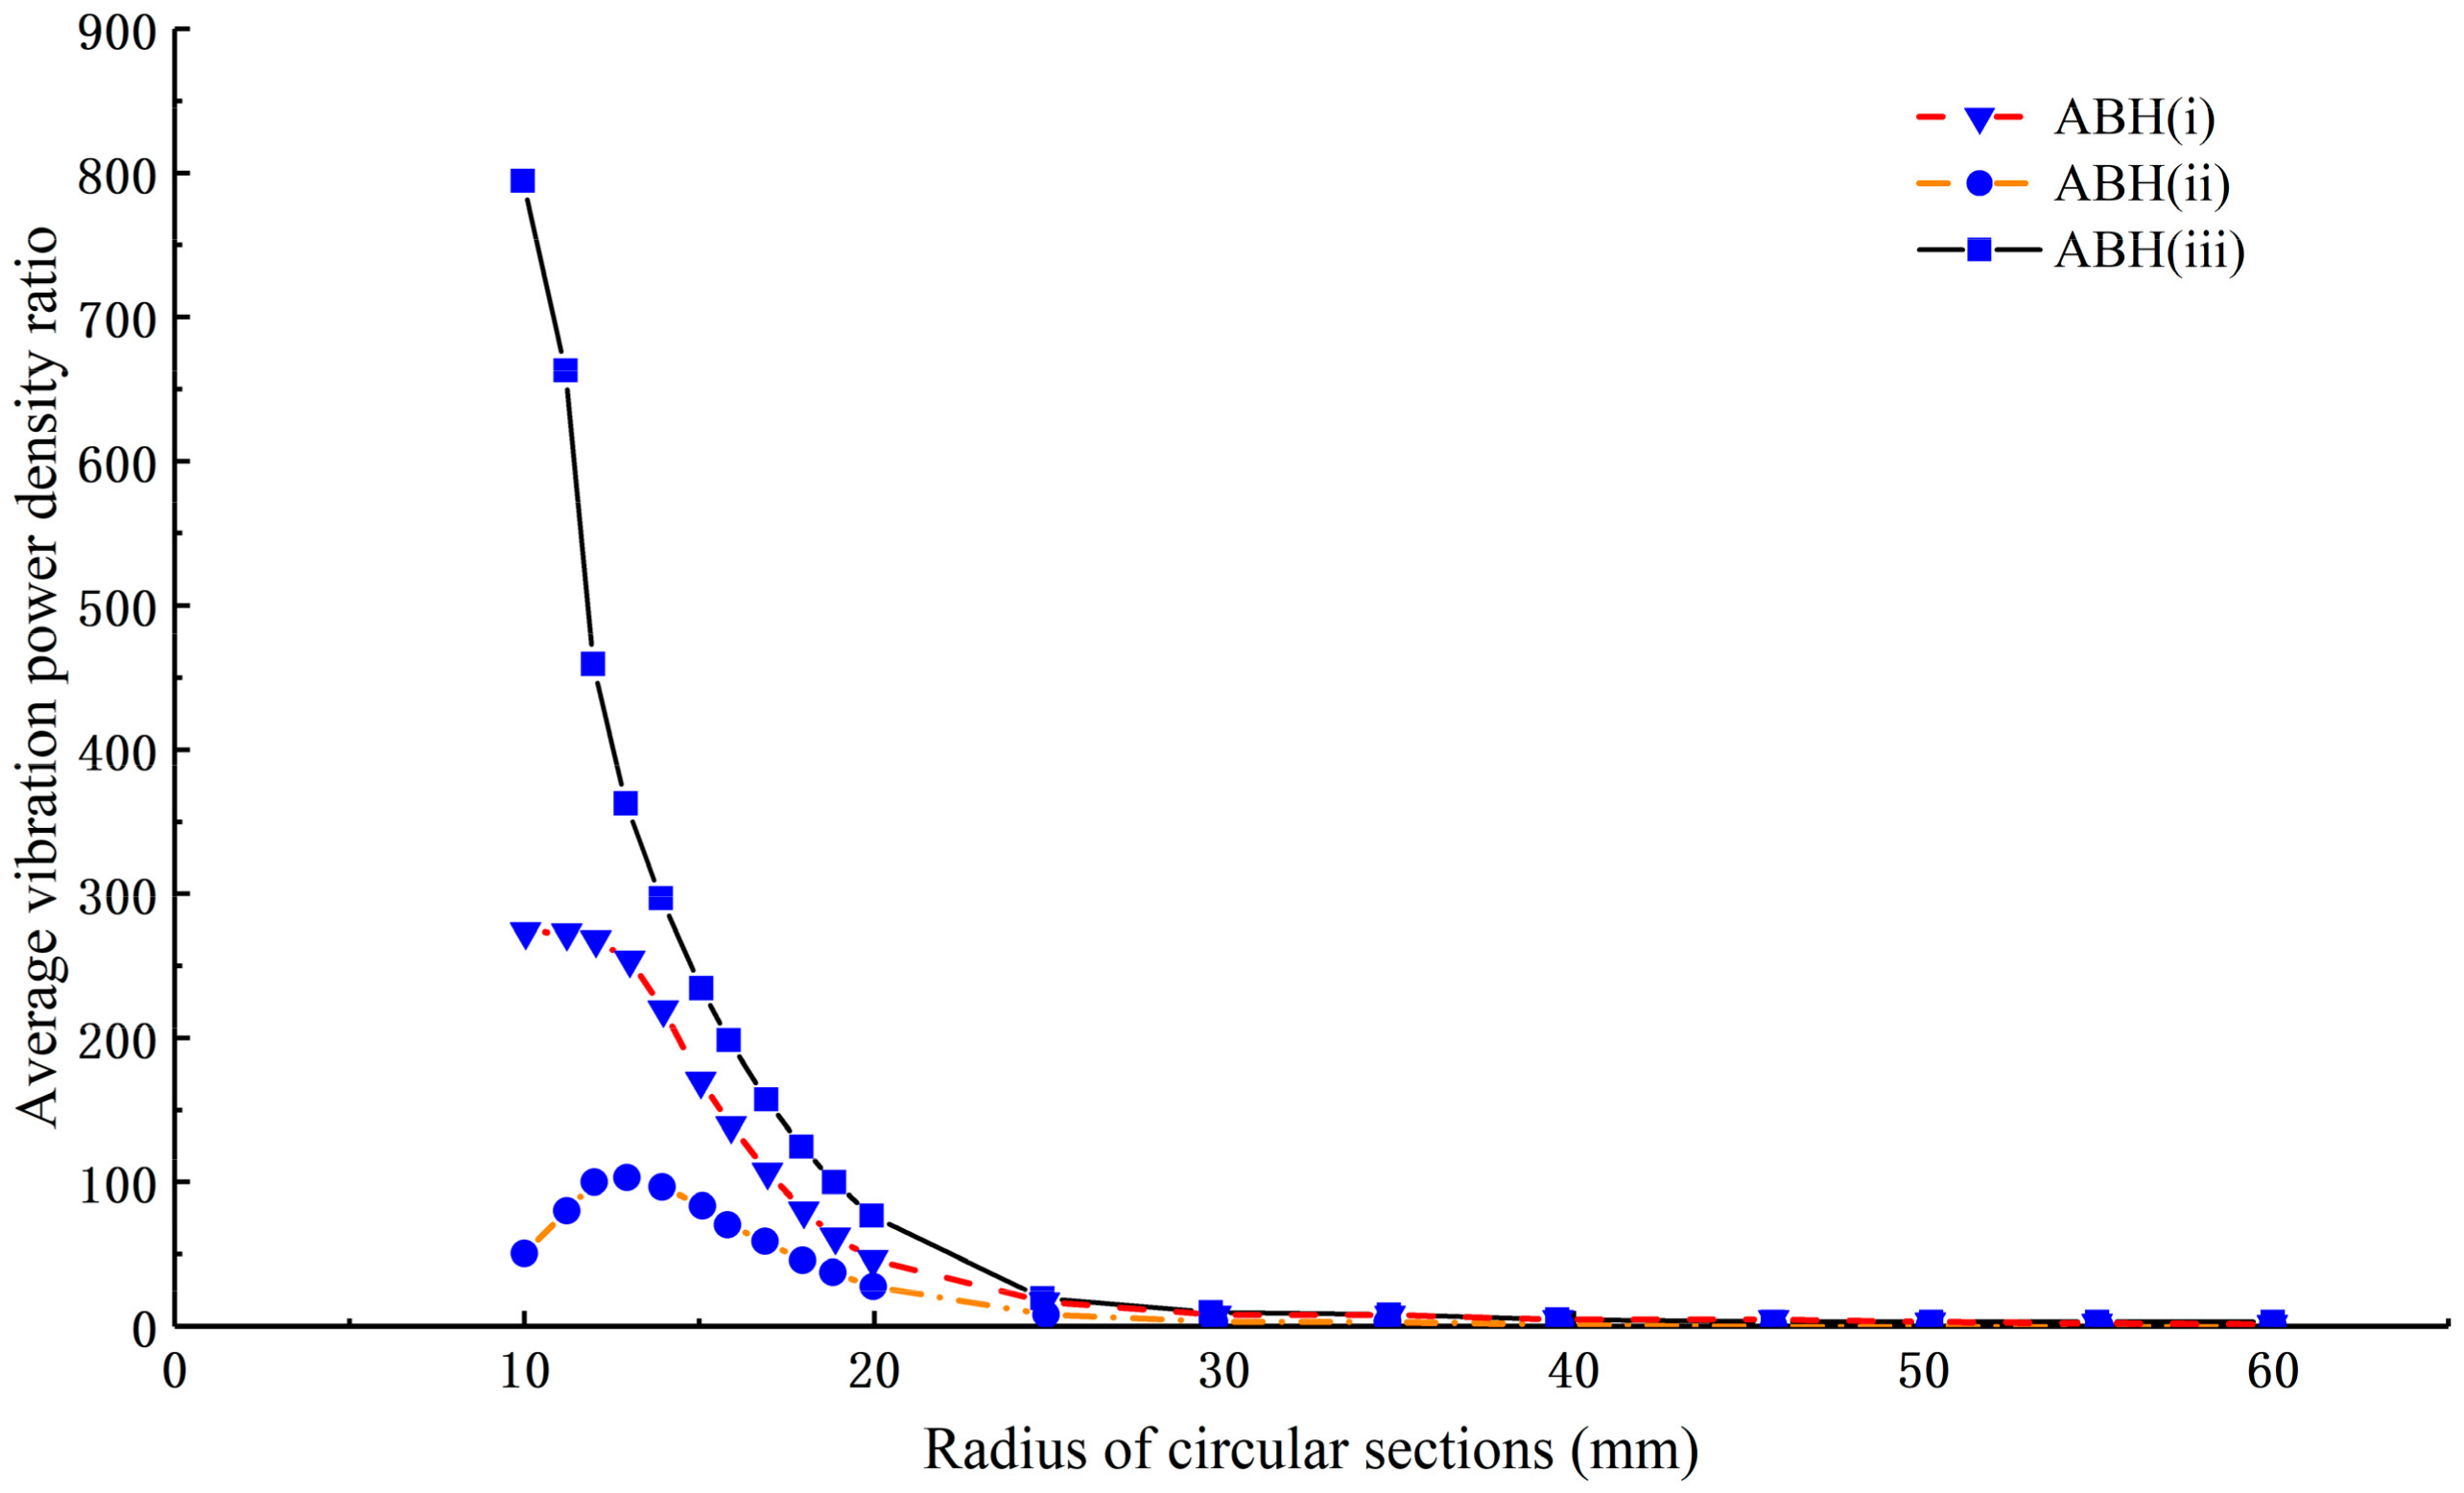
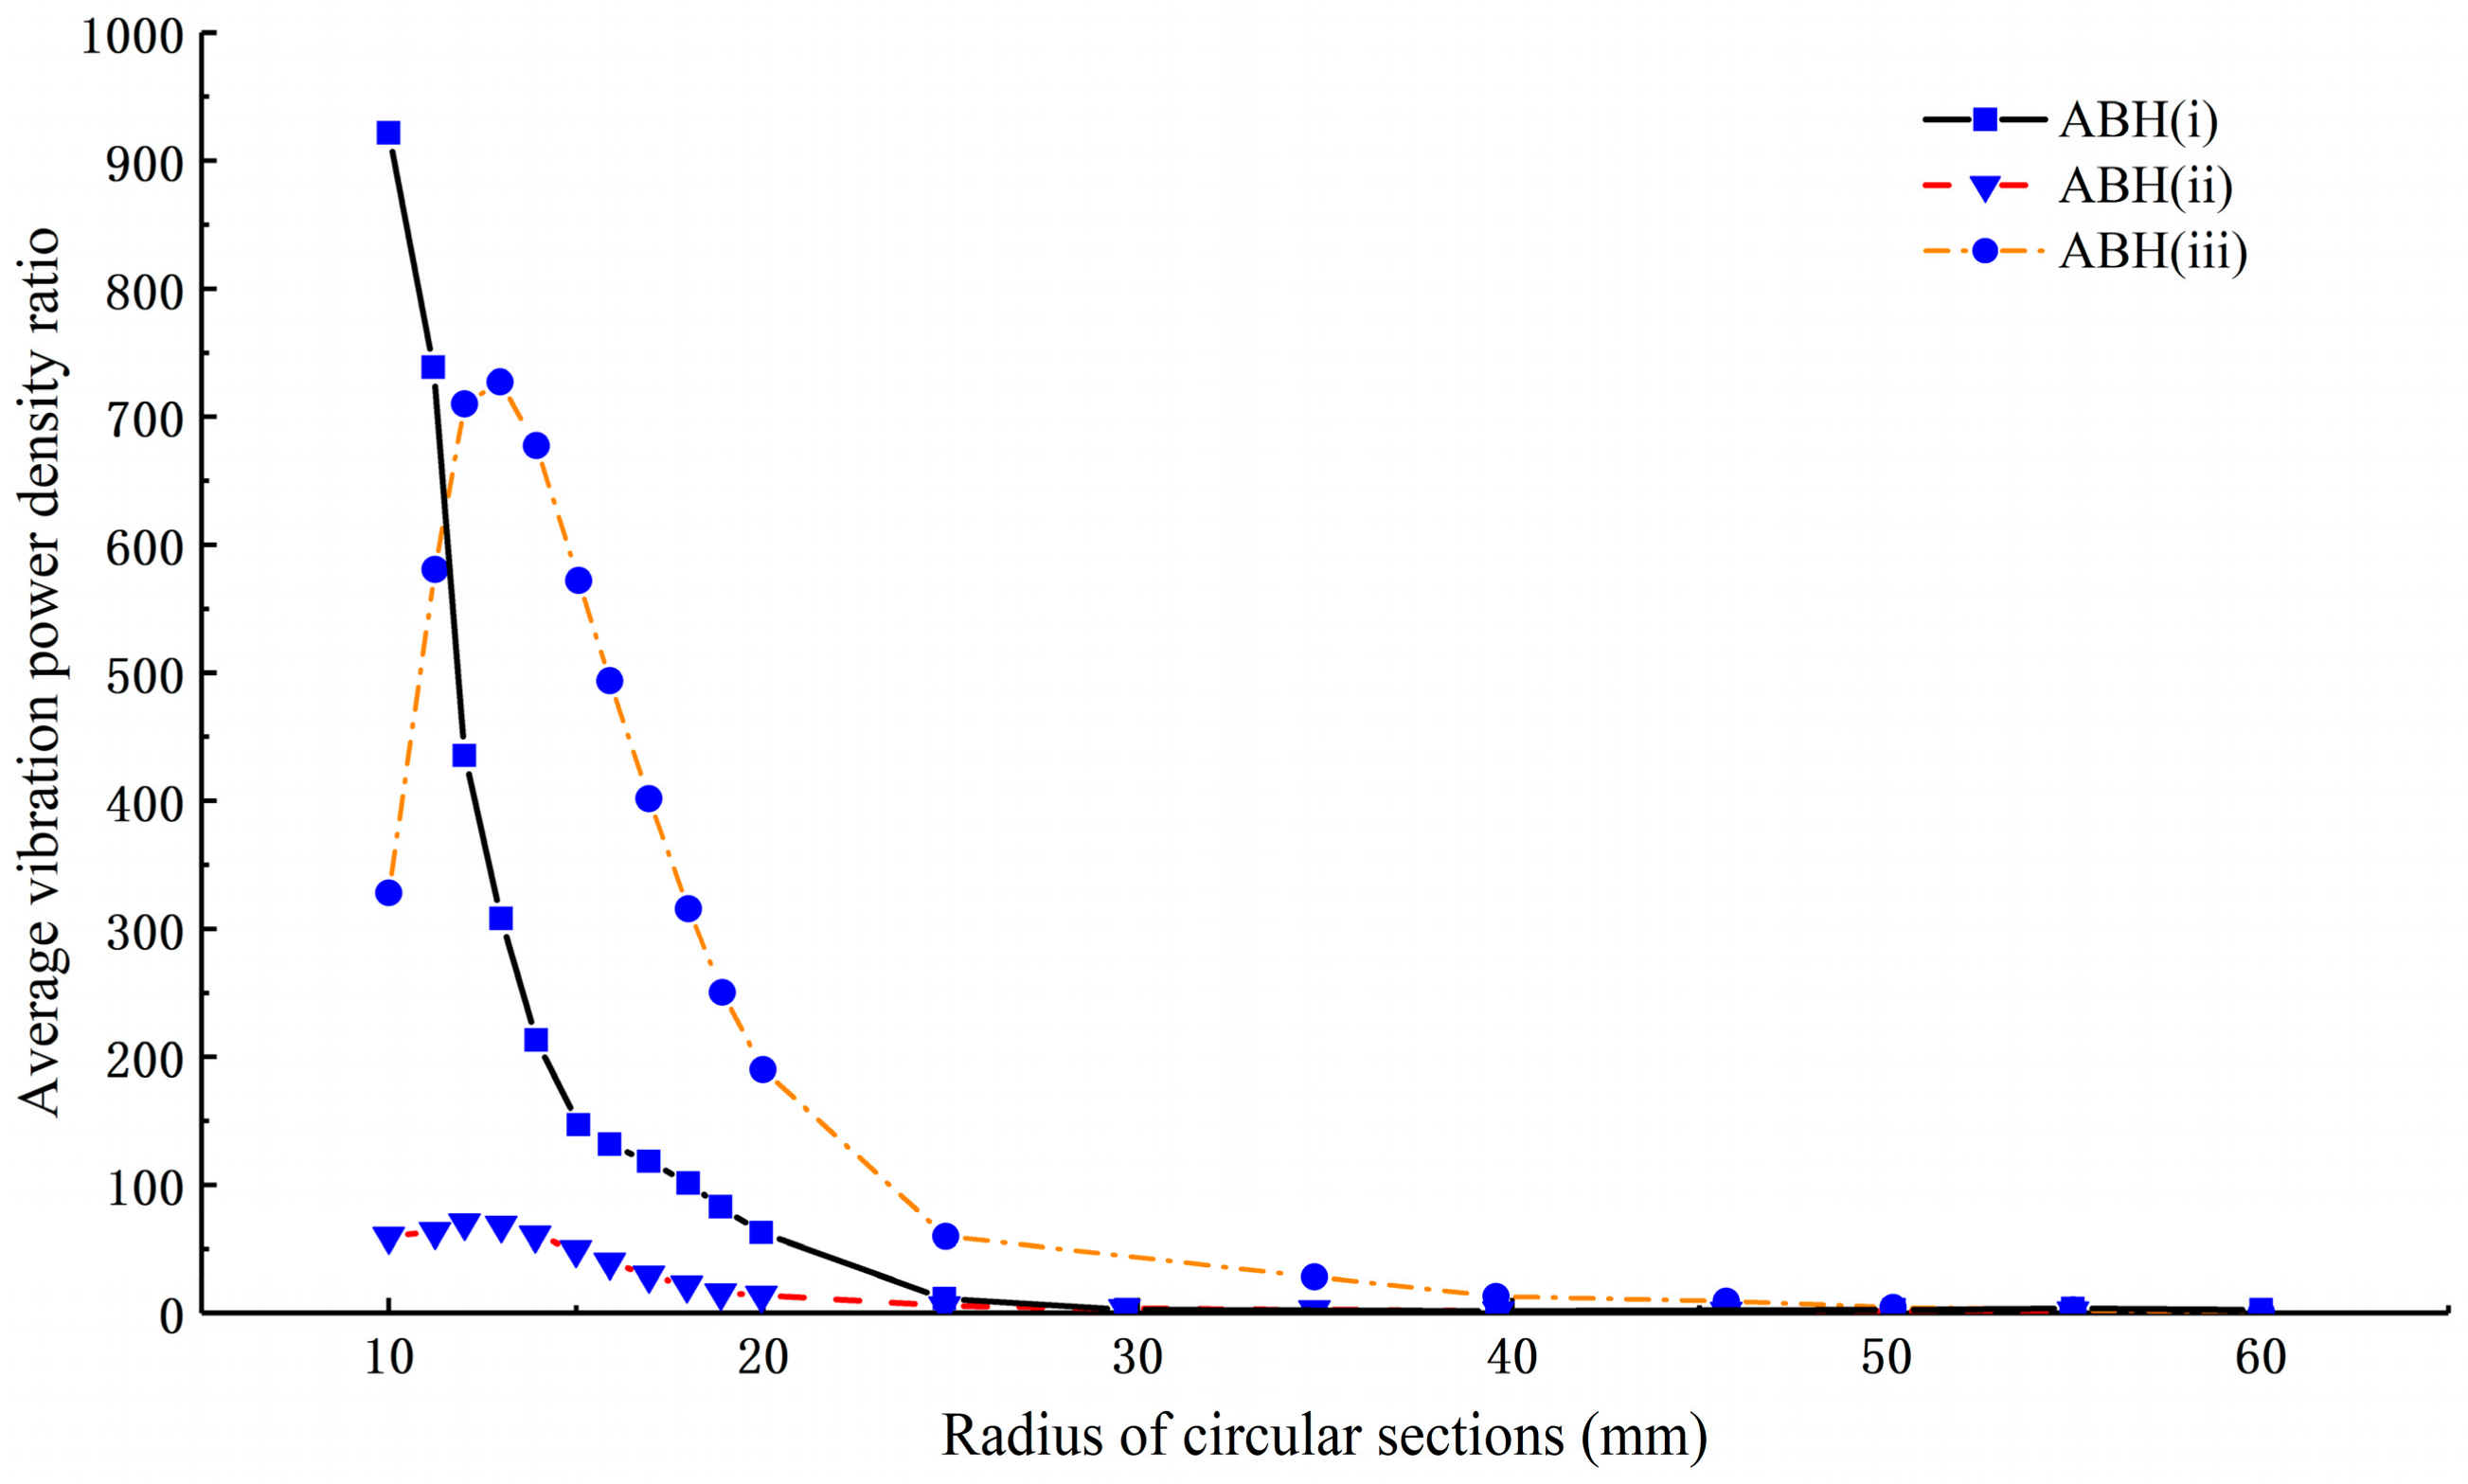
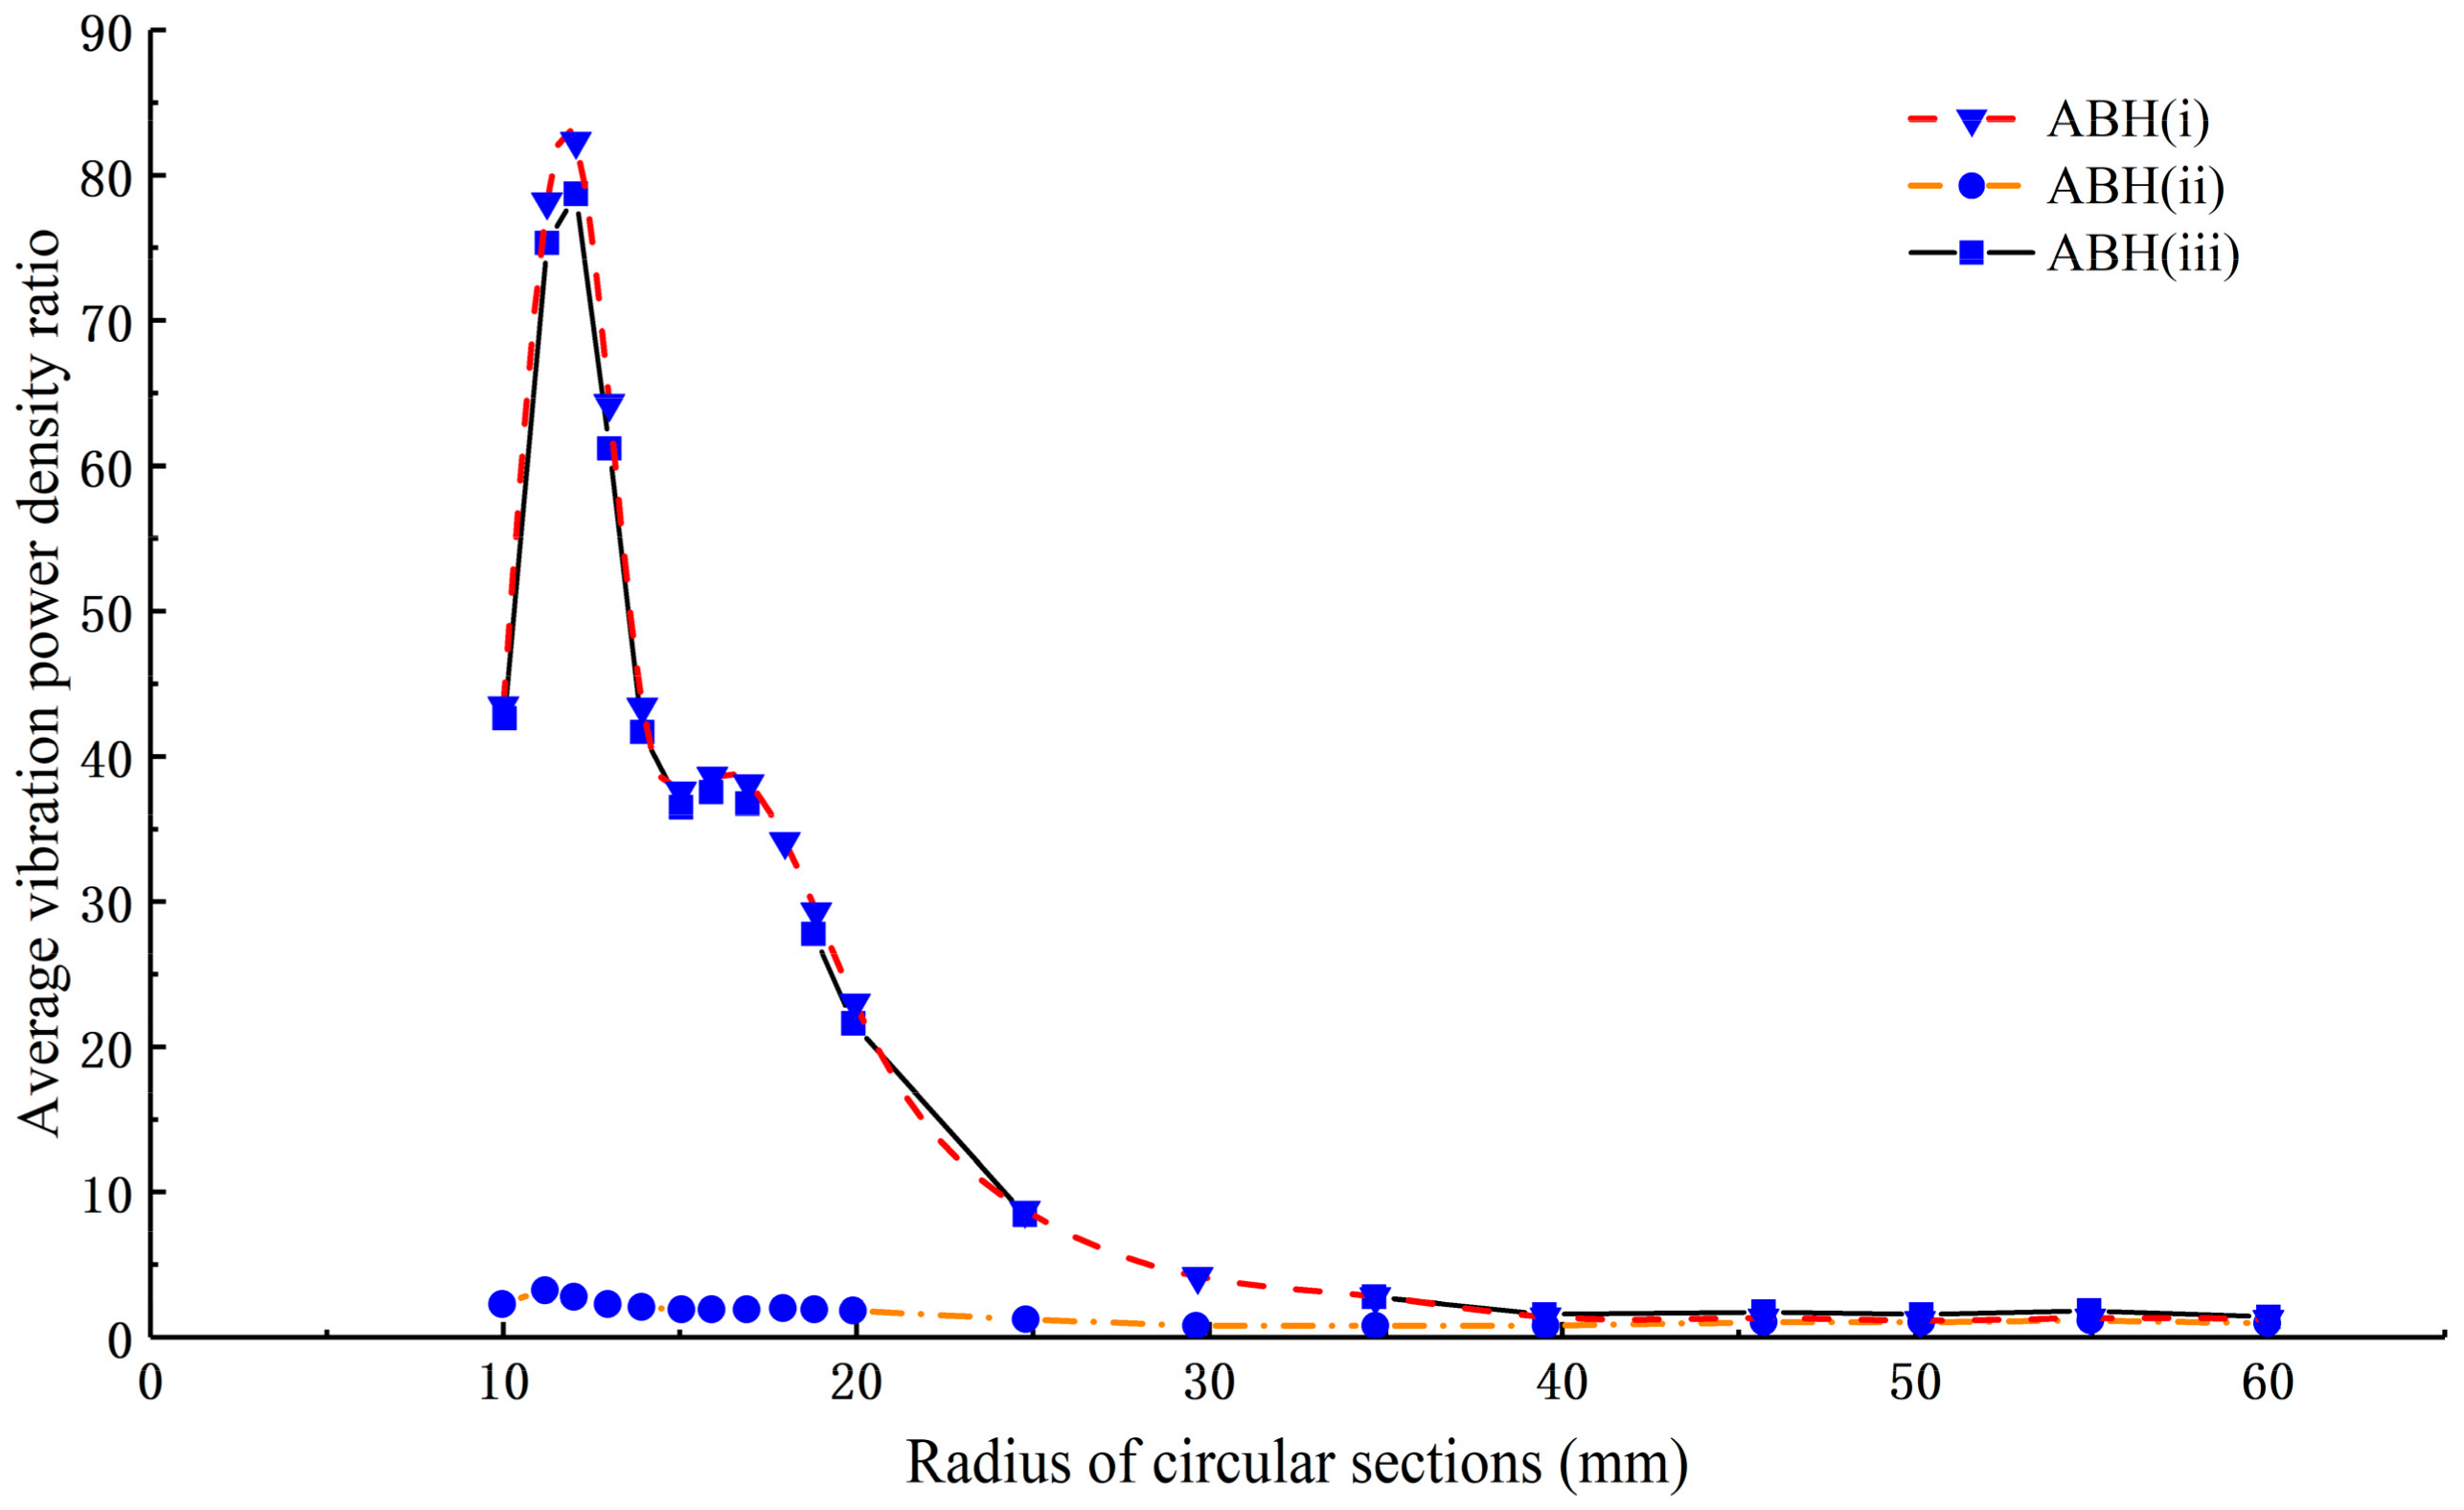
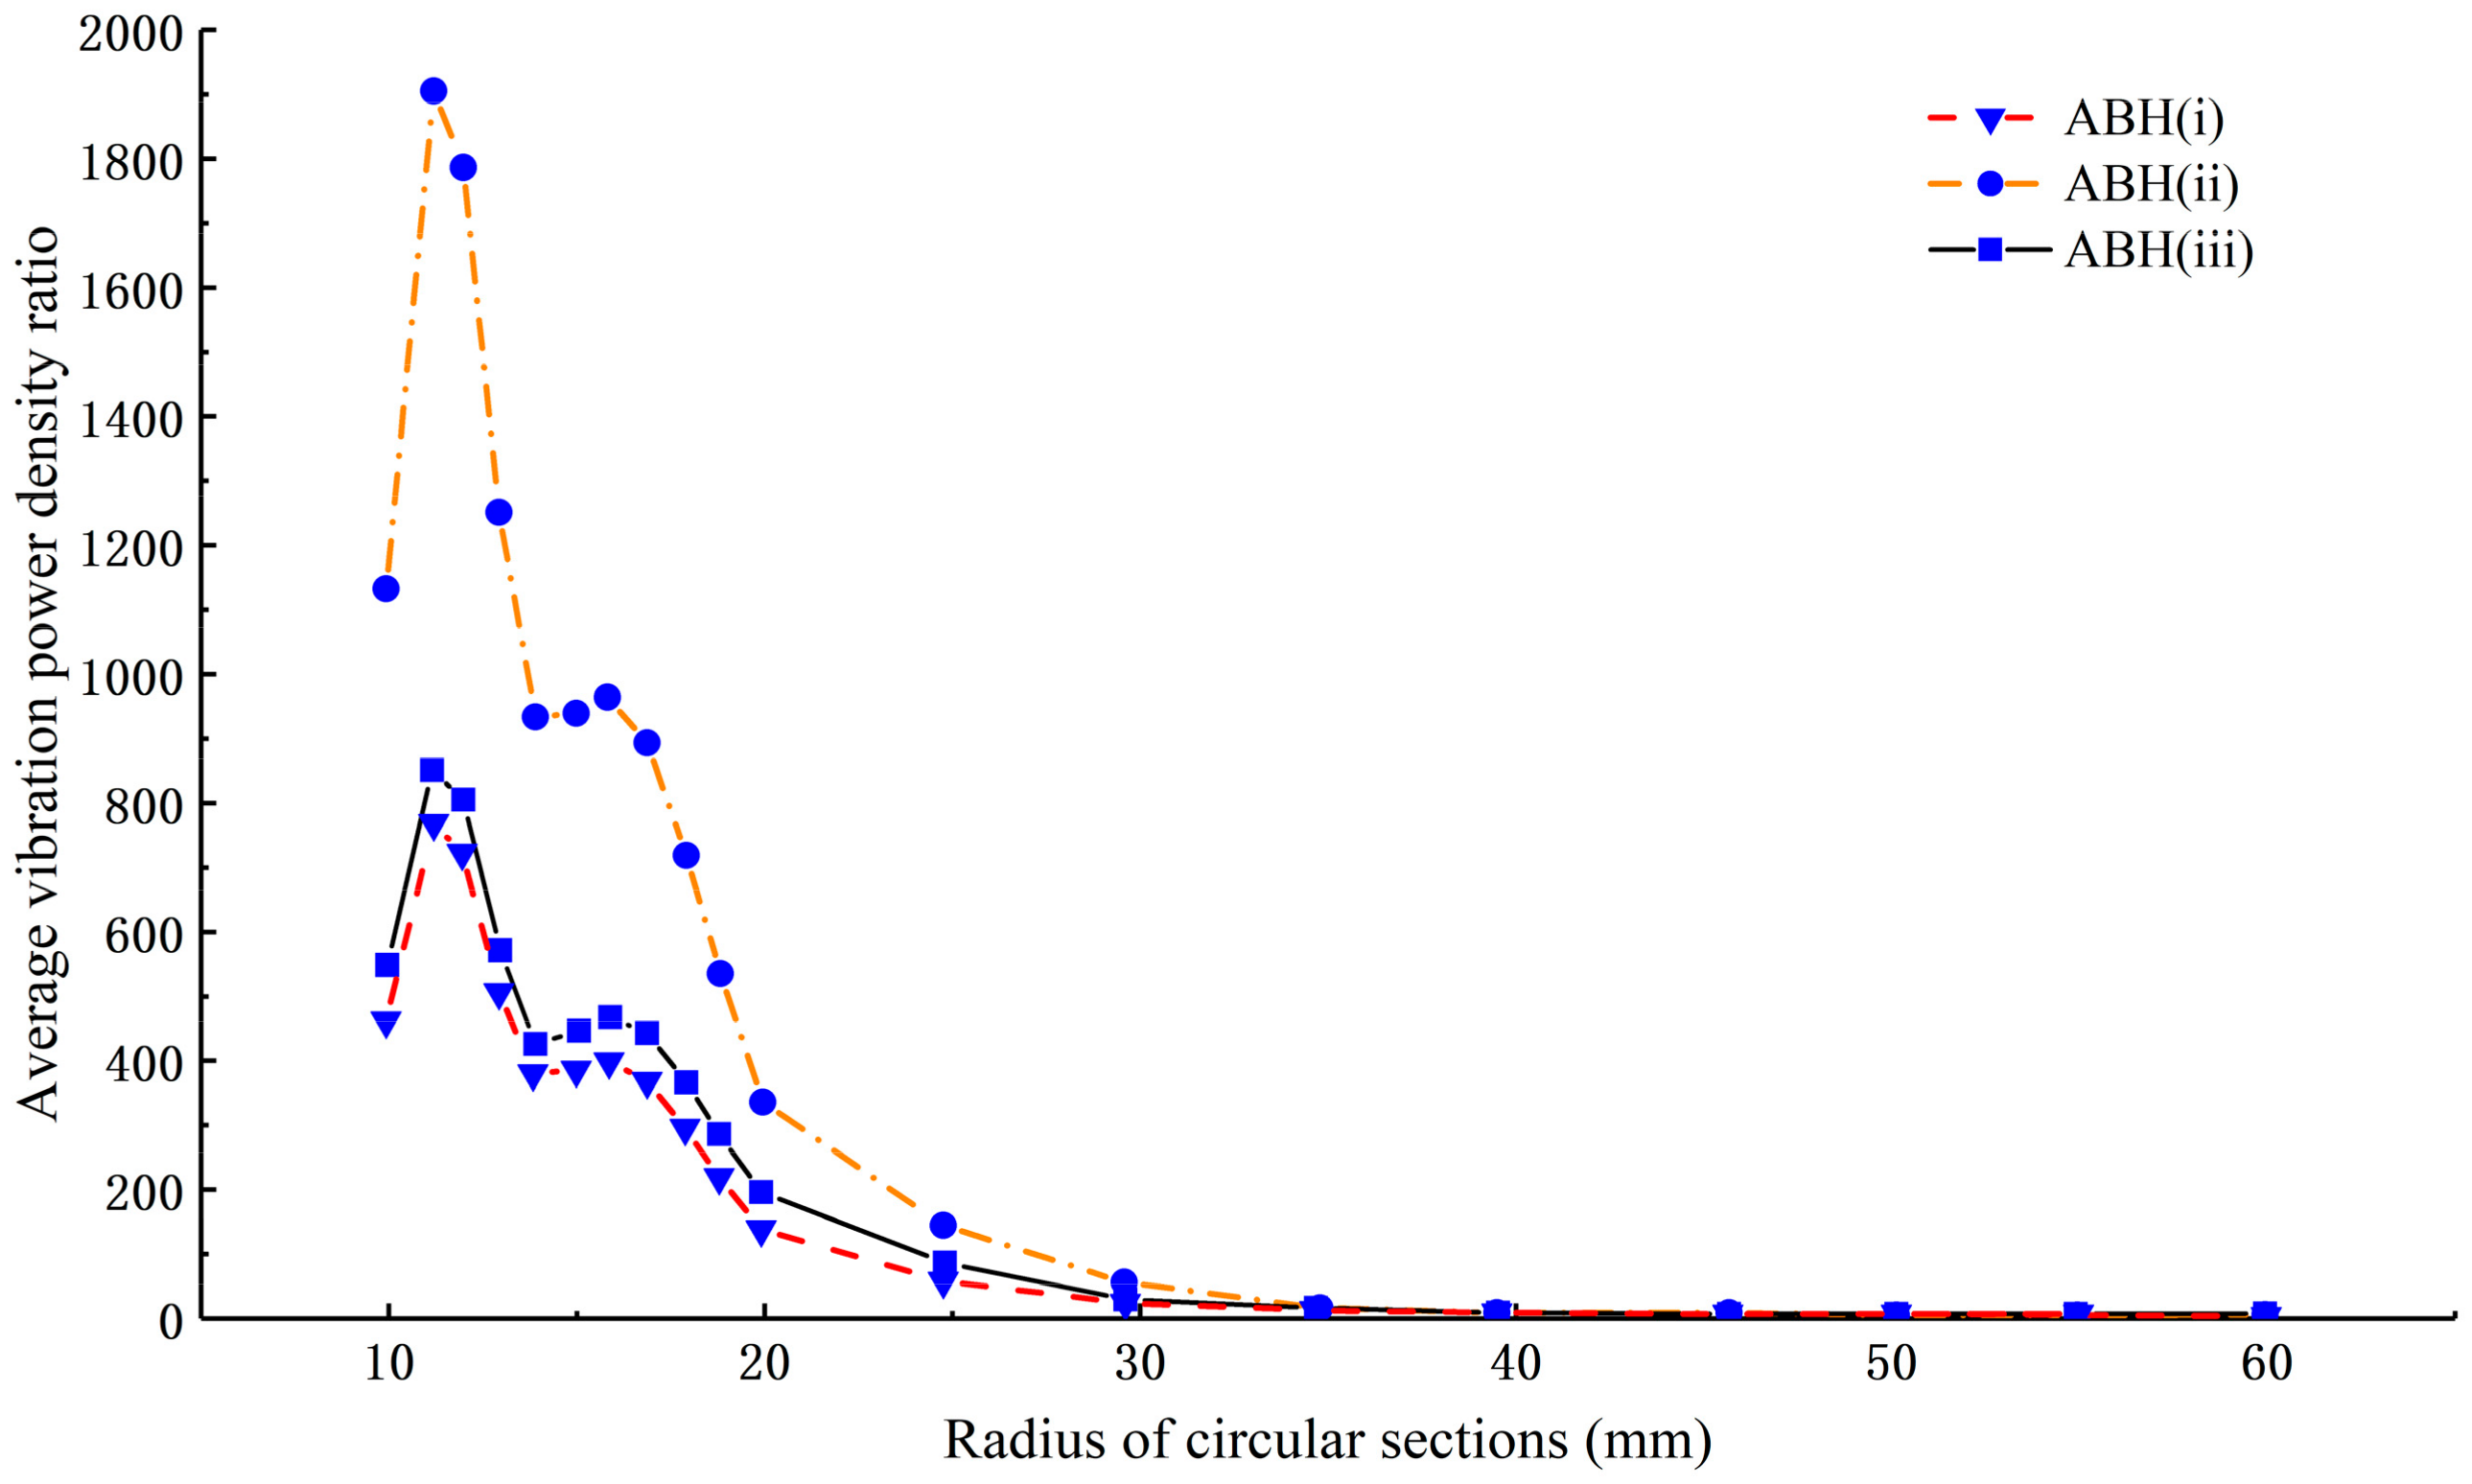
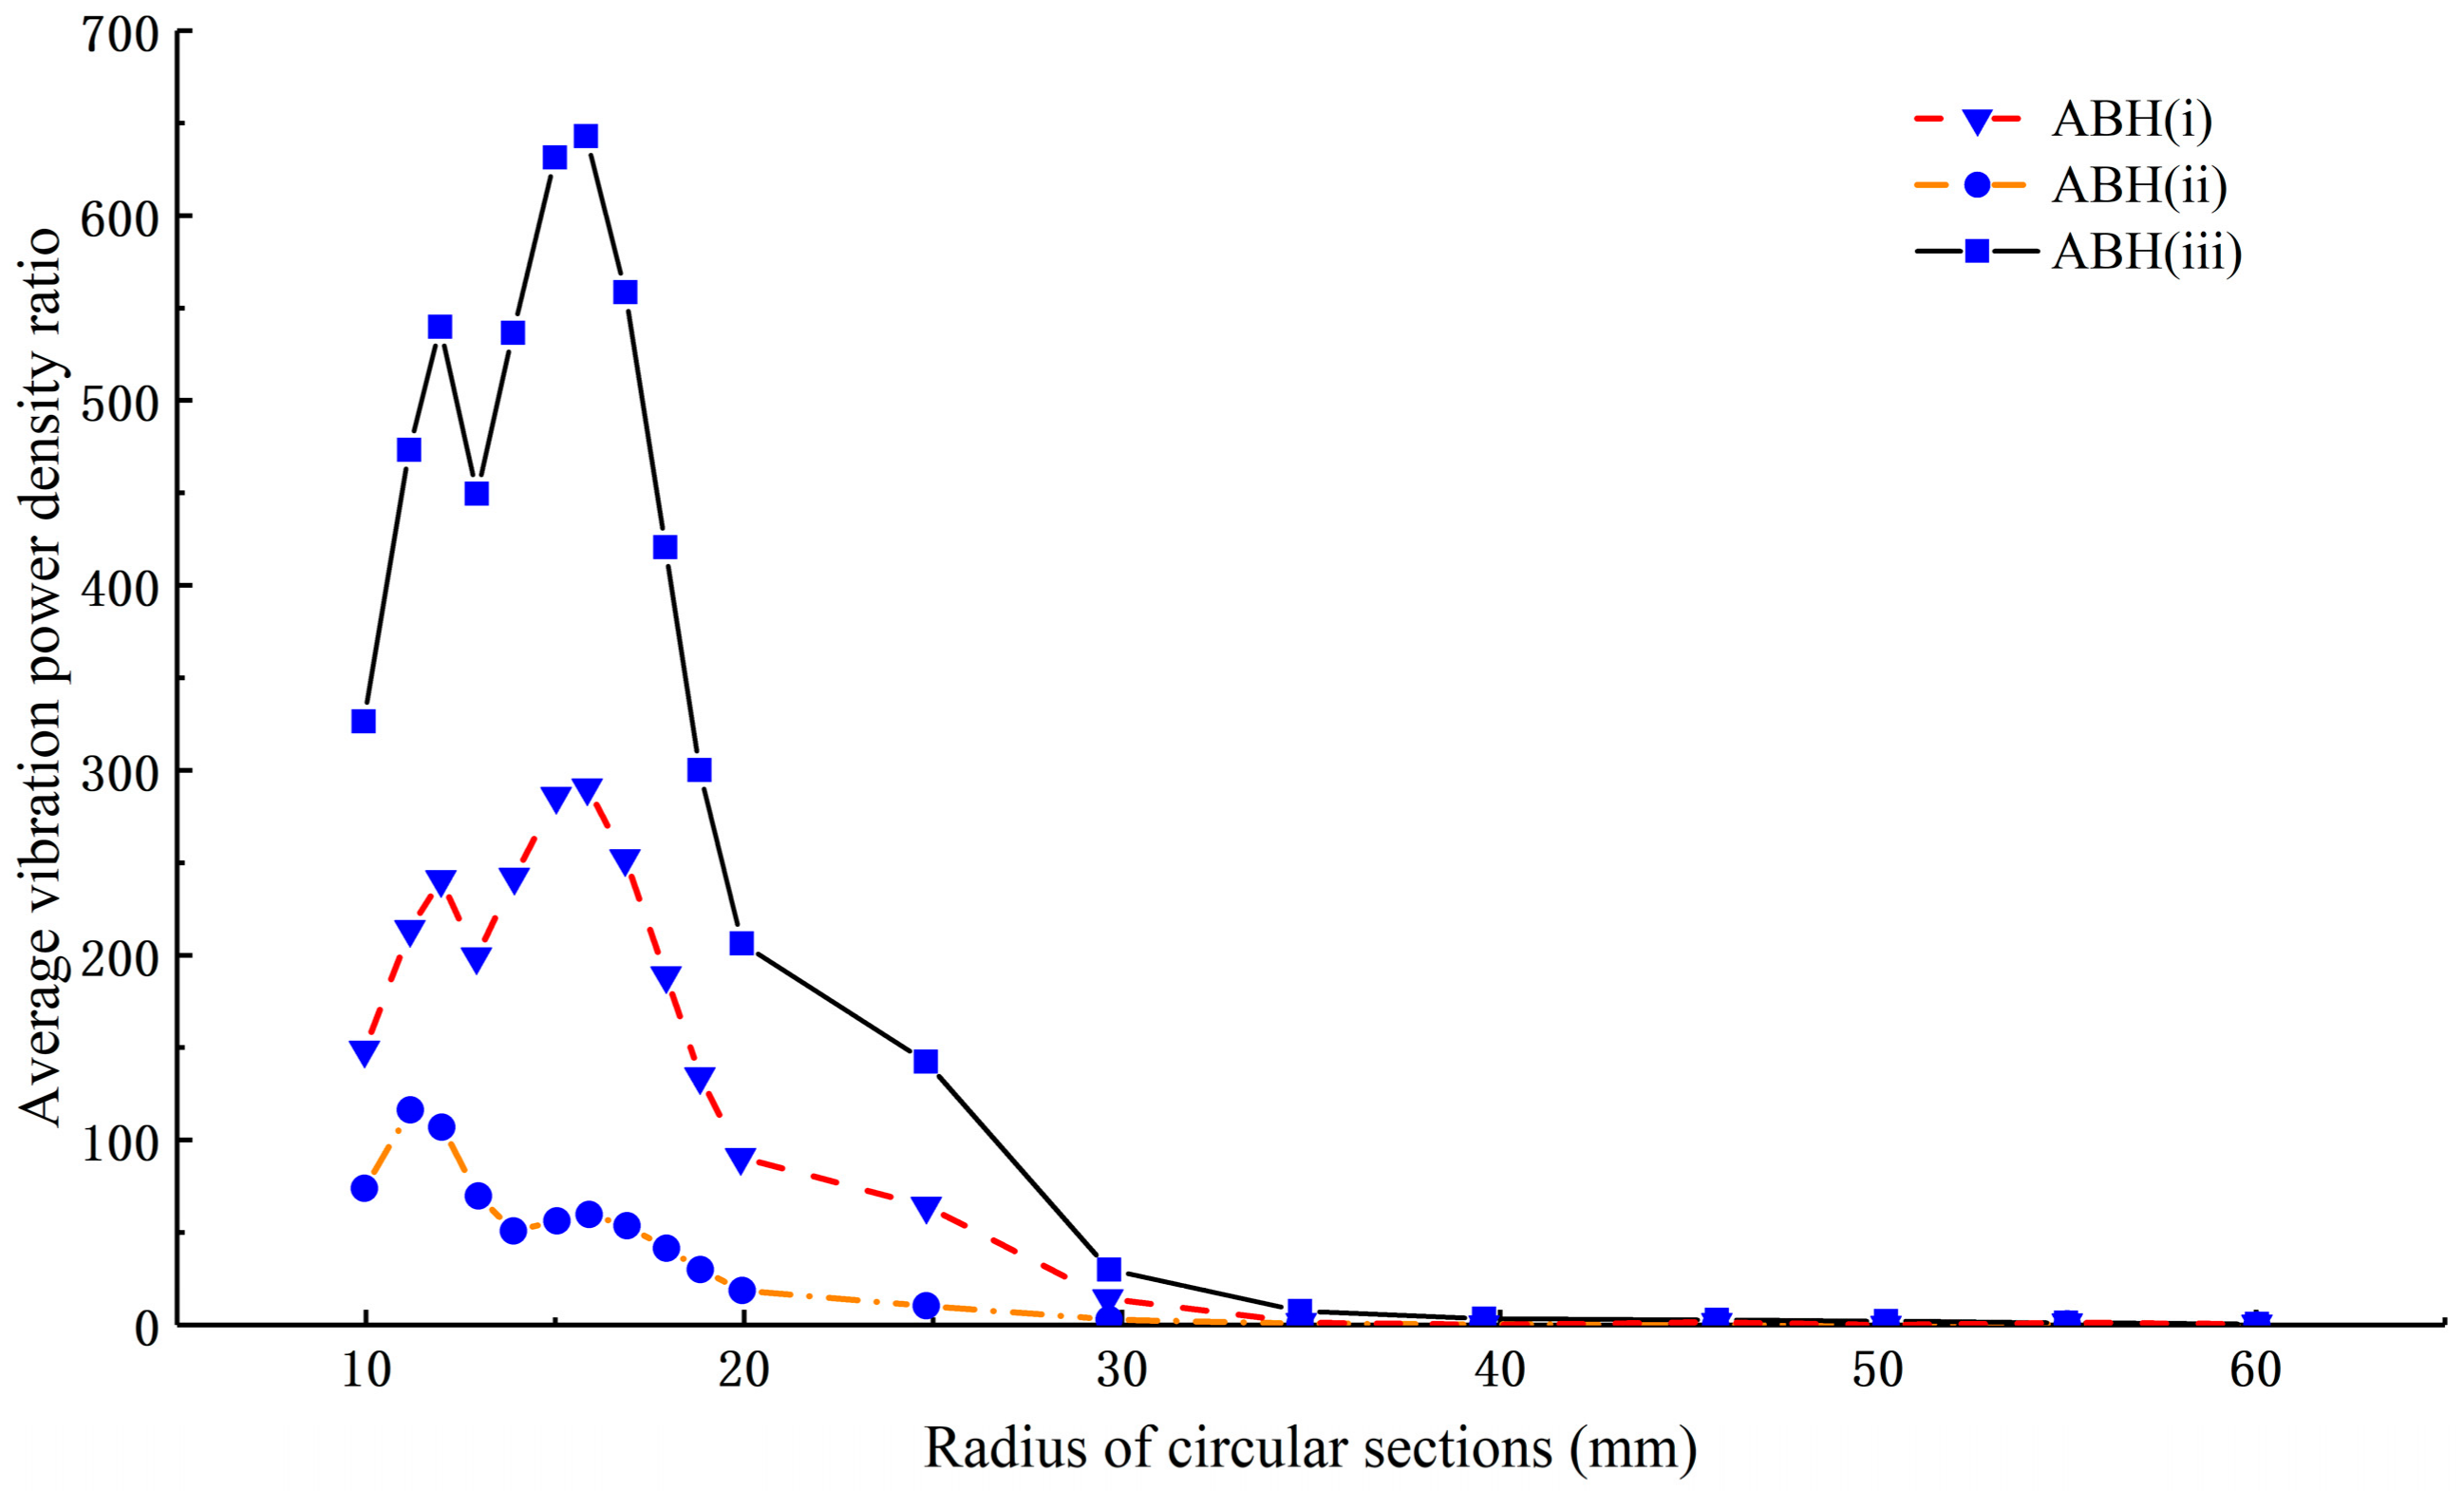
2.4. Quantitative Analysis of Energy Focalization in the Plate with ABH Array

Section 2.2 and Section 2.3 indicate that for the ABH plate, vibration energy can be focused on some specific areas, which is important for performing efficient vibration and noise control by using damping materials. To investigate the energy focalization feature at different positions away from the center of ABH, the quantitative analysis is carried out in this section.
The top view of the plate embedded with the two-dimensional ABH array is schematically shown in Figure 6. The distance from the plate center to the reference cross-section is 0.21 m. In order to study the relationship between the vibration energy density and ABH radius, particularly for ABH(i), (ii) and (iii) in Figure 6, nodes at 19 different circular sections with radii from 10 mm to 60 mm are investigated. Besides, the nodes at the circular section with a radius of 11.22 mm (radius of the central platform) are also selected and their average vibration power density expressed as Equation (6) are calculated. Model parameters are set as Section 2.1 and Section 2.2 and the plate is under BC 1.
P a d = p d i N s
where P a d is the average vibration power density; p d i represents the structural intensity at the ith node, as shown in Equation (4), and N s is the total number of nodes at the selected section.
Then, the ratios of average vibration power density at different circular sections of an ABH to that at the reference cross-section of the plate are calculated, and by using this ratio, the focalization characteristics of the vibration energy at circular sections with different radii in the ABH can be analyzed. To investigate the vibration energy distribution with ABH radius under excitation frequency 1000 Hz, 1050 Hz and 1100 Hz, and the influence of natural frequencies, average vibration power density ratios of different circular sections of ABH(i), ABH(ii) and ABH(iii) at the excitation frequency of 1000 Hz, 1002 Hz, 1050 Hz, 1072 Hz, 1088 Hz, and 1100 Hz are shown in Figure 7, Figure 8, Figure 9, Figure 10, Figure 11 and Figure 12 (1002.0 Hz, 1072.1 Hz, and 1088.0 Hz are natural frequencies of the ABH plate).
As shown in Figure 7, Figure 8, Figure 9, Figure 10, Figure 11 and Figure 12, the average vibration power density ratios at different circular sections in the ABHs are much greater than unity. Particularly, the maximum ratio value can reach hundreds when the excitation frequency is near the natural frequency of the plate, which indicates a significant energy focalization effect.
Additionally, several other observations can be made. First, a peak value in the radius range of 10 mm to 20 mm exists for each curve, and more peaks can be observed in Figure 11 and Figure 12. That indicates that the vibration energy focalized in the ABH center is not the largest, which may be caused by the central plateau. As vibration response peak values at different positions are related to excitation frequency and nearby mode shapes, at different excitation frequencies, vibration response is various so that the numbers of peaks are different as well. Second, for all excitation frequencies, the energy focalization of ABH(i) and ABH(iii) is more effective than that of ABH(ii). In addition, the ratios are relatively low when the radius of circular section is larger than 30 mm. That is, energy focalization effect is more obvious within a 30 mm radius for every ABH pit designed in this work, which provides a reference for using damping layers more effectively.
The above observations suggest that the energy focalization effect of a single ABH cell in the array is related to the excitation frequency, the distance from the ABH center and the cell position in the plate. Furthermore, for every ABH cell at a certain excitation frequency, most of the energy is focalized within a limited area. Therefore, these factors should be concerned in further research to better design the plate embedded with the ABH array.

3. Effect of Damping Layers in ABH Array on Energy Dissipation and Sound Radiation of Plate

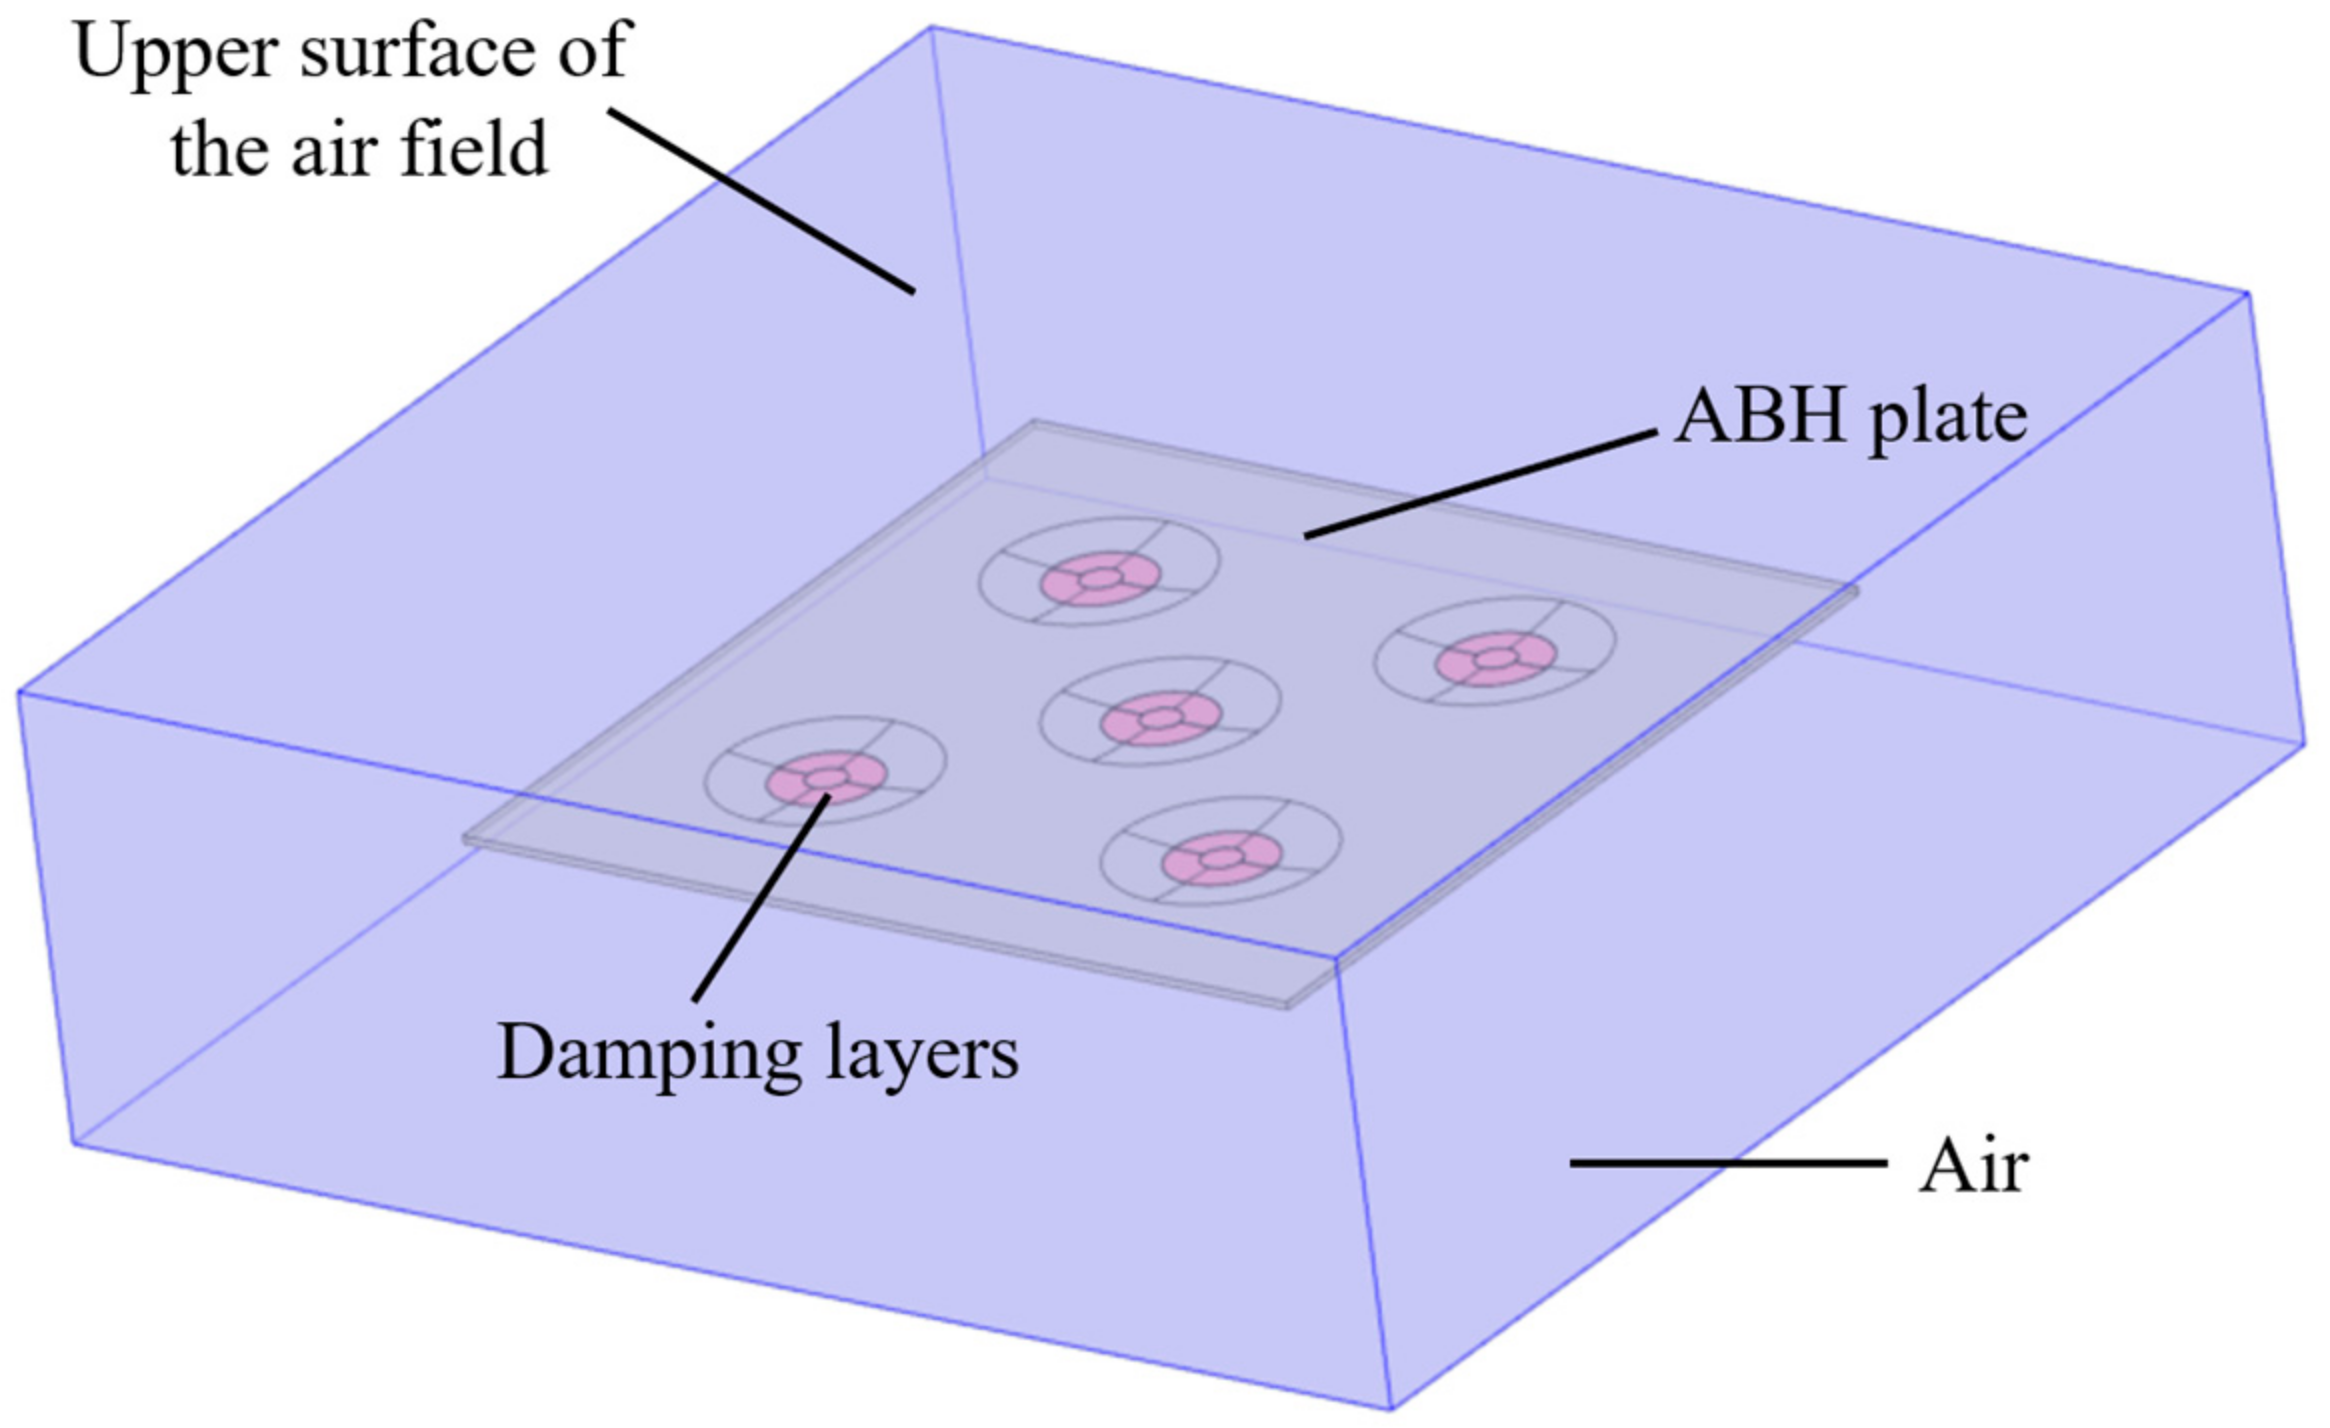
3.1. FE Model of Plate Embedded with ABH Array with Damping Layers

In this section, two types of damping layers are introduced to investigate the energy dissipation effect of damping materials coated on an ABH plate. Inspired by the symmetrical one-dimensional ABH wedge [3] shown in Figure 13a, the damping layer with a power-law varying thickness is introduced, as shown in Figure 13b and Figure 14b. In addition, damping layers in the same mass, but with uniform thickness, are also investigated, as shown in Figure 14c. The results in Section 2.4 indicate that the energy focalization effect is more significant in the area within a radius of 30 mm. Therefore, the profile of damping layers is designed to be symmetrical with that of the ABH and with a radius of 30 mm. The parameters of the damping layers are shown in Table 3. The FE model of the plate structure with the two-dimensional ABH array and damping layers is illustrated in Figure 14a. The weight of the plate with the ABH array and damping layers is 6.88 kg, while that of the uniform plate with only damping layers is 7.81 kg. That is, the acoustic black holes result in about 11.9% weight saving.

3.2. Energy Dissipation in Plate Embedded with ABH Array with Damping Layers

Figure 14a shows the plate embedded with 5 ABHs coated with damping layers. Sections A and B are cross-sections of the plate. Vibration energy can be expressed as average power flow at the given section per unit time, as defined in Equation (5). Consequently, to evaluate the energy dissipation characteristics of the plate embedded with the ABH array with different damping layers, the difference of average power flow between section A (before ABHs) and section B (after ABHs) is calculated.
For the plate embedded with the ABH array, shown as Figure 3b with varying thickness damping layers, uniform thickness damping layers and without damping layers under both BC 1 and BC 2, the difference of vibration energy per time unit (average power flow) between section A and B is calculated in frequency domain, respectively. Additionally, the vibration energy difference of a uniform plate with the same varying thickness damping layers with BC 1 is also calculated as a reference. Results are shown in Figure 15 and Figure 16. Both show that the ABH plate without damping layers has the highest peaks, which indicates that more energy is gathered within the ABH areas between the two sections. Moreover, peak values of energy difference decrease obviously after the application of damping layers because of the energy dissipation effect of damping materials. As a result, a larger difference means a smaller dissipation effect by the damping layers.
Figure 15 shows that every curve has two peaks, and the vibration energy difference between sections A and B of the plates embedded with the ABH array with different damping layers are obviously higher than that of the uniform plate with damping layers in the range of 980–1060 Hz. This indicates that the energy dissipation efficiency of damping materials is obviously improved because of the ABHs, particularly in the range of 1020–1040 Hz. Besides, for plates embedded with the ABH array, the peaks occur at different frequencies for different damping configurations. This indicates that the damping materials may change the energy distribution of plate embedded with the ABH array in the frequency domain to some extent and reduce the frequency at which the ABH array starts to work. Moreover, due to the energy dissipation of damping layers, the peak energy difference values of the ABH plate with uniform damping layers and the ABH plate with varying thickness damping layers are smaller than that of the ABH plate without damping layers, which means that some energy is dissipated by damping materials. The peak value of the ABH plate with uniform damping layers is smaller than that of the ABH plate with varying thickness damping layers, which indicates that the uniform damping layers have a better energy dissipation effect than varying thickness damping layers in this case.
Similar conclusions can be drawn from Figure 16. First, similar to the ABH plate with BC 1, every curve has two peaks and the peak values ranging from larger to small is an ABH plate without damping layers, an ABH plate with varying thickness damping layers and an ABH plate with uniform damping layers, respectively. Besides, the curves also show that damping layers change the energy distribution in the frequency domain and reduce the frequency where the ABH starts to work. Moreover, as the boundary condition is changed, the frequency corresponding to the first peak is lower than that with BC 1 and the frequency corresponding to the second peak value is higher than that with BC 1, which means that boundary condition can also influence the energy distribution in the frequency domain.
Therefore, the energy focalization characteristics of the ABH structure can be used to achieve effective energy dissipation by using relatively small damping layers, and the dissipation effect of uniform damping layers is better than power-law profile thickness damping layers in this case. Besides, damping layers attached to ABH areas and boundary condition of the plate can change the energy distribution in the frequency domain. At the same time, the mass of plate with the ABH array is less than that of the uniform plate, so the contradiction between the plate lightweight and vibration control can be harmonized to some extent.

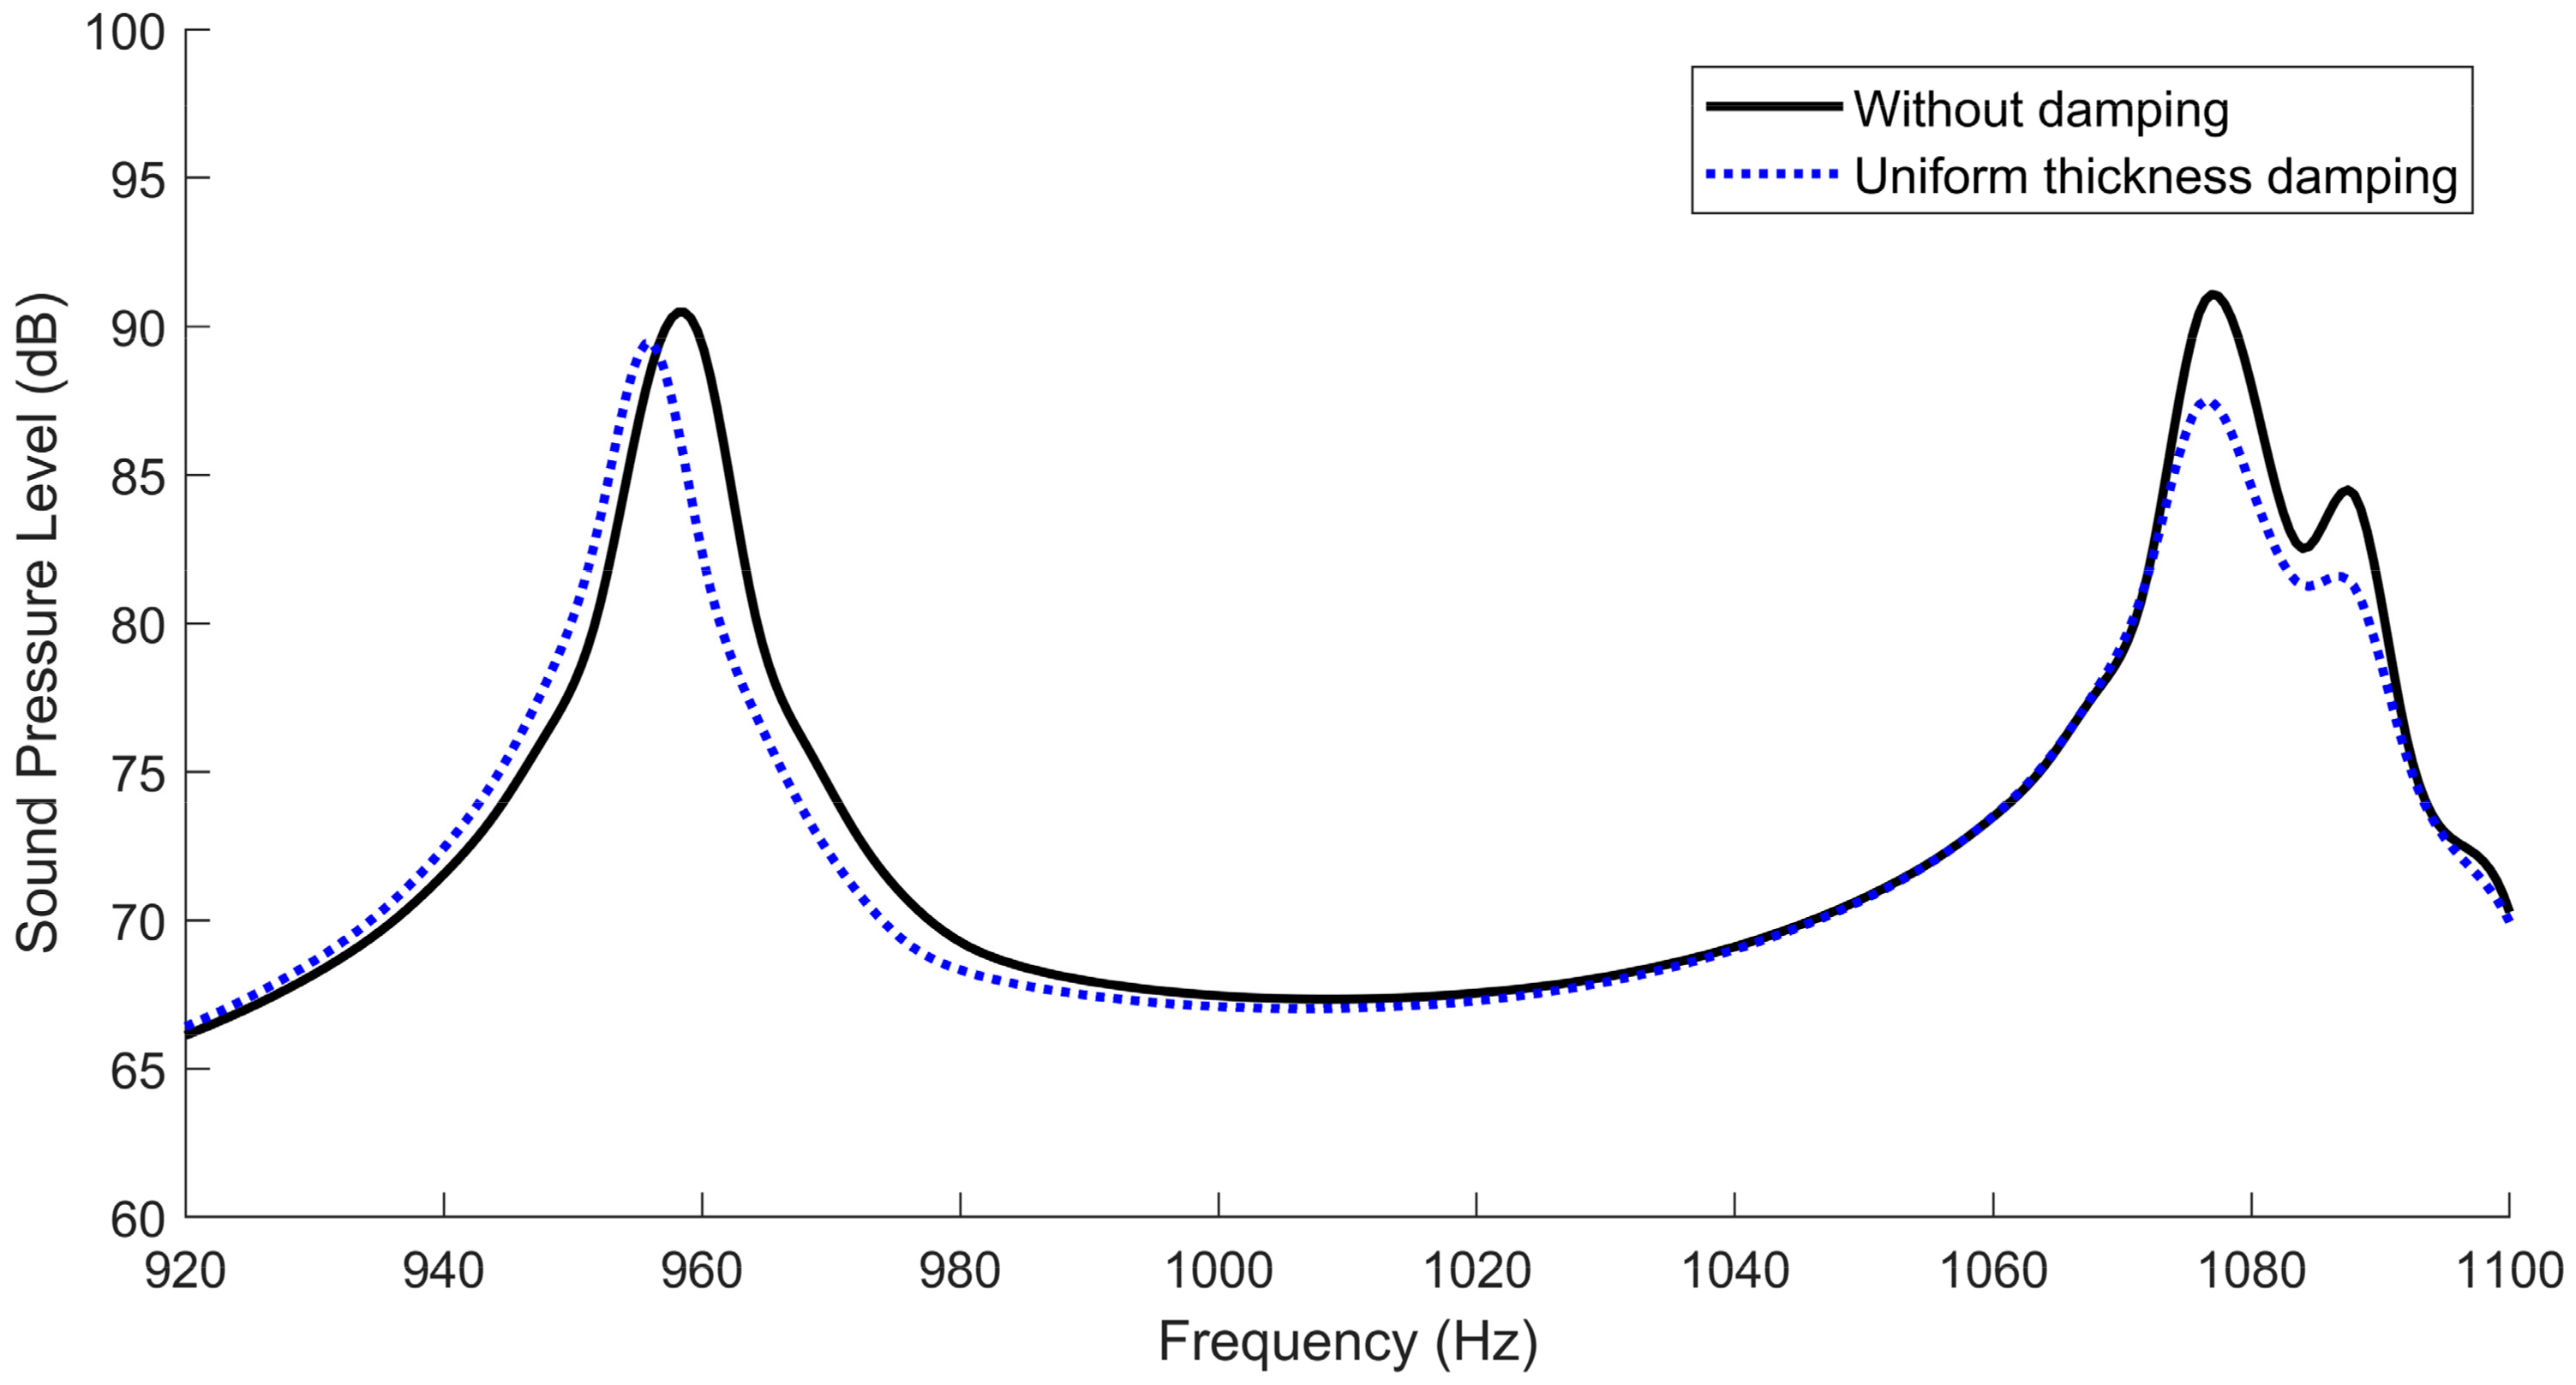
3.3. Sound Radiation of Plate Embedded with ABH Array with Damping Layers

To investigate the sound radiation of the plate embedded with the ABH array with the damping layers, a coupled acoustic-plate system is introduced, as shown in Figure 17, and the averaged sound pressure level of the top surface of the air field is calculated. At the same time, a reference acoustic-plate model embedded with the ABH array but without damping layers is also established and its sound pressure level is also calculated. In this way, the noise attenuation effect can be analyzed. In this paper, sound radiation simulation is carried out in COMSOL. Second-order mesh elements are used for acoustic-structure coupling analysis. The rule of thumb for meshing wave problems is to apply at least five to six second-order mesh elements per local wavelength in order to resolve waves [20,21], so the maximum air element size is set to one-sixth of the wavelength. Besides, the thickness of the air layer is 250 mm and a perfectly matched layer (PML) is used for the boundary treatment to ensure the complete absorption of sound waves at the boundary. The results are shown in Figure 18 ( p r e f = 2 × 10 5 Pa , plate model under BC 1, with uniform thickness damping layers).
Figure 18 shows that, for the first peak value in this frequency band, the sound pressure level of the plate with damping layers at about 956 Hz is below that of the plate without damping layers for approximately 1 dB. In addition, the second and third peak values at about 1075–1088 Hz are below these of the plate without damping layers for about 3–4 dB, which shows a significant noise reduction effect in the range of 920–1100 Hz. At the same time, Figure 15 shows that the plate embedded with the ABH array has a significant vibration energy dissipation effect in the frequency range of 1020 to 1040 Hz. That is, the plate embedded with the ABH array with damping layers designed in this paper can obviously reduce both vibration and noise in that frequency band.

4. Conclusions

In this paper, a plate model embedded with the array of five two-dimensional ABHs are established. Moreover, the energy propagation characteristics arising from ABH are analyzed by using FEM and power flow method. Additionally, the energy focalization effect is studied quantitatively by calculating average vibration power density at different plate sections. Further, the effects of damping materials and different boundary conditions on model energy dissipation are also investigated. Finally, the effects of damping layers on radiated sound power are studied. Conclusions are reached as follows:
(1)
In the low frequency range of 50–180 Hz, plate embedded with the ABH array has a better energy-gathering performance than the plates embedded with a large ABH or a single ABH.
(2)
For the plate embedded with five ABHs in this paper, the power flow density at the ABH central area is much higher than that of other areas. However, under certain excitation force, the energy focalization effect of the plate embedded with the ABH array is related to the positions of ABH pits.
(3)
The average vibration power density ratios at different circular sections in ABH are greater than 1, and the maximum value can reach hundreds when excitation frequency is near the natural frequency of plate, which indicates a significant energy focalization effect. In addition, the energy focalization effect is not obvious when the radius of the circular section is larger than 0.03 m, which provides a reference for using damping layers more effectively.
(4)
For the ABH plate in this paper, damping materials can change the plate energy distribution in the frequency domain and reduce the frequency where ABH starts to work. Results also show that the uniform damping layers have a better energy dissipation effect than varying thickness damping layers.
(5)
The radiated sound power level of the ABH plate with damping layers is reduced by 1–4dB compared with the ABH plate without damping layers.
In this paper, only the characteristics of the plate embedded with the ABH array in a certain excitation frequency band were investigated. However, in fact, the analysis method in this paper can be used in any excitation frequency band. In addition, experimental test to verify the vibration and noise control performance of the plate embedded with the ABH array is ongoing. Future work will explore the optimization of the ABH array for optimal noise and vibration control and weight minimization, including the ABH position, size, and ABH cell parameters.

Author Contributions

Conceptualization, X.L., Y.S. and T.H.; methodology, X.L.; software, H.L.; validation, H.L., Y.B. and J.Y.; formal analysis, H.L.; investigation, H.L.; resources, Y.B.; data curation, H.L.; writing—original draft preparation, H.L.; writing—review and editing, X.L.; visualization, H.L.; supervision, X.L.; project administration, H.L.; funding acquisition, X.L. All authors have read and agreed to the published version of the manuscript.

Funding

This research was funded by the Natural Science Foundation of China, grant number 11972003.

Institutional Review Board Statement

Not applicable.

Informed Consent Statement

Not applicable.

Data Availability Statement

Not applicable.

Acknowledgments

The authors would like to thank the financial support provided by the Natural Science Foundation of China (Grant No. 11972003).

Conflicts of Interest

The authors declare no conflict of interest. The funders had no role in the design of the study; in the collection, analyses, or interpretation of data; in the writing of the manuscript, or in the decision to publish the results.

Appendix A

Figure A1. Power flow transmission graphs at an excitation frequency of 1000 Hz in x–y plane: (a) ABH(i) with BC 1, (b) ABH(ii) with BC 1, (c) ABH(iii) with BC 1, (d) ABH(i) with BC 2, (e) ABH(ii) with BC 2, (f) ABH(iii) with BC.
Applsci 12 01325 g0a1
Figure A2. Power flow transmission graphs at an excitation frequency of 1050 Hz in x–y plane: (a) ABH(i) with BC 1, (b) ABH(ii) with BC 1, (c) ABH(iii) with BC 1, (d) ABH(i) with BC 2, (e) ABH(ii) with BC 2, (f) ABH(iii) with BC 2.
Applsci 12 01325 g0a2
Figure A3. Power flow transmission graphs at an excitation frequency of 1100 Hz in x–y plane: (a) ABH(i) with BC 1, (b) ABH(ii) with BC 1, (c) ABH(iii) with BC 1, (d) ABH(i) with BC 2, (e) ABH(ii) with BC 2, (f) ABH(iii) with BC 2.
Applsci 12 01325 g0a3
Figure A4. Structural intensity contours at an excitation frequency of 1000 Hz: (a) ABH(i) with BC 1, (b) ABH(ii) with BC 1, (c) ABH(iii) with BC 1, (d) ABH(i) with BC 2, (e) ABH(ii) with BC 2, (f) ABH(iii) with BC 2.
Applsci 12 01325 g0a4
Figure A5. Structural intensity contours at an excitation frequency of 1050 Hz: (a) ABH(i) with BC 1, (b) ABH(ii) with BC 1, (c) ABH(iii) with BC 1, (d) ABH(i) with BC 2, (e) ABH(ii) with BC 2, (f) ABH(iii) with BC 2.
Applsci 12 01325 g0a5
Figure A6. Structural intensity contours at an excitation frequency of 1100 Hz: (a) ABH(i) with BC 1, (b) ABH(ii) with BC 1, (c) ABH(iii) with BC 1, (d) ABH(i) with BC 2, (e) ABH(ii) with BC 2, (f) ABH(iii) with BC 2.
Applsci 12 01325 g0a6
Figure A7. Structural intensity contours of ABHs with BC 1 at different frequencies: (a) 1000 Hz, (b) 1050 Hz, (c) 1100 Hz.
Applsci 12 01325 g0a7
Figure A8. Structural intensity contours of ABHs with BC 2 at different frequencies: (a) 1000 Hz, (b) 1050 Hz, (c) 1100 Hz.
Applsci 12 01325 g0a8

References

  1. Pelat, A.; Gautier, F.; Conlon, S.C.; Semperlotti, F. The acoustic black hole: A review of theory and applications. J. Sound Vib. 2020, 476, 115316. [Google Scholar] [CrossRef]
  2. Mironov, M.A. Propagation of a flexural wave in a plate whose thick-ness decreases smoothly to zero in a finite interval. Sov. Phys.-Acoust. 1988, 34, 318–319. [Google Scholar]
  3. Krylov, V.V. New type of vibration dampers utilizing the effect of acoustic ‘black holes’. Acta Acust. United Acust. 2004, 90, 830–837. [Google Scholar]
  4. Krylov, V.V.; Tilman, F.J.B.S. Acoustic ‘black holes’ for flexural waves as effective vibration dampers. J. Sound Vib. 2004, 274, 605–619. [Google Scholar] [CrossRef]
  5. Krylov, V.V.; Winward, R. Experimental investigation of the acoustic black hole effect for flexural waves in tapered plates. J. Sound Vib. 2007, 300, 43–49. [Google Scholar] [CrossRef] [Green Version]
  6. Conlon, S.C.; Fahnline, J.B.; Semperlotti, F. Numerical analysis of the vibroacoustic properties of plates with embedded grids of acoustic black holes. J. Acoust. Soc. Am. 2015, 137, 447–457. [Google Scholar] [CrossRef] [PubMed]
  7. Li, X.; Ding, Q. Sound radiation of a beam with a wedge-shaped edge embedding acoustic black hole feature. J. Sound Vib. 2019, 439, 287–299. [Google Scholar] [CrossRef]
  8. Yan, S.; Lomonosov, A.M.; Shen, Z. Numerical and experimental study of Lamb wave propagation in a two-dimensional acoustic black hole. J. Appl. Phys. 2016, 119, 214902. [Google Scholar] [CrossRef]
  9. Krylov, V.V. Propagation of plate bending waves in the vicinity of one- and two-dimensional acoustic black hole. In Proceedings of the First International ECCOMAS Thematic Conference on Computational Methods in Structural Dynamics and Earthquake Engineering, Rethymno, Greece, 13–15 June 2007. [Google Scholar]
  10. O’Boy, D.J.; Krylov, V.V. Damping of flexural vibrations in circular plates with tapered central holes. J. Sound Vib. 2011, 330, 2220–2236. [Google Scholar] [CrossRef] [Green Version]
  11. O’Boy, D.J.; Krylov, V.V.; Kralovic, V. Damping of flexural vibrations in rectangular plates using the acoustic black hole effect. J. Sound Vib. 2010, 329, 4672–4688. [Google Scholar] [CrossRef] [Green Version]
  12. Huang, W.; Ji, H.; Qiu, J.; Cheng, L. Analysis of ray trajectories of flexural waves propagating over generalized acoustic black hole indentations. J. Sound Vib. 2018, 417, 216–226. [Google Scholar] [CrossRef]
  13. Conlon, S.C.; Fahnline, J.B.; Shepherd, M.R.; Feurtado, P.A. Vibration control using grids of Acoustic Black Holes: How many is enough. In Proceedings of the 44th International Congress and Exposition on Noise Control Engineering, INTER-NOISE 2015, San Francisco, CA, USA, 9–12 August 2015. [Google Scholar]
  14. Conlon, S.C.; Fahnline, J.B.; Semperlotti, F.; Feurtado, P.A. Enhancing the low frequency vibration reduction performance of plates with embedded acoustic black holes. In Proceedings of the 43rd International Congress on Noise Control Engineering, INTER-NOISE 2014, Melbourne, Australia, 16–19 November 2014. [Google Scholar]
  15. Huang, W.; Ji, H.; Qiu, J.; Cheng, L. Wave energy focalization in a plate with imperfect two-dimensional acoustic black hole indentation. ASME J. Vib. Acoust. 2016, 138, 061004. [Google Scholar] [CrossRef]
  16. Prill, O.; Roos, C.; Bush, R. Finite element simulations of acoustic black holes as lightweight damping treatments for automotive body panels with application to full vehicle interior wind noise predictions. In Proceedings of the INTER-NOISE and NOISE-CON Congress and Conference Proceedings, InterNoise16, Hamburg, Germany, 21–24 August 2016. [Google Scholar]
  17. Weisser, T.; Foltête, E.; Bouhaddi, N.; Gonidou, L.O. A power flow mode approach dedicated to structural interface dynamic characterization. J. Sound Vib. 2015, 334, 202–218. [Google Scholar] [CrossRef] [Green Version]
  18. Wu, W.; Yin, X.; Li, H.; Zhong, K. Power flow analysis of built-up plate structures using the dynamic stiffness method. J. Vib. Control 2018, 24, 2815–2831. [Google Scholar] [CrossRef]
  19. Stephen, A.H.; Richard, P.S. Predictions of structural intensity fields using solid finite elements. Noise Control Eng. 1999, 47, 209–217. [Google Scholar]
  20. Wang, X.R.; Liu, X.; Tai, J.; He, T.; Shan, Y. A novel method of reducing the acoustic emission wave reflected by boundary based on acoustic black hole. Ultrasonics 2019, 94, 292–304. [Google Scholar] [CrossRef] [PubMed]
  21. Krylov, V.V. Overview of localised flexural waves in wedges of power-law profile and comments on their relationship with the acoustic black hole effect. J. Sound Vib. 2020, 468, 115100. [Google Scholar] [CrossRef] [Green Version]
Figure 1. Plate with an ideal parabolically tapered edge.
Applsci 12 01325 g001
Figure 2. A typical two-dimensional ABH indentation.
Applsci 12 01325 g002
Figure 3. FE models of the plate embedded with two-dimensional ABHs: (a) a single ABH, (b) ABH array with 5 ABHs, (c) a big ABH.
Applsci 12 01325 g003
Figure 4. Vibration energy comparison among three ABH plate configurations. (a) 5–5000 Hz, (b) 5–1050 Hz.
Applsci 12 01325 g004
Figure 5. Two boundary conditions in this work: (a) BC 1: left and right edges of the plate are fixed, (b) BC 2: all edges of the plate are fixed.
Applsci 12 01325 g005
Figure 6. Top view of the plate with embedded two-dimensional ABH array.
Applsci 12 01325 g006
Figure 7. Average vibration power density ratios at excitation frequencies of 1000 Hz.
Applsci 12 01325 g007
Figure 8. Average vibration power density ratios at excitation frequencies of 1002 Hz.
Applsci 12 01325 g008
Figure 9. Average vibration power density ratios at excitation frequencies of 1050 Hz.
Applsci 12 01325 g009
Figure 10. Average vibration power density ratios at excitation frequencies of 1072 Hz.
Applsci 12 01325 g010
Figure 11. Average vibration power density ratios at excitation frequencies of 1088 Hz.
Applsci 12 01325 g011
Figure 12. Average vibration power density ratios at excitation frequencies of 1100 Hz.
Applsci 12 01325 g012
Figure 13. (a) A symmetrical one-dimensional ABH structure, (b) A two-dimensional ABH indentation with varying thickness damping layers.
Applsci 12 01325 g013
Figure 14. A schematic diagram of the FE model: (a) FE model of plate structure with ABHs and damping layers; (b) A two-dimensional ABH indentation with varying thickness damping layers; (c) A two-dimensional ABH indentation with uniform thickness damping layers.
Applsci 12 01325 g014
Figure 15. The vibration energy difference of ABH plates embedded with different damping configurations and a reference plate with BC 1.
Applsci 12 01325 g015
Figure 16. The vibration energy difference of ABH plates embedded with different damping configurations with BC 2.
Applsci 12 01325 g016
Figure 17. The acoustic-ABH plate coupling model.
Applsci 12 01325 g017
Figure 18. Sound pressure level of plates embedded with ABH array with/without damping layers.
Applsci 12 01325 g018
Table 1. Geometrical parameters of the two-dimensional ABHs in the simulation.
Parameter h 1   [ m ] h 2   [ m ] x 2   [ m ] ε
Small ABH0.00010.0040.06 4.900   ×   10 4
Big ABH0.00010.0040.1342 8.337   ×   10 5
Table 2. Material properties of the plate in the simulation.
Parameter ρ p   [ k g / m 3 ] E p   [ G P a ] ν p η
Value2710750.31350.01
Table 3. Parameters of the damping layer.
Parameter ρ p [ k g / m 3 ] E p [ G P a ] ν Loss Factor
Value9505.00.30.3
Publisher’s Note: MDPI stays neutral with regard to jurisdictional claims in published maps and institutional affiliations.

