Article

Two-Channel Information Fusion Weak Signal Detection Based on Correntropy Method †

1
College of Energy and Power Engineering, Nanjing University of Aeronautics and Astronautics, Nanjing 210016, China
2
Sichuan Gas Turbine Research Institute of AECC, Chengdu 610599, China
*
Author to whom correspondence should be addressed.
Part of the content of the article has been published at “The 12th IEEE Global Reliability & Prognostics and Health Management Conference (IEEE PHM Nanjing 2021)”, and this article has been expanded based on the conference paper: Gong, S.; Lu, J.; Li, S.; Ma, H.; Yan-Feng, W.; Guang-Rong, T. The Correntropy Induced Metric and Cyclic Correntropy Spec-trum Method Combined with Singular Value Decomposition for Weak Signal Detection. In Proceedings of the IEEE Global Reliability & Prognostics and Health Management Conference, Nanjing, China, 15–17 October 2021. The main changes are: 1. Added the work of simulation and verification of the ability of cyclic correntropy spectrum; 2. conference papers have performed weak signal detection on a single-channel signal, this article supplements this method on two-channel signals and compares it with the single-channel method.
Appl. Sci. 2022, 12(3), 1414; https://doi.org/10.3390/app12031414
Submission received: 28 November 2021 / Revised: 20 January 2022 / Accepted: 20 January 2022 / Published: 28 January 2022
(This article belongs to the Special Issue Advancing Reliability & Prognostics and Health Management)

Abstract

:

Featured Application

The method proposed in the article can be used for weak signal detection and weak fault feature extraction. It is mainly a method proposed to select suitable singular components for singular value decomposition. After that, the cyclic correntropy spectrum is used to replace the demodulation effect of the envelope spectrum.

Abstract

In recent years, as a simple and effective method of noise reduction, singular value decomposition (SVD) has been widely concerned and applied. The idea of SVD for denoising is mainly to remove singular components (SCs) with small singular value (SV), which ignores the weak signals buried in strong noise. Aiming to extract the weak signals in strong noise, this paper proposed a method of selecting SCs by the correntropy-induced metric (CIM). Then, the frequency components of characteristic signals can be found through cyclic correntropy spectrum (CCES) which is the extension of the correntropy (CE). The proposed method firstly merges the signals collected by the two channels, secondly uses the principal components analysis (PCA) method to reduce the dimensionality, thirdly uses the singular value decomposition method to decompose the signal, fourthly calculates the CIM value to determine the selected singular components for construction, and finally uses the cyclic correntropy spectrum displaying the characteristics of the reconstructed signal. The experimental results show that the proposed method has a good effect on feature extraction.

1. Introduction

Singular value decomposition (SVD) is a simple and effective method for denoising [1]. A large number of scholars have studied this method in feature extraction [2]. Eduardo Rodriguez et al. [3] proposed a method to quantify the complexity of the power signal with the idea of assessing the signal complexity in terms of the entropy computed from the singular value distribution. Zhao Xuezhi et al. conducted an in-depth study on the decomposition results and noise effects of SVD [4]. Additionally, this team proposed to use the difference spectrum to select the effective singular components (SCs). Inspired by previous research on SVD, Zhao Ming and Jia Xiaodong [5] proposed a novel strategy for signal denoising using reweighted SVD. The traditional SVD denoising method based on energy is not suitable for weak faults detection [6], so it is necessary to find other methods for selecting singular value (SV), such as information-based methods [7].
Due to the urgent need for feature extraction of weak signals, many scholars have begun to shift focus from signal energy to signal information, such as introducing entropy theory into signal processing. Li Yongbo and his team [8] proposed divergence entropy based on the finding that the existing entropy method lacks systematic consistency, and then applying it to fault diagnosis, the classification accuracy of which is higher than other entropy methods. Additionally, for multi-channel features extraction, they proposed the variational embedding multiscale diversity entropy [9].
The concept of correntropy (CE) was proposed by Principe et al. [10] based on the information theoretic learning (ITL) and kernel method [11]. Subsequently, the team and many scholars [12] in the field of statistical signal processing systematically studied the mathematical, physical meaning, properties, and application of CE, and constructed the theoretical framework of CE signal processing [13]. A new cyclostationary analysis technology named cyclic correntropy (CCE) analysis has emerged to suppress impulsive noise. CCE is a kernel-based similarity measure of cyclostationary modeling signals [14]. Qiu [15] researched a large number of signal processing methods based on the second-order stationary characteristics of the signal and proposed a time delay estimation (TDE) based on CE and CCE [16] which has a good ability to suppress non-Gaussian impulse noise. Zhao and Qin [17] applied the CE and CCE on rolling element bearing fault diagnosis under impulsive noise environment and compared the cyclic correntropy spectrum (CCES) with the spectral kurtosis (SK) -based fast kurtogram to highlight the superiority of the CCES. This is the first case where the CCES method was introduced to fault diagnosis.
To make full use of the information in all channels, a feature extraction method capable of multi-source information fusion is essential. The multivariate embedding theory proposed by Zografos uses the same embedding dimension to construct a phase space for each channel and then splices the phase spaces of different channels to construct a multivariate phase space [18]. Additionally, PCA was first introduced by Pearson in 1901 and later developed by Hotelling [19] in 1933. PCA is a multivariate statistical method that converts multiple variables into a few principal components (i.e., comprehensive variables) through dimensionality reduction techniques. These principal components can reflect most of the information of the original variables and are expressed as the linearity of the original variables. To make sure the information contained in these principal components do not overlap each other, it is required that the principal components are not related to each other. PCA has a wide range of applications in many fields. Generally, when the research question involves multiple variables and the correlation between the variables are obvious, that is, when the information contained overlaps, the method of principal component analysis can be considered. This makes it easier to grasp the main contradiction of things and simplify the problem.

2. Fundamental Theory

2.1. Principal Components Analysis for Multi-Channel Information Fusion

Based on the phase space embedding theory proposed by Takens [20], the time series is constructed as a series of spatial trajectories. Use the same embedding dimension to construct a phase space for each channel, and then join the phase spaces of different channels to construct a multivariate phase space. Compared with single-channel analysis, the phase space constructed by multiple embedding theory can provide more comprehensive fault information for fault identification.
PCA is a statistical method of reducing the dimensions of high-dimensional variables into a few principal components. These few principal components can represent most of the information of the original data, which can usually be expressed as linear combinations, each principal component is independent of each other to avoid overlapping information. PCA is one of the important dimensionality reduction methods, which is widely used in signal processing and data visualization. PCA can be briefly summarized as the following steps:
  • Form the original data into an n-by-m data Hankel matrix X;
  • Each row of matrix X is subtracted from its corresponding mean value, that is, zero mean value;
  • Calculate the covariance matrix C = 1 m X X T ;
  • Calculate the eigenvalues and corresponding eigenvectors of the covariance matrix;
  • Arrange the eigenvectors into a matrix according to the size of the corresponding eigenvalues from large to small, and take the first k (determined by the cumulative contribution rate of the principal components) columns to form a matrix P;
  • Y = P T X is the principal component matrix of the original data X after dimensionality reduction.
After PCA, calculate the cumulative contribution rate of the principal components. The cumulative contribution rate is calculated by dividing the corresponding first k eigenvalues matrix by the sum of all eigenvalues of the covariance. When it reaches more than 95% according to the confidence level in probability statistics (90%, 99%, etc., can be selected according to actual needs), the selected principal components can be considered effective.

2.2. Theory of Singular Value Decomposition

First, reshape the measured signal into a matrix as preparation for SVD. For a measured signal x = [ x ( 1 ) ,   x ( 2 ) ,   ,   x ( N ) ] , form it as a Hankel matrix [21].
Second, decompose and reconstruct the signal expressed as (1):
A = [ x ( 1 ) x ( 2 ) x ( n ) x ( 2 ) x ( 3 ) x ( n + 1 ) x ( m ) x ( m + 1 ) x ( N ) ] = U Σ V τ = [ u 1 , u 2 , , u m ] [ σ 1 0 0 0 0 σ 2 0 0 0 0 0 0 0 σ m 0 ] [ v 1 τ v 2 τ v n τ ]
where m = N n + 1 . The parameter m is used to determine the number of decomposed components in SVD.
The sub-matrix is
A i = σ u i v i T
Reconstruct the signal x i = [ R i , 1 , C i , n τ ] ;   R i , 1 R 1 × n ,   C i , n R ( m 1 ) × 1 , which is achieved by extracting the first row and last column of A i . Considering that matrix A becomes a non-Hankel matrix after SVD, it is decided to obtain each element of x i by averaging along the anti-diagonals of A i .
Third, the traditional SVD denoising approach assumed that the core signal pattern is embedded in the SCs with large SV. Recent studies mostly focus on how to select a proper threshold k and then denoise the raw signal by retaining the SCs with the first k largest SV. The reconstructed signal is expressed as (3):
A ^ = [ u 1 , u 2 , , u m ] [ σ 1 0 0 0 0 σ 2 0 0 0 0 σ k 0 0 0 0 0 ] [ v 1 τ v 2 τ v n τ ] = i = 1 k σ i u i v i = i = 1 k A i x ^ = i = 1 k x i

2.3. Definition of Correntropy

The CE between any two random variables X and Y is defined as
V σ ( X , Y ) = E [ k σ ( X Y ) ]
where E [ ] represents expectation.
For limited length data { ( x i , y i ) } i = 1 N , the CE can be rewritten as (5):
V ^ N , σ ( X , Y ) = 1 N i = 1 N k σ ( x i y i )
where k σ ( x i y i ) is a kernel function, and σ is the size of the kernel. Gaussian kernel [22] is the most commonly used expressed as (6):
k σ ( x x i ) = 1 2 π σ exp ( x x i 2 2 σ 2 )
where · 2 means L2 norm.

3. Presentation of the Proposed Method

Select the effective SCs that are similar to the original signal. It is proposed to use a correntropy induced metric (CIM) to express the similarity between SCs and the original signal.
For variables X and Y , define CIM as (7):
CIM ( X , Y ) = [ k σ ( 0 ) V ( X , Y ) ] 1 / 2
When the two variables are close together, the CIM behaves like an L2 norm, which is called the Euclidean zone; outside the Euclidean zone, the CIM behaves like an L1 norm, which is called the transition zone; as the two points move further away, the behavior of CIM is similar to the L0 norm, and this area is called the correction area [23]. Figure 1 gives the contour of CIM ( X , 0 ) and CIM ( Y , 0 ) in 2-D, which means the distance from variables X and Y to the origin.
Use CCES to identify the fault characteristics from the reconstructed signal. Let us define V x ( t , τ ) as the correntropy function for a stochastic process x ( t ) with a hidden periodicities and for which the time shift is τ . Then the CE function can be defined as V x ( t , τ ) = V σ ( X ( t ) , X ( t + τ ) ) = E [ k σ ( X ( t ) X ( t + τ ) ) ] . Based on the autocorrelation function, V x ( t , τ ) for the cyclostationary process of the first and second by Fourier series can be represented as (8):
V x ( t + T 0 , τ ) = V x ( t , τ ) = α V x α ( τ ) e j 2 π α t
where t is the time of the sequences, T0 is one of the periods of CE, α = n / T ,   n Z is taken as the cyclic frequency, T is the period of CE.
Therefore, the CCE function for x(t) is defined as Fourier coefficients V x α , see (9):
V x α = 1 T 0 T 0 / 2 T 0 / 2 V x ( t , τ ) e 2 j π α t d t = lim T 1 T T / 2 T / 2 k σ ( x ( t ) x ( t + τ ) ) e j 2 π α t d t
Define CCES as a Fourier transform of CCE see (10):
S x α ( f ) = + V x α ( τ ) e 2 j π f τ d τ
The specific steps of the method two-SVD-CIM are as follows, Figure 2 shows the flowchart of the SVD-CIM for two-channel information fusion.
Step 1. Reshape the single-channel signal into Hankel matrix of m-by- ( N m + 1 ) . N is the length of the signal.
Step 2. Join the two matrices of two channels into one matrix of m-by- ( 2 ( N m + 1 ) ) ;
Step 3. PCA for m-by- ( 2 ( N m + 1 ) ) matrix;
Step 4. Calculate the cumulative contribution rate of the first ( N m + 1 ) principal components, if the rate is larger than 95%, reconstruct the signal with these principal components.
Step 5. SVD for the matrix of principal components.
Step 6. Calculate CIM between SCs and the original signal, pick out the SCs with smaller values of CIM, and reconstruct the denoised signal with these SCs.
Step 7. Estimate CCES of the denoising signal to identify weak signal characteristics.

4. Simulation for Correntropy Induced Metrics and Cyclic Correntropy Spectrum

4.1. The Effect of Correntropy Induced Metrics

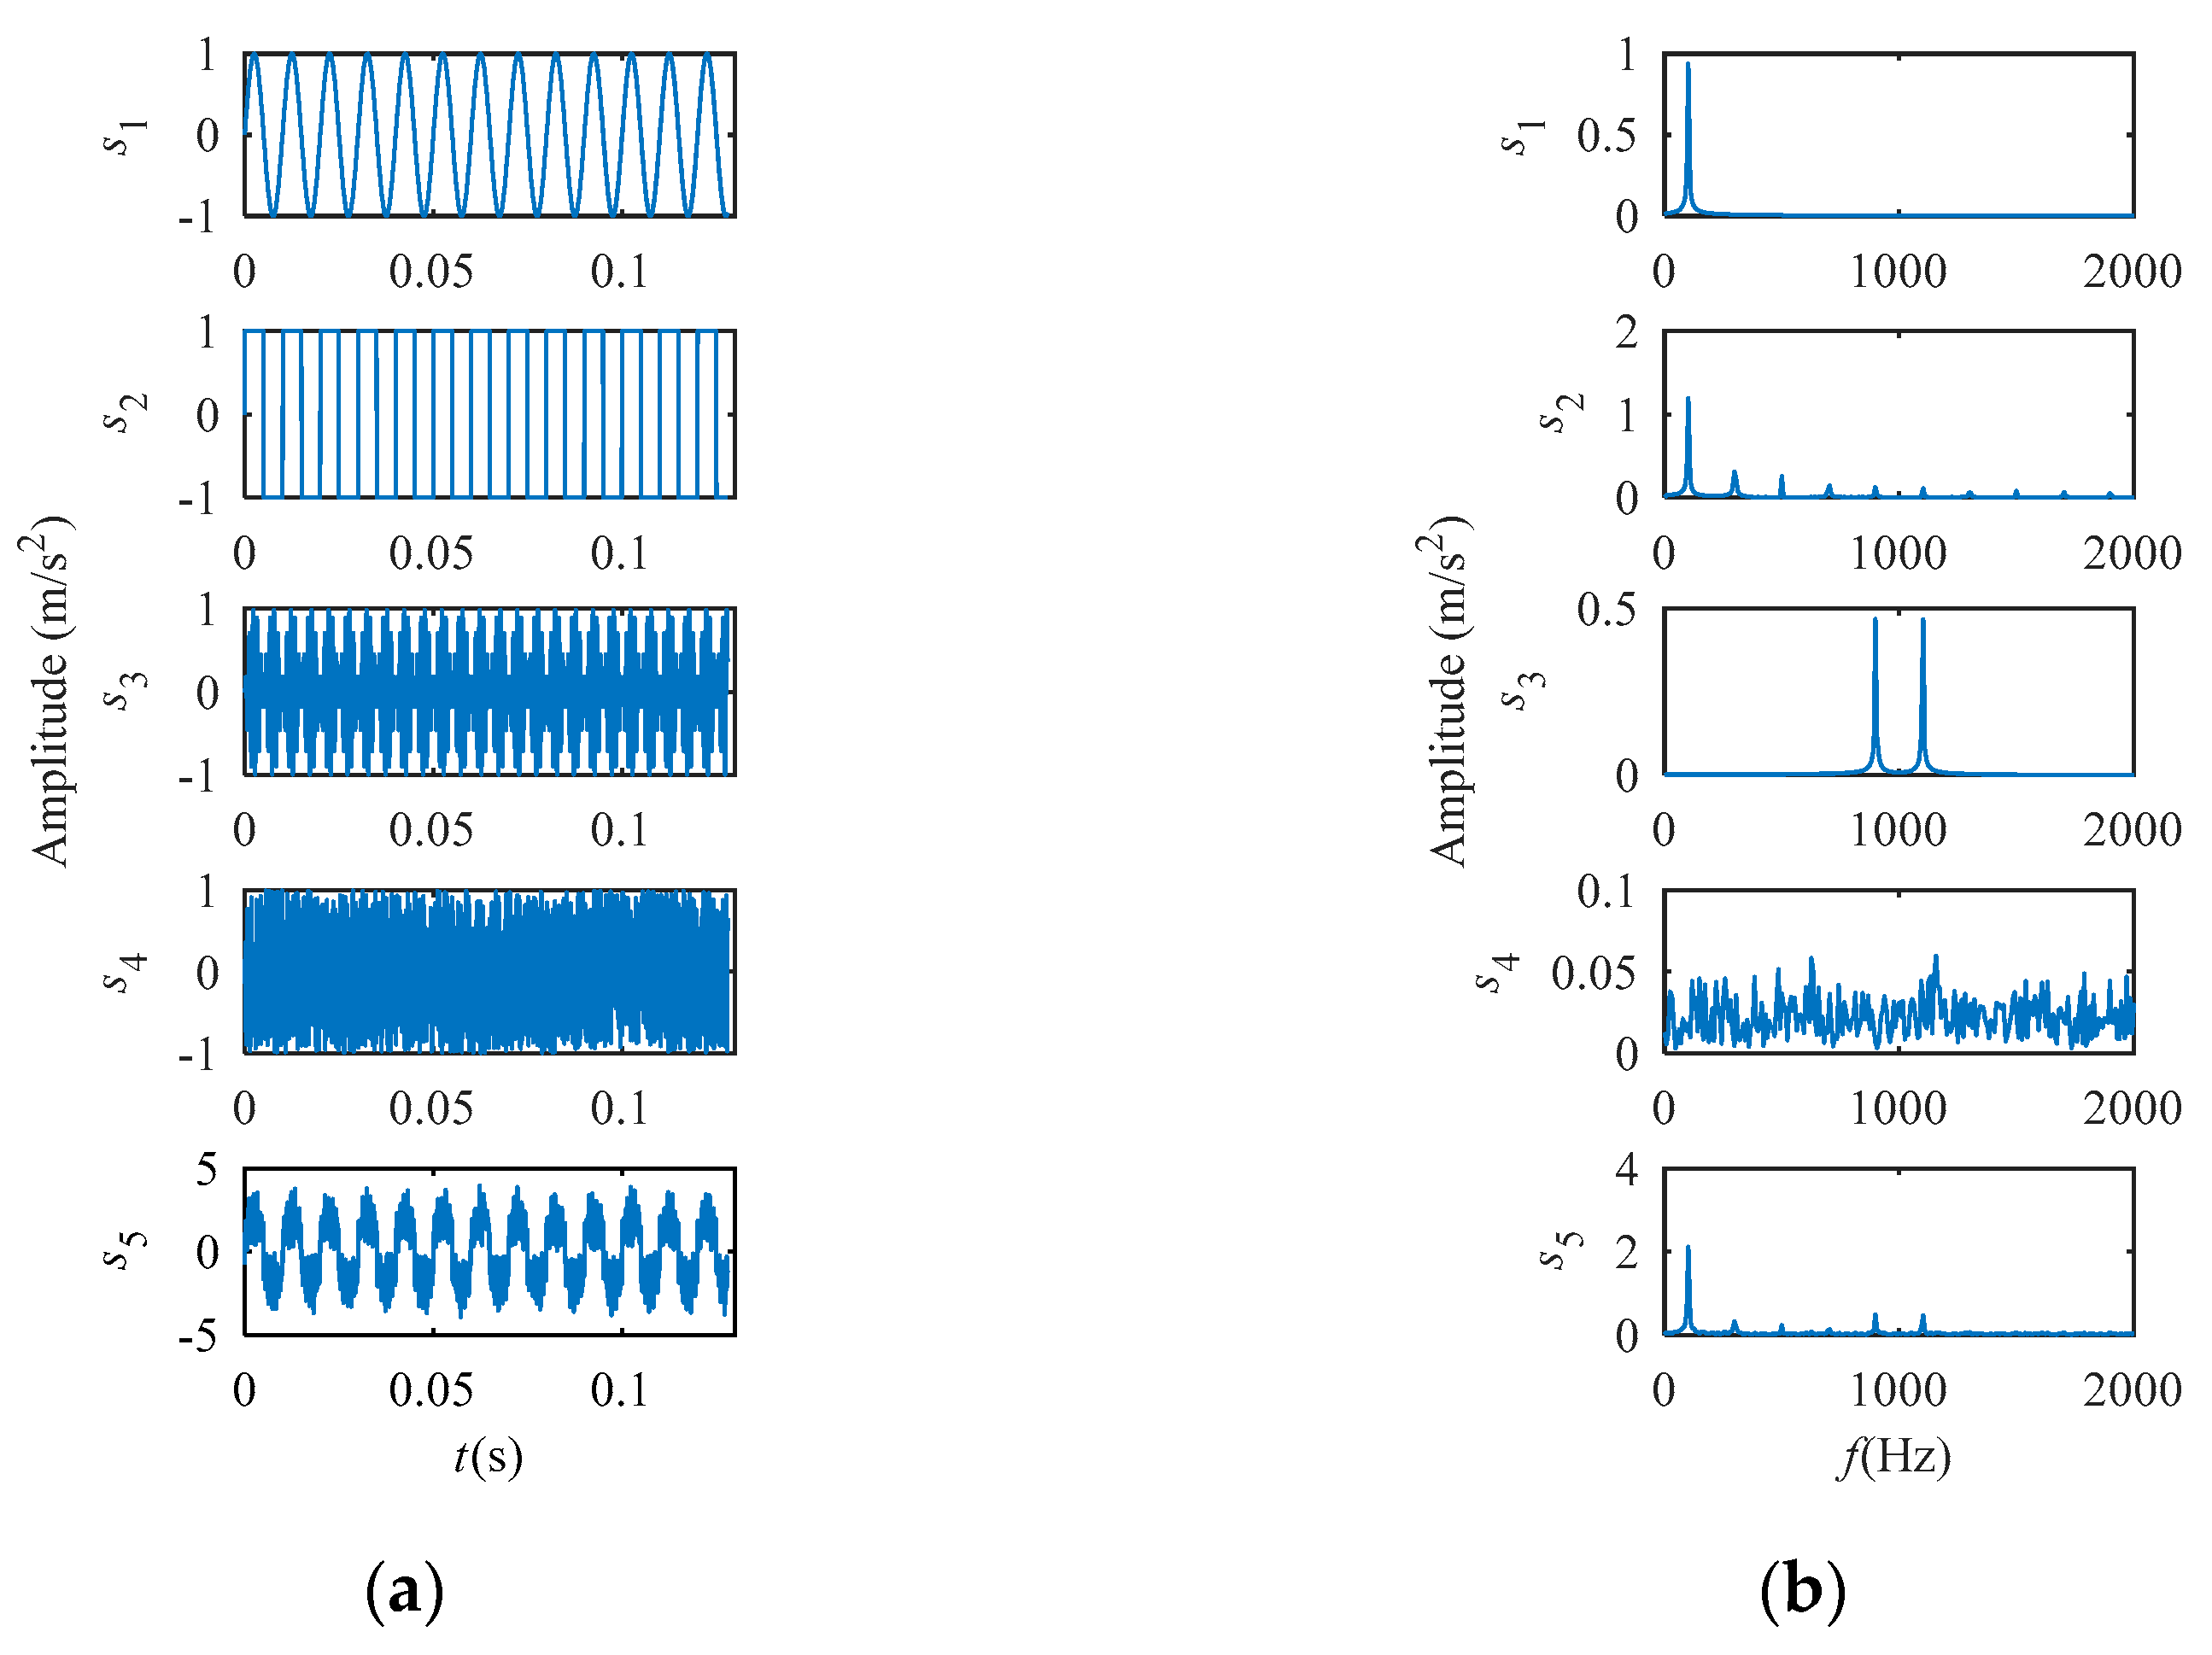
A simulation was made to illustrate the capabilities of CIM. Five simulation signals s1, s2, s3, s4, and s5 are generated. s1 is a sine signal, s2 is a square wave signal, s3 is an amplitude modulated signal, s4 is random noise, where, s1, s2, and s3 are expressed as (11)–(13), s4 consists of random numbers from −1 to 1. s5 is the mix of s1, s2, s3, and s4, expressed in (14). The sampling frequency is 16 kHz, and the number of sampling points is 2048.
s 1 = sin ( 200 × π × t )
s 2 = sign ( 700 × sin ( 200 × π × t ) )
s 3 = sin ( 200 × π × t ) × sin ( 2000 × π × t )
s 5 = s 1 + s 2 + s 3 + s 4
The waveform and frequency spectrum of the five signals are shown in Figure 3.
Calculate the CIM between the first four signals and s5, respectively. From (7), it can be conducted that when X = Y , CIM = 0; CIM > 0, for other cases. Additionally, the greater the difference between the variables X and Y , the greater the CIM value. Set X in (6) to s5, set Y in (7) to s1, s2, s3, s4, respectively. Then four CIM values are displayed in Figure 4, it can be seen that the CIM between s2 and s5 is the smallest which can be explained by the frequency spectrum (Figure 3b).
The frequency spectrum of s2 contains the most frequency components of s5, so for a method based on frequency component analysis, it is appropriate to choose s2 with the lowest CIM to represent s5. Moreover, the largest value of CIM is produced by s4 and s5, where s4 is the random noise, which also shows that CIM-based selection can effectively reduce noise interference.

4.2. The Role of Cyclic Correntropy Spectrum

Use the amplitude-modulated signal to validate the role of the CCES, the simulation signal is expressed as (15), the sampling frequency is 16 kHz, and the sample points is 4096. The time-domain waveform is displayed in Figure 5a, where the obvious amplitude modulation phenomenon can be seen. Additionally, through the frequency spectrogram in Figure 5b, we can see the carrier frequency of 1000 Hz, and the modulation signal frequency shown by its sidebands is about 100 Hz.
s = ( 5 + sin ( 200 × π × t ) ) × sin ( 2000 × π × t )
To compare the envelope spectrum generated by the Hilbert transform and the CCES used in this work, the Hilbert envelope spectrum and CCES are, respectively, used for the above-mentioned simulated amplitude modulation signal. Figure 6 gives the outcome of the two methods.
Figure 6a is the envelope spectrum generated by the Hilbert transform, which only displays the frequency of the modulated signal 100 Hz. This shows that the envelope spectrum is effective in extracting the characteristic frequency of the modulated signal. However, the CCES in Figure 6b displays the frequency of the modulated signal 100 Hz and the carrier frequency 1000 Hz. In addition, CCES also shows the sidebands near the carrier frequency, which can also express the frequency of the modulated signal. This means that CCES not only has the ability of the Hilbert envelope spectrum to demodulate and display the frequency of the modulated signal, but its spectrum also contains more information related to the signal itself than the Hilbert envelope spectrum.
Because CCES is a cyclic spectrum, we can also find the double second harmonic frequency of the modulated signal frequency 199.2 Hz in Figure 6b. In addition, CCES also expresses the carrier frequency of 1000 Hz, which is also a characteristic of the signal we are analyzing. Additionally, the 2000 Hz and 3000 Hz are the second and third harmonic frequency of the carrier frequency. Both the carrier frequency and the modulating wave frequency are the characteristics of the signal. Due to our different application backgrounds, the target frequency is different, but the Hilbert envelope spectrum only expresses the modulating wave frequency. Our CCES not only expresses the frequency of the modulation wave alone, but also expresses the carrier frequency alone, and due to the characteristics of its cyclic spectrum, it distinguishes the two frequency components well: 100 Hz and 200 Hz express the frequency components of the modulation signal; 1000 Hz, 2000 Hz, and 3000 Hz express the frequency components of the carrier signal.

5. Validation of the Proposed Method on Weak Signal Detection

5.1. Weak Electrical Signal Detection

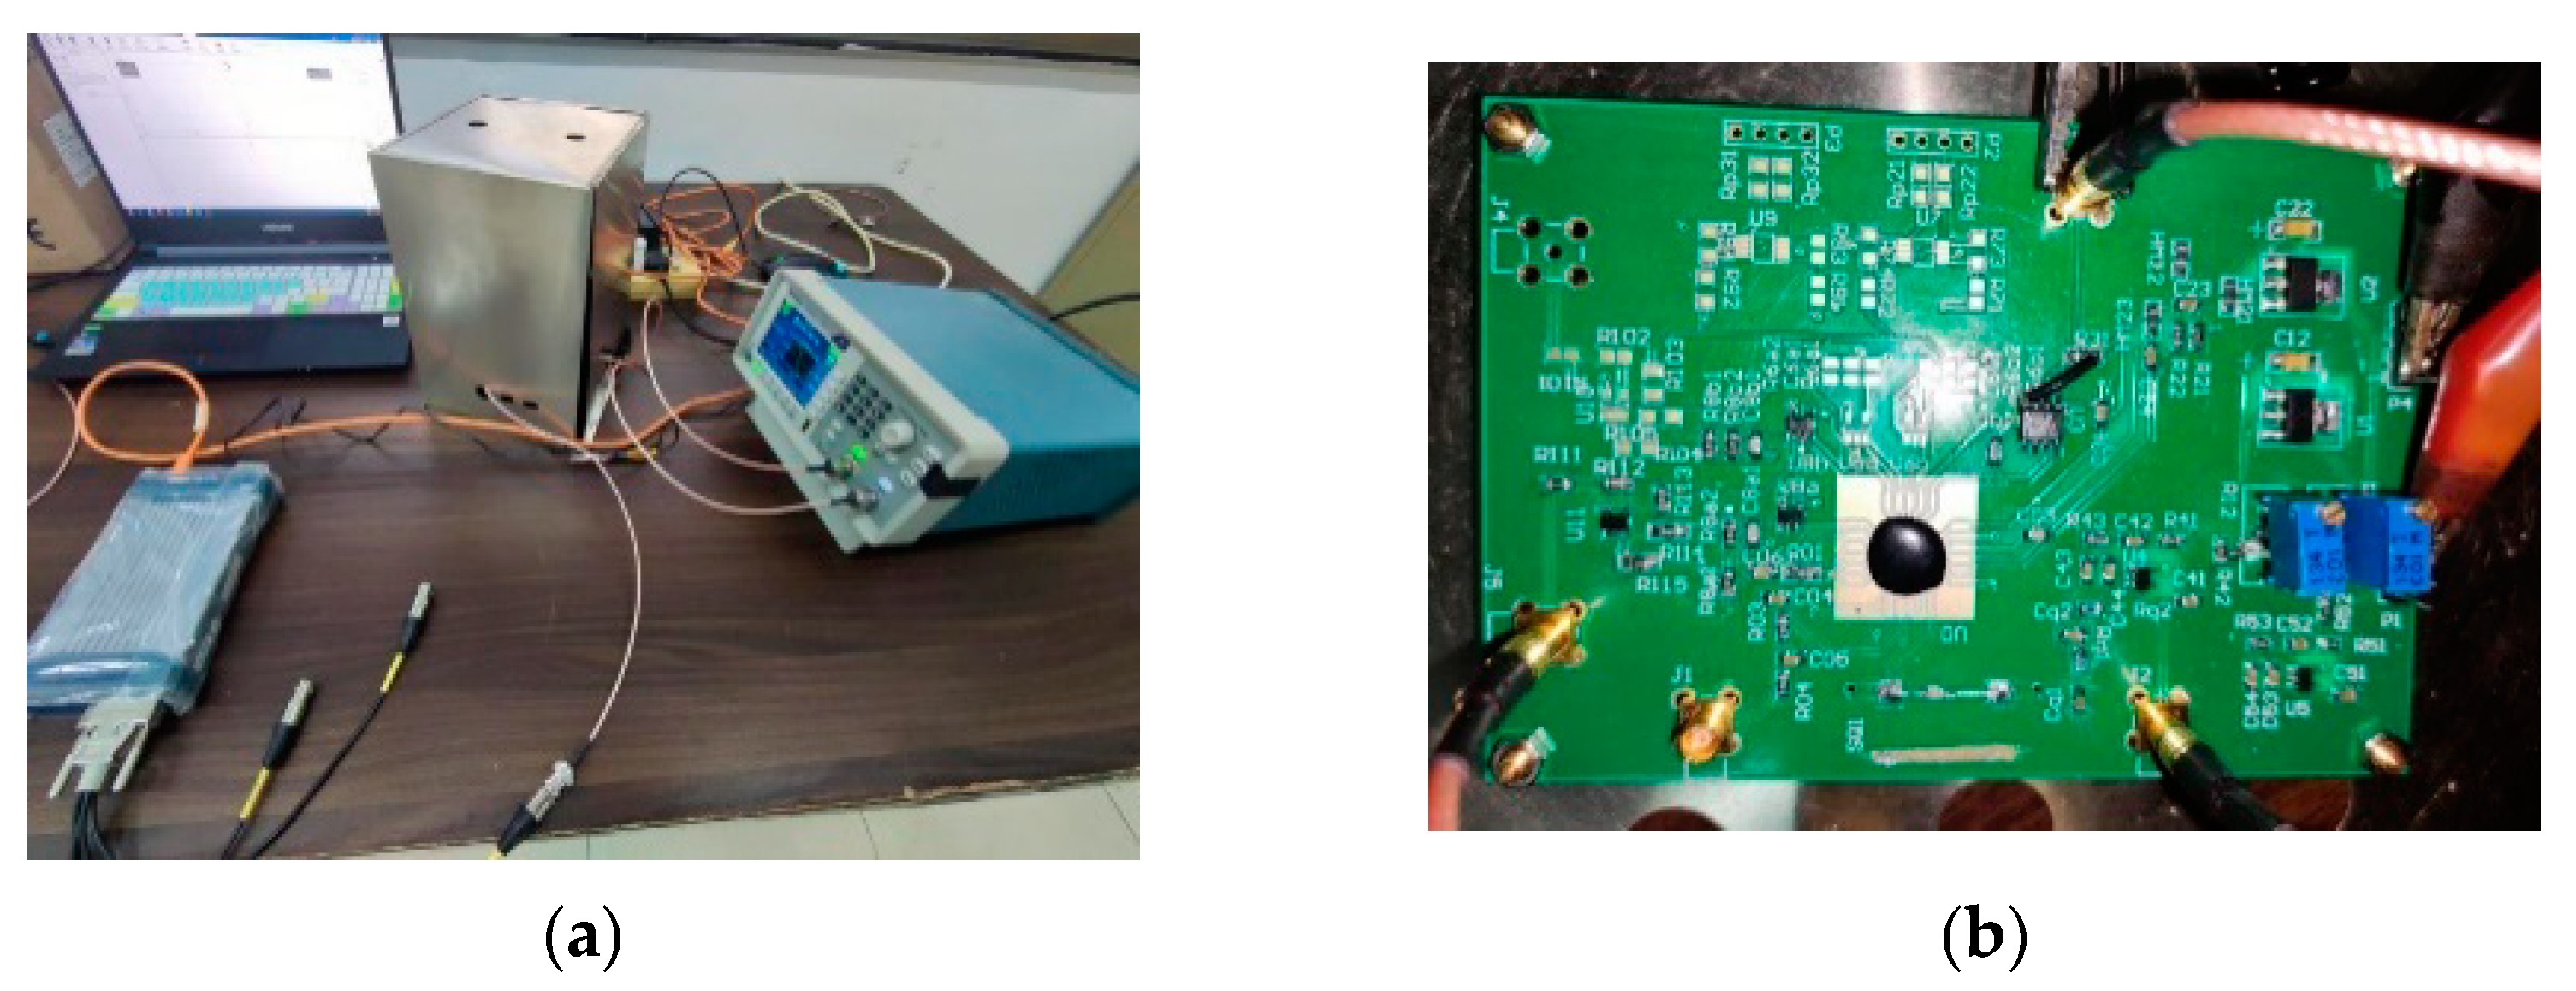
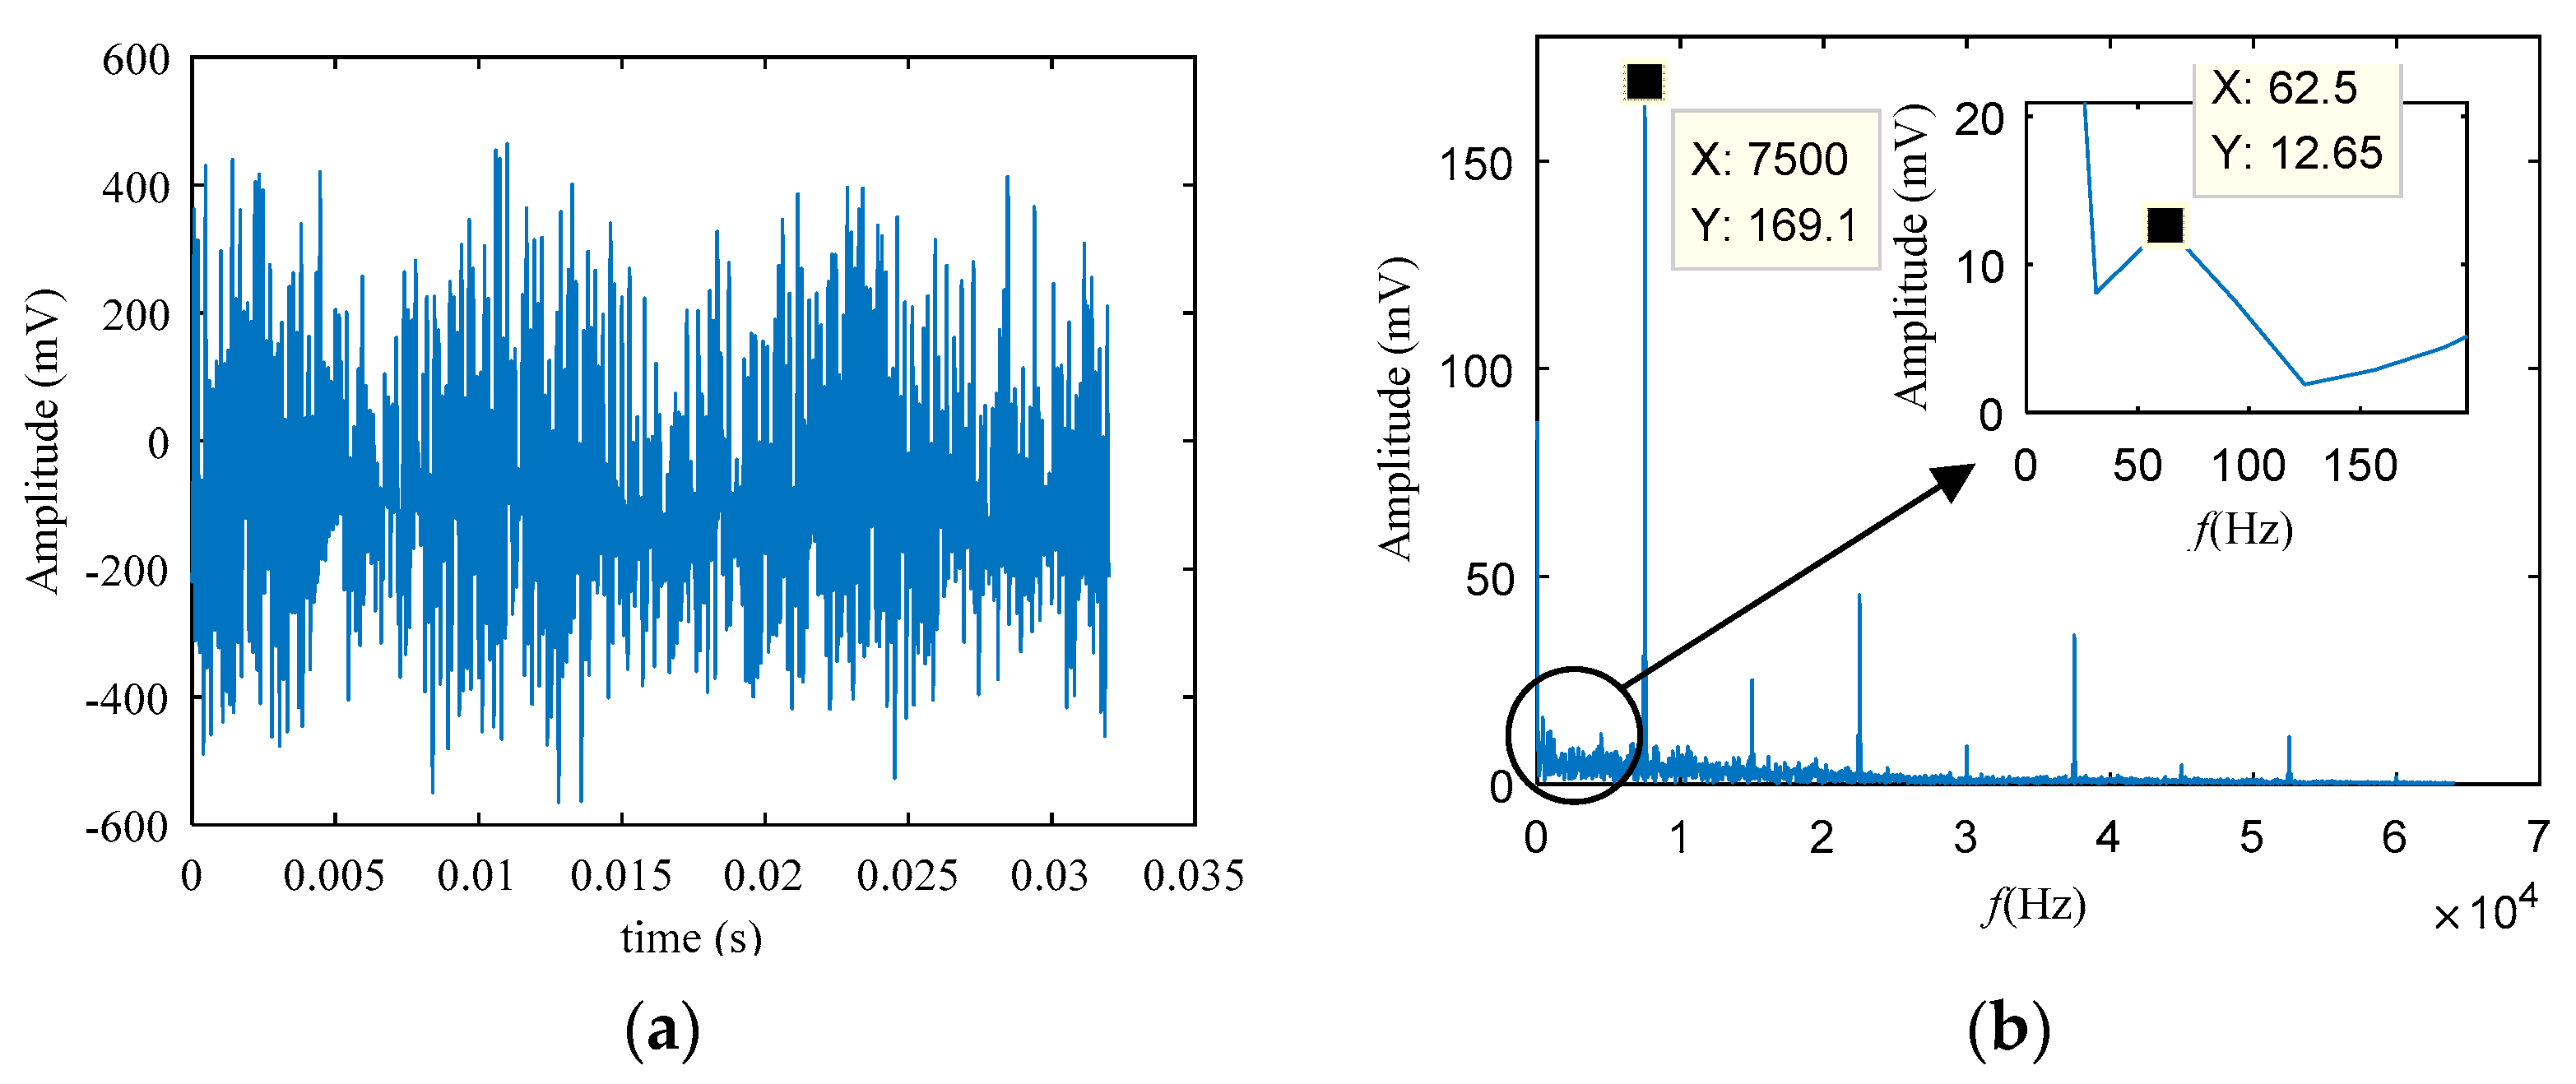
To verify the generality of the method SVD-CIM, the weak electrical signal provided by the research group is used for detection and verification, the weak sinusoidal signal is modulated and output. The test system is used to convert it into a digital signal for analysis. Figure 7 is the test system which consists of a signal generator (generate a sine wave), a weak signal amplification analog circuit board (amplify the signal by modulating), a signal acquisition instrument whose type is DH5908N from Donghua (The highest sampling frequency is 128 kHz for each channel, the minimum resolution of the voltage is 5 μV, and powered by a battery.), a shielding box, and a PC. The sampling frequency is 128 kHz, and the number of sampling points is 1,274,860, the target signal’s frequency is 93 Hz. This article uses 4096 points of the signal for verification. Figure 8 is the waveform of the modulated signal. The sine waveform cannot be seen in Figure 8. After the Fast Fourier transformation in Figure 8b, the first two highest amplitudes in the spectrum are 7500 Hz and 15,000 Hz. These high-frequency components have no relationship with the target signal of 93 Hz, it might be related to the means of pre-processing the signal, and 7500 Hz may be related to the carrier frequency. Amplifying the low-frequency band of the spectrum, only a frequency with a peak value of 62.5 Hz is found, so the spectrum cannot be directly used for analysis.
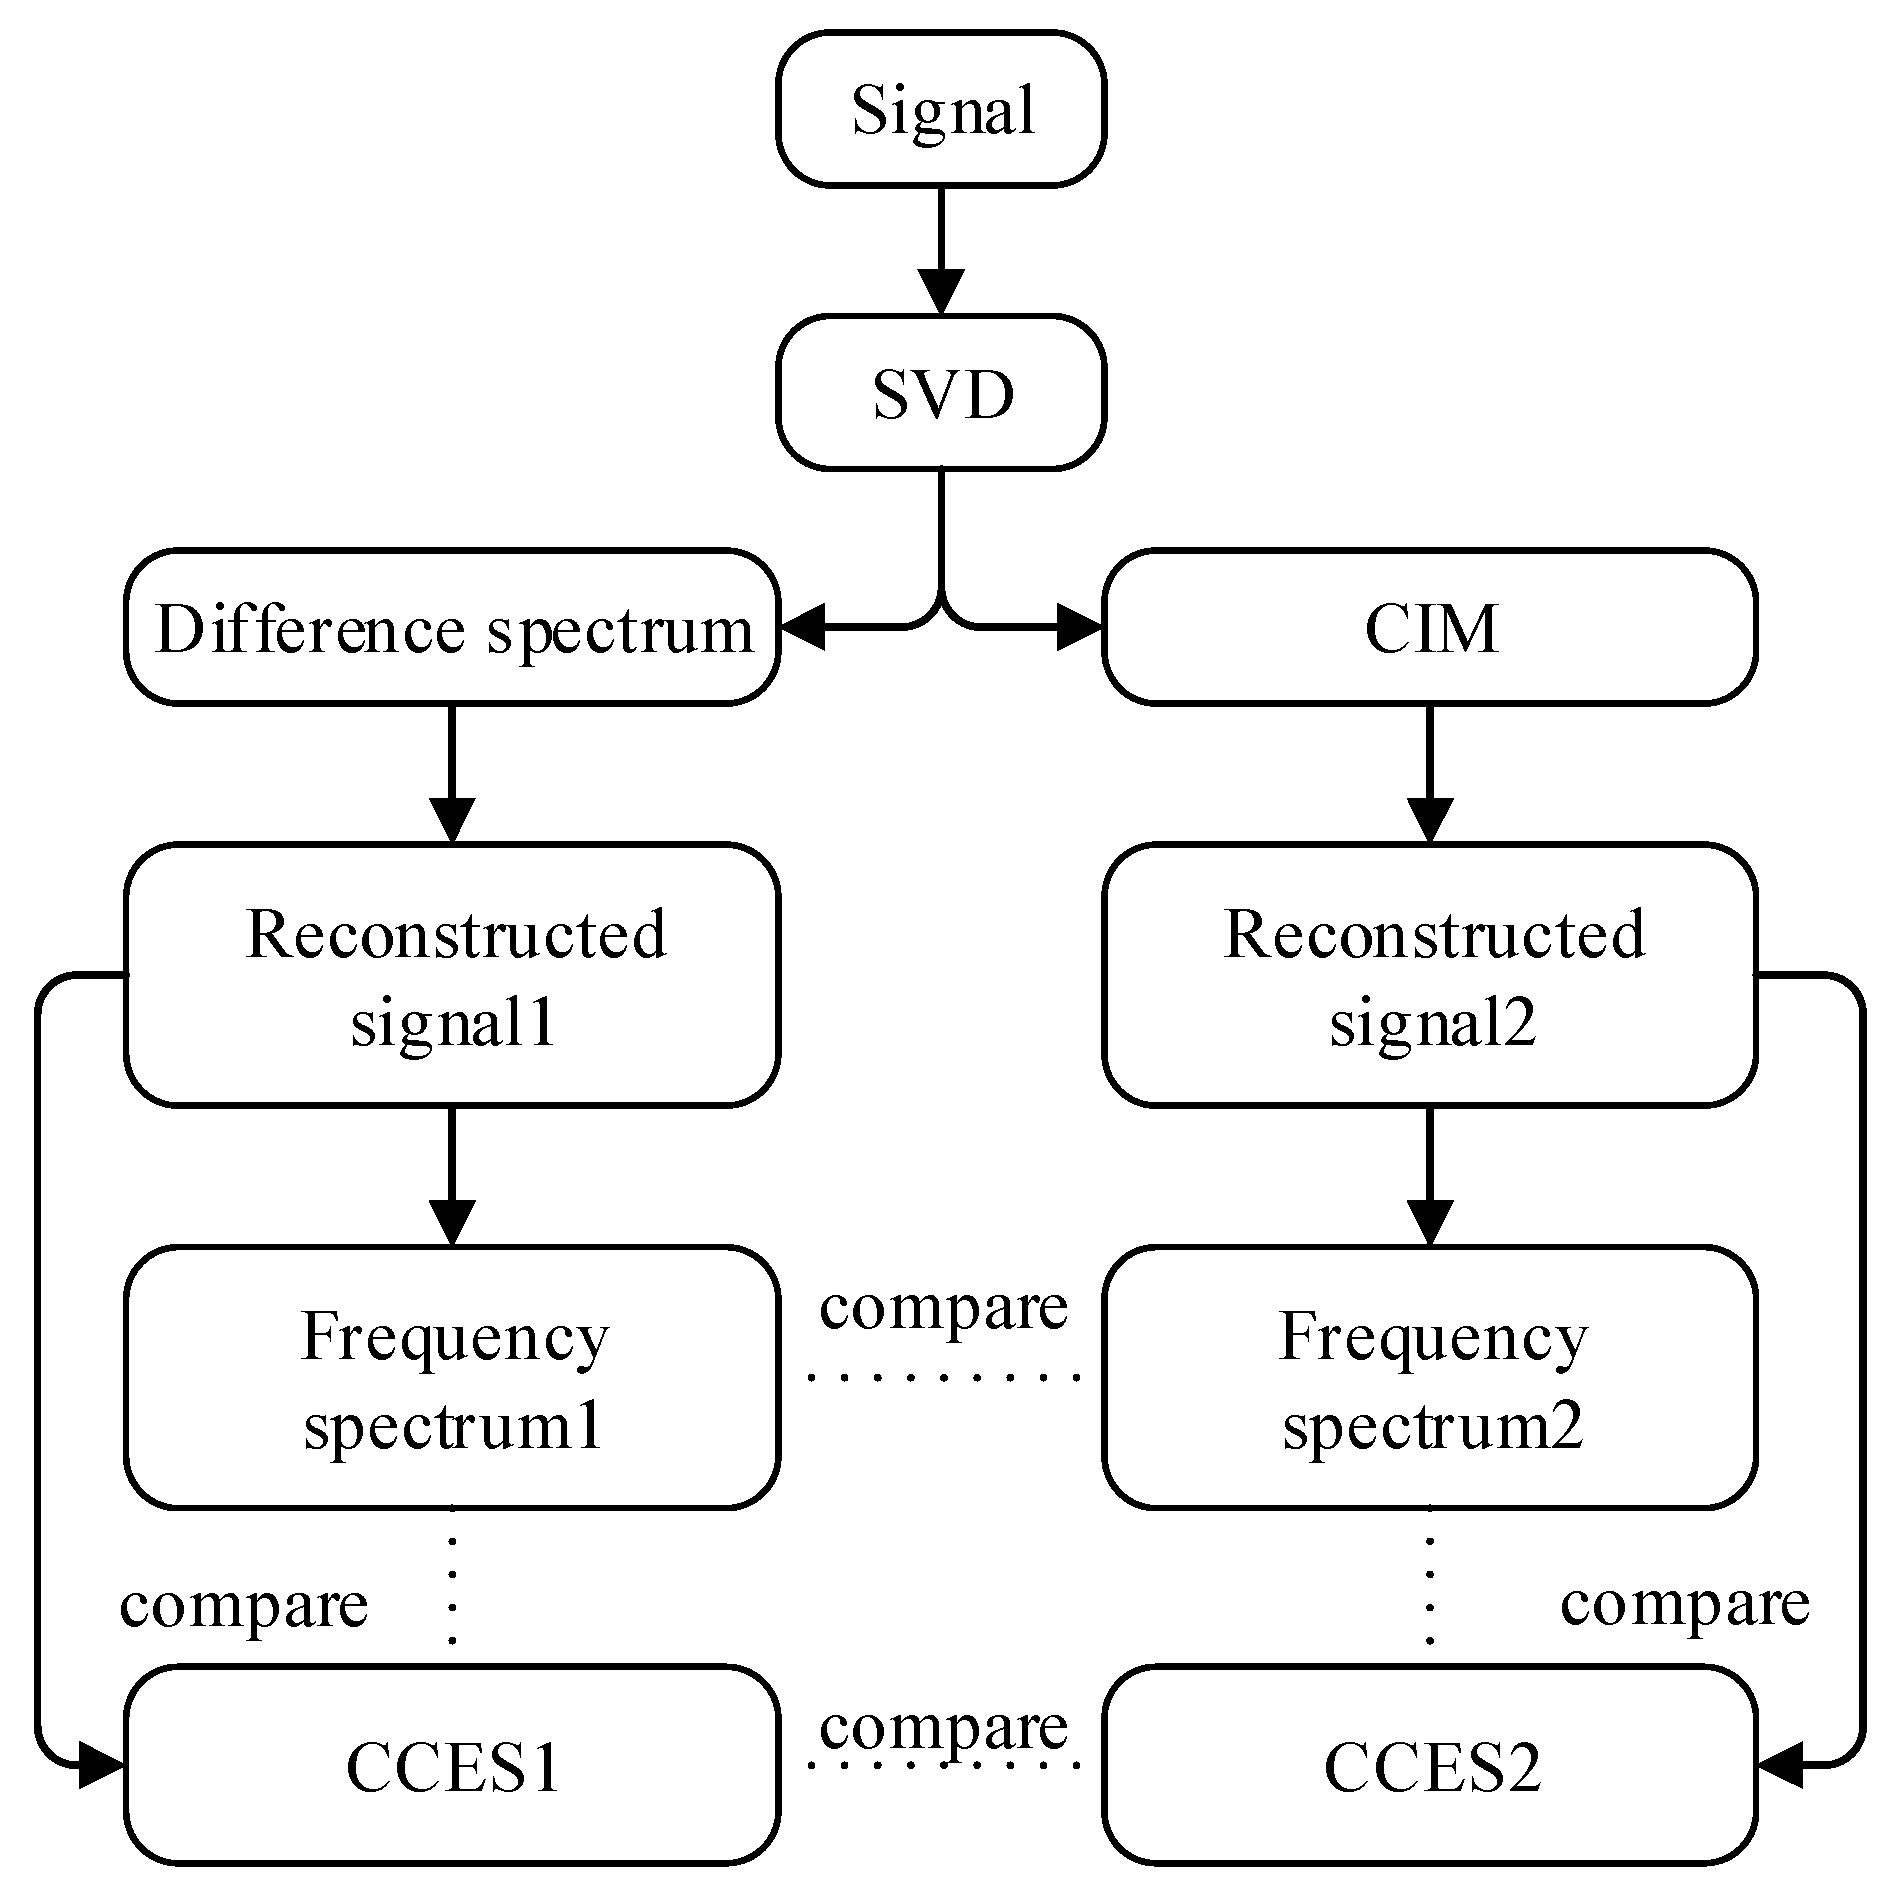
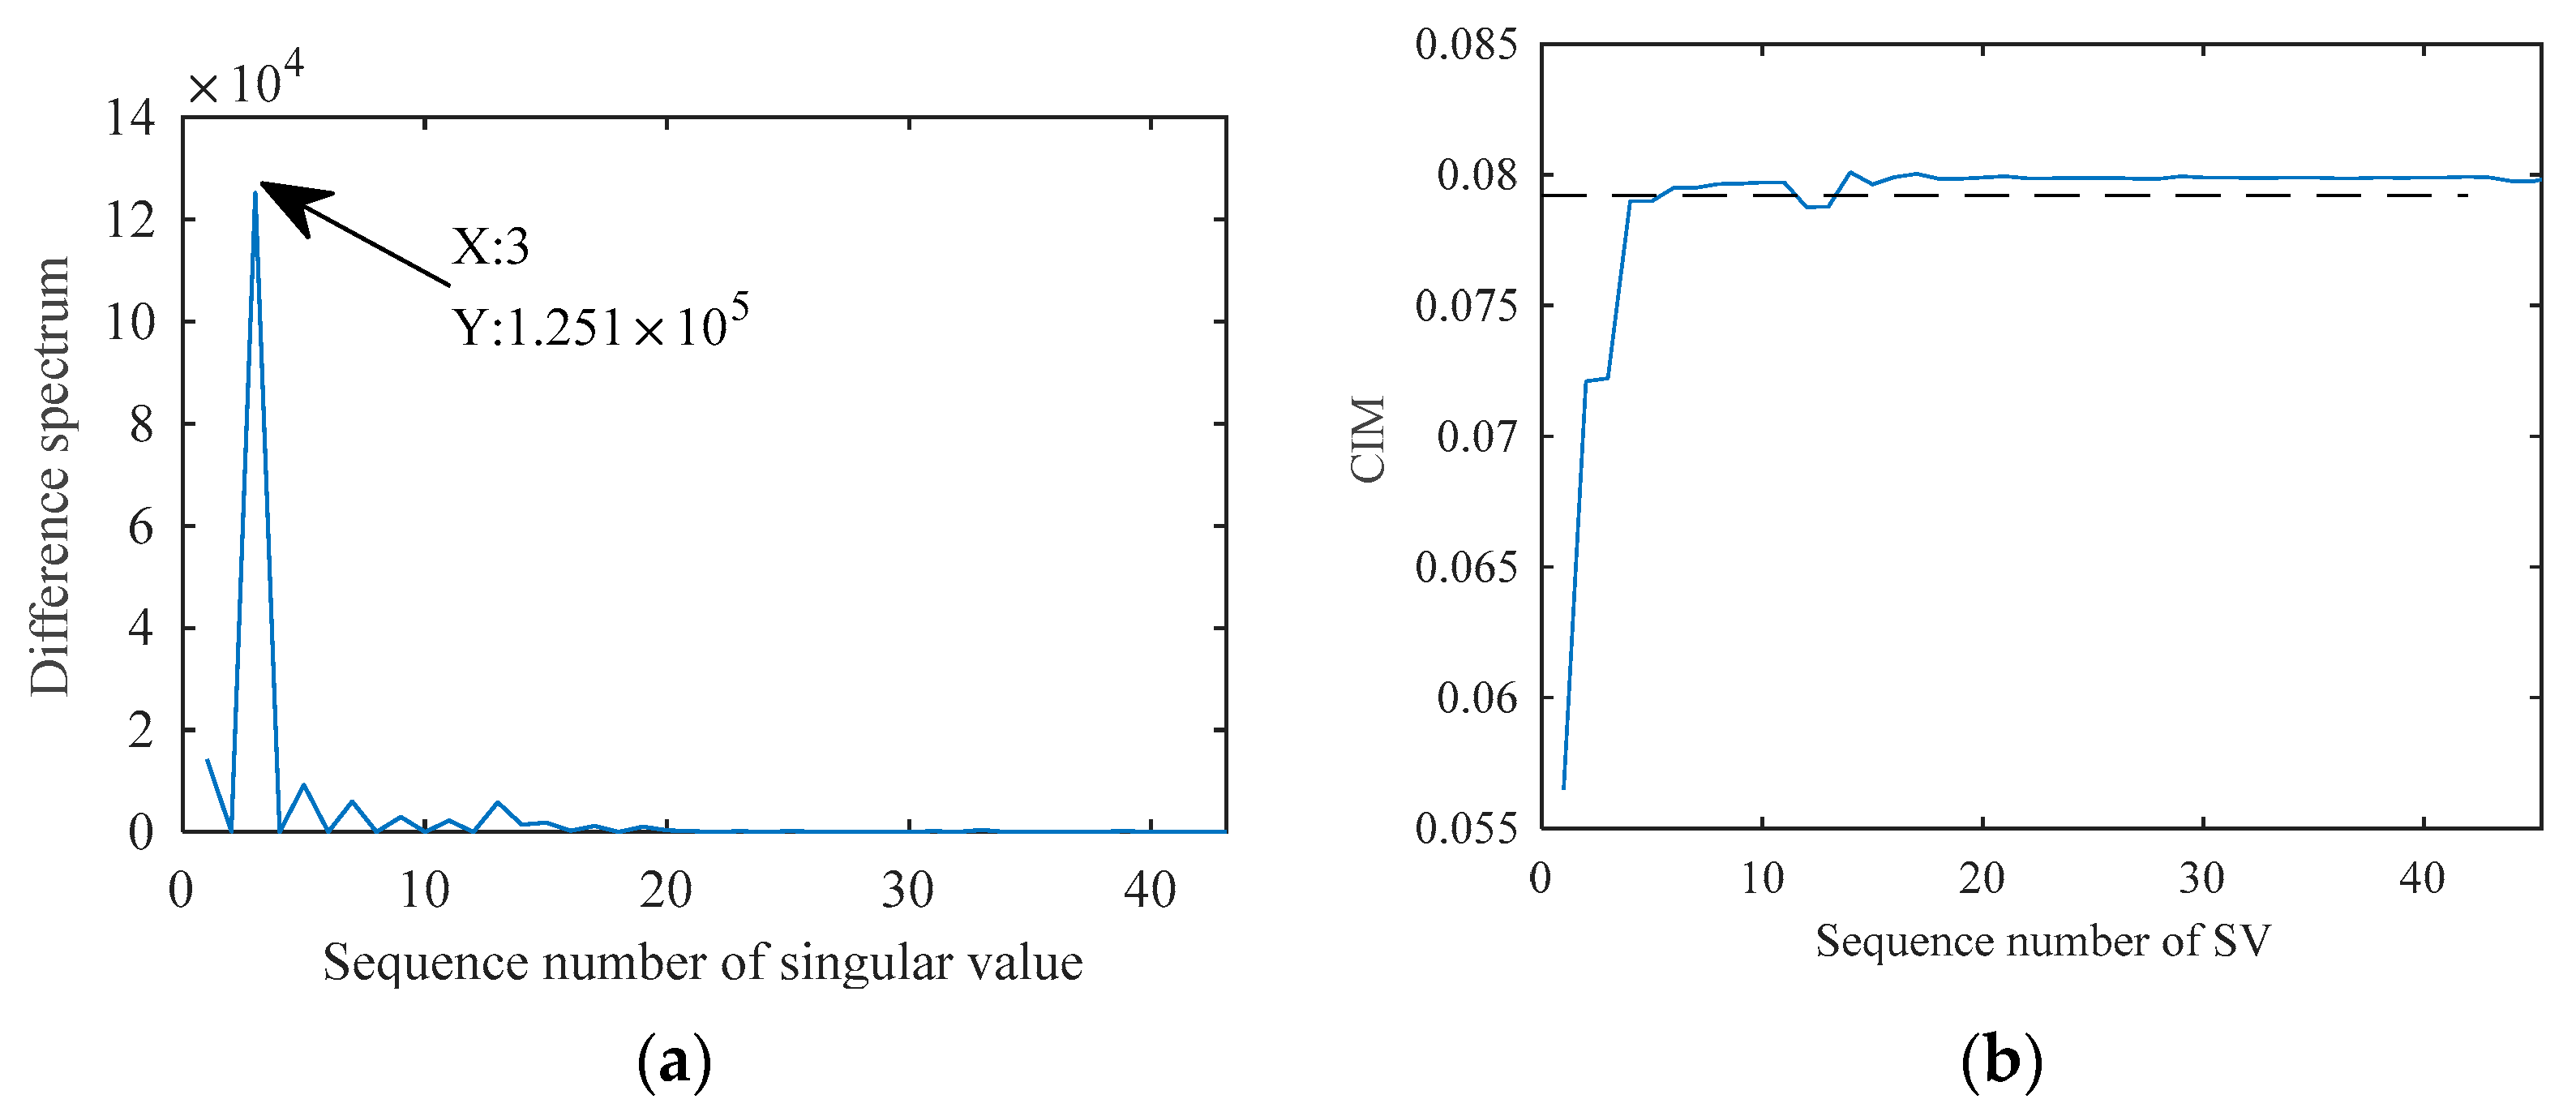
After performing SVD on the signal, the difference spectrum and CIM are used to select the SCs, respectively. Then, frequency spectrum after FFT is used to compare the difference between the two methods (different spectrum and CIM). The method analysis flowchart is shown in Figure 9. CCES is estimated also to compare with the frequency spectrum. In short, this experiment will compare two methods for choosing SCs and also compare two forms of the spectrogram. Select the first three SCs for signal reconstruction based on the difference spectrum shown in Figure 10a, and choose the SCs whose CIM is lower than the dotted line in Figure 10b for signal reconstruction.
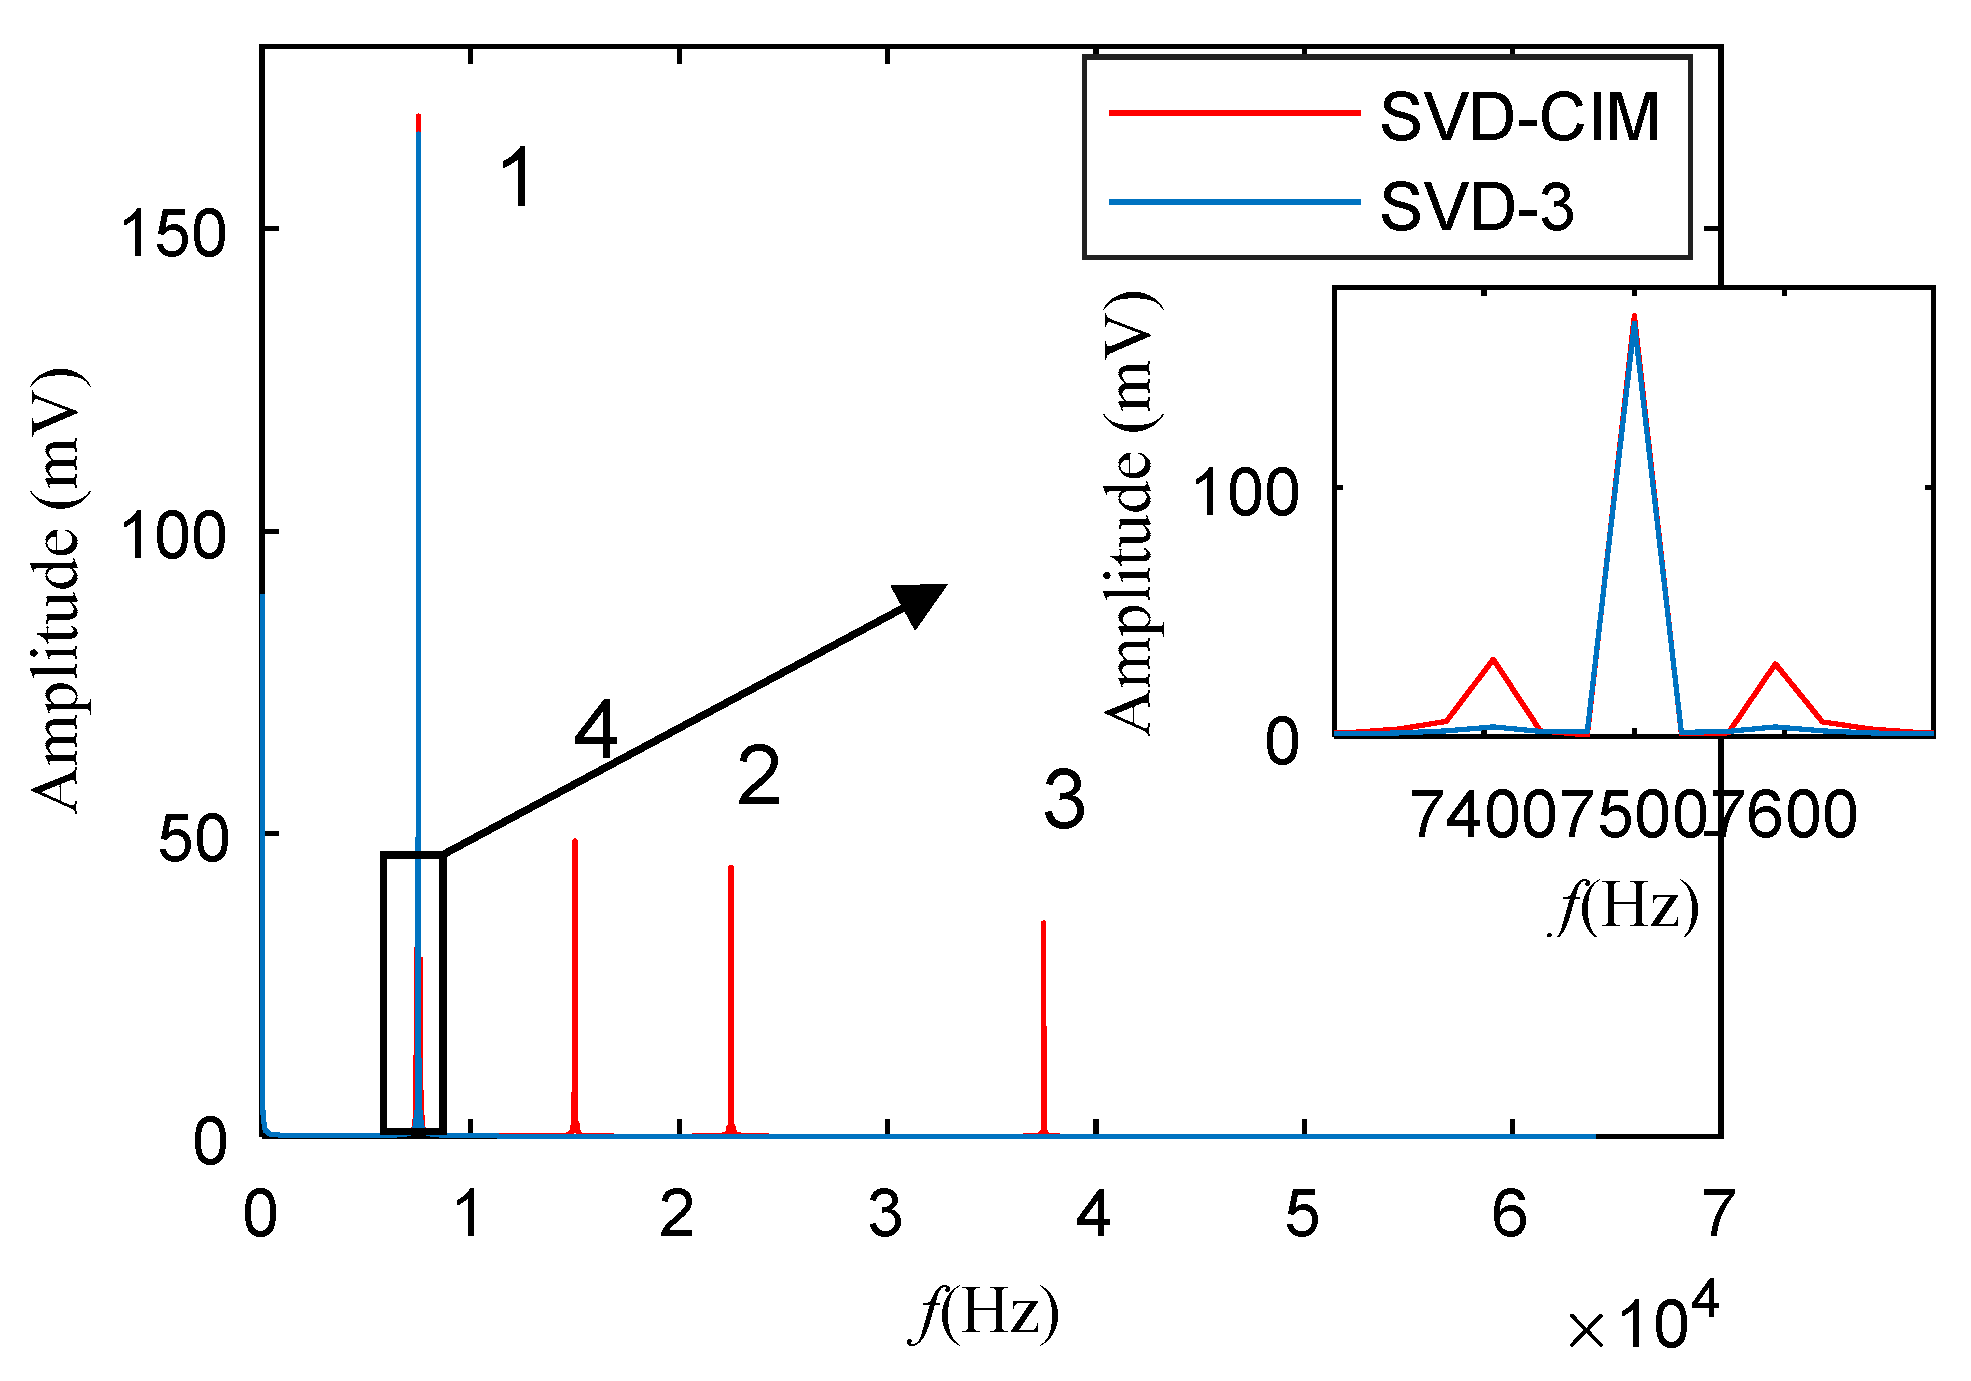
Figure 11 displays the frequency spectrum of the reconstructed signals chosen based on CIM (red line) and differential spectrum (blue line), respectively. For convenience, the method using difference spectrum is called SVD-3 in this section, because it just uses three SCs in this case, and the method using CIM is called SVD-CIM. In the frequency spectrum, method SVD-3 only extracts one frequency component, which corresponds to the spectral line with the highest amplitude in the original frequency spectrum (Figure 8). However, the proposed method SVD-CIM not only extracts the first four high-amplitude signal components corresponding to Figure 8, but also extracts the sideband of 7500 Hz which is related to the characteristic of the target frequency of 93 Hz shown in the partially enlarged view in Figure 11. The Roman numerals 1, 2, 3, and 4 in Figure 11, respectively, represent the first four frequency components of the amplitude in the original signal frequency spectrogram shown in Figure 8.
As mentioned above, the selection of SCs in SVD adopts a method based on the energy of the differential spectrum, that is, the larger the SV, the greater the energy of the SC. The SV selected by the differential spectrum represents the top amplitude of the original signal frequency spectrum. This is very useful for noise reduction, but it is disadvantageous for the situation where the target signal is completely submerged in the high-frequency, high-amplitude modulation signal.
The proposed method uses CIM to judge the similarity of the signals, which to some extent compensates for the problem that the difference spectrum is only selected based on the SV value. Because it can be seen from CIM that when the number of SV increases, the fluctuation of CIM also tends to be stable, the proposed method is still to make a certain selection in the area of large SV. However, this choice is not only based on the amplitude of the original spectrum. Sidebands of 7500 Hz have been taken into consideration. If the differential spectrum method chooses more SCs, it may be able to choose these two components. However, many other components will be introduced which will reduce denoising performance.
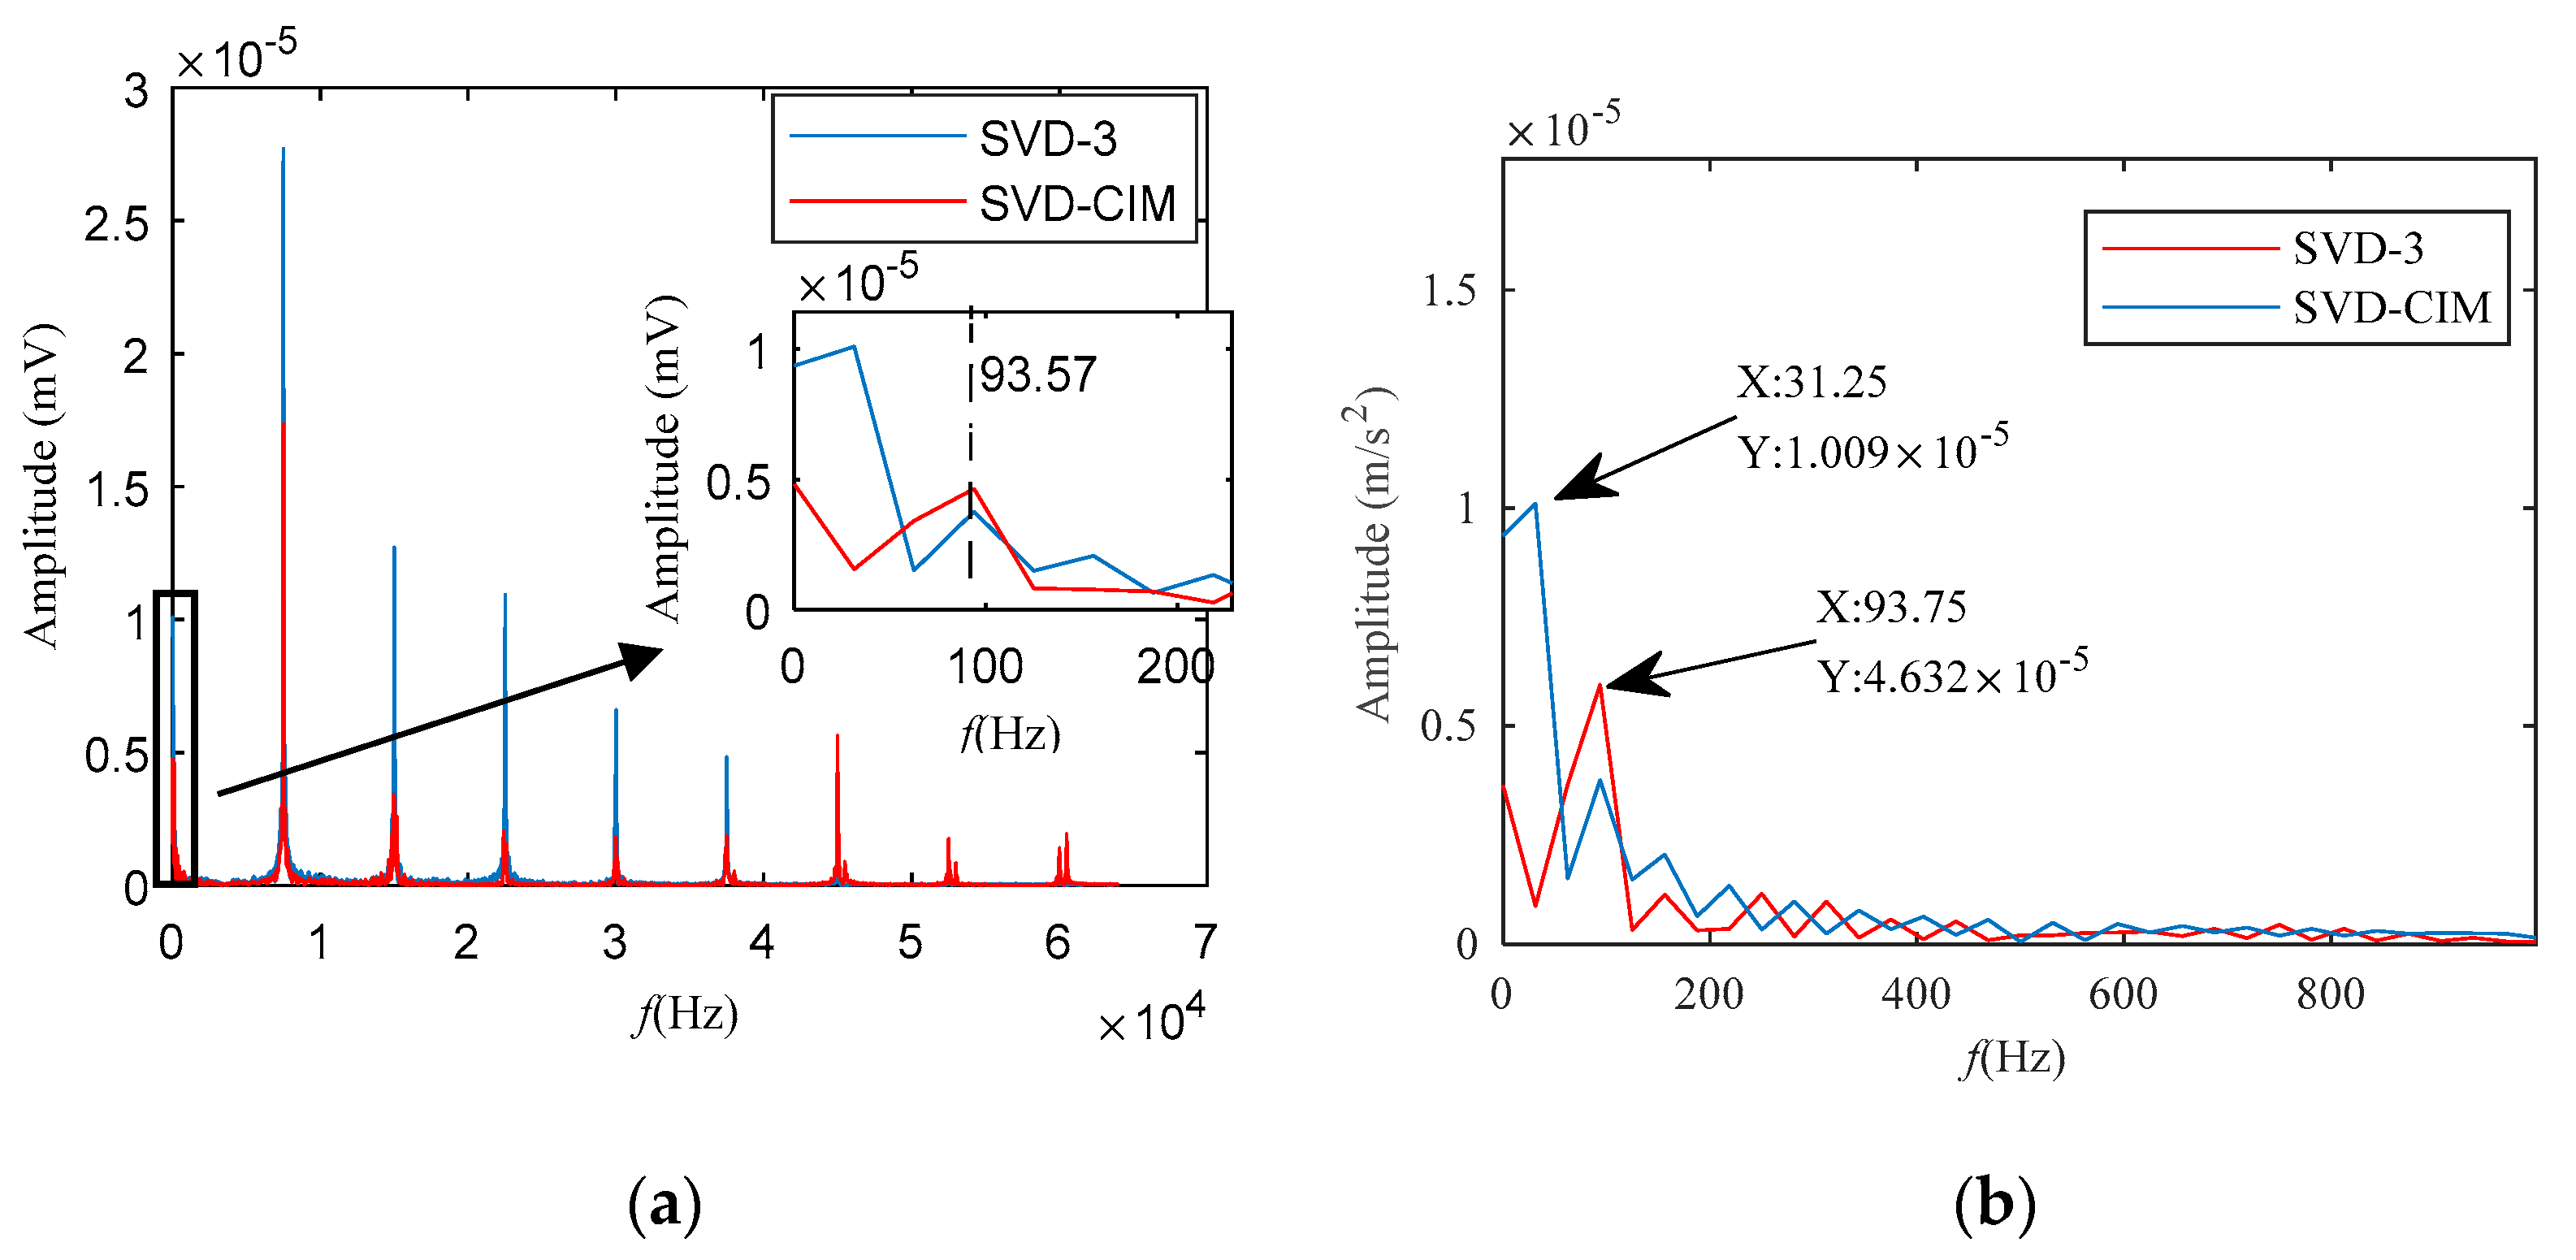
Finally, CCES is given for the two reconstructed signals in Figure 12. There are more spectral lines than the frequency spectrum in Figure 11. The red line is the CCES of SVD-CIM and the blue line is the CCES of SVD-3. Display in Figure 12 is better than the traditional frequency spectrum in Figure 11. Additionally, enlarging the 0~200 Hz spectrum, it can be seen that the peak of the blue line in this range is at 31.25 Hz, while the peak of the red line is at 93.75 Hz, which is the target frequency. The above phenomenon can be more obvious in Figure 12b.
This experiment illustrates two aspects: (1) For periodic modulation signals, CCES is more expressive than frequency spectrum, which is reflected in the richness of the spectral lines and details. (2) For SVD, CIM selection has more advantages than difference spectrum selection, which is reflected in the target signal detection seen in Figure 12b. The CCES of SVD-3 also has a peak at 93.57 Hz, but the highest peak of the blue line is at 31.25 Hz, and the amplitude of 93.57 Hz of the blue line is smaller than that of the red line.

5.2. Features Extraction of Two-Channel Information Fusion

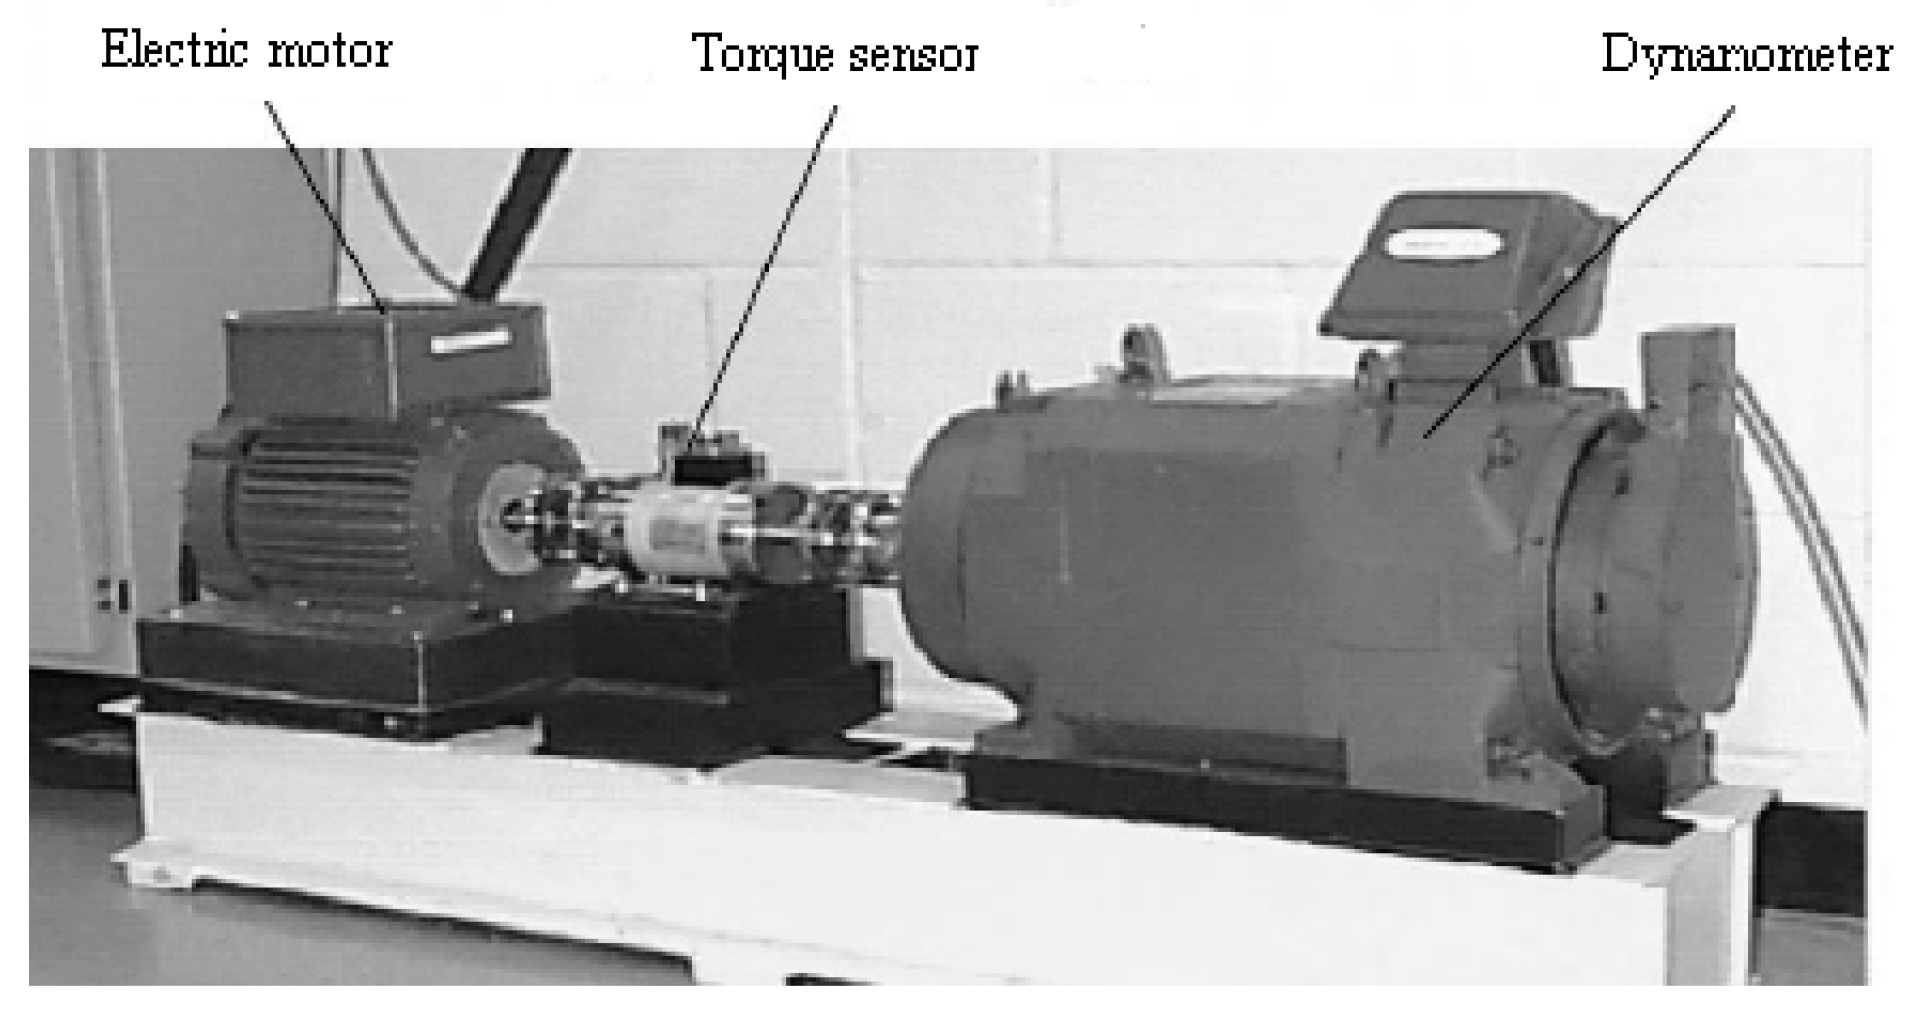
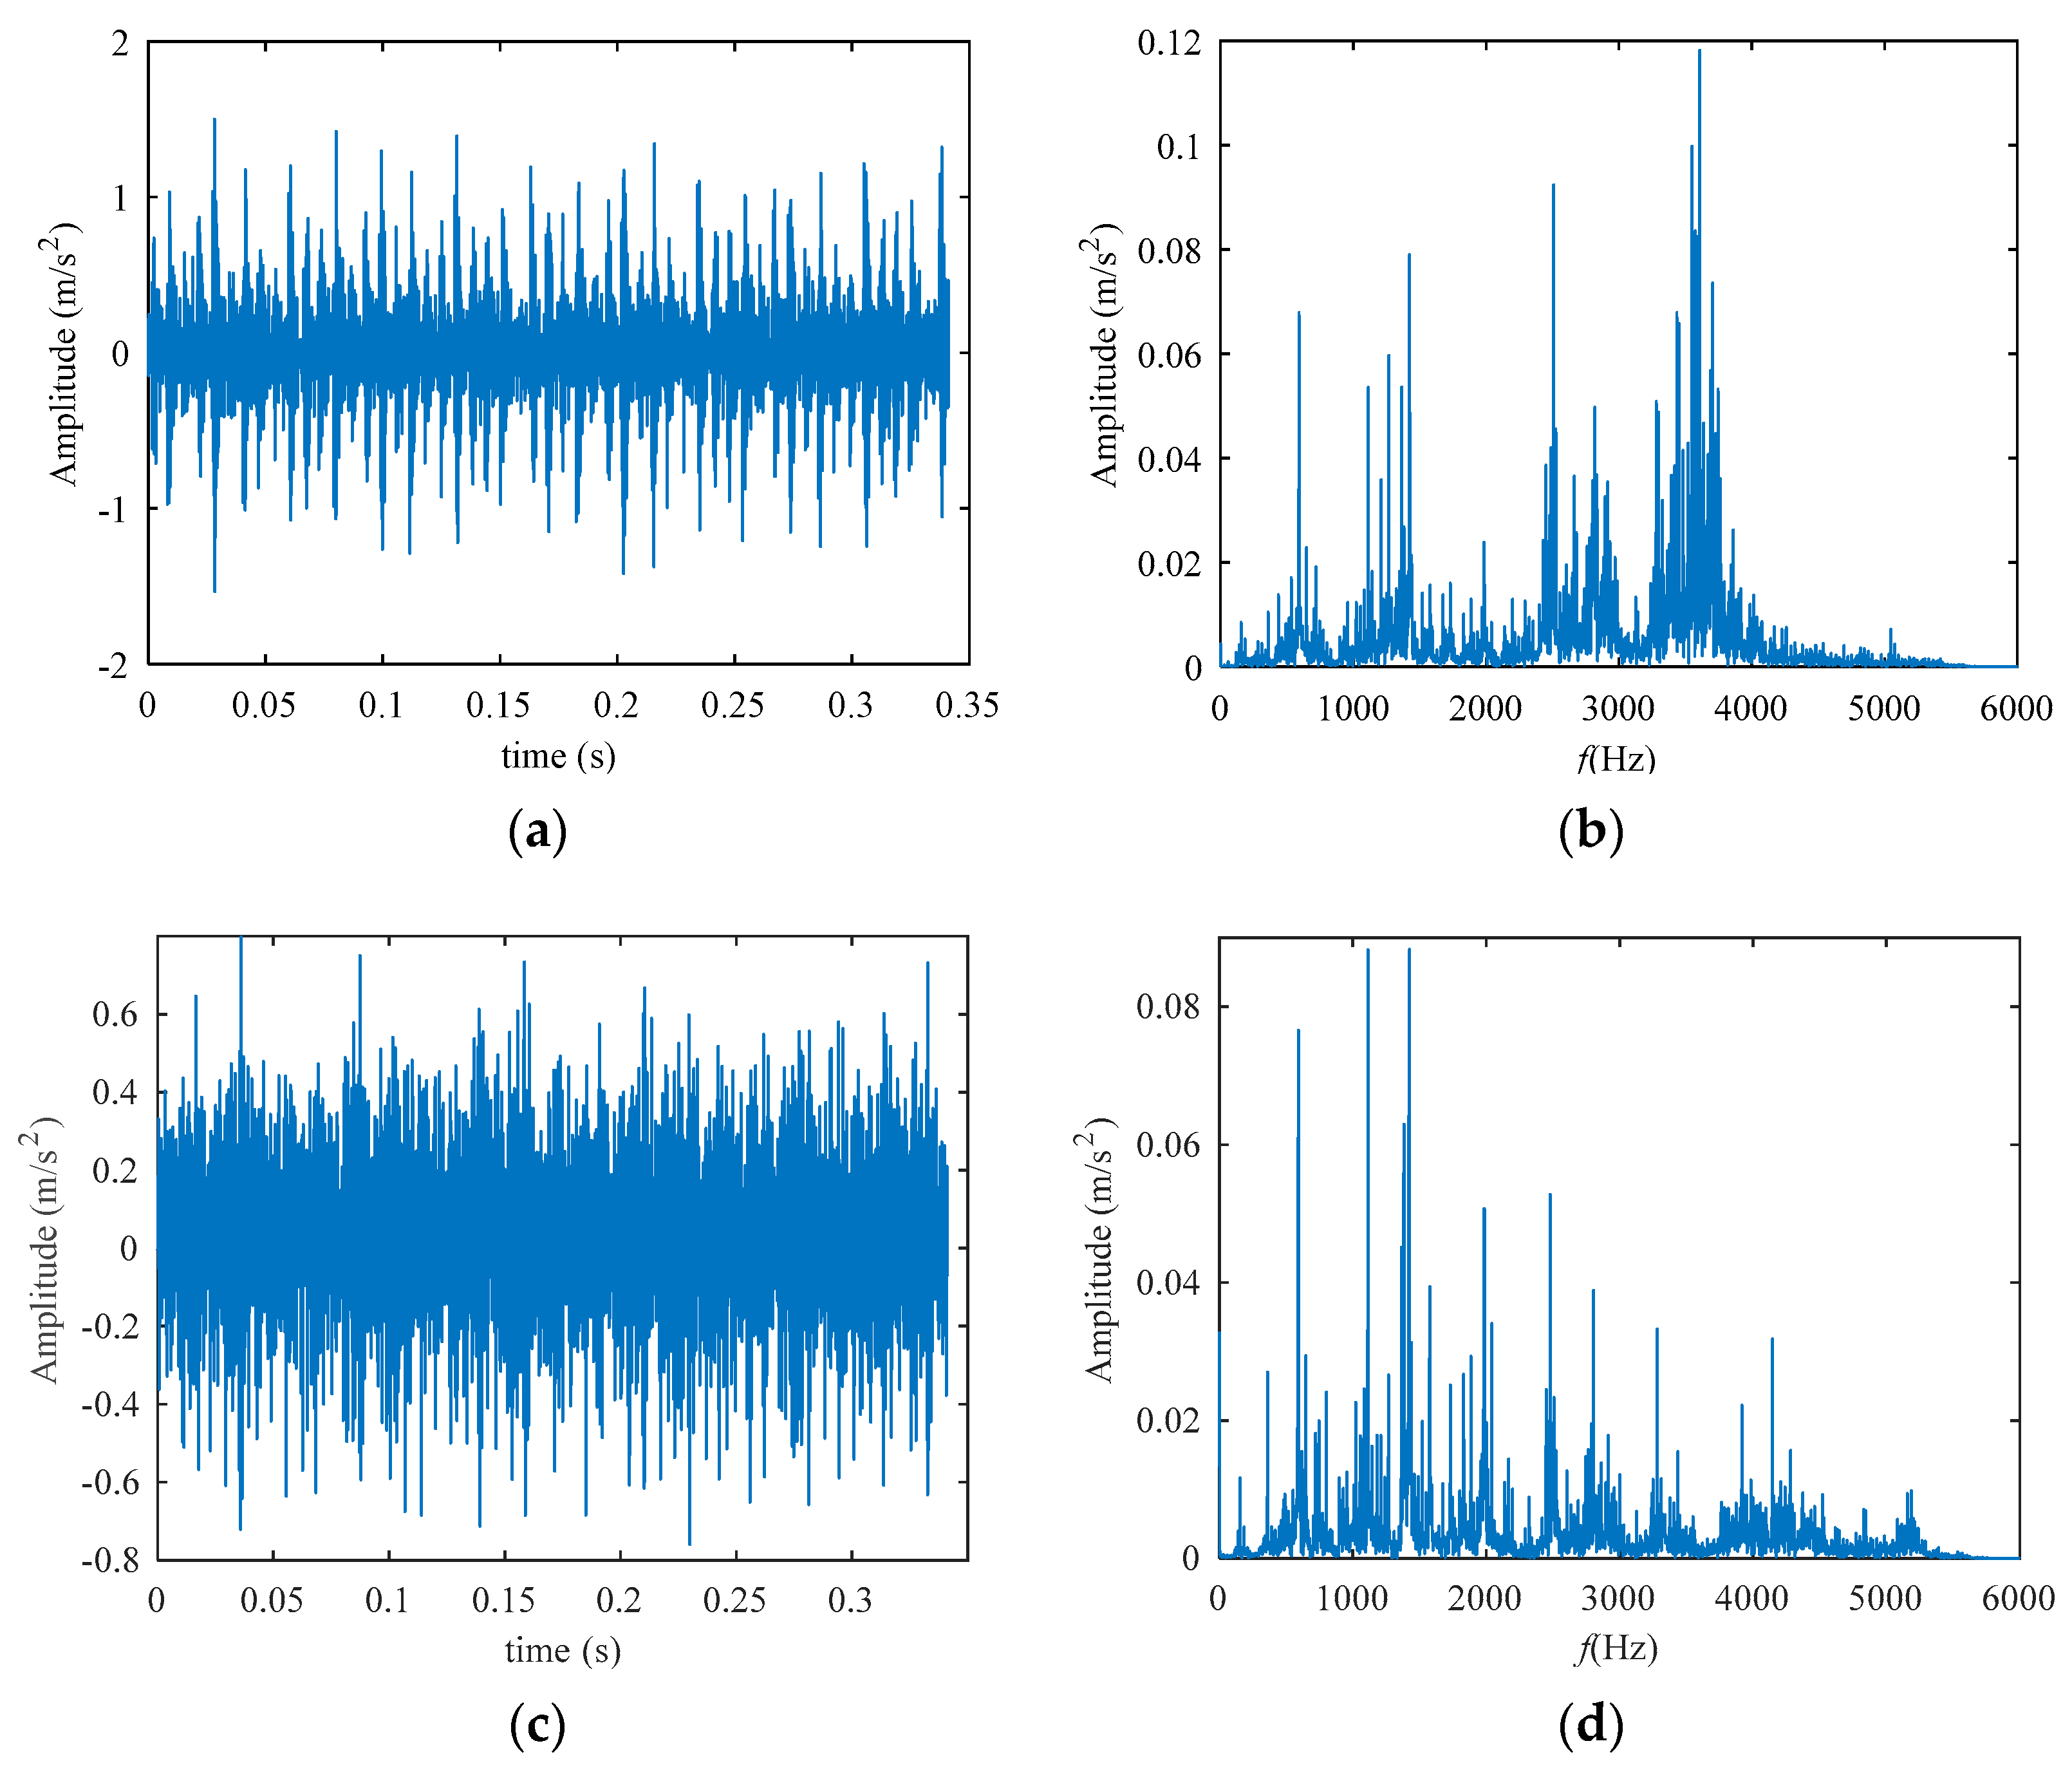
Rolling bearing fault signals are typically non-stationary, always modulated by the rotate frequency of the shaft, and too weak to be extracted from the heavy noise by the traditional method. The public dataset Case Western Reserve University (CWRU) bearing data are used to verify the method [24]. The data of the inner race faults numbered 108 are chosen for analysis, which is obtained through the test bench in Figure 13. Its fault is 0.007-inch diameter and 0.011-inch depth. The sampling frequency is 12 kHz, the rotate speed is 1721 rpm (28.68 Hz), and the fault frequency of the bearing is 155.33 Hz (which can be calculated by the formula with the parameters given by the dataset introduction). Take 4096 points from the data of the two channels on the fan end and the drive end, respectively. Figure 14 shows the time-domain waveform and frequency spectrum of the original signal in the drive end (Figure 14a,b) and fan end (Figure 14c,d). It is obvious that the frequency of the spectrum is mainly concentrated in the high-frequency range. To avoid redundant description of the method, the following takes the signal of the driver end as an example for detailed description, and the processing method of the fan end is the same.
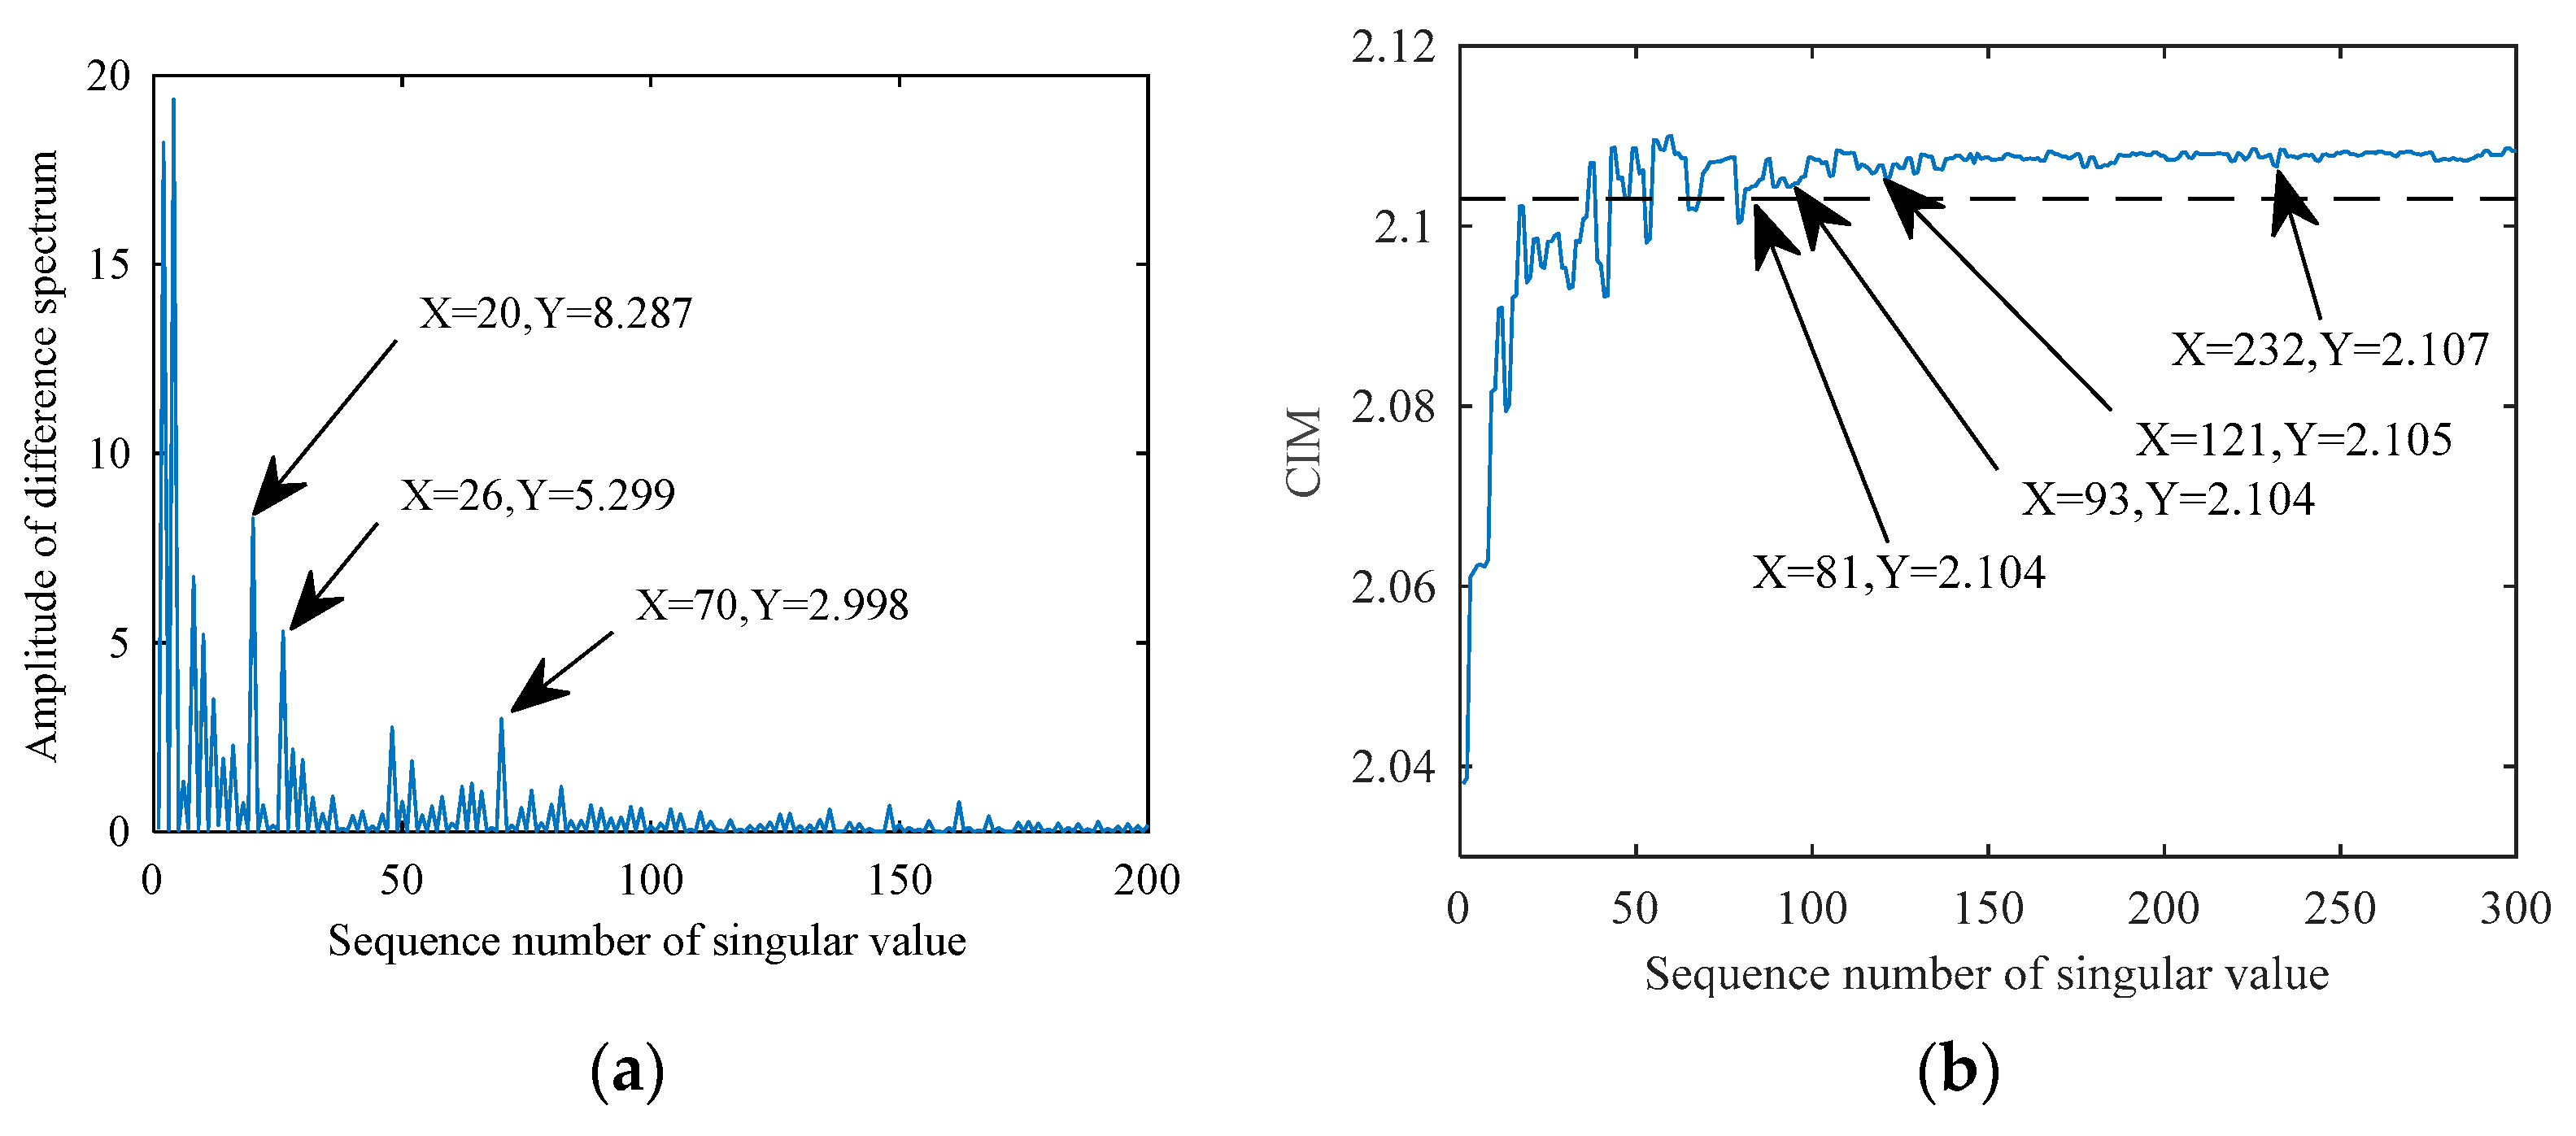
SVD is applied to the original signal, and the difference spectrum is shown in Figure 15a. It can be seen from the difference spectrum that the difference values corresponding to 20, 26, and 70 are relatively large. Starting from 70, the difference becomes very small, indicating that the SV changes slowly after 70. Therefore, reconstruct the first 70 SCs to obtain the denoised signal.
Next, refer to CIM to select the SCs involved in reconstruction. The function of CIM points out that the farther the two variables are, the greater the CIM value. Figure 15b gives the CIM between every SV and the original signal. As the sequence of SV increases, the change trend of CIM is first to increase and then to stabilize. In Figure 15b, the CIM value of sequence number 232 is 2.107, the CIM value of sequence number 121 is 2.105, and the CIM value of sequence numbers 81 and 93 is 2.104. Therefore, 2.104 is an ideal threshold choice, but consider that a small CIM value is what we want, so we believe that the valley can better reflect the change of CIM, and the value of the serial number 81 is not at a valley, then a value of 2.103 was found. This value is not far from the fluctuation range when the trend is stable, and will not cause all singular components to be filtered out. Based on the above considerations, 2.103 is selected as the threshold (shown as the black dotted line in Figure 15b). Then select the SV lower than this value, and the corresponding SCs are selected to reconstruct the signal.
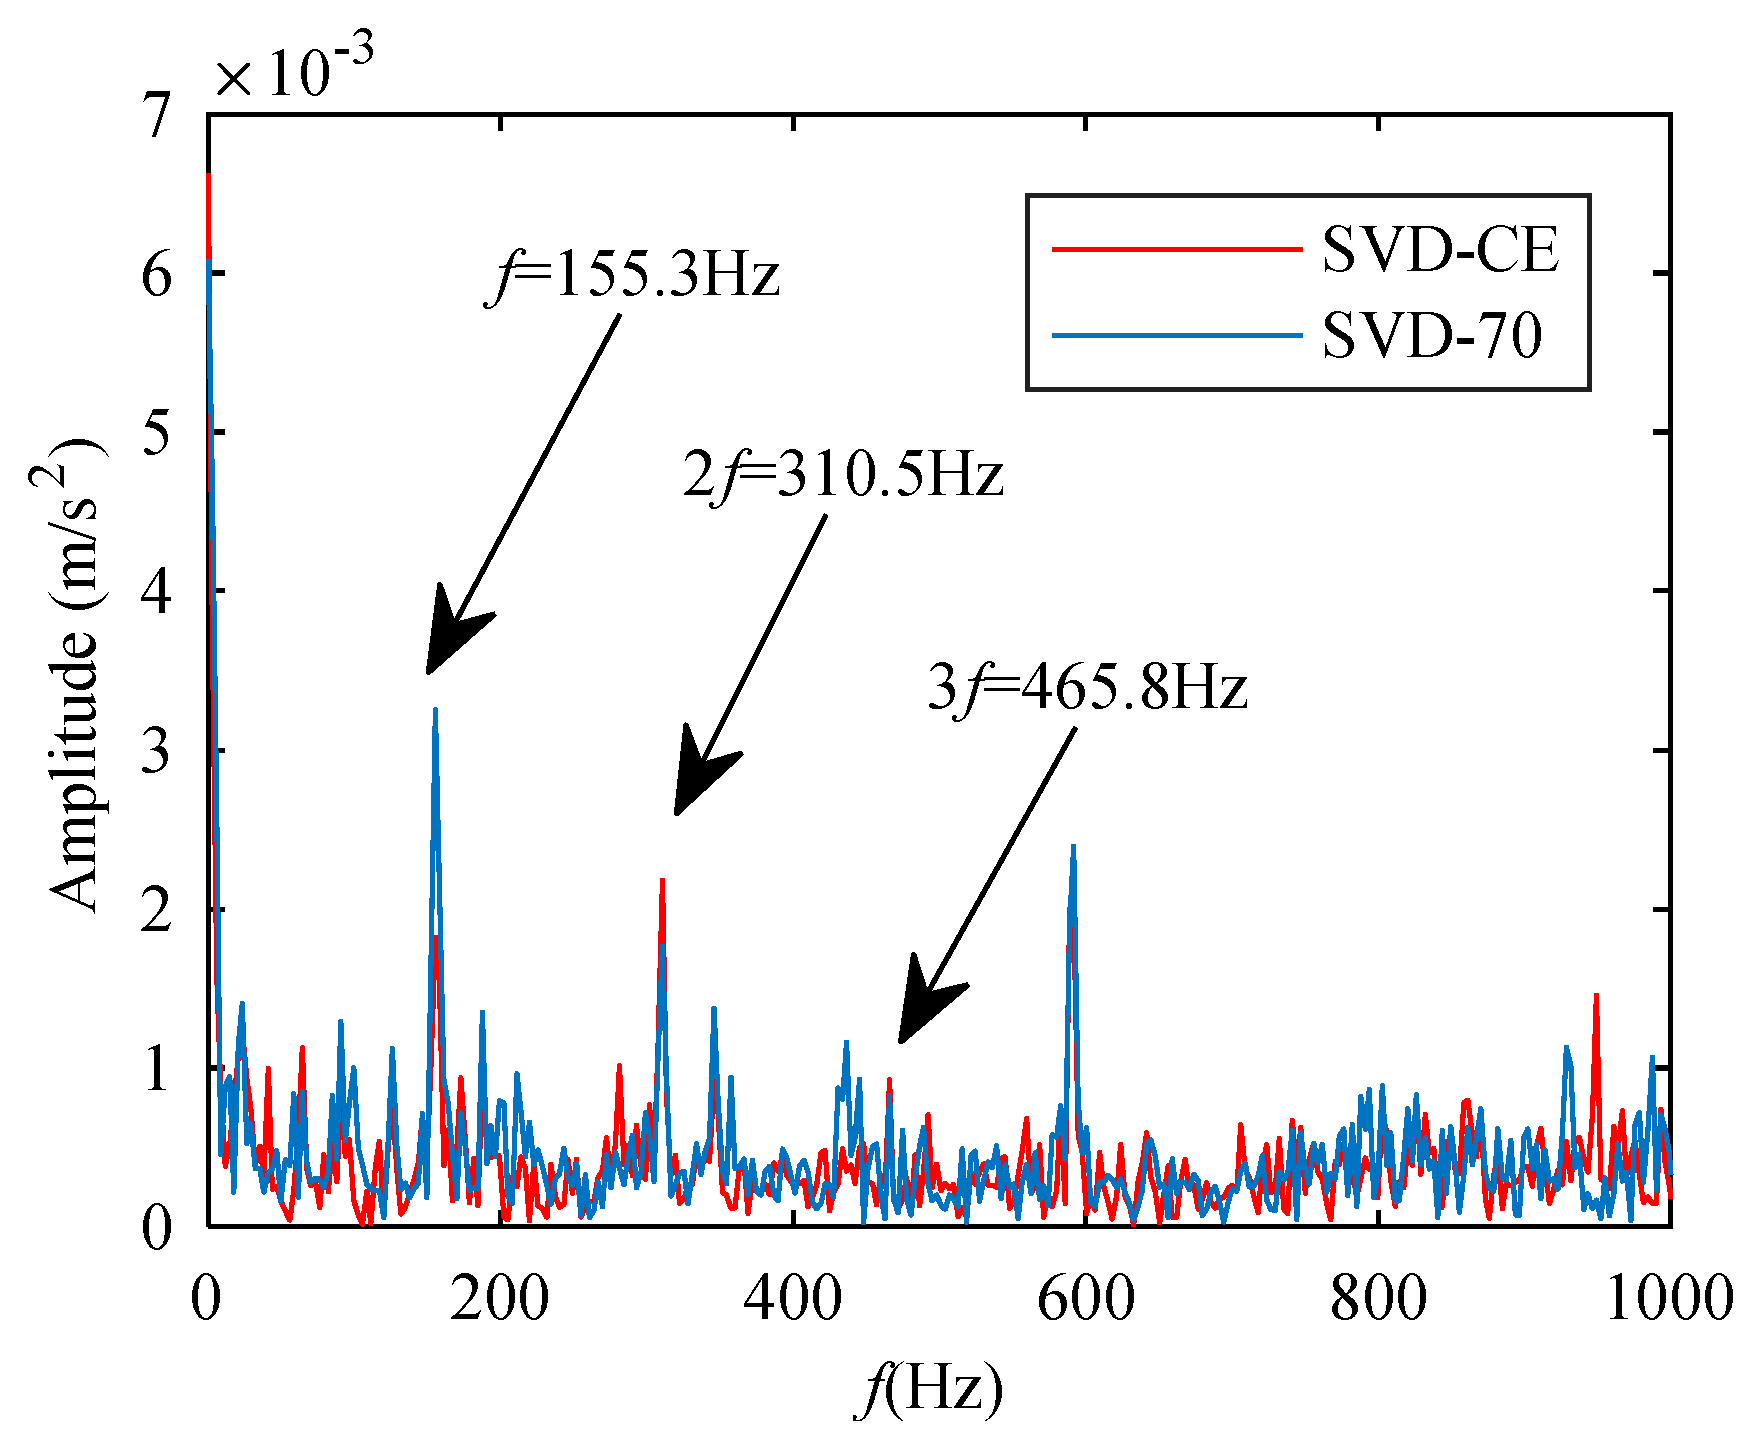
Then estimate CCES of SVD with difference spectrum method and SVD with CIM method. To compare the methods of using differential spectrum and CIM selection more intuitively, the estimated CCES of the two methods are displayed in Figure 16 where the red line represents the CCES of the reconstructed signal based on the CIM-selection of SCs, and the blue line represents that based on the first 70 SCs selected from the difference spectrum. For convenience, the method of difference spectrum selection is called SVD-70, because it used the first 70 SCs for reconstruction, and the method of CIM selection is called SVD-CIM in this case.
The fault characteristic frequency and its second harmonics can be seen from the blue and red lines. Near the third harmonics of the fault frequency, the interference of the red line is much less than that of the blue line. Additionally, it is difficult to distinguish the third harmonics of the fault frequency in the blue line. This shows that the method of using CIM to select SCs performs better than the method of selecting SCs based on the differential spectrum. The method of using CCES can show the fault characteristics more directly than the frequency spectrum obtained by the Fourier transform.
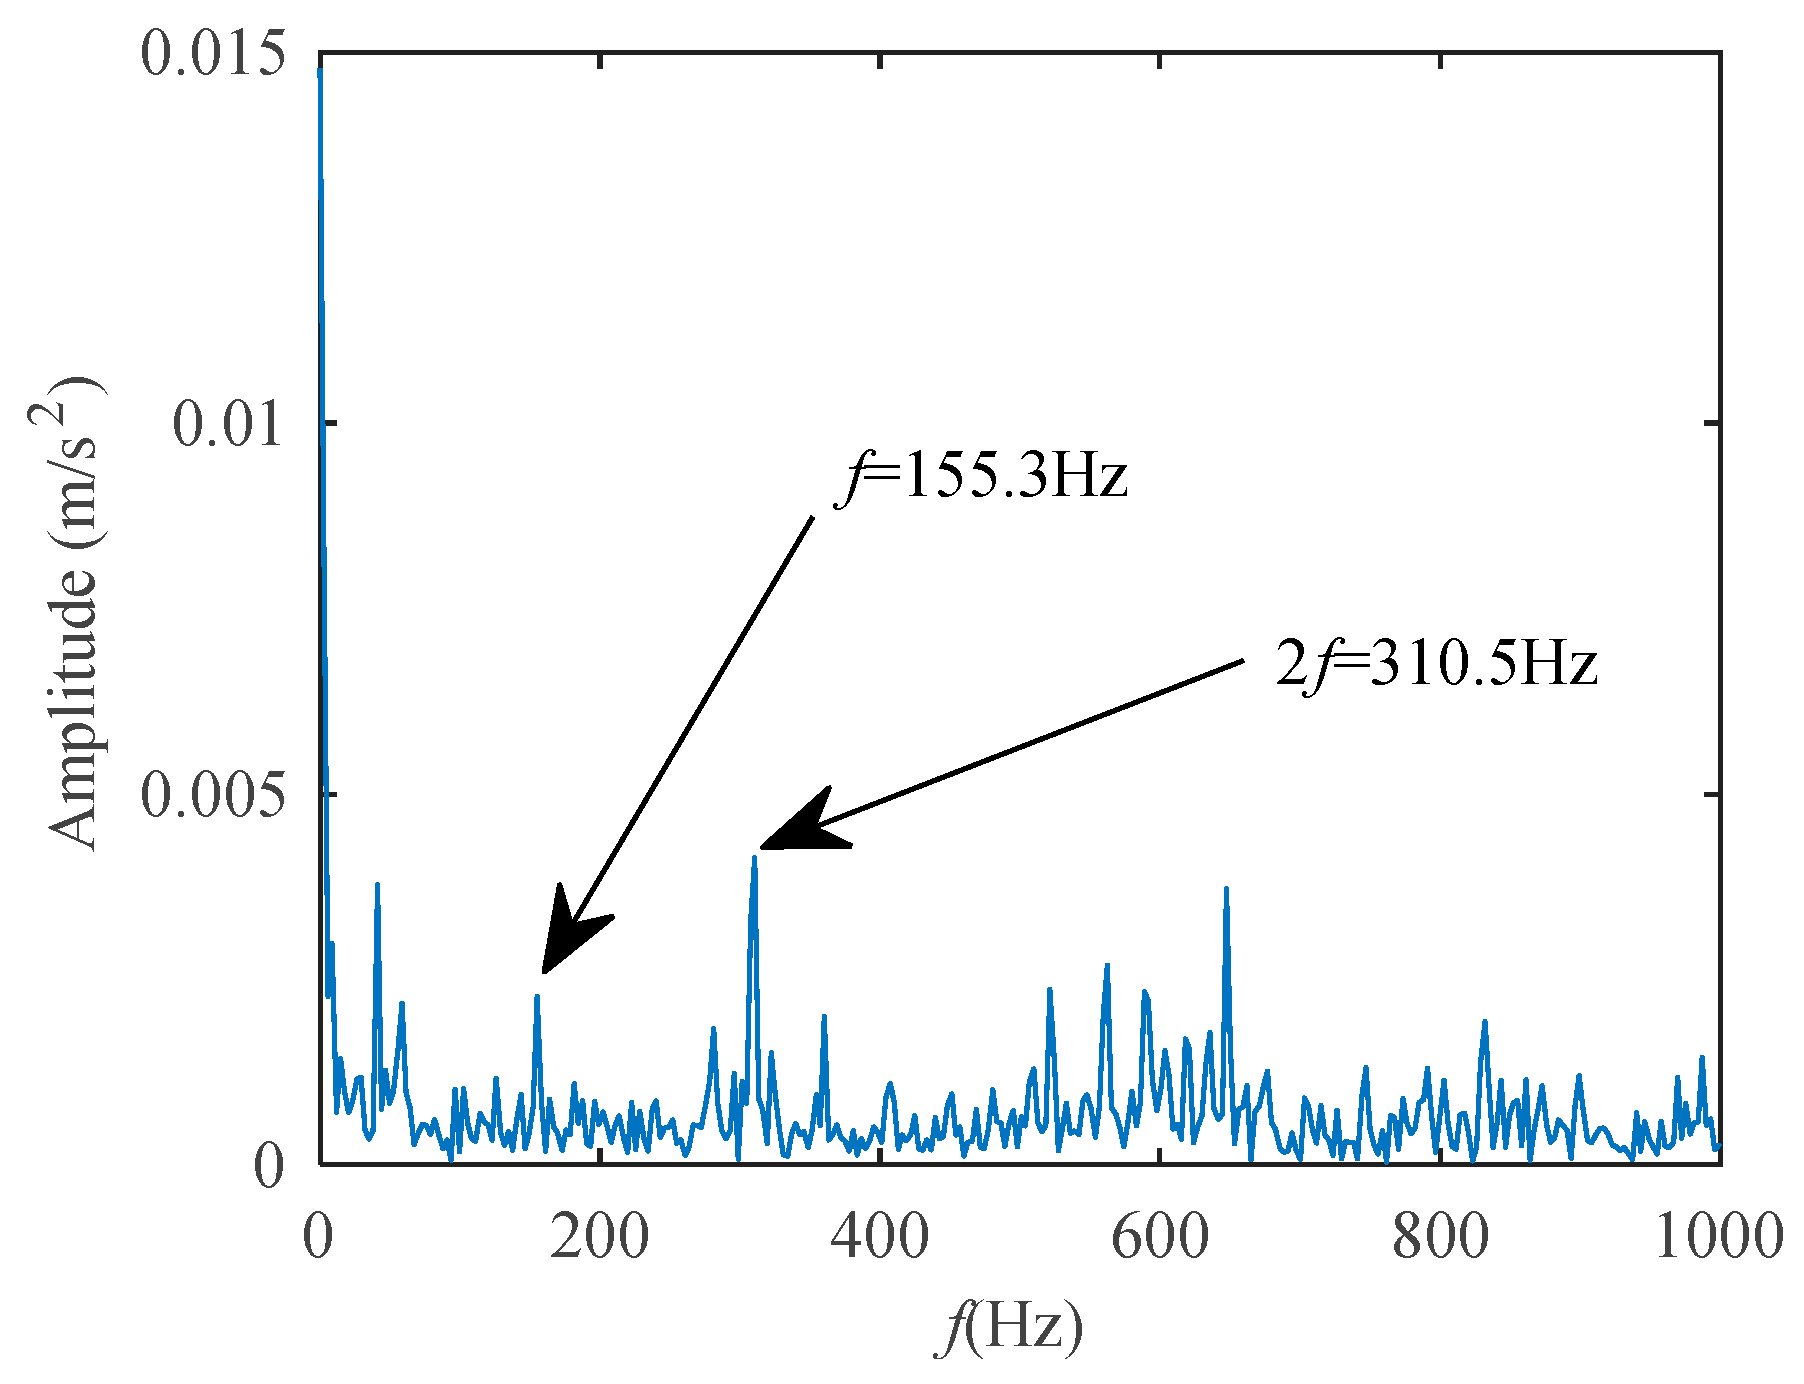
The fan-end signal is processed with the proposed method, and the CCES is shown in Figure 17, from which the characteristic frequency and the second harmonic frequency of the fault can be found clearly. However, since the fan end is far away from the faulty component, its peak frequency is not at the fundamental frequency of the signal.
Then analyze the signals of the two channels:
(1)
Construct each signal column into a 3073-by-1024 matrix, and then splice the two matrices into a 3073-by-2048 matrix.
(2)
Perform PCA on the newly constructed matrix with each column as one-dimensional, and obtain a new 3073-by-2048 matrix.
(3)
To maintain the consistency of the signal length, the first 1024 dimensions are preferred as the principal components.
(4)
However, to prove that the selected principal components can represent the main information of the original matrix, the cumulative contribution of the selected matrix should be calculated. The cumulative contribution of the first 352-dimensional vector reaches 95%, and the cumulative contribution of the first 1024-dimensional vector reaches 99.66%. Therefore, it can be considered that the first 1024 dimensional vectors can express most of the information of the original matrix.
After the two-channel signal is reduced in dimensionality, SVD is performed on the signal, then the CIM between the SCs and the reduced-dimensional signal is calculated. Next, select the SCs that can be reconstructed according to the aforementioned method. Finally, estimate the CCES of the reconstructed signal. Figure 18 is the CCES of the dimensionality reduction signal (blue line) and the signal processed by the proposed method (red line).
Only the characteristic frequency of the fault is obvious in the blue line in Figure 18, which means that after two-channel information fusion, the fundamental frequency of the fault characteristic is enhanced, but the harmonic frequency that can indicate the fault characteristic is not displayed. After the SVD-CIM method is adopted for denoising the signal, its odd multiple of harmonic frequency is reflected in CCES.
From Figure 18, we can find that the two-channel information can enhance the amplitude of the characteristic frequency at 155.3 Hz compared to Figure 16 and Figure 17. The amplitude of the red line is above 0.003, the amplitude of the blue line is above 0.005 in Figure 18. The red line of the single-channel in Figure 16 is below 0.002, and the amplitude of the blue line is below 0.004. The amplitude of the characteristic frequency in Figure 17 is close to 0.003. Additionally, combined with the SVD-CIM, there is obvious characteristics frequency of third harmonics and fifth harmonics. This shows that compared to single-channel information, two-channel information can enhance the signal’s fault characteristics, and through the processing of the SVD-CIM method, its CCES can make the characteristics more obvious. Usually, for the fault signal generated by the rotating component, the proposed method is added to the envelope spectrum analysis to demodulate the signal. However, the estimated CCES in this work does not need to perform the envelope demodulation analysis, which replaces the role of envelope spectrum. See Section 4.2 for specific analysis.

6. Conclusions

  • A method called SVD-CIM is proposed to extract the weak signal features, which includes using CIM to select the SCs from the SVD and estimating CCES for the reconstructed signal.
  • CIM is a similarity measure based on frequency components.
  • Compared with the frequency spectrum of the reconstructed signals, CCES can express more useful information for the cyclostationary signals.
  • Compare with the method of difference spectrum selection, the CIM selection has a better performance on weak signal features.
  • For two-channel information, two-SVD-CIM is proposed, and the two-channel information fusion can enhance the fault characteristics.

Author Contributions

Conceptualization, J.L. and S.L.; methodology, S.G.; validation, S.G., H.M.; formal analysis, S.G.; investigation, Y.W.; resources, G.T.; writing—original draft preparation, S.G. All authors have read and agreed to the published version of the manuscript.

Funding

This work was supported by the National Key Research and Development Program of China (2018YFB2003300), the research was supported by National Natural Science Foundation of China (51975276), and Stability Support project of Sichuan Gas Turbine Research Institute of AECC (WDZC-2020-4-7).

Data Availability Statement

Acknowledgments

The authors would like to thank CWRU for providing the free bearing data download, and the anonymous reviewers for their valuable comments and suggestions.

Conflicts of Interest

The authors declare no conflict of interest.

References

  1. Gong, S.; Lu, J.; Li, S.; Ma, H.; Yan-Feng, W.; Guang-Rong, T. The Correntropy Induced Metric and Cyclic Correntropy Spectrum Method Combined with Singular Value Decomposition for Weak Signal Detection. In Proceedings of the IEEE Global Reliability & Prognostics and Health Management Conference, Nanjing, China, 15–17 October 2021. [Google Scholar]
  2. Qian, W.; Li, S.; Jiang, X. Deep transfer network for rotating machine fault analysis. Pattern Recognit. 2019, 96, 106993. [Google Scholar] [CrossRef]
  3. Rodriguez, E.; Alvarez-Ramirez, J.; Espinosa-Paredes, G. A singular value decomposition entropy approach to instability analysis in BWR’s. Nucl. Eng. Des. 2021, 386, 111576. [Google Scholar] [CrossRef]
  4. Zhao, X.Z.; Ye, B.Y. Selection of effective singular values using difference spectrum and its application to fault diagnosis of headstock. Mech. Syst. Signal Process. 2011, 25, 1617–1631. [Google Scholar] [CrossRef]
  5. Zhao, M.; Jia, X. A novel strategy for signal denoising using reweighted SVD and its applications to weak fault feature enhancement of rotating machinery. Mech. Syst. Signal Process. 2017, 94, 129–147. [Google Scholar] [CrossRef]
  6. Gong, S.; Li, S.; Wang, H.; Ma, H.; Yu, T. Multi-Frequency Weak Signal Detection Based on Wavelet Transform and Parameter Selection of Bistable Stochastic Resonance Model. J. Vib. Eng. Technol. 2021, 9, 887–906. [Google Scholar] [CrossRef]
  7. Zhang, Z.; Li, S.; Lu, J.; Wang, J.; Jiang, X. A novel intelligent fault diagnosis method based on fast intrinsic component filtering and pseudo-normalization. Mech. Syst. Signal Process. 2020, 145, 106923. [Google Scholar] [CrossRef]
  8. Wang, X.; Si, S.; Li, Y. Multiscale Diversity Entropy: A Novel Dynamical Measure for Fault Diagnosis of Rotating Machinery. IEEE Trans. Ind. Inform. 2021, 17, 5419–5429. [Google Scholar] [CrossRef]
  9. Wang, X.; Si, S.; Li, Y. Variational embedding multiscale diversity entropy for fault diagnosis of large-scale machinery. IEEE Trans. Ind. Electron. 2021, 69, 3109–3119. [Google Scholar] [CrossRef]
  10. Weifeng, L.; Pokharel, P.P.; Principe, J.C. Correntropy: A Localized Similarity Measure. In Proceedings of the 2006 IEEE International Joint Conference on Neural Network Proceedings, Vancouver, BC, Canada, 16–21 July 2006. [Google Scholar]
  11. An, Z.H.; Li, S.M.; Wang, J.R.; Qian, W.W.; Wu, Q.J. An Intelligent Fault Diagnosis Approach Considering the Elimination of the Weight Matrix Multi-Correlation. Appl. Sci. 2018, 8, 906. [Google Scholar] [CrossRef] [Green Version]
  12. Liu, T.; Qiu, T.; Luan, S. Cyclic Correntropy: Foundations and Theories. IEEE Access 2018, 6, 34659–34669. [Google Scholar] [CrossRef]
  13. Chen, B.; Xing, L.; Zhao, H.; Zheng, N.; Principe, J.C. Generalized Correntropy for RobustAdaptive Filtering. IEEE Trans. Signal Process. 2016, 64, 3376–3387. [Google Scholar] [CrossRef] [Green Version]
  14. Zhang, Z.; Li, S.; Wang, J.; Xin, Y.; An, Z. General normalized sparse filtering: A novel unsupervised learning method for rotating machinery fault diagnosis. Mech. Syst. Signal Process. 2019, 124, 596–612. [Google Scholar] [CrossRef]
  15. Luan, S.; Qiu, T.; Zhu, Y.; Yu, L. Cyclic correntropy and its spectrum in frequency estimation in the presence of impulsive noise. Signal Process. 2016, 120, 503–508. [Google Scholar] [CrossRef]
  16. Chen Xing, Q.T.; Liu, C. TDOA estimation algorithm based on generalized cyclic correntropy in impulsive noise and cochannel interference. IEICE Trans. Fundam. Electron. Commun. Comput. Sci. 2018, 10, 1625–1630. [Google Scholar] [CrossRef]
  17. Zhao, X.; Qin, Y.; He, C.; Jia, L.; Kou, L. Rolling Element Bearing Fault Diagnosis under Impulsive Noise Environment Based on Cyclic Correntropy Spectrum. Entropy 2019, 21, 50. [Google Scholar] [CrossRef] [Green Version]
  18. Zografos, K.; Nadarajah, S. Expressions for Rényi and Shannon entropies for multivariate distributions. Stat. Probab. Lett. 2005, 71, 71–84. [Google Scholar] [CrossRef]
  19. Hotellings, H. Analysis of a complex of statistical variables into principal components. Br. J. Educ. Psychol. 1932, 24, 417–520. [Google Scholar] [CrossRef]
  20. Takens, F. Detecting strange attractors in turbulence. In Dynamical Systems and Turbulence, Warwick, 1980; Springer: Berlin/Heidelberg, Germany, 1981; pp. 366–381. [Google Scholar]
  21. Ma, H.; Li, S.; Zhang, Z.; Lu, J. Fault Feature Extraction of Rolling Bearing Based on Improved VMD-SVD Joint Denoising and Synchrosqueezing Wavelet Transform. In Proceedings of the 2020, 11th International Conference on Prognostics and System Health Management (PHM-2020 Jinan), Jinan, China, 23–25 October 2020. [Google Scholar]
  22. Wang, J.; Li, S.; Jiang, X.; Cheng, C. An automatic feature extraction method and its application in fault diagnosis. J. Vibroengineering 2007, 19, 2521–2533. [Google Scholar]
  23. Santamaria, I.; Pokharel, P.P.; Principe, J.C. Generalized correlation function: Definition, properties, and application to blind equalization. IEEE Trans. Signal Processing 2006, 54, 2187–2197. [Google Scholar] [CrossRef] [Green Version]
  24. Smith, W.A.; Randall, R.B. Rolling element bearing diagnostics using the CaseWestern Reserve University data: A benchmark study. Mech. Syst. Signal Processing 2015, 64, 100–131. [Google Scholar] [CrossRef]
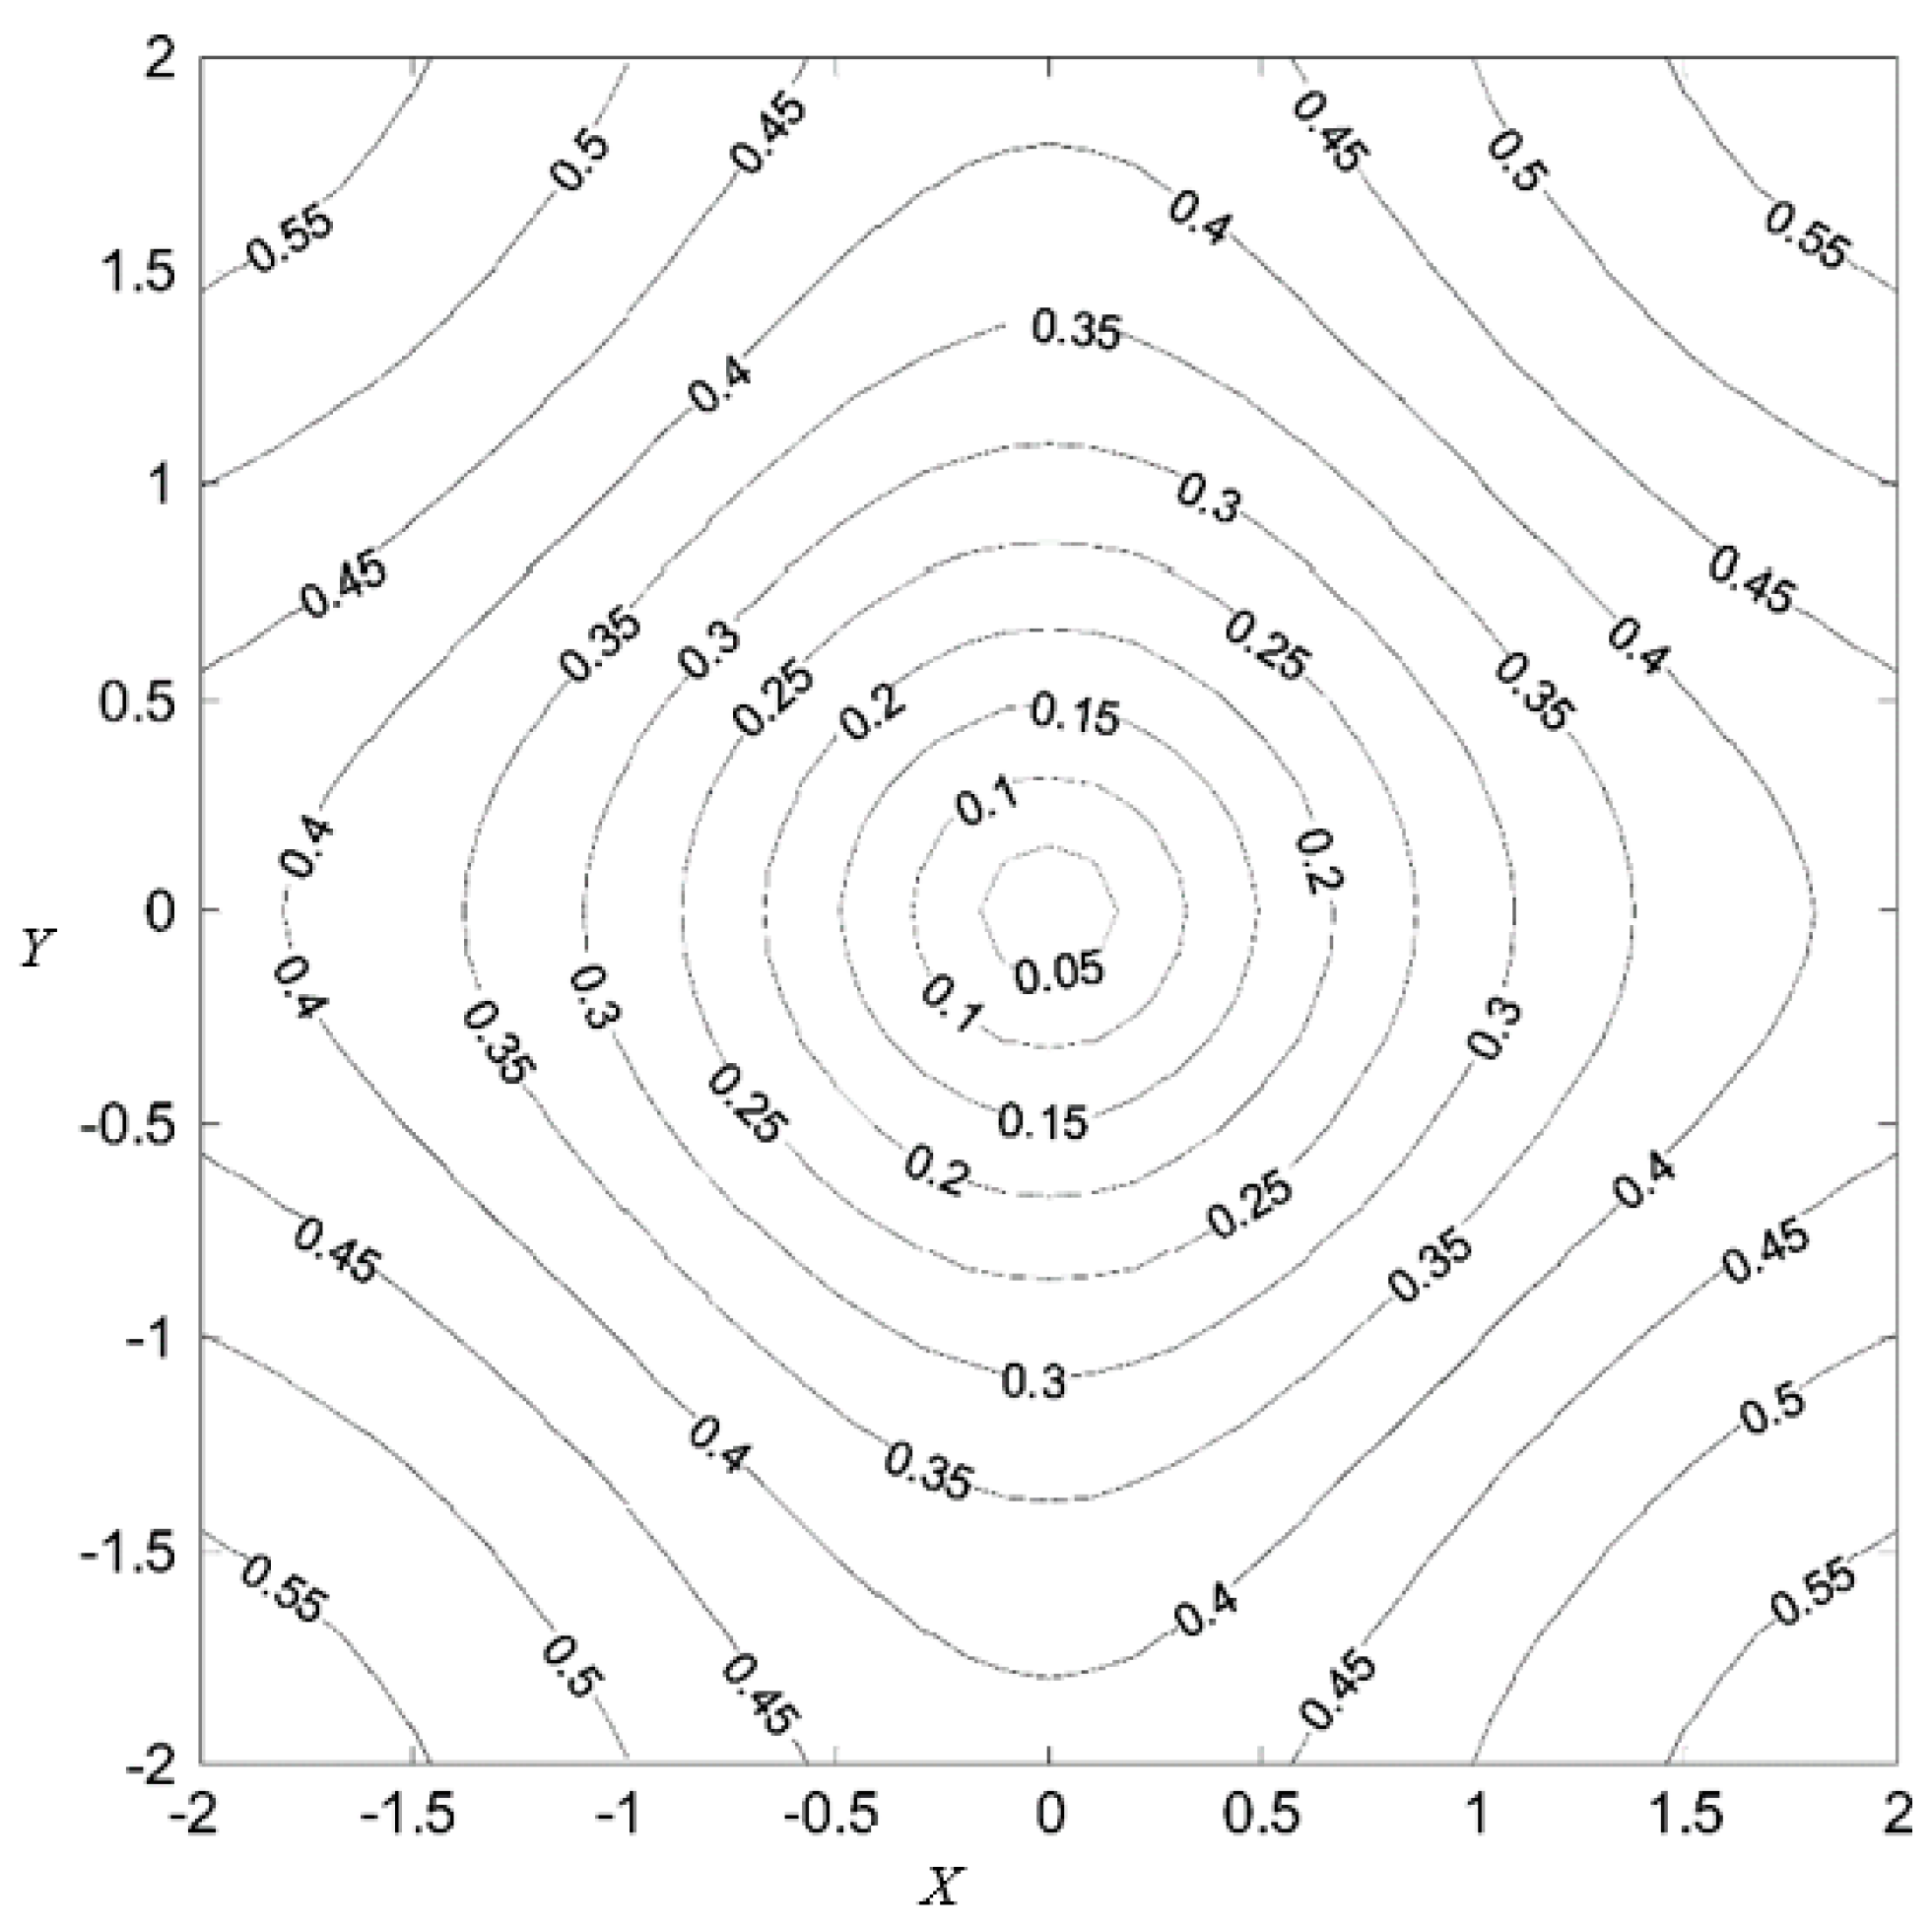
Figure 1. The CIM contour map in 2-D.
Applsci 12 01414 g001
Figure 2. Flowchart of the two-SVD-CIM.
Applsci 12 01414 g002
Figure 3. Simulation signals. (a) waveform of signals. (b) frequency spectrum.
Applsci 12 01414 g003
Figure 4. CIM between the first four simulation signals and s5.
Applsci 12 01414 g004
Figure 5. The Amplitude-Modulation signal. (a) Time-domain waveform. (b) Frequency spectrum.
Applsci 12 01414 g005
Figure 6. Envelope spectrum and CCES of the simulation signal. (a) Envelope spectrum. (b) CCES.
Applsci 12 01414 g006
Figure 7. The test system. (a) The overall test system. (b) The analog amplifier circuit board.
Applsci 12 01414 g007
Figure 8. The original signal with 93 Hz. (a) the waveform of the original signal. (b) the frequency spectrum.
Applsci 12 01414 g008
Figure 9. Single-channel method analysis flowchart.
Applsci 12 01414 g009
Figure 10. The difference spectrum and CIM. (a) Difference spectrum. (b) CIM value.
Applsci 12 01414 g010
Figure 11. Frequency spectrum of the two methods.
Applsci 12 01414 g011
Figure 12. CCES of two methods. (a) CCES of signals. (b) Partially enlarged view of the CCES.
Applsci 12 01414 g012
Figure 13. Balling bearing fault experiment bench.
Applsci 12 01414 g013
Figure 14. The 108th data of the database. (a) Time-domain waveform of the original signal at the drive end. (b) Frequency spectrum of the original signal at the drive end. (c) Time-domain waveform of the original signal at the fan end. (d) Frequency spectrum of the original signal at the fan end.
Applsci 12 01414 g014
Figure 15. Difference spectrum and CIM. (a) Difference spectrum of the SVD. (b) CIM between the SCs and original signal.
Applsci 12 01414 g015
Figure 16. CCES of reconstructed signals at drive end with two method.
Applsci 12 01414 g016
Figure 17. CCES of the signal at the fan end.
Applsci 12 01414 g017
Figure 18. CCES of two-channel signals.
Applsci 12 01414 g018
Publisher’s Note: MDPI stays neutral with regard to jurisdictional claims in published maps and institutional affiliations.