1. Introduction
Autonomous vehicle (AV) technologies, such as Adaptive Cruise Control (ACC) and Advanced Driver Assistance Systems (ADAS) that correspond to Society of Automotive Engineering (SAE) Level 1 or 2, have become common, if minor, components of vehicles available today [
1]. These partial vehicle automations have spurred the development of more advanced AV technologies. Consequently, drivers expect better performance and increased safety [
2]. Even with improved capabilities, AVs must operate properly to earn driver trust and acceptance [
3,
4].
However, trust is a human factor that is easily lost. If a driver does not recognize the route the AV is following or is unsatisfied with automated driving, for instance, they might take over vehicle operation, and because today’s vehicle systems can easily switch between automatic and manual modes [
5,
6,
7], often with a slight (perhaps mistaken) tap of the brake pedal or steering wheel, driver acceptance of AV technology can be lost.
In addition to performance improvements, AVs must provide context-based and intelligent information about an upcoming event (e.g., a speed bump or an accident) to earn driver trust. These feedforward alerts allow the driver to respond properly to the situation and trust that AV is assuming control for a good reason [
8]. This information must include both a description of the vehicle’s actions (i.e., ‘How’) and the reason for those actions (i.e., ‘Why’) based on its artificial intelligence (AI). When these ‘How’ and ‘Why’ messages are accompanied with varying modality types (auditory, visual, and auditory + visual), especially with multi-modality, driver trust and satisfaction with driving performance increases [
9]. As it relates to AV intelligibility—how the vehicle represents to drivers what it knows, how it knows, and what it is doing based on its AI system—trust also depends on how politely the vehicle provides the information and how well the interface mimics human behavior [
10,
11,
12,
13,
14,
15].
Besides contextual information provided by the vehicle, trust toward AVs is affected by drivers’ in-situ states, which vary with task load. As SAE Levels of Driving Automation rise from Level 0 (no automation/the driver is fully responsible for driving) to Level 5 (fully autonomous vehicle), drivers can increasingly perform various Non-Driving Related Tasks (NDRTs), each with its own task load. While performing a high-load task, that is, a task that requires continual attention such as texting or sleeping, drivers may not be available to accept intelligibility services, or information pushed from the vehicle to the driver based on contextual operation. If the AV’s warning of an upcoming long curve prevents the driver from spilling a beverage, for example, the driver will be more satisfied with the AI system. However, continuous alerts when the driver cannot attend to them will lead to an interruptive user experience. Thus, intelligibility is defined by how well the AV provides context-based and intelligent information about upcoming events according to the NDRTs that drivers are performing.
Some studies have explored how NDRTs affect user experience in AVs, though research on sleeping while driving is scarce. Yet, drivers most preferred to sleep while driving an AV (
Table 1) and decreased engagement in driving (whilst adopting a higher level of automation) could increase drowsiness and the likelihood of falling asleep [
16,
17].
Of course, one way that AVs promote driver safety is through Take-over Requests (TOR), wherein the vehicle prompts the driver to assume control. However, TORs that occur while the driver is asleep could be missed and thus lead to accidents. Therefore, to better ensure intelligibility as well as driver safety, AVs should be aware of drivers’ in-situ states, or the NDRT that the driver is performing, and intervene by providing appropriate information.
In this study, we examine how drivers react to the presentation manner of TORs provided with varying modalities and feedforward timings at the moment of waking from sleep (between subjects) and then how subjects perform when driving manually. Our experiment studies drivers during automated driving in order to identify appropriate feedforward timing and modalities for a TOR by answering the following research questions:
RQ1. How can awakened drivers negotiate a TOR situation? What, then, are the effects on drivers in this TOR situation?
RQ2. How do driving performance (i.e., the ability to regain safe control of the car) and physiological and subjective responses change based on a TOR with varying modalities and timing after waking from sleep?
RQ3. To be knowledgeable and safe in an AV, what timing- and modality-based information do drivers prefer?
2. Related Works
2.1. Non-Driving Related Tasks in Automated Driving
Since the beginning of vehicle studies, many studies have implemented NDRTs as secondary tasks [
19,
20,
21]. They have been used to induce driver distraction and increase the mental demand of driving while performing the primary task in a vehicle (i.e., manual driving), as well as in automated driving. These NDRTs can be classified as either standardized tasks that induce visual, auditory, manual, or cognitive load, such as asking the subject (driver) to count objects [
22], recall words [
23], press tiles under recall [
24], or naturalistic NDRTs, such as reading, playing games, and texting. Standardized tasks (e.g., surrogate reference task and N-back task) effectively manipulate task demands or workloads [
25,
26,
27,
28], thereby precisely inducing the targeted state in the study participants.
As AV technology improves, however, drivers will have more opportunities to disengage from driving-related tasks (manual driving) and engage in naturalistic NDRTs, such as leisure, eating, and working [
29]. Recent studies on AVs have incorporated NDRTs that drivers are more likely to engage in, for example, playing games to evaluate the TOR transition time [
30], watching videos to examine visual cognitive load in TOR scenarios [
31,
32], and sending text messages with a smartphone to evaluate TOR presentation interfaces [
33]. Employing naturalistic NDRTs increases the ecological validity of findings and enables accurate reflection of actual driver distraction; however, it is difficult to manipulate task demands or workload [
34,
35]. Therefore, as automated driving technology improves, it is necessary to design more practical NDRTs in automated driving and verify them in an in-car ecological environment.
In actual automated driving, however, NDRTs may be accompanied by external scenarios (i.e., slowly driving car ahead, long curve, traffic congestion, etc.). These external scenarios affect awareness of the situation and ‘user interruptibility’ with respect to intelligibility services, which process the availability of users to engage in just-in-time intervention in AVs [
36]. Therefore, when incorporating external scenarios and practical NDRTs, it is important to reflect on the practical situation of drivers in the era of automated driving. For example, Frison et al. confirmed the importance of external scenarios (e.g., varying road type and traffic volume) on users’ experience and acceptance of automated driving through a simulator study [
37]. Ataya et al. claimed that external scenarios (e.g., passing another car, rerouting navigation, stopping the car) and NDRTs influence the user experience through a survey (
n = 360) [
38].
To understand what kind of NDRTs are preferred among naturalistic NDRTs in AVs, Yeo et al. conducted a survey and reported that sleeping is the most preferred (
Table 1); recently, other studies have also raised the need for research on TORs while sleeping. For instance, several studies have recently reported on how drowsiness [
16] and sleeping [
17,
39,
40] affect responses to TORs. Prior research has also raised the critical question of how to handle drowsiness and even sleeping as a naturalistic NDRT in a TOR situation [
41]. Building on this prior work, we believe that examining the most preferred and naturalistic NDRT in an AV becomes critically important when a TOR situation is coupled with it, thereby we chose to examine how drivers wake from sleep when a TOR occurs.
2.2. Sleeping as an NDRT and Its Implementation
Sleeping is one of the most common NDRTs and is likely to occur during monotonous and lengthy sections of automated driving [
16,
17]. When waking from sleep in an AV, the driver is likely to experience sleep inertia, a state of increased drowsiness and hypervigilance, as well as decreased mental and physical functions, presenting new driving risks [
39,
42]. Studies on sleep inertia have examined how safely drivers resume manual driving after a TOR and how sleep inertia affects driving performance [
17,
39,
40]. It has been reported that drivers who wake up within 60 s of a TOR can safely take over and drive. While these studies explored ways to successfully take over for safe driving, our study focuses more on the presentation manner of the TOR, especially the modality type and feedforward timing.
Diverse trials and studies have been conducted to induce sleep and drowsiness in drivers. In manual driving, a number of studies have attempted to simulate either drowsiness or sleep during driving by restricting subjects’ normal sleep patterns (sleep deprivation). These methods included prohibiting sleep, conducting experiments at night [
43,
44], impairing subjects’ motor response time with alcohol [
45], or conducting the same experiment twice in one day (day and night sessions) [
43,
44,
45,
46,
47]. These methods are effective for inducing drowsiness in drivers.
Recently, there have been studies on sleep and drowsiness in drivers in automated driving, owing to the improvements in AV technology [
16,
17,
40]. Attempts to induce sleep, drowsiness, and fatigue of drivers were not different from the methodology used in manual driving. Experiments in sleep deprivation were primarily conducted when drivers were tired, at midnight or early in the morning; Vogelpohl et al. instructed drivers to sleep for up to 5 h the day before the test drive, and the experiment began at midnight [
16]. This method focuses on returning home at night in situations where there is insufficient sleep or poor sleep quality. Wörle et al. instructed test subjects to sleep up to 4 h the day before their experiment, which began at 6 a.m. [
17,
42]. These methods were used to induce drowsiness in drivers and make it easier to fall asleep.
As our experimental design requires multiple sessions to test the waking experience, we needed to induce the waking experience for several sessions. In general sleep studies, regardless of the vehicle used, Punjabi et al. and Jiang et al. used a sleep latency time of 9.5 to 12 min to induce sleep in drivers [
48,
49]. Our study adopted this sleep latency time for closing the eyes over 12 min. Additionally, to maximize cognitive demand upon waking up, a blurring effect was activated on drivers’ screens, which gradually became clearer with time [
50].
2.3. Physiological Data Role and Its Aims in Automated Driving
Higher quality intelligibility services require the AV to be aware of the driver’s physical and cognitive states, as user experience depends on the driver’s activities and states of affect and cognition. The importance of the driver’s state is known as ‘opportune moments’ to intervene [
51], or ‘user interruptibility’, which determines driver availability of intelligibility services [
36].
Various approaches for detecting a driver’s state and distraction have been developed by measuring driving performance, such as braking, steering, and other driving-related measures [
52], and by tracking eye and head position [
53,
54] and physiological responses. However, to better understand the transition and fluctuation of the driver’s state in the event and time series, we adopted a method of measuring physiological responses. Prior research has measured multi-dimensional physiological data to understand driver distractions and opportune moments for when to intervene during a TOR [
33,
55]. Du et al. examined drivers’ psychophysiological responses to TORs in different NDRTs, traffic density, and TOR-lead time conditions [
55]. Wintersberger et al. proposed an attentive user interface and evaluated whether its features precisely timed TOR notifications at task boundaries (sending a message), and showed that TOR notifications led to better TOR/NDRT performance, less stress, and higher trust/acceptance [
33].
Ultimately, the goal is to build a machine learning model to continuously monitor the driver’s state [
55,
56,
57,
58], as physiological state is a significant reference for complementary indicators of trust. Sheng et al., for instance, collected physiological data to understand the dynamic change of drivers’ trust during automation for the purpose of improving the safety and performance and automated driving [
59]. Many studies have attempted to accurately verify drivers’ physiological states and measure the degree of arousal via electroencephalography (EEG), galvanic skin response (GSR), electrocardiography (ECG), eye-tracking data, and more [
57,
60,
61] in both manual and automated driving. Heart rate (HR) is especially useful as an indicator of operator effort [
62], and GSR represents the mental workload in a driving scenario [
63,
64].
Building on this prior work, we collected driver’s physiological responses as a measure of various psychophysiological states, including arousal, cognitive load, and trust.
In this study, HR, GSR, and EEG were collected to observe patterns between the modalities and feedforward timings of TOR conditions and to better understand and interpret the subject’s situation. Unlike simple observation, sensor data confirms the subject’s in-situ condition, information with which the AV system can provide optimal information for the driving context. GSR and HR were analyzed to support our results and for triangulation.
2.4. Take-Over Requests and Situational Awareness
Unexpected scenarios can occur at any time on the road, and malfunctioning AV sensors or restricted driving environments (e.g., an unrecognized lane due to heavy rain or a construction zone) [
16] could threaten driver safety. Thus, one of the biggest challenges in automated driving research is the TOR, when the AV must transfer control to the driver.
For a safe TOR [
65] with drivers’ in-situ NDRTs [
66,
67,
68], studies have focused on finding the proper timing of feedforward notifications and methods to provide TOR information (e.g., tactile, visual, or auditory) [
69,
70,
71], as well as driver reaction time for deactivating automated driving and assuming vehicle control [
23,
24,
33,
61]. Although prior studies have investigated influences on the driver performance, such as reaction, task time, and lane deviation according to NDRTs (e.g., interacting with smartphone and entertainment console), more research is needed to determine how sleep influences driver performance when assuming vehicle control, especially after a TOR, and how effectively and safely TORs can be presented in that scenario. Further, sleeping may leave drivers unable to immediately perform at the same level as manual drivers [
32]. Indeed, recent events have demonstrated the significance of improving our understanding of this scenario. For instance, a Tesla driver was filmed asleep at the wheel as his semi-autonomous vehicle cruised down the highway [
72,
73]. This is a potentially risky real-world situation that requires greater understanding of TORs to avoid negative repercussions.
Since every NDRT carries a different task load, drivers’ situational awareness—their attention to or accurate knowledge of the driving scenario [
19]—differs when engaging in manual driving after a TOR. Situational awareness is ‘the perception (level 1) of the elements in the environment within a volume of time and space, the comprehension (level 2) of their meaning and the projection (level 3) of their status in the near future’ [
74]. Several studies that have measured situational awareness dealt with perception in Endsley’s model as the time required to look at the side mirror and speedometer measured by the time of first glance after the TOR [
16,
75,
76,
77]. Our study updates the scope of situational awareness as the time until drivers safely project after becoming aware of a situation. Drivers who quickly glance at the side mirror and speedometer but do not act, do not successfully complete the take-over; non-action could carry significant safety risks. Therefore, in order to guarantee that the driver has achieved the projection, the time for deceleration leading to ‘performance of action’ was counted in parallel with a TOR based on the time it took for the driver to observe the speed limit.
3. Exploring Take-Over Requests When Waking from Sleep
This study examines the sleep-based scenario as potentially the most preferred and critical NDRT, research that we consider a first-of-its-kind study. Typical studies of TORs focus on when and how drivers can take over an AV and drive safely. TOR studies on sleeping drivers so far, however, have focused on identifying not the presentation manner but how long it takes for an awakened driver to negotiate a TOR situation and drive safely. Instances where a TOR abruptly occurs due to malfunction or external environment can be fatal, especially for sleeping drivers. Hence, the goal of this study is to examine how drivers react to a TOR provided with varying modalities and feedforward timings when they wake from sleep and must perform manual driving. The following illustrates the experimental design of this study.
3.1. Apparatus
3.1.1. Driving Simulation Setup
Automated driving was performed on a high-fidelity driving simulator by reflecting motion forces toward the driver’s seat to convey the feeling of real driving [
50,
78] (
Figure 1). The driving scene was displayed on three side-by-side 32” monitors (5760 × 1080) with seamless 144 Hz resolution. To implement manual driving after the TOR, our simulator was equipped with a steering wheel and brake and accelerator pedals (Logitech G920). The built-in red button on the steering wheel was coded to deactivate automated driving and thus enable manual driving.
3.1.2. AV Design
In this study, we establish SAE Level 3 (conditional automation) [
79] to implement a TOR situation at a construction zone where driving authority can be transferred from vehicle to driver. As driver trust is important in AVs, assistive as well as intuitive interfaces should be considered in AV design. To minimize split-attention and the degradation factor of user experience (UX) for the interaction between drivers and information, all visual information was provided with a HUD. Moreover, the remaining time encouraging deactivation of automated driving after a TOR was displayed on the left side of the driver’s field of view with a radial progress bar to assist in TOR [
80,
81] (
Figure 1). Furthermore, to enable greater intelligence in supporting interaction services, guidelines for human and AI interaction were applied to our simulated AV. Before beginning, for example, the AV politely explained the functional operations that it could perform through the TTS system. Contextually relevant information was provided based on the driver’s current environment [
82].
3.1.3. Physiological Sensors Setup
Physiological data including EEG, HR, and GSR were collected at 500 Hz using the Cognionics data acquisition software. Physiological signals and trigger time were sent from an EEG headset to the data acquisition software on a PC via Bluetooth. Among physiological sensors, the collection of EEG data was intended for (i) sleep stage classification, and (ii) measurement of driver cognitive load and trust. However, unlike using wet electrodes in a static environment, the dry EEG amplified the effect of a motion artifact. Thus, EEG data were not included for further analysis and only GSR and HR data were used as complementary indicators.
3.2. TOR Delivery Conditions
The experiment was counterbalanced across subjects with a 3×2 design (Types of modality: (i) auditory, (ii) visual, (iii) auditory + visual) × (Feedforward timings before TOR: (i) 5 s, (ii) 10 s). A between-subject design was used to better control the learning effect on our sleeping scenario and to minimize the time required to participate in the experiment as well as the boredom, disengagement, and inattention that accompanies continuous sleeping simulation.
The choice of 5 s and 10 s as feedforward timings before TORs is to study the message delivery in urgent scenarios. Whether the situation is urgent or non-urgent is determined by the time given to complete the take-over. This classification, consequently, affects the take-over completion time. For instance, the driver who received 8 s to complete the take-over completed it in 5 s, and the driver who received 45 s completed it in 15 s [
83]. In another study, when a sleeping driver was given up to 60 s, which corresponds to a non-urgent situation, approximately 25 s was enough time to complete the take-over [
17,
40]. However, in unexpected scenarios, take-overs can only be requested urgently, and the time required for sleeping drivers to take over in those situations may differ from the results of previous studies. Urgent TOR scenarios, despite their importance, have not been as widely explored as those of non-urgent situations. In our experiment, the feedforward timings were set to be delivered 5 s and 10 s before, which was designed for urgent TORs at the moment of waking from sleep.
Feedforward timings were assigned to each modality session alternatively. With the above six conditions, the AV provided a TOR with the assigned modality and feedforward timing as an AV approached a construction zone; inside the construction zone, traffic cones were placed in a twisting pattern at 3 m intervals to create a demanding situation (
Figure 2).
3.3. Proactive Message Design
3.3.1. Notification Sound
A notification sound accompanied all messages and was provided before both auditory and visual messages to signal the importance of upcoming events [
84]. Two notification sounds were designed: a non-urgent sound (e.g., when the driver receives a text message) and an urgent sound that repeatedly cycles between high and low amplitudes, similar to a siren ((1) in
Table 2). Non-urgent sounds were provided in all events except the urgent TOR event.
3.3.2. Visual Message
In consideration of the limitations to driver memory, the TOR visual message consists of a ‘How’ message with a pictogram and a ‘Why’ message with a small amount of text ((2) in
Table 2). ‘How’ message pictograms were selected to represent frequently performed behaviors (e.g., acceleration, deceleration, etc.), which are part of driver long-term memory [
85], and were designed based on common pictograms to support drivers’ quick interpretation [
31]. ‘Why’ messages were provided textually because drivers cannot realistically remember pictograms for all possible situations—due to their short-term memory—and while the pictograms that support ‘How’ messages represent frequent behaviors, there are too many reasons why drivers would need to complete a TOR, and thus attempting to provide visual cues for each situation could cause confusion.
3.3.3. Auditory Message
In order to prevent the UX element from failing in terms of providing service, an auditory message was designed based on honorifics [
10]. Considering that trust can be directly related to the quality of intelligibility, providing speech-based information is important [
86,
87]. Messages provided in the experiment used a text-to-speech (TSS) program ((3) in
Table 2). A notification sound was provided first, followed by auditory messages.
4. Participants
Our sample included 31 subjects (age: M = 23.3; SD = 3.2, gender ratio: male = 22; female = 9) between 18 and 30 years old, recruited through a Social Network Service (SNS) for students, researchers, and nearby residents as a voluntary application. Experiment participation was restricted to subjects with a driver’s license; those with more driving experience were preferred. Their driving experiences ranged from 0 to 10 years (0–2 years = 19; 3–4 years = 5; 5–10 years = 7). After completing all experiment sessions, subjects were paid USD 17 for participation. The study was approved by the Institutional Review Board.
5. Procedure
Upon visiting the laboratory, recruited subjects were provided with a detailed introduction to the experiment. Then, a learning session was performed to acquaint subjects with samples of modality-based messages and manual driving for familiarity with our driving simulation testbed. They were asked to fill out a demographic questionnaire, which included basic questions, such as name, age, gender, and occupation. The questionnaire also asked whether subjects had experience using automated driving functions (i.e., ACC, ADAS) and how far they drove each year. Data from demographic questions were not utilized for further analysis. While filling out a survey, EEG, GSR, and HR sensors were attached on the scalp, palm, and earlobe in advance for the stabilization of data collection, and then the experiment began.
Driving began on an urban road with 1.5 min of automated driving to allow the subjects to become familiar with the automation, followed by a monotonous road. A sleeping driver who attempts to wake up and perform tasks immediately is challenged by eye discomfort and pain due to light exposure (photophobia) and a temporary inability to see objects clearly due to sleep inertia (visual degradation). To elicit photophobia and approximate the experience of visual degradation during the sleep scenario, the driver was asked to wear a sleep shade and the screen showed a blurry effect that faded gradually (~8 s) during the TOR [
50]. Hence, with a feedforward timing of 10 s, study participants could clearly see the road conditions, whereas with a feedforward timing of 5 s, their vision would be less clear but gradually become clearer over the next 3 s.
While wearing the sleep shade, subjects were instructed to close their eyes comfortably and try to sleep. The time for wearing a sleep shade was defined in regard to sleep latency, the amount of time it takes to go from being fully awake to sleeping. Punjabi et al. examined the association between multiple sleep latency tests, an objective measure of daytime sleep trends in the general population (a sample of 261 females and 371 males), with a sleep latency time of up to 12 min [
48]. Jiang et al. set a sleep latency of more than 9.5 min to investigate physiological effects [
49]. Hence, our study chose a longer duration based on the prior literature and set the time as 12 min wearing a sleep shade.
After 12 min, the AV provided a TOR message at the construction zone. To prevent participants from ignoring the TOR, we designed a two-fold message: a notification sound followed by a TOR message with varying modalities. The notification alarm alerts participants that the vehicle will soon deliver information. Before the experiment, we asked participants to remove the sleep shade as soon as they heard the notification sound that preceded the TOR message and lasts for 2 s. After removing the sleep shade, drivers deactivated the automated driving by pressing a red button on the steering wheel, maintaining a central position between the winding traffic cones through the construction zone. Lane deviation and number of traffic cones hit were used to measure distraction and violation. After finishing the course, the vehicle informed the driver that it could resume automated driving. The AV then drove approximately 1.5 min to give the driver a short rest before resuming the study session. After completing each session, subjects were instructed to fill out the interim questionnaire for machine acceptance (an indicator of trust) [
8] and NASA-TLX (an indicator of workload). This process was repeated three times with different modality types, and the experiment was finished with a post-experiment questionnaire that ascertained subjects’ experiences.
6. Evaluation Metrics
To observe drivers’ behavioral and empirical responses under the TOR situation in a sleep-based scenario, multidimensional measures were collected to indicate each driver’s condition—such as driving performance, subjective response, and physiological data—with the assigned condition. These measures were collected to identify driving stability, the proper feedforward timing to deactivate automated driving, and the time taken by the driver to become aware of a situation after the TOR.
The time required to accept the TOR was measured to find the safe feedforward timing for drivers asleep at the wheel. Lane deviation was measured to ascertain how safely drivers drove through the construction zone while maintaining a central position between the winding traffic cones. The deviated distance from the central position is as below:
where
x1 and
y1 are the coordinates of central position between winding traffic cones,
x2,
y2 are the midpoint coordinates of AV; the shorter the deviated distance, the safer the driving.
The number of traffic cones that drivers hit was counted. As a driving quality measure for TOR and situational awareness, time to situation awareness was defined as the time from the TOR beginning until the driver starts to drive under the posted speed limit of 30 km/h. We measured time for ‘performance of action’, which follows level 3 situational awareness and participant’s decision to guarantee that participants achieved level 3 situational awareness in Endsly’s model.
For the subjective responses, machine acceptance as the trust indicator and NASA-TLX as the workload indicator were collected through interim questionnaires and individual experiences. Preferences were collected through a post-experiment questionnaire. The questionnaire, developed by CHIMe Lab at Stanford University, ranks machine acceptance on a 7-point Likert scale using adjectives such as ‘Intelligent’, ‘Helpful’, ‘Dominant’, and ‘Reliable’. These adjectives were tested for reliability using Cronbach’s
α (
α = 0.73), which dictates that items are closely related as a group and acceptable for internal consistency if the alpha value is over 0.7. With an average score of adjectives, trust toward AV could be assessed. For the complementary indicator of the driver’s state, physiological data, such as GSR and HR, were collected [
59]. The evaluation metrics collected are as follows.
Driving performance
Reaction time: time taken to deactivate automated driving;
Lane deviation: deviation distance from the midpoint;
Collision: number of traffic cones hit;
Time to situation awareness: time from the TOR until the vehicle speed falls below the speed limit.
Interim questionnaire
Physiological responses
7. Result
All subjects were provided with the assigned TOR conditions: timing of (i) 5 s and (ii) 10 s and modalities of (i) auditory (A), (ii) visual (V), and (iii) auditory + visual (A+V). While engaged in manual driving, driving performance and physiological and subjective responses were collected. Statistical analyses, such as independent sample t-test and one-way ANOVA, were used for driving performance, self-reported questionnaires, and physiological data between conditions to examine the drivers’ behavioral and empirical responses in various perspectives: influences of feedforward timings and modality types focused on the mean comparison between timings, modalities in each timing, and comparison of a single modality with each timing. Behavioral and subjective measures are illustrated in a graph divided into two parts; the section left of the dotted line denotes a comparison between timings and the section to the right includes the types of modalities.
7.1. Driving Performance
7.1.1. Reaction Time
Both feedforward timing and modality type of the TOR are less likely to influence reaction time. Drivers deactivated automated driving without weighted features on either feedforwarding timings or modality types (
Figure 3). There were no significant differences between each feedforward timing; before 5 s (
M = 3.77,
SD = 1) and 10 s (
M = 4.14,
SD = 1.16);
t(30) = −0.97,
p = 0.34 and modality type;
F(2,45) = 0.48,
p = 0.62 for 5 s and
F(2,45) = 0.62,
p = 0.54 for 10 s. This implies that neither the feedforward timing nor the type of modality account for the faster reaction time to deactivate the automated driving. However, when the TOR is provided before 10 s, drivers deactivated automation in under 5 s, possibly because they were afforded more time to do so and spent more time becoming fully aware of the situation.
7.1.2. Lane Deviation
In AV studies, deviation from the center of the lane is a common measure of driving performance. Drivers with a TOR of 10 s (
M = 0.56,
SD = 0.22) drove with 48% less deviation from center than those with a TOR of 5 s (
M = 0.83,
SD = 0.27);
t(28) = 3.01,
p = 0.005 (
Figure 4). However, there was no statistically significant difference between modalities in each timing;
F(2,42) = 0.89,
p = 0.42 for 5 s and
F(2,42) = 0.46,
p = 0.63 for 10 s. The only significance in detail was between the auditory + visual modality in each timing. Drivers who were provided with a TOR of 10 s performed safe driving better than in the 5 s condition;
t(28) = 3.65,
p = 0.001. These data indicate that contributions in the 10 s condition were significantly better, by 85%, than the 5 s condition while using the auditory + visual modality.
In other words, lane deviated distance for both auditory modality and visual modality were not very different between feedforward timings. This indicates that uni-modality (auditory modality and visual modality) induced safer manual driving than the multi-modality because uni-modality requires less information processing.
During the experiment, some drivers experienced difficulty in safely staying in the lanes because the feedforward timing of 5 s was too short. Two subjects failed at deactivating the automated driving after a TOR and were not included in the analysis. These participants did notice the TOR scenario and reacted to the situation, but they pressed a button other than the deactivation button and failed to take-over. Because these participants simply confused which button to press, but still managed to press a button, we believe their failure is not due to time scarcity or deactivation modality. Rather, we believe temporary cognitive decline induced by sleep inertia hindered their successful take-over.
7.1.3. Collision
Drivers with a TOR of 10 s drove through the construction zone safer at 35% more than 5 s; 5 s condition (
M = 9.11,
SD = 1.17) and 10 s (
M = 6.73,
SD = 1.55);
t(28) = 4.75,
p = 0.000 (
Figure 5). The number of traffic cones hit illustrates the level of driver violation and distraction and showed more weighted tendencies with the lane deviation measure.
Significant differences between each feedforward timing were found mainly in auditory (p = 0.005) and auditory + visual (p = 0.000) conditions, though not in the visual modality. This signifies that drivers with the auditory modality and the auditory + visual modality were highly influenced by the feedforward timing whereas drivers with the visual modality were not. This implies that even if a TOR was provided 5 s before, drivers could safely navigate the road with the same performance at the 10 s condition.
Unlike other driving performance metrics, the only difference in performance between modalities was found in collision. In the 5 s condition, there was a significant difference between modalities; F(2,42) = 7.1, p = 0.002 and drivers with the visual modality performed manual driving at 35% better than the auditory modality (p = 0.019) and at 44% better than the auditory + visual modality (p = 0.003). This implies that visually provided information was effective in terms of safety.
7.1.4. Time to Situational Awareness
Drivers with a TOR of 5 s took 27% less time to become aware of the situation than participants who received a TOR of 10 s; 5 s condition (
M = 6.1,
SD = 0.67) and 10 s (
M = 8.4,
SD = 1.49);
t(28) = −5.45,
p = 0.000 (
Figure 6). We believe this is because a 5 s condition increases temporal demand and puts pressure on the driver, thereby reducing the time it takes to become aware of the situation. In other words, drivers who received a TOR of 10 s would negotiate the situation relatively more relaxed than those who received a TOR of 5 s.
However, there was no significant difference between modalities in each timing; F(2,42) = 1.94, p = 0.16 for 5 s and F(2,42) = 1.03, p = 0.36 for 10 s whereas there were significant differences between all identical modalities in each timing; between auditory, visual, and auditory + visual modalities; t(28) = −2.16, p = 0.039, t(28) = −4.04, p = 0.000, t(28) = −2.37, p = 0.025. This implies that drivers with the 10 s condition spent more time becoming aware of the situation in general regardless of modality type.
In addition, drivers with the visual modality showed the most significant difference between feedforward timings compared to other modality conditions because visual information processing requires less time than auditory information, thereby helping drivers become aware of the situation more quickly. On the other hand, both the auditory modality and auditory + visual modality, where auditory information processing is inherent, requires more time because auditory information is acquired continuously.
7.2. Interim Questionnaire
7.2.1. Machine Acceptance
When it comes to trust, as measured by the machine acceptance questionnaire, neither modality nor timing elicited any statistically significant differences. There was no significant difference between the average scores of modalities for the 5 s condition (
M = 4.31,
SD = 0.72) and 10 s (
M = 4.39,
SD = 0.67);
t(30) = −0.33,
p = 0.74 (
Figure 7). Trust was highest in both timings when information was provided visually. However, there was no significant difference between modalities in each timing;
F(2,45) = 0.01,
p = 0.98 for 5 s and
F(2,45) = 0.38,
p = 0.68 for 10 s. This implies that driver trust toward the AV is less likely to be influenced by how the information is provided.
7.2.2. NASA-TLX
More workload was induced for the 5 s timing than for 10 s, but there was no significant difference between the average workload of modalities for providing messages 5 s in advance (
M = 69.54,
SD = 9.11) and 10 s (
M = 67.35,
SD = 10.08);
t(28) = 0.62,
p = 0.54 (
Figure 8). There was also no significant difference between modalities in each timing;
F(2,42) = 0.16,
p = 0.85 for 5 s and
F(2,42) = 0.1,
p = 0.9 for 10 s. This implies that driver workload is less likely to be influenced by how the information is provided.
7.2.3. Appropriateness of Feedforward Timing
Scores on each feedforward timing of the TOR were collected in the post-experiment questionnaire. Subjects were asked about whether they could distinguish between the feedforward timing for 5 s and 10 s. Those who answered affirmatively were then asked about the appropriateness of each timing, using a 7-point Likert scale. Approximately 71% of total subjects could distinguish between feedforward timings of 5 s and 10 s (
Figure 9). There was a significant difference in the scores for 5 s (
M = 1.77,
SD = 0.92) and 10 s (
M = 5.64,
SD = 1.05);
t(21) = −13.729,
p = 0.000. This indicates that the average score of 10 s was viewed positively between ‘Slightly Agree’ and ‘Agree’, whereas the TOR of 5 s was negatively assessed between ‘Strongly Disagree’ and ‘Disagree’. Hence, in the scenario where the vehicle issues a TOR and the driver is awakened from sleep, the AV should notify the driver at least 10 s before the event.
7.3. Physiological Responses
During the entire session, GSR and HR were measured to observe the transition of the driver’s condition and compare vehicle intelligibility for complementary indicators. To observe the effect between modality types and feedforward timing, analysis was performed from the 5 s before the TOR to 15 s after the TOR. Both GSR and HR responses from all test subjects were averaged by time and represented in the graph. GSR was collected with Ohm units but generalized to Siemens (S); HR was collected with beats per minute (bpm). Physiological data are illustrated in the graph, and the same timing categories are denoted by rectangular or circular markings: Lines with rectangular markings represent the messages 5 s before and lines with circular markings represent 10 s (
Figure 10,
Figure 11 and
Figure 12). Delta means were calculated to best describe the difference between before-and-after events by subtracting the interval of −5 s to 0 s from the interval of 0 s to 15 s (
Table 3) [
88].
7.3.1. Variation of Galvanic Skin Responses
Remarkable responses were found within the 5 s condition (
p = 0.014), and the visual (
p = 0.033) and auditory + visual modalities (
p = 0.031) were significantly higher by approximately 7.3 and 6.1 times, respectively, than the auditory modality through a Dunnett T3 post hoc test (
Figure 10,
Table 3). Due to not being engaged in manual driving, or more specifically the connected state of physical and cognitive attention, GSR data increased significantly in comparison when t = −5. Red lines with rectangular markings were illustrated as being high compared to lines with circular marking because the 5 s condition was demanding to negotiate a critical TOR.
For further analysis, the average of modalities with regard to the 5 s and 10 s conditions is illustrated below (
Figure 11). This indicates that drivers with a TOR of 5 s experienced arousal. The orange line with the rectangular markings was highest, which indicates that drivers provided with only the visual modality had the highest GSR level when compared to other conditions, followed by the red line with the auditory + visual modality, which indicates that drivers provided with the message that accompanies visual modality experienced high workload [
89].
7.3.2. Variation of Heart Rate
The results demonstrated a similar waveform that increases after the TOR with an increase of GSR linearly, but variations in HR were not remarkably different between 5 s (
p = 0.45) and 10 s (
p = 0.72) or even modalities through a Dunnett T3 post hoc test. Compared to the TOR (
Figure 12), the GSR waveform (
Figure 10) shows that HR was delayed by approximately 5 s relative to GSR due to its characteristics. After 5 s, HR increased linearly beyond 15 s. However, HR was not an indicative measure and did not show the difference before-and-after a TOR compared to GSR data [
88,
90].
8. Discussion
In this study, we examined awakened drivers’ behavioral and empirical responses to our experimental conditions and how these conditions relate to the safety of TORs. As sleeping is the most preferred NDRT, we focused on each driver’s moment of waking in response to a TOR, thereby furthering research on a necessary issue.
Several studies have been recently conducted concerning TORs when drivers are awakened from sleep (
Table 4). The differences between our study and previous studies are: (i) previous studies focused on how driving performance varies with elapsed time after waking up (TOR), and (ii) we mimicked the waking up experience for several sessions, by adopting a substitutional method to reproduce the moment of waking from sleep. This study identifies how to properly provide information in an AV and the appropriate feedforward timing for a TOR in a sleep-based scenario. To examine these issues and better account for driver experience, significant matters such as feedforward timing and modality type of information delivery were analyzed, focusing on influences toward the driver under a TOR scenario.
8.1. Effect of Feedforward Timing between 5 s vs. 10 s
Driving-performance-related evaluation metrics, such as number of collisions, lane deviation, and time to situational awareness, showed that drivers could safely negotiate the TOR in 10 s better than in 5 s. In contrast, measures such as reaction time and self-reported measures, including trust and workload, did not show significant differences between timings. This indicates that, as Vogelpohl et al. point out, reaction time may not be a reliable measure of a successful TOR transition as automation deactivation itself does not represent full transition back to manual driving [
16]. Furthermore, subjective ratings may not be precise enough to distinguish between the two conditions, even though driving performance differed significantly. Hence, for safe driving, the importance of driving performance measures and time to situational awareness precedes that of subjective measures in designing intelligibility services in AVs.
8.2. Effect between Modalities
According to most evaluation metrics, drivers could not significantly distinguish between modality-based information due to being highly focused on the urgent and demanding situation. The reason for this overall non-significant result could be because drivers were more focused on the impending TOR event rather than the information, which thus implies that drivers were less likely to be influenced by modality types. The only significant difference among modalities was found on ‘collision’ within the 5 s condition, where visual modality positively affected safety. This seems to be because hitting traffic cones was an impactful violation and thus an intuitive measure compared to other evaluation metrics.
Even though the participants’ visual channel had been handicapped by the photophobia effect and visual degradation after removing the sleep shade, which in turn induced higher cognitive load, the visual message led to better driving performance after TORs than the auditory message. We believe this is due primarily to the time difference required to provide a TOR between the two modalities. In our experiment, the visual message delivered complete information immediately, whereas the auditory message took 5 s to complete. Since a TOR request imposes on drivers a high temporal demand, this difference of a few seconds can affect driver experience. Consequently, although the auditory channel has more leftover capacity during driving, which is mainly a visual activity, the visual modality can convey information more quickly and thus induce better driving performance, as measured by the number of collisions.
8.3. Interpretation of Reaction Time and Situational Awareness
Drivers deactivated the automated driving subjectively—some drivers acted promptly whereas others did so leisurely, and thus reaction times within the 5 s and 10 s conditions were not significantly different from each other. Situational awareness, however, showed that drivers who were provided with a TOR of 10 s spent more time becoming aware of the situation than 5 s, though both reaction time and situational awareness were measured from the same starting point. Drivers with a TOR of 5 s deactivated the automated driving without becoming fully aware of the situation because the TOR was impending. This implies that at least 10 s or more is suitable for safely taking over the driving authority and becoming fully aware of the situation.
Visual information was best for situational awareness because drivers could quickly process it and thus use more time to become aware of the situation. Conversely, even though multimodal information can facilitate perception of information more effectively [
91,
92], auditory and auditory + visual information continuously provided information which took more time to fully transfer and thus slowed situational awareness. Therefore, AVs should provide concise and short information—predefined protocol or differentiated signal/sound—in an impending situation to support manual driving.
8.4. Physiological Responses
The rise in the average level of GSR after the zero reference was remarkably higher with visual and visual + auditory modalities than with just the auditory modality, especially at the 5 s condition. This result indicates that visual messages aroused the driver more than auditory messages alone. We assume this difference in arousal arises from sleep inertia-induced photophobia and visual degradation effects. The photophobia effect and visual degradation after waking seem to have hindered visual cognitive processing, imposing additional load and stress to the drivers.
However, in 10 s cases, there was no significant difference between modalities. As visual degradation, which diminishes over time, is equally set for both timing conditions, drivers had more time and clearer vision to cope with the situation at the 10 s condition. We believe this is the main reason behind the non-significance: Drivers could see the message relatively clearly after visual degradation was relieved, and the modality effect, consequently, had been equalized in the 10 s condition.
8.5. Relation between Driving Time and Sleep Inertia
Our study connects to the previous literature on sleep and TOR [
17,
40], extending the findings from previous works by focusing on urgent TOR situations. Wörle et al. examined TOR feedforward timing conditions of (i) 60 s [
17] and (ii) 15 s [
40] through subsequent studies. Both studies evaluated driving performance after a TOR with recorded videos. The performance measure of a TOR provided 15 s before an event was comparable to that of the TOR delivered 60 s before, for a more extended period [
40]. However, the findings of our study revealed that drivers might suffer from low driving performance when the message is delivered less than 10 s in advance.
Our study concentrates on the moments immediately after waking, while Wörle et al. focus more on longer-term recovery from sleep inertia. Sometimes, AVs may request a take-over urgently, regardless of the driver’s sleep condition. TORs in such urgent circumstances are as important, if not more so, than typical TOR situations. Thus, we set the driving time after a TOR to be 1 min in duration, paying more attention to the time when the sleep inertia-induced cognitive decline is the most severe. In conjunction with previous studies, we believe our study results can inform AV design regarding delivery of TOR messages in urgent scenarios. Our study contributes new knowledge of the TOR situations when a car faces emergencies and the driver is sleeping.
9. Limitations
9.1. Adoption of Sleep-Based Scenario
Even though our novel method was robustly designed in terms of the physical and cognitive experiences of drivers, it has several limitations before it can be applied to an experiment testbed. First, the method that we adopted in this study is neither verified nor generally used in this field, whereas many studies adopted a sleep deprivation method to induce sleep. To better control our experimental conditions and prevent collection of deteriorated data from repeated sleep deprivation methods following the number of conditions, we need a better way that enables repeated experimental design and mimics the moment of waking. Since our study deals with the situation at the moment of waking from sleep, we decided to set 12 min of wearing a sleep shade for the sleep latency time following studies that implemented the sleep situation [
48,
49].
Second, although our sleeping method mimics a sleep situation with high fidelity, it should be tested to determine if it can effectively replace actual sleep. An attempt was made to measure EEG to identify distinctive waveforms generated by sleeping drivers. However, the frequency of impact between the driver’s head and the headrest complicated collection attempts.
Lastly, instead of blocking light with a sleep shade to induce eye discomfort, utilizing virtual reality or controlling light in the test space should be considered with regard to reaction time. Moreover, the experiment was conducted with a laboratory-based driving simulator, which may have influenced the immersiveness of such a demanding situation. However, a driving environment is simpler in a simulator study than in the real world, where drivers must cope with a large number of events; the amount of overall information processing required of a driver is less in the simulator [
93]. Furthermore, experimental factors were intensively implemented in this concisely simulated setting. Therefore, we believe that our simulation study can substitute for real-road experiments presenting equivalent results and implications, and at the same time avoid hazardous issues from a real-road experiment, such as a situation where a driver must negotiate a TOR situation after taking off a sleep shade in the real world.
9.2. Motion Artifact and Noise in Electroencephalography (EEG) Signals
Based on the existing literature, we included an EEG headset in our experimental setup to measure driver sleep stages [
94,
95], cognitive load [
96,
97], and trust [
98,
99,
100,
101]. However, the EEG data were not included for analysis since frequent motion hindered our ability to obtain reliable data from the dry electrodes. Our experimental settings to ensure ecological validity, such as muscle movements to take off the sleep shades or head bumps on the headrest during driving, generated motion artifacts frequently. Another major source of noise signals was shifts of electrode positions after driving-related movements [
102]. These shifts were exacerbated by using dry electrodes which do not adhere to skin as well as wet electrodes [
103]. We suspect that a wet electrode EEG attached to the participant’s scalp would relieve the issue of signal quality, and thereby allow sleep-stage classification and reliable measurement of cognitive load and trust in ecologically valid settings.
9.3. Necessity of Alternative Survey for Subjective Measures
Inquiring about subjective experiences of trust and workload could be inappropriate for the TOR delivery condition. It was difficult to evaluate driver experiences while recognizing the fact that the empirical factors were caused by the intelligibility of AV because drivers had been highly immersed in taking over driving authority and performing manual driving with urgency after the sleep-based scenario. Perhaps a post-experiment survey cannot accurately reflect driver experiences; rather, adopting a real-time evaluation method (e.g., contextual inquiry) or dividing the survey into sub-dimensions could better represent the driver experiences.
10. Conclusions
We investigated how driving performance, perceived task workload, AV acceptance, and physiological responses vary so as to present a guide and manner in which to align intelligibility services for take-over request alerts that are appropriate to wake a driver from sleep and the take-over scenario with the greatest needs. Drivers awakened by a take-over request alert delivered >10 s prior to an event were more focused on the driving context regardless of the presentation manner (i.e., situation awareness aid). The >10 s take-over request alert allowed drivers more time to adapt to situations with the highest demand. On the other hand, even take-over request alerts delivered within 5 s, if designed with an appropriate presentation modality, significantly reduced the time drivers needed to safely adapt to situations while maintaining equivalent levels of autonomous vehicle acceptance and perceived task workload to take-over request alerts delivered in >10 s. In particular, unlike take-over request alerts delivered in >10 s, a visual accompaniment was critical for a safe take-over request delivered in <5 s. Data on physiological arousal also reveal that visual or visual + auditory take-over request alerts are more efficient in higher temporal demand situations (i.e., when delivered at fewer than 5 s rather than at greater than 10 s), which helps drivers switch quickly to more attentive manual driving.
This study contributes to understanding the influence of take-over requests at the moment drivers wake from sleep, thereby delivering guidelines regarding take-over requests in autonomous vehicles, focusing on when (feedforward timing) and how (modality type) to inform drivers who wake from sleep. This research will support safer take-over requests in conditional automation (level 3). Far beyond level 3, in higher automation (level 4~5) where intelligibility services and non-driving related services are prevalent, this will also contribute to the improvement of the manner and guidelines for when and how to best inform drivers who wake from sleep in autonomous vehicles. This knowledge will be useful for car developers who wish to design autonomous vehicles that best comply with the safest guidelines for take-over requests aimed at sleeping drivers. This will also assist researchers in conducting further in-depth research, as shown in future works below.
The current study sets out some avenues for future work. First, the foci of this study are situations where take-over requests occur and drivers wake from sleep. We will conduct more take-over request studies by extending to other non-driving related tasks, such as eating/drinking, using media, and having a conversation with passengers, thereby comparing how drivers in various situations react to take-over requests. This enhances the manner in which an autonomous vehicle can provide take-over requests that consider drivers’ in-situ situations (e.g., non-driving related tasks and the driver’s physical state and distraction based on sensor data) and enables development of an intelligent system to adaptively support driver-centered take-over requests in autonomous vehicles. Secondly, as a means of implementing an intelligent system, development of a machine learning model to automatically classify ‘user interruptibility’ is required. Hence, we will develop a machine learning model for evaluation metrics that were collected in this study (e.g., driving performances, physiological responses, and other feature extraction from video recordings). Lastly, this study is expected to be beneficial in its field for its exploration of drivers’ reactions to take-over requests in enhanced reality (e.g., actual vehicle) and for elements of its experimental design, such as sleep by time difference.
Author Contributions
Conceptualization, W.K., E.J. and S.K.; methodology, W.K. and E.J.; formal analysis, W.K. and E.J.; writing—original draft preparation, W.K., E.J., G.K. and D.Y.; writing—review and editing, W.K., E.J., G.K., D.Y. and S.K.; supervision, S.K. All authors have read and agreed to the published version of the manuscript.
Funding
This research was supported in part by the National Research Foundation of Korea(NRF) funded by the MSIT(2021R1A4A1030075), and in part by the Korea Institute of Energy Technology Evaluation and Planning(KETEP) and the Ministry of Trade, Industry & Energy(MOTIE) of the Republic of Korea (No. 20204010600340).
Institutional Review Board Statement
The study was conducted according to the guidelines of the Declaration of Helsinki, and approved by the Institutional Review Board of Gwangju Institute of Science and Technology. (Protocol code 20190906-HR-47-03-02, approved on 9 June 2019).
Informed Consent Statement
Informed consent was obtained from all subjects involved in the study.
Data Availability Statement
The data presented in this study are available on request from the corresponding author.
Conflicts of Interest
The authors declare no conflict of interest.
References
- Naus, G.; Vugts, R.; Ploeg, J.; Van de Molengraft, M.; Steinbuch, M. Towards on-the-road implementation of cooperative adaptive cruise control. In Proceedings of the 16th World Congress and Exhibition on Intelligent Transport Systems 2009, Stockholm, Sweden, 21–25 September 2009. [Google Scholar]
- Helgath, J.; Braun, P.; Pritschet, A.; Schubert, M.; Böhm, P.; Isemann, D. Investigating the effect of different autonomy levels on user acceptance and user experience in self-driving cars with a VR driving simulator. In Proceedings of the International Conference of Design, User Experience, and Usability, Las Vegas, NV, USA, 15–20 July 2018. [Google Scholar]
- Choi, J.K.; Ji, Y.G. Investigating the importance of trust on adopting an autonomous vehicle. Int. J. Hum.-Comput. Interact. 2015, 31, 692–702. [Google Scholar] [CrossRef]
- Rödel, C.; Stadler, S.; Meschtscherjakov, A.; Tscheligi, M. Towards autonomous cars: The effect of autonomy levels on acceptance and user experience. In Proceedings of the 6th International Conference on Automotive User Interfaces and Interactive Vehicular Applications, Seattle, WA, USA, 17–19 September 2014. [Google Scholar]
- Forster, Y.; Hergeth, S.; Naujoks, F.; Krems, J.F.; Keinath, A. Empirical validation of a checklist for heuristic evaluation of automated vehicle HMIs. In Proceedings of the International Conference on Applied Human Factors and Ergonomics, Washington, DC, USA, 24–28 July 2019. [Google Scholar]
- Vogelpohl, T.; Kühn, M.; Hummel, T.; Gehlert, T.; Vollrath, M. Transitioning to manual driving requires additional time after automation deactivation. Transp. Res. Part F Traffic Psychol. Behav. 2018, 55, 464–482. [Google Scholar] [CrossRef]
- Wiedemann, K.; Naujoks, F.; Wörle, J.; Kenntner-Mabiala, R.; Kaussner, Y.; Neukum, A. Effect of different alcohol levels on take-over performance in conditionally automated driving. Accid. Anal. Prev. 2018, 115, 89–97. [Google Scholar] [CrossRef] [PubMed]
- Koo, J.; Kwac, J.; Ju, W.; Steinert, M.; Leifer, L.; Nass, C. Why did my car just do that? Explaining semi-autonomous driving actions to improve driver understanding, trust, and performance. Int. J. Interact. Des. Manuf. 2015, 9, 269–275. [Google Scholar] [CrossRef]
- Kim, W.; Cho, K.; Kim, M.; Yeo, D.; Lee, J.; Kim, S. A Study on Driver’s Attitude according to Combination of Modality and Message Type in Providing Driving Information in Autonomous Driving. In Proceedings of the HCI Korea, Jeju, Korea, 13–16 February 2019. [Google Scholar]
- Ruijten, P.A.; Terken, J.; Chandramouli, S.N. Enhancing trust in autonomous vehicles through intelligent user interfaces that mimic human behavior. Multimodal Technol. Interact. 2018, 2, 62. [Google Scholar] [CrossRef] [Green Version]
- Lim, B.Y.; Dey, A.K.; Avrahami, D. Why and why not explanations improve the intelligibility of context-aware intelligent systems. In Proceedings of the SIGCHI Conference on Human Factors in Computing Systems, Boston, MA, USA, 4–9 April 2009. [Google Scholar]
- Bellotti, V.; Edwards, K. Intelligibility and accountability: Human considerations in context-aware systems. Hum.–Comput. Interact. 2001, 16, 193–212. [Google Scholar] [CrossRef]
- Abdul, A.; Vermeulen, J.; Wang, D.; Lim, B.Y.; Kankanhalli, M. Trends and Trajectories for Explainable, Accountable and Intelligible Systems: An HCI Research Agenda. In Proceedings of the 2018 CHI Conference on Human Factors in Computing Systems, Montreal, QC, Canada, 21–26 April 2018. [Google Scholar]
- Fröhlich, P.; Baldauf, M.; Meneweger, T.; Erickson, I.; Tscheligi, M.; Gable, T.; Ruyter, B.; Paternò, F. Everyday automation experience: Non-expert users encountering ubiquitous automated systems. In Proceedings of the 2019 CHI Conference on Human Factors in Computing Systems, Glasgow, UK, 4–9 May 2019. [Google Scholar]
- Fröhlich, P.; Baldauf, M.; Palanque, P.; Roto, V.; Meneweger, T.; Tscheligi, M.; Becerra, Z.; Paternò, F. Automation experience across domains: Designing for intelligibility, interventions, interplay and integrity. In Proceedings of the 2020 CHI Conference on Human Factors in Computing Systems, Honolulu, HI, USA, 25–30 April 2020. [Google Scholar]
- Vogelpohl, T.; Kühn, M.; Hummel, T.; Vollrath, M. Asleep at the automated wheel—Sleepiness and fatigue during highly automated driving. Accid. Anal. Prev. 2019, 126, 70–84. [Google Scholar] [CrossRef]
- Wörle, J.; Metz, B.; Othersen, I.; Baumann, M. Sleep in highly automated driving: Takeover performance after waking up. Accid. Anal. Prev. 2020, 144, 105617. [Google Scholar] [CrossRef]
- Yeo, D.; Lee, J.; Kim, W.; Kim, M.; Cho, K.; Ataya, A.; Kim, S. A Hand-Over Notification System of Vehicle Driving Control according to Driver’s Condition based on Cognitive Load in Autonomous Driving Situation. In Proceedings of the HCI Korea, Jeju, Korea, 13–16 February 2019. [Google Scholar]
- Ma, R.; Kaber, D.B. Situation awareness and workload in driving while using adaptive cruise control and a cell phone. Int. J. Ind. Ergon. 2005, 35, 939–953. [Google Scholar] [CrossRef]
- Briem, V.; Hedman, L.R. Behavioural effects of mobile telephone use during simulated driving. Ergonomics 1995, 38, 2536–2562. [Google Scholar] [CrossRef]
- Jamson, A.H.; Westerman, S.J.; Hockey, G.R.J.; Carsten, O.M. Speech-based e-mail and driver behavior: Effects of an in-vehicle message system interface. Hum. Factors 2004, 46, 625–639. [Google Scholar] [CrossRef]
- Mok, B.; Johns, M.; Lee, K.J.; Miller, D.; Sirkin, D.; Ive, P.; Ju, W. Emergency, automation off: Unstructured transition timing for distracted drivers of automated vehicles. In Proceedings of the 2015 IEEE 18th International Conference on Intelligent Transportation Systems, Gran Canaria, Spain, 15–18 September 2015. [Google Scholar]
- Borojeni, S.S.; Weber, L.; Heuten, W.; Boll, S. From reading to driving: Priming mobile users for take-over situations in highly automated driving. In Proceedings of the 20th International Conference on Human-Computer Interaction with Mobile Devices and Services, Barcelona, Spain, 3–6 September 2018. [Google Scholar]
- Borojeni, S.S.; Chuang, L.; Heuten, W.; Boll, S. Assisting drivers with ambient take-over requests in highly automated driving. In Proceedings of the 8th International Conference on Automotive User Interfaces and Interactive Vehicular Applications, Ann Arbor, MI, USA, 24–26 October 2016. [Google Scholar]
- Radlmayr, J.; Gold, C.; Lorenz, L.; Farid, M.; Bengler, K. How traffic situations and non-driving related tasks affect the take-over quality in highly automated driving. Proc. Hum. Factors Ergon. Soc. Annu. Meet. 2014, 58, 2063–2067. [Google Scholar] [CrossRef] [Green Version]
- Jamson, A.H.; Merat, N. Surrogate in-vehicle information systems and driver behaviour: Effects of visual and cognitive load in simulated rural driving. Transp. Res. Part F Traffic Psychol. Behav. 2005, 8, 79–96. [Google Scholar] [CrossRef]
- Rodrick, D.; Bhise, V.; Jothi, V. Effects of driver and secondary task characteristics on lane change test performance. Hum. Factors Ergon. Manuf. Serv. Ind. 2013, 23, 560–572. [Google Scholar] [CrossRef] [Green Version]
- Wandtner, B.; Schömig, N.; Schmidt, G. Effects of non-driving related task modalities on takeover performance in highly automated driving. Hum. Factors 2018, 60, 870–881. [Google Scholar] [CrossRef]
- Kim, H.S.; Yoon, S.H.; Kim, M.J.; Ji, Y.G. Deriving future user experiences in autonomous vehicle. In Proceedings of the 7th International Conference on Automotive User Interfaces and Interactive Vehicular Applications, Nottingham, UK, 1–3 September 2015. [Google Scholar]
- Mok, B.; Johns, M.; Miller, D.; Ju, W. Tunneled in: Drivers with active secondary tasks need more time to transition from automation. In Proceedings of the 2017 CHI Conference on Human Factors in Computing Systems, Denver, CO, USA, 6–11 May 2017. [Google Scholar]
- Zeeb, K.; Buchner, A.; Schrauf, M. Is take-over time all that matters? The impact of visual-cognitive load on driver take-over quality after conditionally automated driving. Accid. Anal. Prev. 2016, 92, 230–239. [Google Scholar] [CrossRef]
- Köhn, T.; Gottlieb, M.; Schermann, M.; Krcmar, H. Improving take-over quality in automated driving by interrupting non-driving tasks. In Proceedings of the 24th International Conference on Intelligent User Interfaces, Marina del Ray, CA, USA, 17–20 March 2019. [Google Scholar]
- Wintersberger, P.; Riener, A.; Schartmüller, C.; Frison, A.K.; Weigl, K. Let me finish before I take over: Towards attention aware device integration in highly automated vehicles. In Proceedings of the 10th International Conference on Automotive User Interfaces and Interactive Vehicular Applications, Toronto, ON, Canada, 23–25 September 2018. [Google Scholar]
- Li, Q.; Hou, L.; Wang, Z.; Wang, W.; Zeng, C.; Yuan, Q.; Cheng, B. Drivers’ visual-distracted take-over performance model and its application on adaptive adjustment of time budget. Accid. Anal. Prev. 2021, 154, 106099. [Google Scholar] [CrossRef]
- Purucker, C.; Naujoks, F.; Wiedemann, K.; Neukum, A.; Marberger, C. Effects of Secondary Tasks on Conditional Automation State Transitions While Driving on Freeways: Judgements and Observations of Driver Workload. In Proceedings of the 6th International Conference on Driver Distraction and Inattention, Gothenburg, Sweden, 15–17 October 2018. [Google Scholar]
- Kim, S.; Chun, J.; Dey, A.K. Sensors know when to interrupt you in the car: Detecting driver interruptibility through monitoring of peripheral interactions. In Proceedings of the 33rd Annual ACM Conference on Human Factors in Computing Systems, Seoul, Korea, 18–23 April 2015. [Google Scholar]
- Frison, A.K.; Wintersberger, P.; Liu, T.; Riener, A. Why do you like to drive automated? a context-dependent analysis of highly automated driving to elaborate requirements for intelligent user interfaces. In Proceedings of the 24th International Conference on Intelligent User Interfaces, Marina del Ray, CA, USA, 17–20 March 2019. [Google Scholar]
- Ataya, A.; Kim, W.; Elsharkawy, A.; Kim, S. How to Interact with a Fully Autonomous Vehicle: Naturalistic Ways for Drivers to Intervene in the Vehicle System while Performing Non-Driving Related Tasks. Sensors 2021, 21, 2206. [Google Scholar] [CrossRef]
- Hirsch, M.; Diederichs, F.; Widlroither, H.; Graf, R.; Bischoff, S. Sleep and take-over in automated driving. Int. J. Transp. Sci. Technol. 2020, 9, 42–51. [Google Scholar] [CrossRef]
- Wörle, J.; Metz, B.; Baumann, M. Sleep inertia in automated driving: Post-sleep take-over and driving performance. Accid. Anal. Prev. 2021, 150, 105918. [Google Scholar] [CrossRef]
- Melcher, V.; Rauh, S.; Diederichs, F.; Widlroither, H.; Bauer, W. Take-over requests for automated driving. Procedia Manuf. 2015, 3, 2867–2873. [Google Scholar] [CrossRef]
- Kaduk, S.I.; Roberts, A.P.; Stanton, N. I just woke up behind the wheel: Sleep inertia as a new risk in semi-automated cars. In Contemporary Ergonomics and Human Factors, Proceedings of the International Conference on Ergonomics & Human Factors, Daventry, UK, 13–16 April 2015; Taylor & Francis: Abingdon on Thames, UK, 2015. [Google Scholar]
- Desai, A.V.; Haque, M.A. Vigilance monitoring for operator safety: A simulation study on highway driving. J. Saf. Res. 2006, 37, 139–147. [Google Scholar] [CrossRef]
- Kozak, K.; Pohl, J.; Birk, W.; Greenberg, J.; Artz, B.; Blommer, M.; Cathey, L.; Curry, R. Evaluation of lane departure warnings for drowsy drivers. Proc. Hum. Factors Ergon. Soc. Annu. Meet. 2006, 50, 2400–2404. [Google Scholar] [CrossRef] [Green Version]
- Jackson, M.L.; Kennedy, G.A.; Clarke, C.; Gullo, M.; Swann, P.; Downey, L.A.; Hayley, A.C.; Pierce, R.J.; Howard, M.E. The utility of automated measures of ocular metrics for detecting driver drowsiness during extended wakefulness. Accid. Anal. Prev. 2016, 87, 127–133. [Google Scholar] [CrossRef] [PubMed]
- Grogna, D.; Stojmenova, K.; Jakus, G.; Barreda-Ángeles, M.; Verly, J.G.; Sodnik, J. The impact of drowsiness on in-vehicle human-machine interaction with head-up and head-down displays. Multimed. Tools Appl. 2018, 77, 27807–27827. [Google Scholar] [CrossRef]
- Fors, C.; Ahlstrom, C.; Anund, A. A comparison of driver sleepiness in the simulator and on the real road. J. Transp. Saf. Secur. 2018, 10, 72–87. [Google Scholar] [CrossRef]
- Punjabi, N.M.; Bandeen-Roche, K.; Young, T. Predictors of objective sleep tendency in the general population. Sleep 2003, 26, 678–683. [Google Scholar] [CrossRef] [Green Version]
- Jiang, F.; Kobayashi, T.; Ichihashi, T.; Nomura, S. Effect of a relatively long afternoon nap on autonomous nervous activity, sleep architecture, and subjective sleep quality. IEEJ Trans. Electr. Electron. Eng. 2018, 13, 1357–1361. [Google Scholar] [CrossRef]
- Kim, W.; Kim, S. A New Approach to Studying Sleep in Autonomous Vehicles: Simulating the Waking Situation. In Proceedings of the 32nd Annual ACM Symposium on User Interface Software and Technology (UIST ’19), New Orleans, LA, USA, 20–23 October 2019. [Google Scholar]
- Kim, A.; Choi, W.; Park, J.; Kim, K.; Lee, U. Interrupting Drivers for Interactions: Predicting Opportune Moments for In-vehicle Proactive Auditory-verbal Tasks. Proc. ACM Interact. Mob. Wearable Ubiquitous Technol. 2018, 2, 1–28. [Google Scholar] [CrossRef]
- Dong, Y.; Hu, Z.; Uchimura, K.; Murayama, N. Driver inattention monitoring system for intelligent vehicles: A review. IEEE Trans. Intell. Transp. Syst. 2010, 12, 596–614. [Google Scholar] [CrossRef]
- Zeeb, K.; Buchner, A.; Schrauf, M. What determines the take-over time? An integrated model approach of driver take-over after automated driving. Accid. Anal. Prev. 2015, 78, 212–221. [Google Scholar] [CrossRef]
- Ali, S.F.; Aslam, A.S.; Awan, M.J.; Yasin, A.; Damaševičius, R. Pose Estimation of Driver’s Head Panning Based on Interpolation and Motion Vectors under a Boosting Framework. Appl. Sci. 2021, 11, 11600. [Google Scholar] [CrossRef]
- Du, N.; Yang, X.J.; Zhou, F. Psychophysiological responses to takeover requests in conditionally automated driving. Accid. Anal. Prev. 2020, 148, 105804. [Google Scholar] [CrossRef]
- Du, N.; Zhou, F.; Pulver, E.M.; Tilbury, D.M.; Robert, L.P.; Pradhan, A.K.; Yang, X.J. Predicting driver takeover performance in conditionally automated driving. Accid. Anal. Prev. 2020, 148, 105748. [Google Scholar] [CrossRef]
- Solovey, E.T.; Zec, M.; Garcia Perez, E.A.; Reimer, B.; Mehler, B. Classifying driver workload using physiological and driving performance data: Two field studies. In Proceedings of the SIGCHI Conference on Human Factors in Computing Systems, Toronto, ON, Canada, 26 April–1 May 2014. [Google Scholar]
- Perello-March, J.R.; Burns, C.G.; Woodman, R.; Elliott, M.T.; Birrell, S.A. Driver State Monitoring: Manipulating Reliability Expectations in Simulated Automated Driving Scenarios. IEEE Trans. Intell. Transp. Syst. 2021, 1–11. [Google Scholar] [CrossRef]
- Sheng, S.; Pakdamanian, E.; Han, K.; Kim, B.; Tiwari, P.; Kim, I.; Feng, L. A case study of trust on autonomous driving. In Proceedings of the 2019 IEEE Intelligent Transportation Systems Conference (ITSC), Auckland, New Zealand, 27–30 October 2019. [Google Scholar]
- Collet, C.; Clarion, A.; Morel, M.; Chapon, A.; Petit, C. Physiological and behavioural changes associated to the management of secondary tasks while driving. Appl. Ergon. 2009, 40, 1041–1046. [Google Scholar] [CrossRef]
- Yoon, S.H.; Ji, Y.G. Non-driving-related tasks, workload, and takeover performance in highly automated driving contexts. Transp. Res. Part F Traffic Psychol. Behav. 2019, 60, 620–631. [Google Scholar] [CrossRef]
- Hartley, L.R.; Arnold, P.K.; Smythe, G.; Hansen, J. Indicators of Fatigue in Truck Drivers. J. Saf. Res. 1995, 4, 256. [Google Scholar] [CrossRef]
- Hajek, W.; Gaponova, I.; Fleischer, K.H.; Krems, J. Workload-adaptive cruise control–A new generation of advanced driver assistance systems. Transp. Res. Part F Traffic Psychol. Behav. 2013, 20, 108–120. [Google Scholar] [CrossRef]
- Min, B.C.; Chung, S.C.; Park, S.J.; Kim, C.J.; Sim, M.K.; Sakamoto, K. Autonomic responses of young passengers contingent to the speed and driving mode of a vehicle. Int. J. Ind. Ergon. 2002, 29, 187–198. [Google Scholar] [CrossRef]
- Sandhaus, H.; Hornecker, E. A WOZ Study of Feedforward Information on an Ambient Display in Autonomous Cars. In Proceedings of the 31st Annual ACM Symposium on User Interface Software and Technology Adjunct Proceedings, Berlin, Germany, 14 October 2018. [Google Scholar]
- Cohen-Lazry, G.; Katzman, N.; Borowsky, A.; Oron-Gilad, T. Directional tactile alerts for take-over requests in highly-automated driving. Transp. Res. Part F Traffic Psychol. Behav. 2019, 65, 217–226. [Google Scholar] [CrossRef]
- Kim, H.J.; Yang, J.H. Takeover requests in simulated partially autonomous vehicles considering human factors. IEEE Trans. Hum.-Mach. Syst. 2017, 47, 735–740. [Google Scholar] [CrossRef]
- Kutchek, K.; Jeon, M. Takeover and Handover Requests using Non-Speech Auditory Displays in Semi-Automated Vehicles. In Proceedings of the 2019 CHI Conference on Human Factors in Computing Systems, Glasgow, UK, 4–9 May 2019. [Google Scholar]
- Bazilinskyy, P.; Petermeijer, S.M.; Petrovych, V.; Dodou, D.; de Winter, J.C. Take-over requests in highly automated driving: A crowdsourcing survey on auditory, vibrotactile, and visual displays. Transp. Res. Part F Traffic Psychol. Behav. 2018, 56, 82–98. [Google Scholar] [CrossRef]
- Bengler, K.; Kohlmann, M.; Lange, C. Assessment of cognitive workload of in-vehicle systems using a visual peripheral and tactile detection task setting. Work 2012, 41 (Suppl. S1), 4919–4923. [Google Scholar] [CrossRef] [Green Version]
- Scott, J.J.; Gray, R. A comparison of tactile, visual, and auditory warnings for rear-end collision prevention in simulated driving. Hum. Factors 2008, 50, 264–275. [Google Scholar] [CrossRef] [PubMed]
- Driver Asleep at the Wheel of His Tesla on Busy Freeway in Los Angeles. Available online: https://www.youtube.com/watch?v=ZhObsMnipS8 (accessed on 25 August 2019).
- Tesla Driver Caught on Camera Apparently Asleep at the Wheel | NBC Nightly News. Available online: https://www.youtube.com/watch?v=NHUZxeSUFUk (accessed on 10 September 2019).
- Endsley, M.R. Design and evaluation for situation awareness enhancement. Proc. Hum. Factors Soc. Annu. Meet. 1988, 32, 97–101. [Google Scholar] [CrossRef]
- Van Den Beukel, A.P.; Van Der Voort, M.C. The influence of time-criticality on situation awareness when retrieving human control after automated driving. In Proceedings of the 16th International IEEE Conference on Intelligent Transportation Systems (ITSC 2013), The Hague, The Netherlands, 6–9 October 2013. [Google Scholar]
- Zhou, F.; Yang, X.J.; Zhang, X. Takeover transition in autonomous vehicles: A YouTube study. Int. J. Hum.-Comput. Interact. 2020, 36, 295–306. [Google Scholar] [CrossRef]
- Vogelpohl, T.; Gehlmann, F.; Vollrath, M. Task interruption and control recovery strategies after take-over requests emphasize need for measures of situation awareness. Hum. Factors 2020, 62, 1190–1211. [Google Scholar] [CrossRef] [PubMed]
- Wu, Y.; Kihara, K.; Takeda, Y.; Sato, T.; Akamatsu, M.; Kitazaki, S. Assessing the Mental States of Fallback-Ready Drivers in Automated Driving by Electrooculography. In Proceedings of the 2019 IEEE Intelligent Transportation Systems Conference (ITSC), Auckland, New Zealand, 27–30 October 2019. [Google Scholar]
- SAE On-Road Automated Vehicle Standards Committee. Taxonomy and definitions for terms related to on-road motor vehicle automated driving systems. SAE Stand. J. 2014, 3016, 1–16. [Google Scholar]
- Holländer, K.; Pfleging, B. Preparing drivers for planned control transitions in automated cars. In Proceedings of the 17th International Conference on Mobile and Ubiquitous Multimedia, Cairo, Egypt, 25–28 November 2018. [Google Scholar]
- Naujoks, F.; Forster, Y.; Wiedemann, K.; Neukum, A. A human-machine interface for cooperative highly automated driving. In Advances in Human Aspects of Transportation; Springer: Cham, Switzerland, 2017; pp. 585–595. [Google Scholar]
- Amershi, S.; Weld, D.; Vorvoreanu, M.; Fourney, A.; Nushi, B.; Collisson, P.; Jina, S.; Iqbal, S.T.; Bennett, P.N.; Inkpen, K.M.; et al. Guidelines for human-AI interaction. In Proceedings of the 2019 CHI Conference on Human Factors in Computing Systems, Glasgow, UK, 4–9 May 2019. [Google Scholar]
- Sahaï, A.; Barré, J.; Bueno, M. Urgent and non-urgent takeovers during conditional automated driving on public roads: The impact of different training programmes. Transp. Res. Part F Traffic Psychol. Behav. 2021, 81, 130–143. [Google Scholar] [CrossRef]
- Villa-Espinal, J.; Osorio-Gómez, G. Methodology for the design of automotive HUD graphical interfaces. Dyna 2018, 85, 161–167. [Google Scholar] [CrossRef]
- Atkinson, R.C.; Shiffrin, R.M. Human memory: A proposed system and its control processes. Psychol. Learn. Motiv. 1968, 2, 89–195. [Google Scholar]
- Forster, Y.; Naujoks, F.; Neukum, A. Increasing anthropomorphism and trust in automated driving functions by adding speech output. In Proceedings of the 2017 IEEE Intelligent Vehicles Symposium (IV), Los Angeles, CA, USA, 11–14 June 2017. [Google Scholar]
- Schaefer, K.E.; Chen, J.Y.; Szalma, J.L.; Hancock, P.A. A meta-analysis of factors influencing the development of trust in automation: Implications for understanding autonomy in future systems. Hum. Factors 2016, 58, 377–400. [Google Scholar] [CrossRef] [Green Version]
- Shi, Y.; Ruiz, N.; Taib, R.; Choi, E.; Chen, F. Galvanic skin response (GSR) as an index of cognitive load. In Proceedings of the CHI ’07 Conference on Human Factors in Computing Systems, San Jose, CA, USA, 28 April–3 May 2007. [Google Scholar]
- Kim, S.; Hong, J.H.; Li, K.A.; Forlizzi, J.; Dey, A.K. Route guidance modality for elder driver navigation. In Proceedings of the International Conference on Pervasive Computing, Newcastle, UK, 18–22 June 2012. [Google Scholar]
- Vecchiato, G.; Cherubino, P.; Maglione, A.G.; Ezquierro, M.T.H.; Marinozzi, F.; Bini, F.; Trettel, A.; Babiloni, F. How to measure cerebral correlates of emotions in marketing relevant tasks. Cogn. Comput. 2014, 6, 856–871. [Google Scholar] [CrossRef]
- Wickens, C.D. Processing resources and attention. In Multiple-Task Performance; Taylor & Francis: London, UK, 1991; pp. 3–34. [Google Scholar]
- Parasuraman, R.; Davies, D.R. Varieties of Attention; Academic Press: Cambridge, MA, USA, 1984. [Google Scholar]
- Shechtman, O.; Classen, S.; Awadzi, K.; Mann, W. Comparison of driving errors between on-the-road and simulated driving assessment: A validation study. Traffic Inj. Prev. 2009, 10, 379–385. [Google Scholar] [CrossRef]
- Aboalayon, K.A.I.; Faezipour, M.; Almuhammadi, W.S.; Moslehpour, S. Sleep stage classification using EEG signal analysis: A comprehensive survey and new investigation. Entropy 2016, 18, 272. [Google Scholar] [CrossRef]
- Memar, P.; Faradji, F. A novel multi-class EEG-based sleep stage classification system. IEEE Trans. Neural Syst. Rehabil. Eng. 2017, 26, 84–95. [Google Scholar] [CrossRef]
- Antonenko, P.; Paas, F.; Grabner, R.; Van Gog, T. Using electroencephalography to measure cognitive load. Educ. Psychol. Rev. 2010, 22, 425–438. [Google Scholar] [CrossRef]
- Almahasneh, H.; Chooi, W.T.; Kamel, N.; Malik, A.S. Deep in thought while driving: An EEG study on drivers’ cognitive distraction. Transp. Res. Part F Traffic Psychol. Behav. 2014, 26, 218–226. [Google Scholar] [CrossRef]
- Hu, W.L.; Akash, K.; Jain, N.; Reid, T. Real-time sensing of trust in human-machine interactions. IFAC-Pap. OnLine 2016, 49, 48–53. [Google Scholar] [CrossRef]
- Akash, K.; Hu, W.L.; Reid, T.; Jain, N. Dynamic modeling of trust in human-machine interactions. In Proceedings of the 2017 American Control Conference (ACC) IEEE, Seattle, WA, USA, 24–26 May 2017. [Google Scholar]
- Gupta, K.; Hajika, R.; Pai, Y.S.; Duenser, A.; Lochner, M.; Billinghurst, M. In AI we trust: Investigating the relationship between biosignals, trust and cognitive load in VR. In Proceedings of the 25th ACM Symposium on Virtual Reality Software and Technology, Parramatta, Australia, 12–15 November 2019. [Google Scholar]
- Gupta, K.; Hajika, R.; Pai, Y.S.; Duenser, A.; Lochner, M.; Billinghurst, M. Measuring human trust in a virtual assistant using physiological sensing in virtual reality. In Proceedings of the 2020 IEEE Conference on Virtual Reality and 3D User Interfaces (VR), Atlanta, GA, USA, 22–26 March 2020. [Google Scholar]
- Zander, T.O.; Andreessen, L.M.; Berg, A.; Bleuel, M.; Pawlitzki, J.; Zawallich, L.; Krol, L.R.; Gramann, K. Evaluation of a dry EEG system for application of passive brain-computer interfaces in autonomous driving. Front. Hum. Neurosci. 2017, 11, 78. [Google Scholar] [CrossRef] [Green Version]
- Kerick, S.E.; Oie, K.S.; McDowell, K. Assessment of EEG Signal Quality in Motion Environments; Army Research Lab Aberdeen Proving Ground MD Human Research and Engineering Directorate: Harford County, MD, USA, 2009. [Google Scholar]
Figure 1.
Driving simulator setup. (Left) high-fidelity driving simulator with motion platform; (Right) blue border indicates physiological measures; yellow border indicates setup for non-driving related tasks; black border indicates the vehicle interface (visual message and remaining time).
Figure 1.
Driving simulator setup. (Left) high-fidelity driving simulator with motion platform; (Right) blue border indicates physiological measures; yellow border indicates setup for non-driving related tasks; black border indicates the vehicle interface (visual message and remaining time).
Figure 2.
Diagram of the main section of the experiment including the transition of automated driv-ing and manual driving course; this session was repeated with three modality conditions (auditory, visual, and auditory + visual).
Figure 2.
Diagram of the main section of the experiment including the transition of automated driv-ing and manual driving course; this session was repeated with three modality conditions (auditory, visual, and auditory + visual).
Figure 3.
Average reaction time after take-over request in a sleep-based scenario.
Figure 3.
Average reaction time after take-over request in a sleep-based scenario.
Figure 4.
Deviated distance from the mid-point of traffic cones on both sides at the construction site; higher values indicate unstable driving. (** p < 0.01; *** p < 0.001).
Figure 4.
Deviated distance from the mid-point of traffic cones on both sides at the construction site; higher values indicate unstable driving. (** p < 0.01; *** p < 0.001).
Figure 5.
The number of collisions with traffic cones; a higher number indicates more hazardous driving. There was a significant difference between modalities only for collision. (* p < 0.05; ** p < 0.01; *** p < 0.001).
Figure 5.
The number of collisions with traffic cones; a higher number indicates more hazardous driving. There was a significant difference between modalities only for collision. (* p < 0.05; ** p < 0.01; *** p < 0.001).
Figure 6.
Time to situation awareness; higher time means that it took a long time to be aware of the situation and enact a safe take-over request. (* p < 0.05; *** p < 0.001).
Figure 6.
Time to situation awareness; higher time means that it took a long time to be aware of the situation and enact a safe take-over request. (* p < 0.05; *** p < 0.001).
Figure 7.
Machine acceptance; driver’s trust toward autonomous vehicle; higher values signify more trust.
Figure 7.
Machine acceptance; driver’s trust toward autonomous vehicle; higher values signify more trust.
Figure 8.
NASA-TLX; driver workload after take-over request; higher scores indicate higher work-load.
Figure 8.
NASA-TLX; driver workload after take-over request; higher scores indicate higher work-load.
Figure 9.
Self-reported evaluation for appropriate feedforward timing. (*** p < 0.001).
Figure 9.
Self-reported evaluation for appropriate feedforward timing. (*** p < 0.001).
Figure 10.
Average galvanic skin response waveforms including all types of modality and timing conditions from −5 s to +15 s; higher galvanic skin response indicates greater arousal or cognitive load.
Figure 10.
Average galvanic skin response waveforms including all types of modality and timing conditions from −5 s to +15 s; higher galvanic skin response indicates greater arousal or cognitive load.
Figure 11.
Average galvanic skin response of modalities on each timing between 5 s and 10 s. Gal-vanic skin response waveform increases at the take-over request before 5 s condition.
Figure 11.
Average galvanic skin response of modalities on each timing between 5 s and 10 s. Gal-vanic skin response waveform increases at the take-over request before 5 s condition.
Figure 12.
Average heart rate waveforms including all types of modality and timing conditions from −5 to +15 s; higher heart rate response suggests more fear or anxiety.
Figure 12.
Average heart rate waveforms including all types of modality and timing conditions from −5 to +15 s; higher heart rate response suggests more fear or anxiety.
Table 1.
Preferred in-car activities (
n = 100), ranked in order of preference [
18].
Table 1.
Preferred in-car activities (
n = 100), ranked in order of preference [
18].
| Non-Driving Related Task | Preference of In-Car Activities (%) |
|---|
| Sleeping | 21 |
| Looking out of the windshield | 17 |
| Personal Digital Assistant (PDA) 1: Listening to music | 15 |
| Eating/Drinking | 12 |
| PDA 3: Talking on a phone | 10 |
| PDA 2: Using a tablet PC | 8 |
| PDA 4: Working with a laptop | 6 |
| Other | 11 |
Table 2.
Two-fold message presented to drivers: Type (A), (B). (1) Notification Sound: (A) non-ur-gent sound, (B) urgent sound; repetitive waveform implies higher urgency. (2) Visual Message: (A) when automated driving is available and activated, (B) when the autonomous vehicle cannot drive (take-over request); ‘How’ message is represented by the pictogram: (A) steering wheel without the driver’s hands; (B) steering wheel with the driver’s hands and ‘Why’ message text. (3) Auditory Message: the original text message before the text-to-speech process.
Table 3.
Before-and-after delta means of galvanic skin response and heart rate in relation to the feedforward timings and modalities.
Table 3.
Before-and-after delta means of galvanic skin response and heart rate in relation to the feedforward timings and modalities.
| | Timing | Modality | ANOVA |
|---|
| A | V | A+V |
|---|
Delta Mean GSR
(from −5 s to 15 s) | 5 s | 2.07 | 15.04 | 12.69 | F(2,27) = 5.03, p = 0.014 |
| 10 s | 0.4 | 1.5 | 1.92 | F(2,27) = 0.81, p = 0.46 |
Delta Mean HR
(from −5 s to 15 s) | 5 s | 2.97 | 2.97 | 1.65 | F(2,36) = 0.82, p = 0.45 |
| 10 s | 1.78 | 1.55 | 1.07 | F(2,36) = 0.33, p = 0.72 |
Table 4.
Summary of the brief foci on take-over request after sleep and the implementation method of sleeping/waking up situation.
Table 4.
Summary of the brief foci on take-over request after sleep and the implementation method of sleeping/waking up situation.
Published Year
and [Reference] | Brief Focus of the Previous Studies | Implementation Method of
Sleeping/Waking Up Situation |
|---|
| 2020 [39] | Investigate take-over time and the effect of sleep inertia during 1~15 min after waking from sleep | Actual sleep of 15–20 min was performed in the driving simulator |
| 2020 [17] | Investigate the ability of a driver to reengage in manual driving after waking from sleep within 60 s | Sleep deprivation (<4 h) was used and experiment was repeated twice, the main session (2nd) was conducted at 6 a.m. whereas the familiarization session (1st) was not defined |
| 2021 [40] | Assessed take-over behavior immediately after sleep and driving behavior during the 10 min after sleep | Sleep deprivation (<4 h) was used and participants were instructed not to consume caffeine |
| Publisher’s Note: MDPI stays neutral with regard to jurisdictional claims in published maps and institutional affiliations. |
© 2022 by the authors. Licensee MDPI, Basel, Switzerland. This article is an open access article distributed under the terms and conditions of the Creative Commons Attribution (CC BY) license (https://creativecommons.org/licenses/by/4.0/).


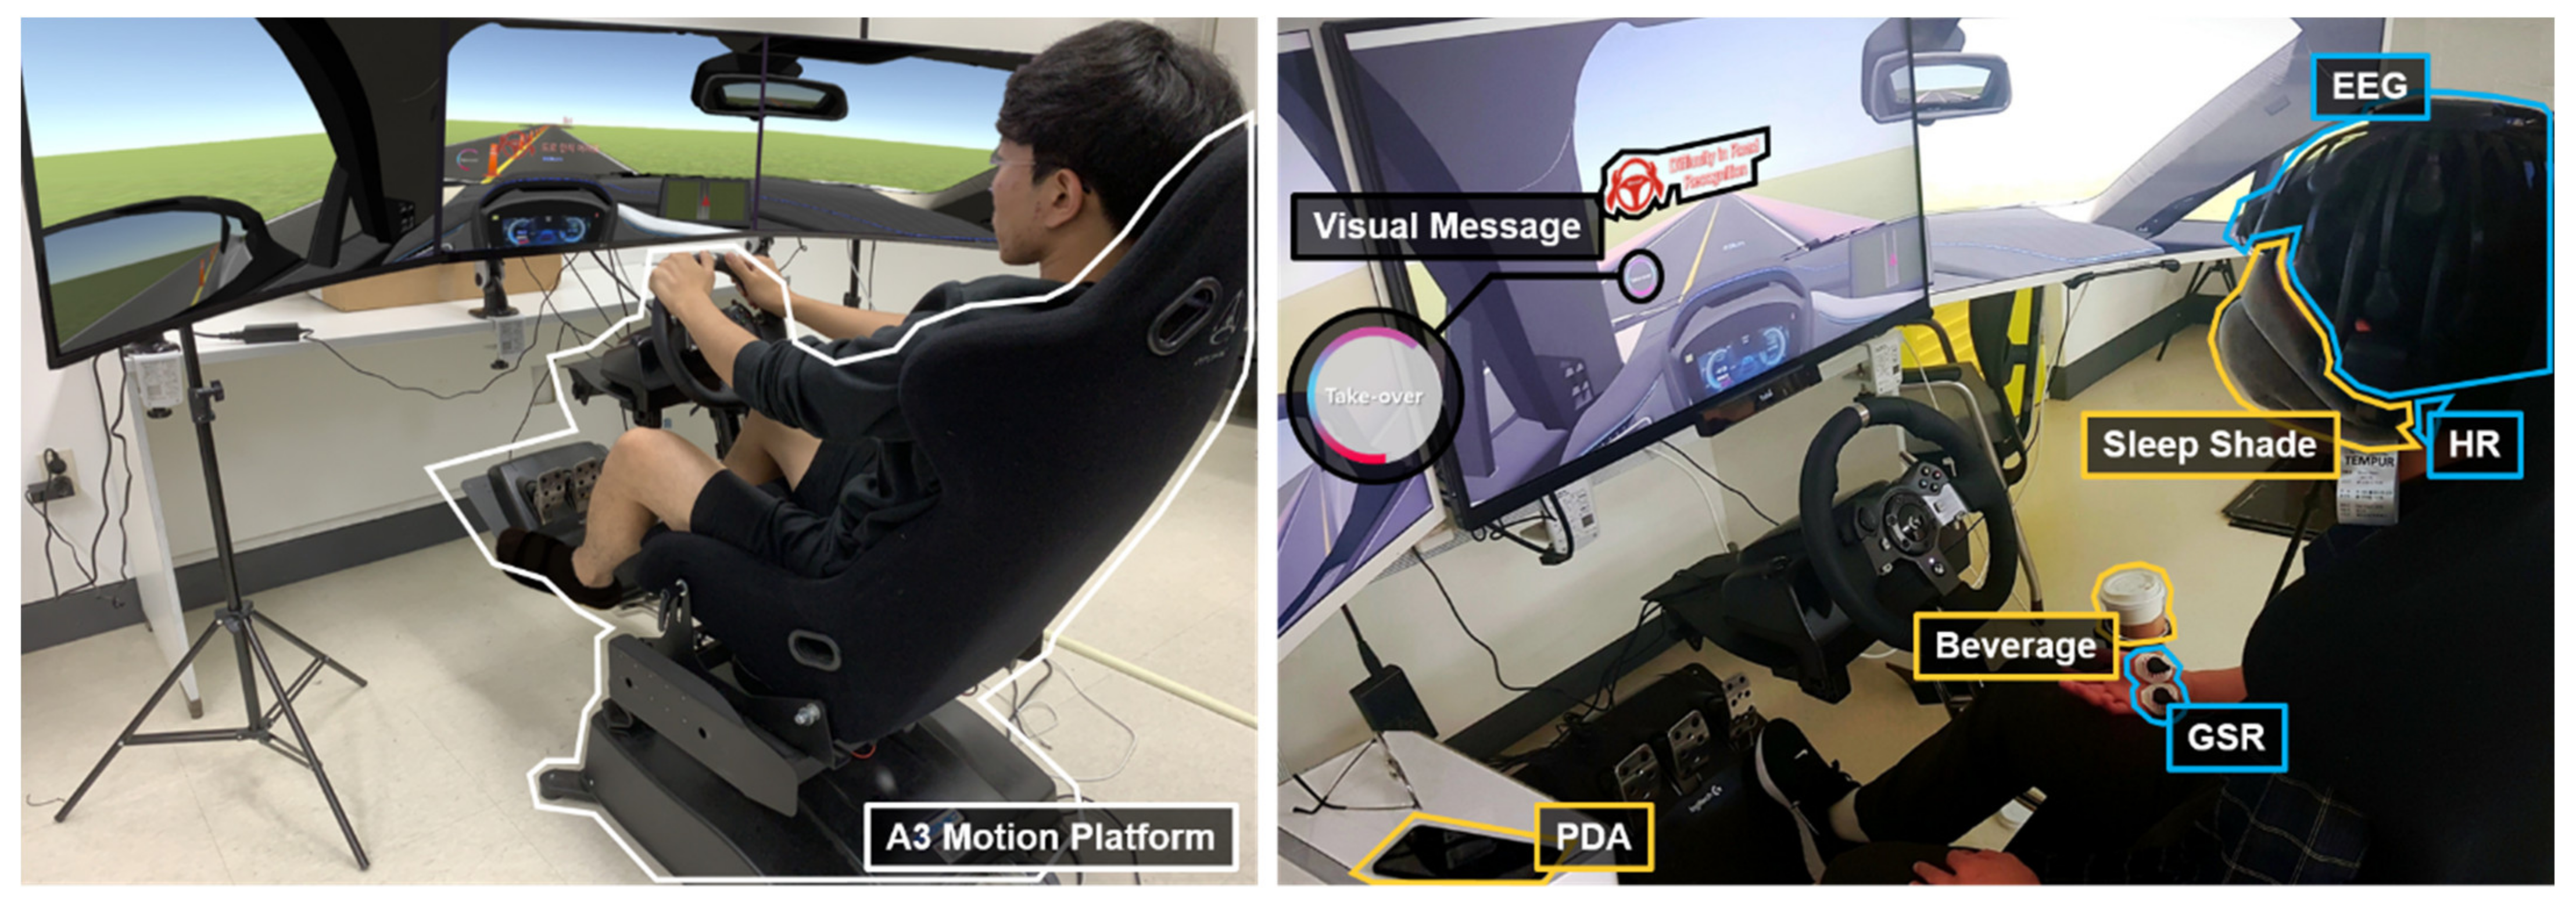
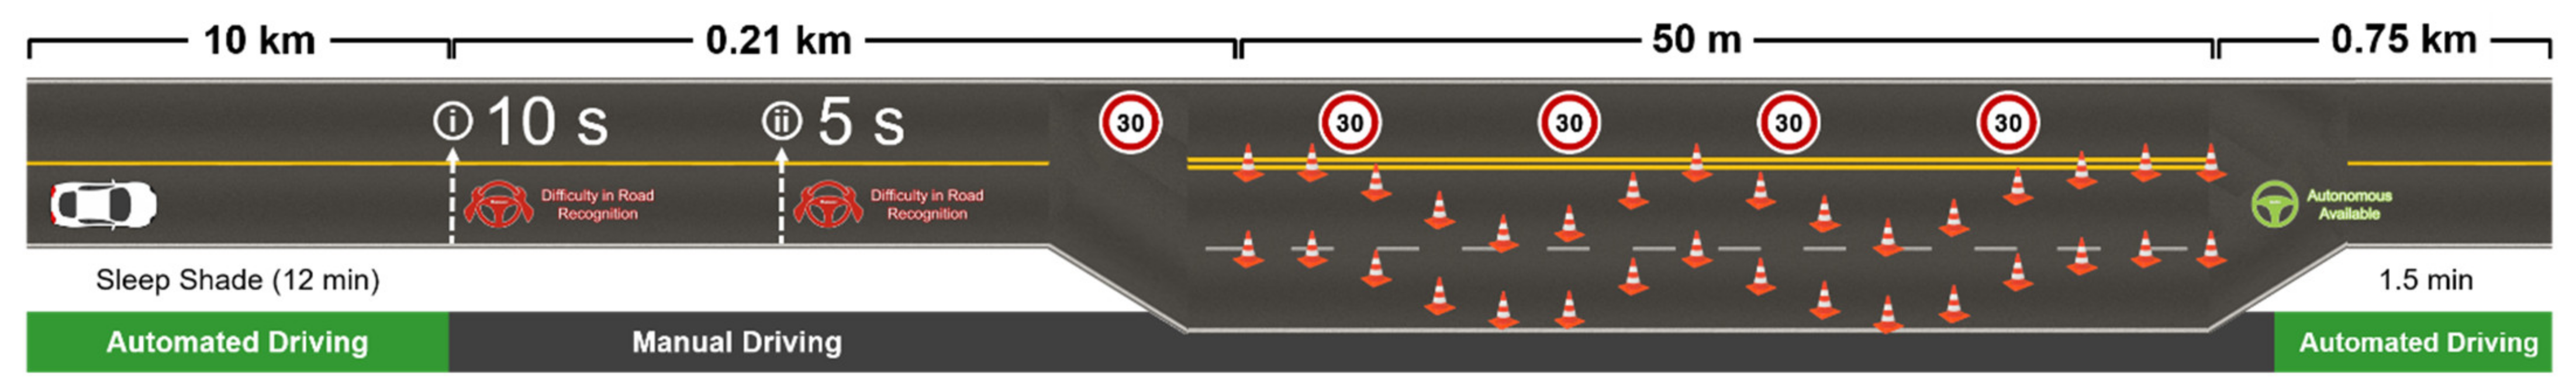


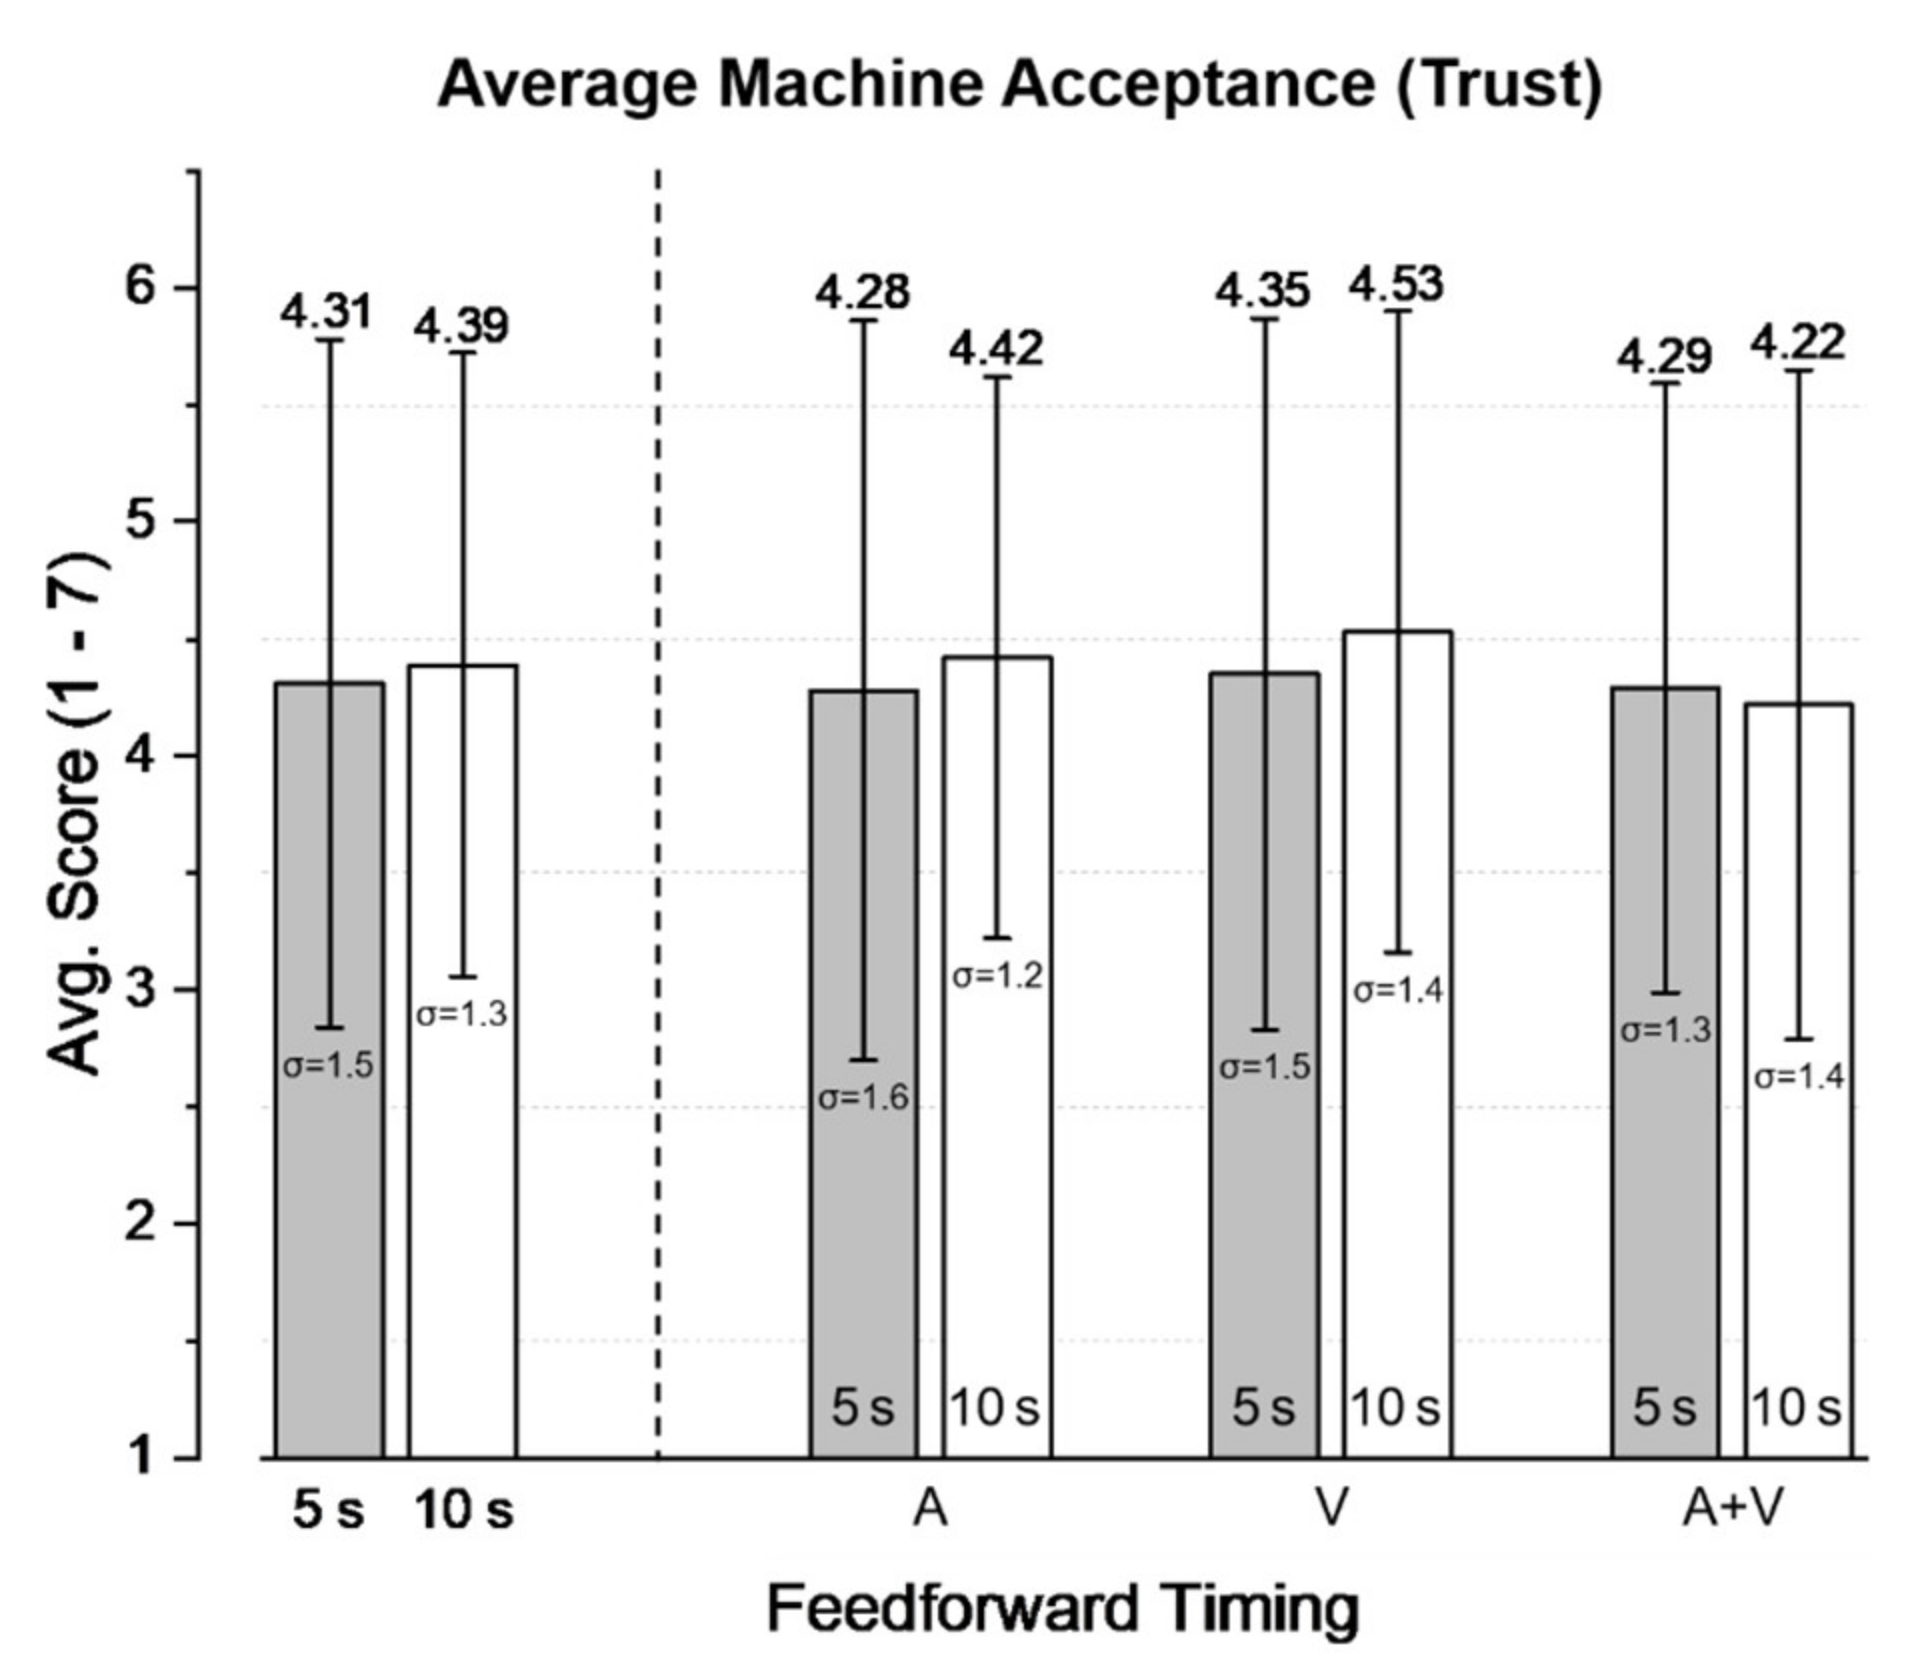


