
The Effects of Resistance Training on Architecture and Volume of the Upper Extremity Muscles: A Systematic Review of Randomised Controlled Trials and Meta-Analyses


Abstract
:1. Introduction
2. Materials and Methods
2.1. Information Sources and Database Search Strategy
2.2. Eligibility Criteria and Study Selection Process
2.3. Outcome Measures
2.4. Risk of Bias Assessments of Eligible Studies
2.5. Data Extraction
2.6. Meta-Analyses
2.7. Level of Evidence of the Meta-Analyses
3. Results
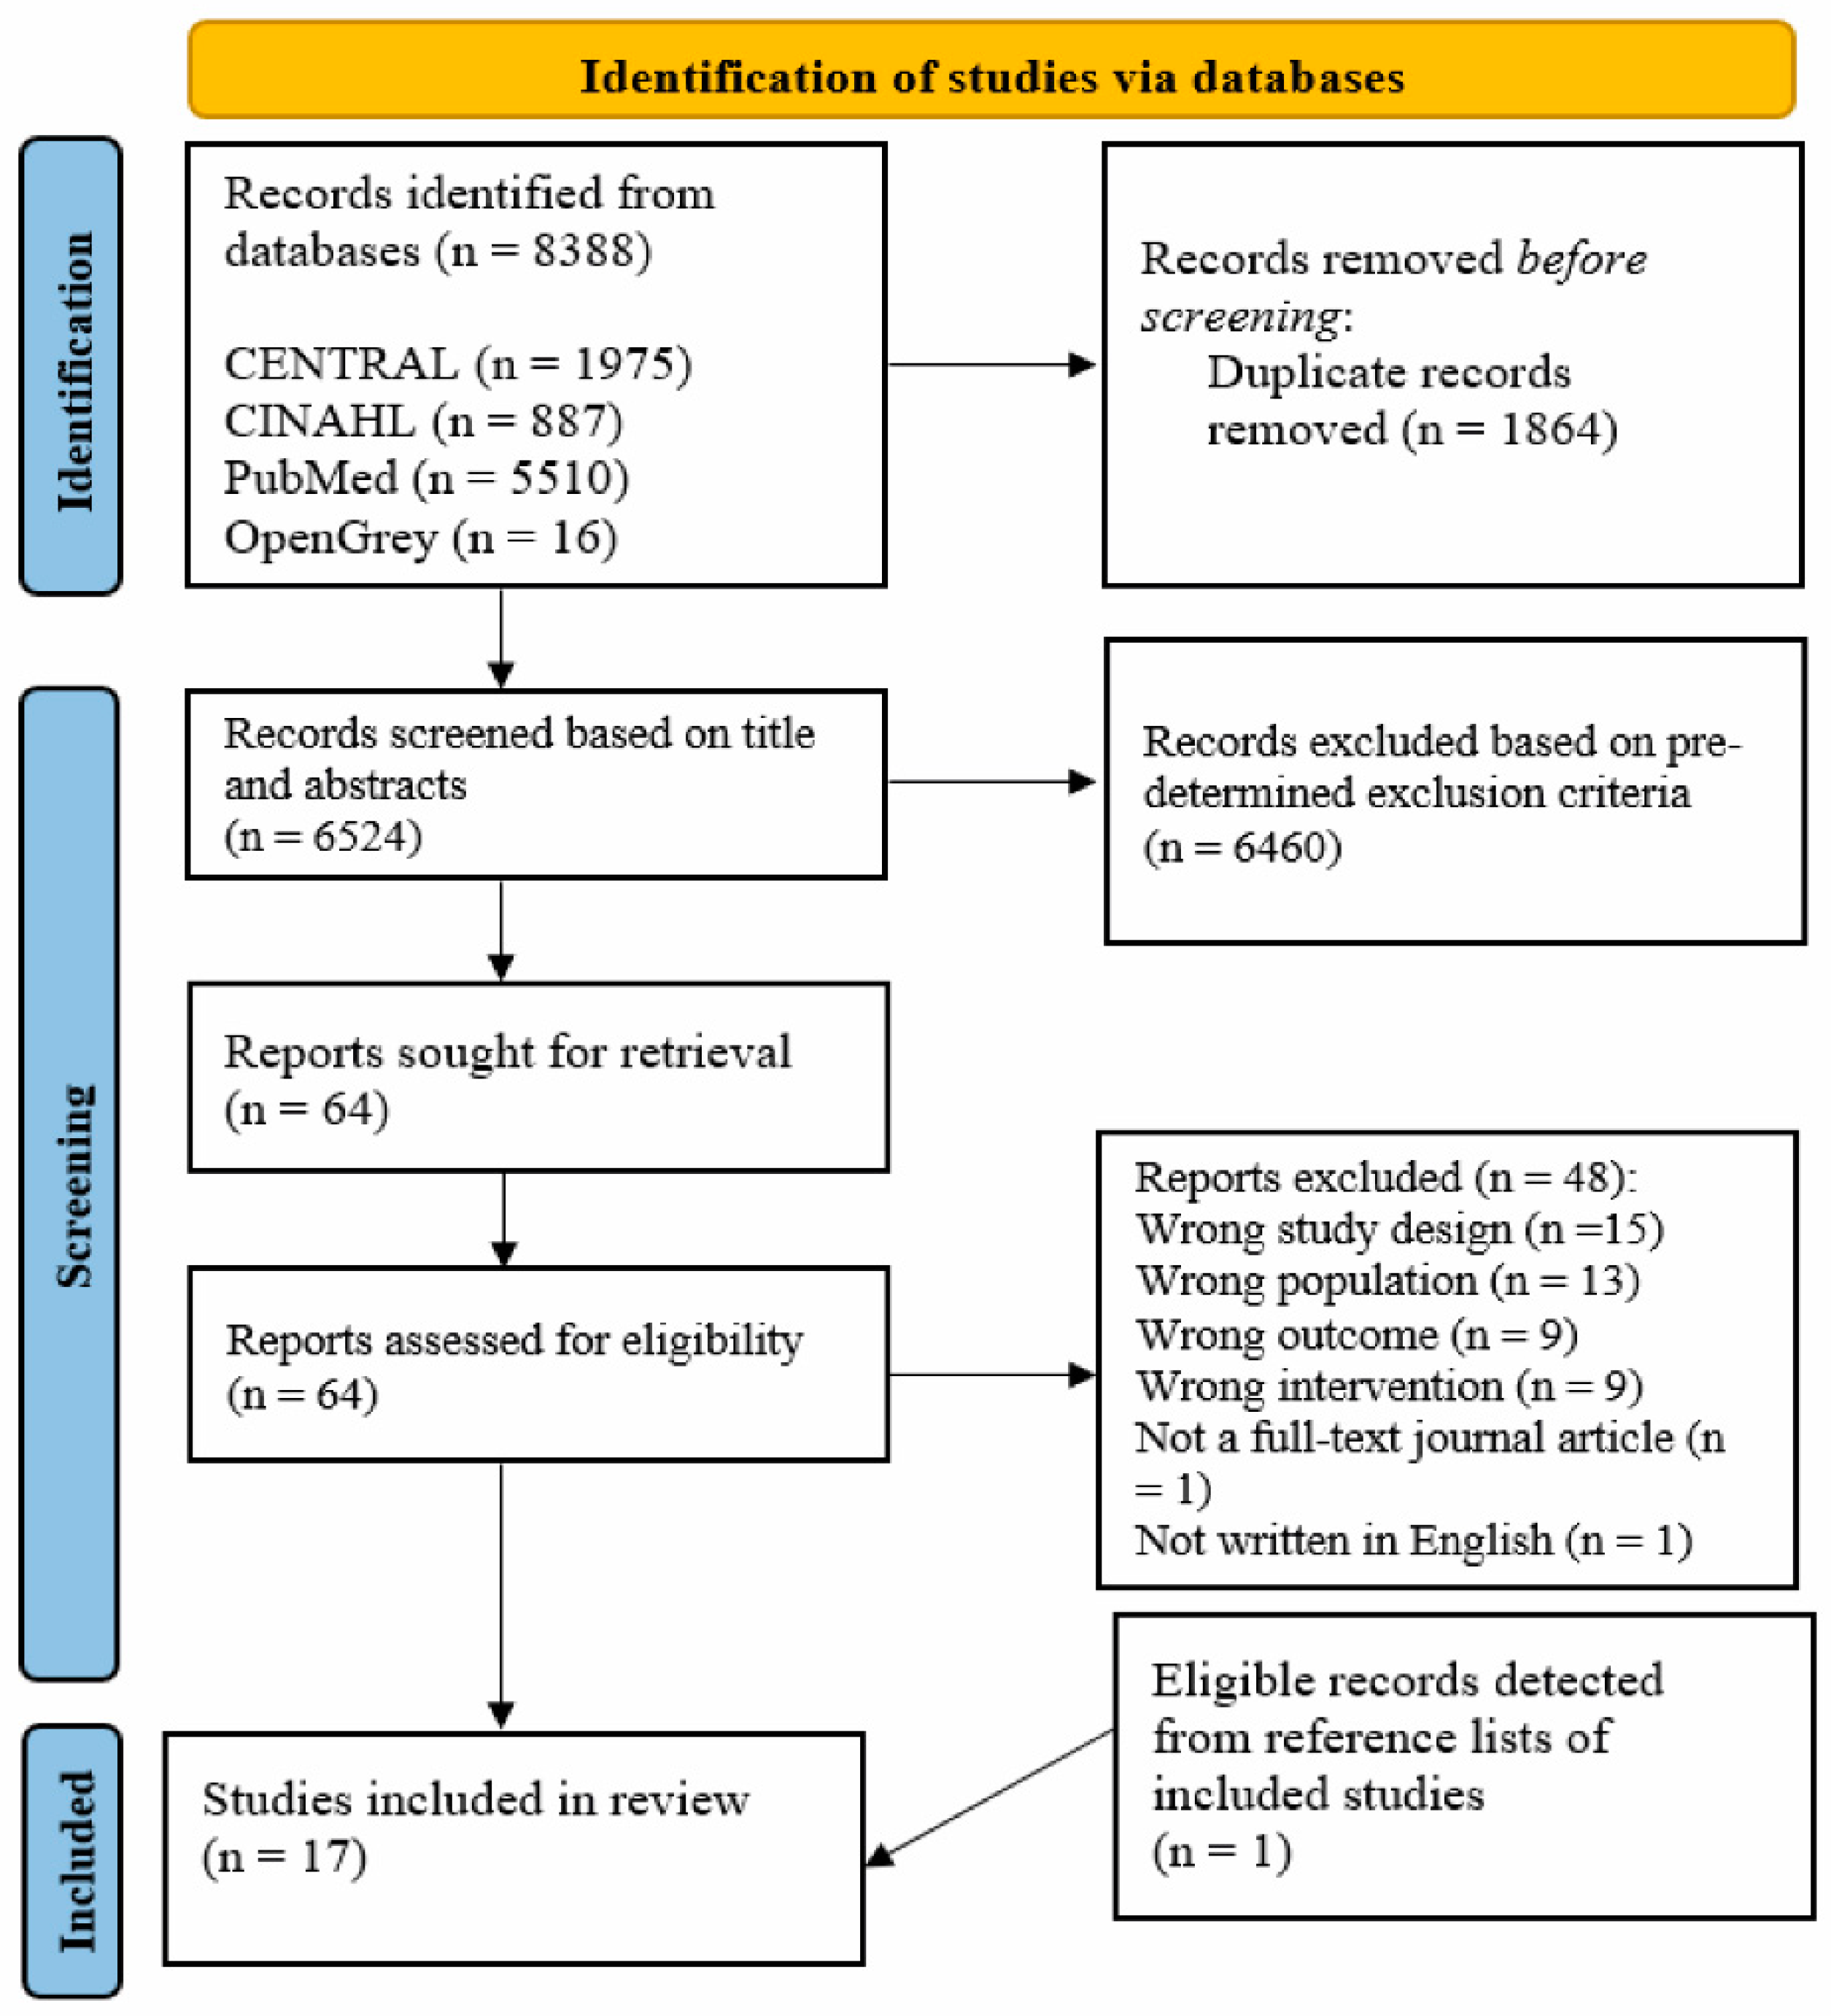
3.1. Study Screening and Selection
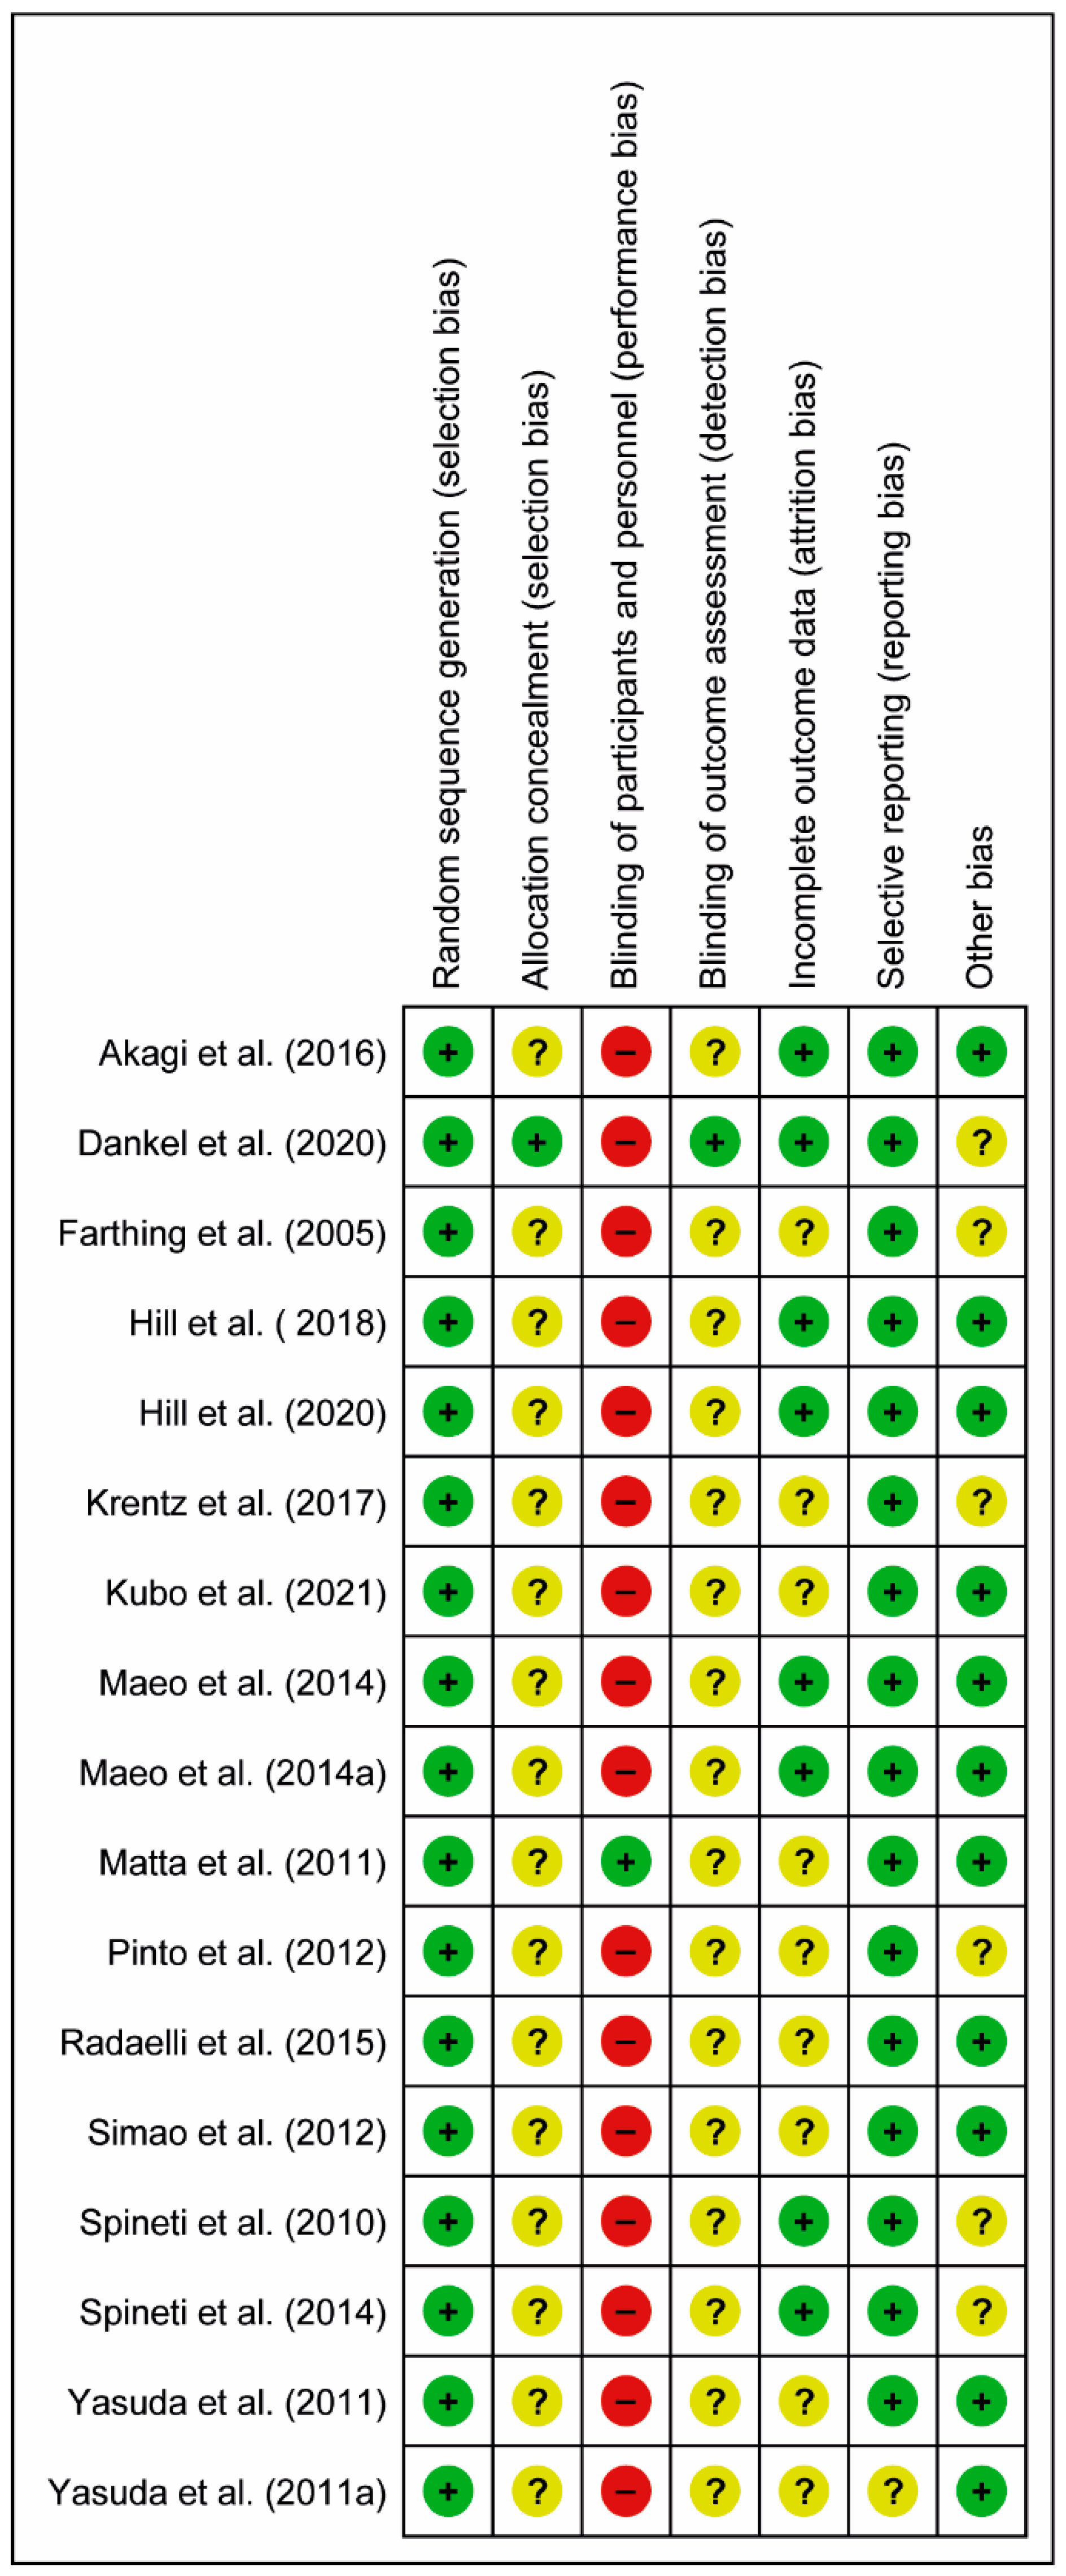
3.2. Risk of Bias Assessments
3.3. Participants’ and Intervention Characteristics of the Included Studies
3.4. Meta-Analyses
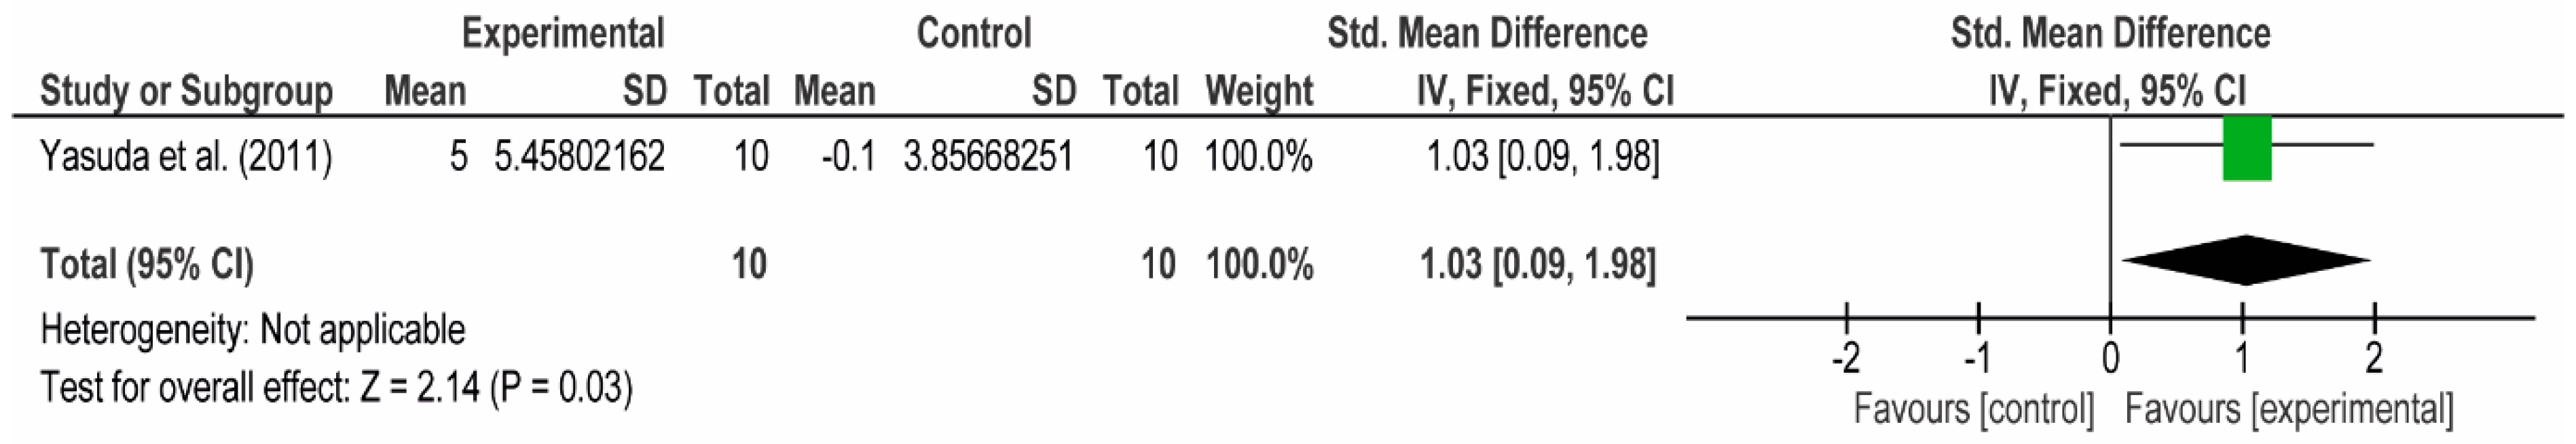
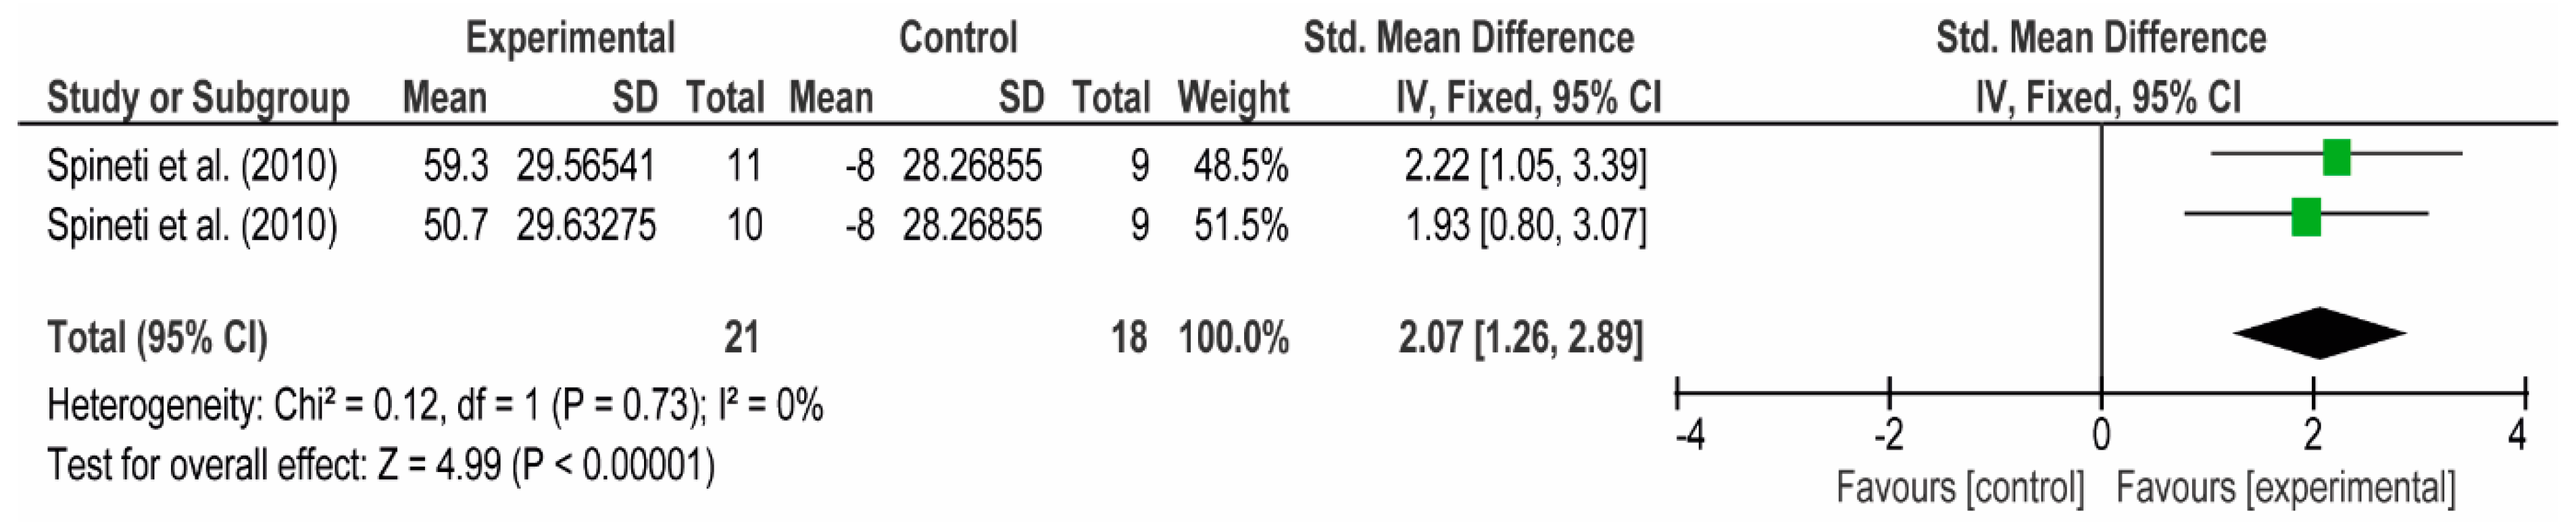
3.4.1. The Chest
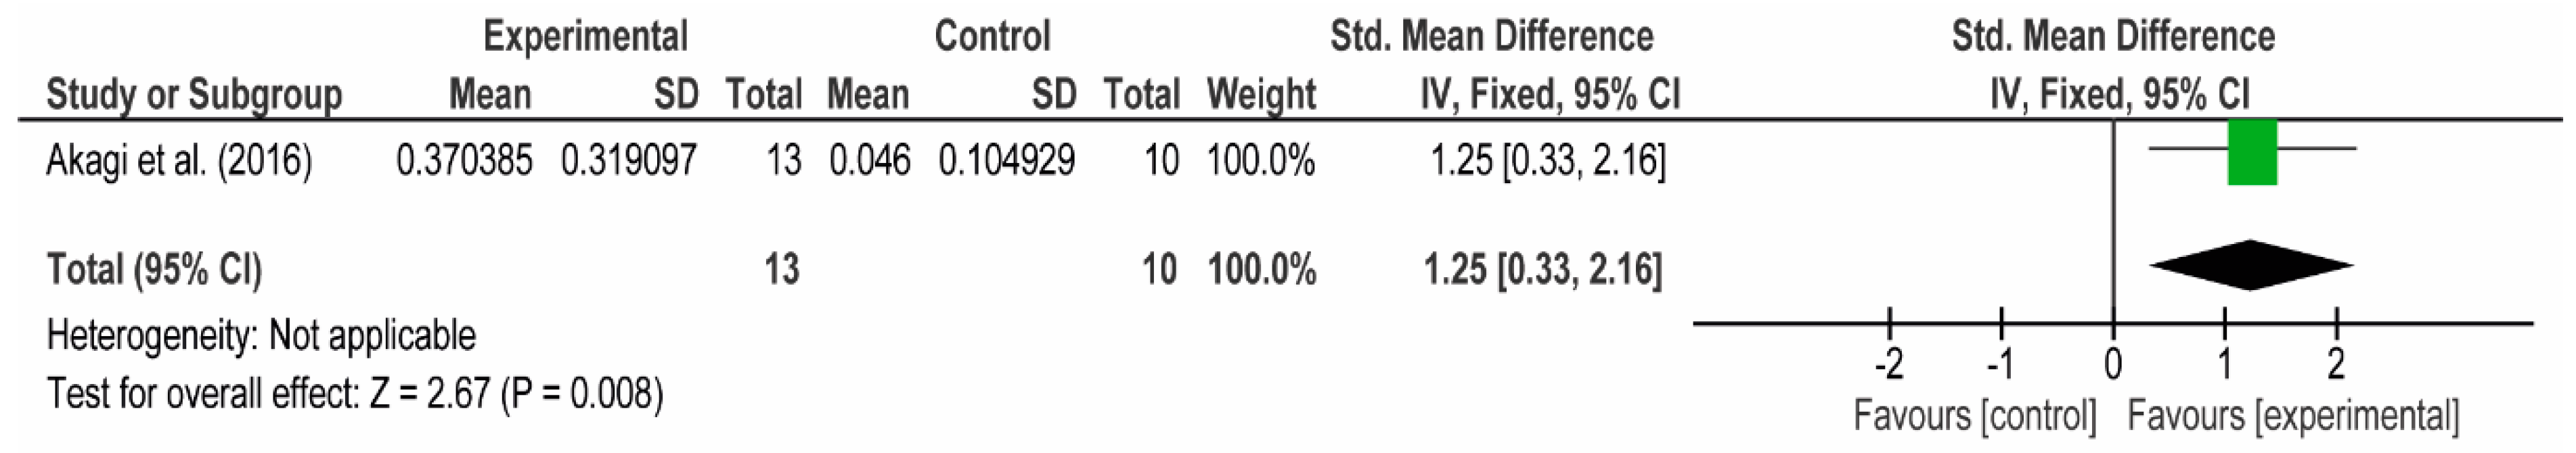
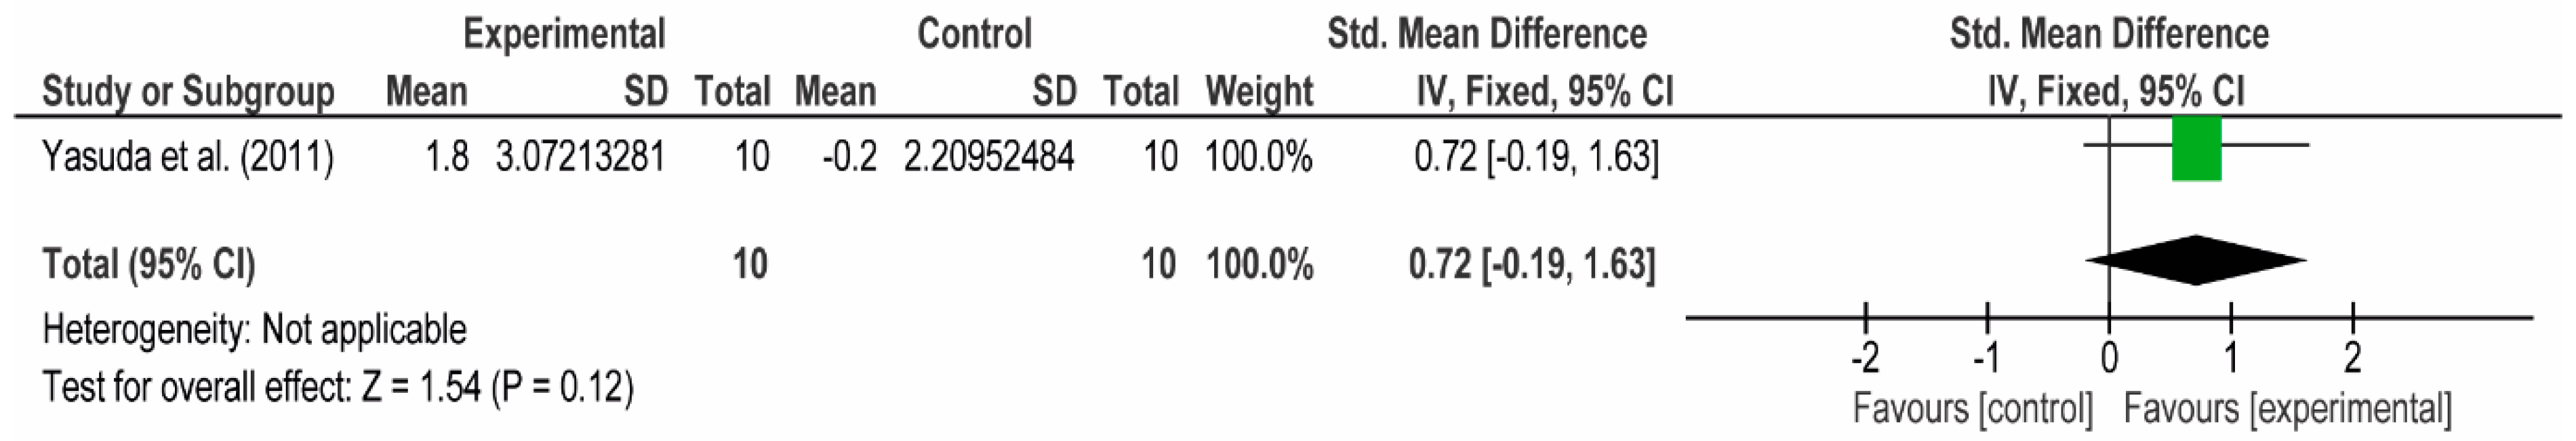
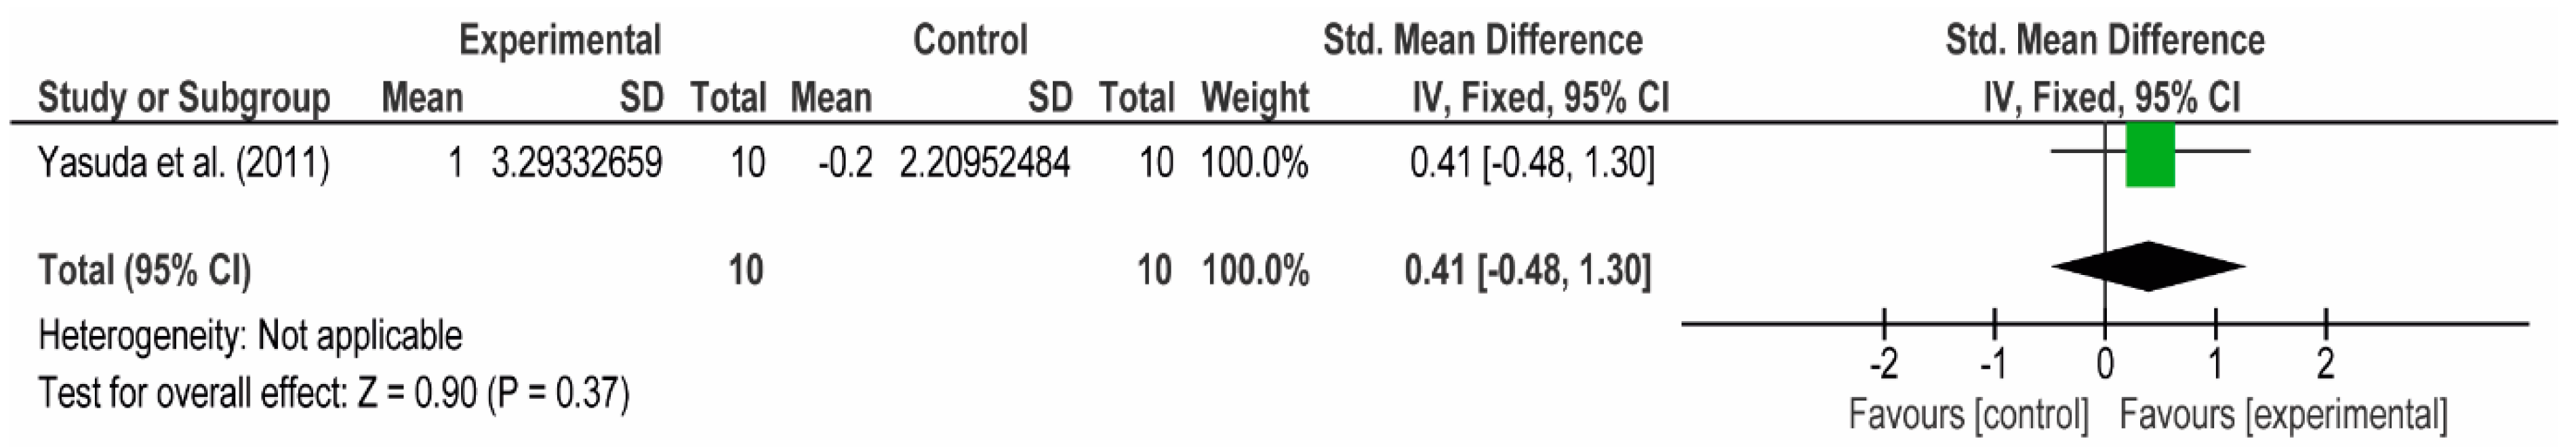
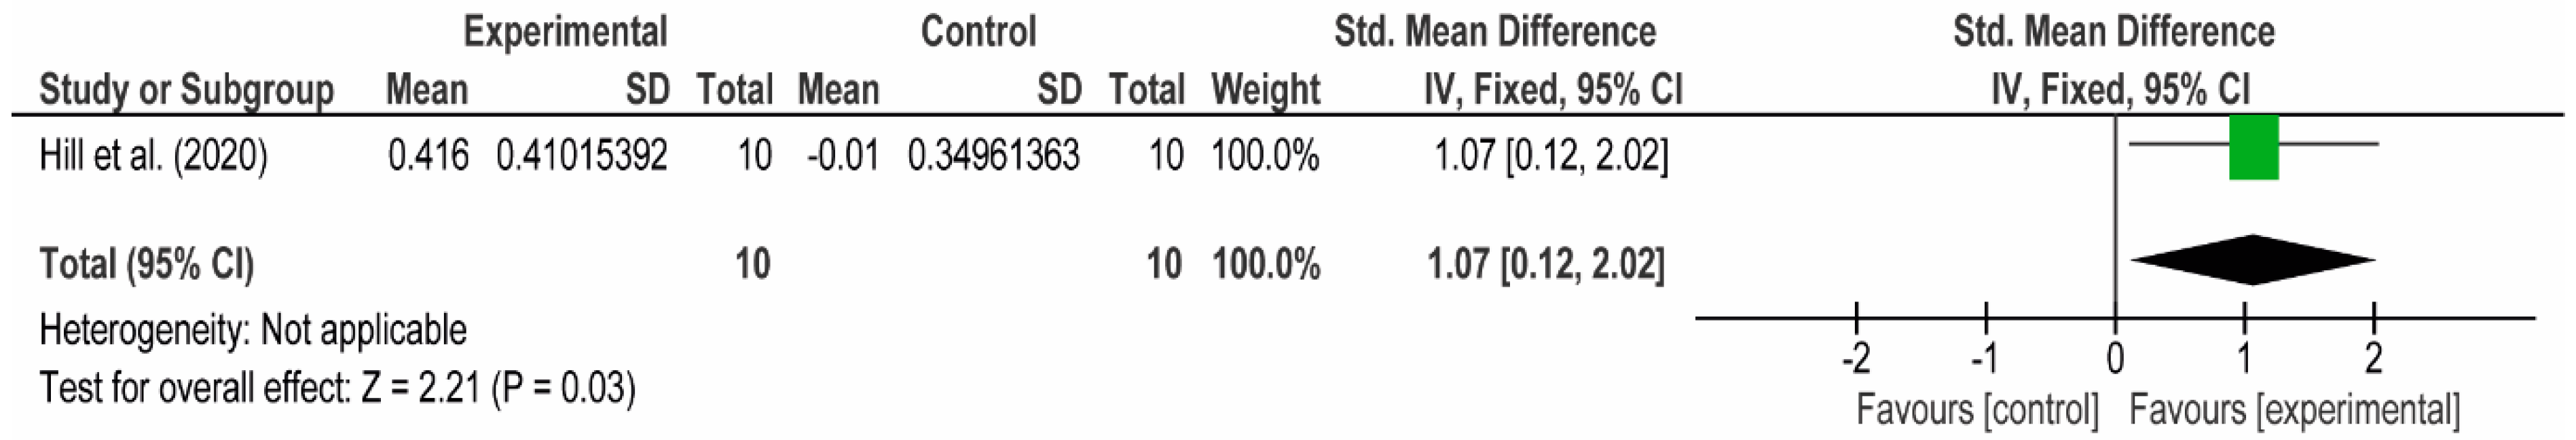
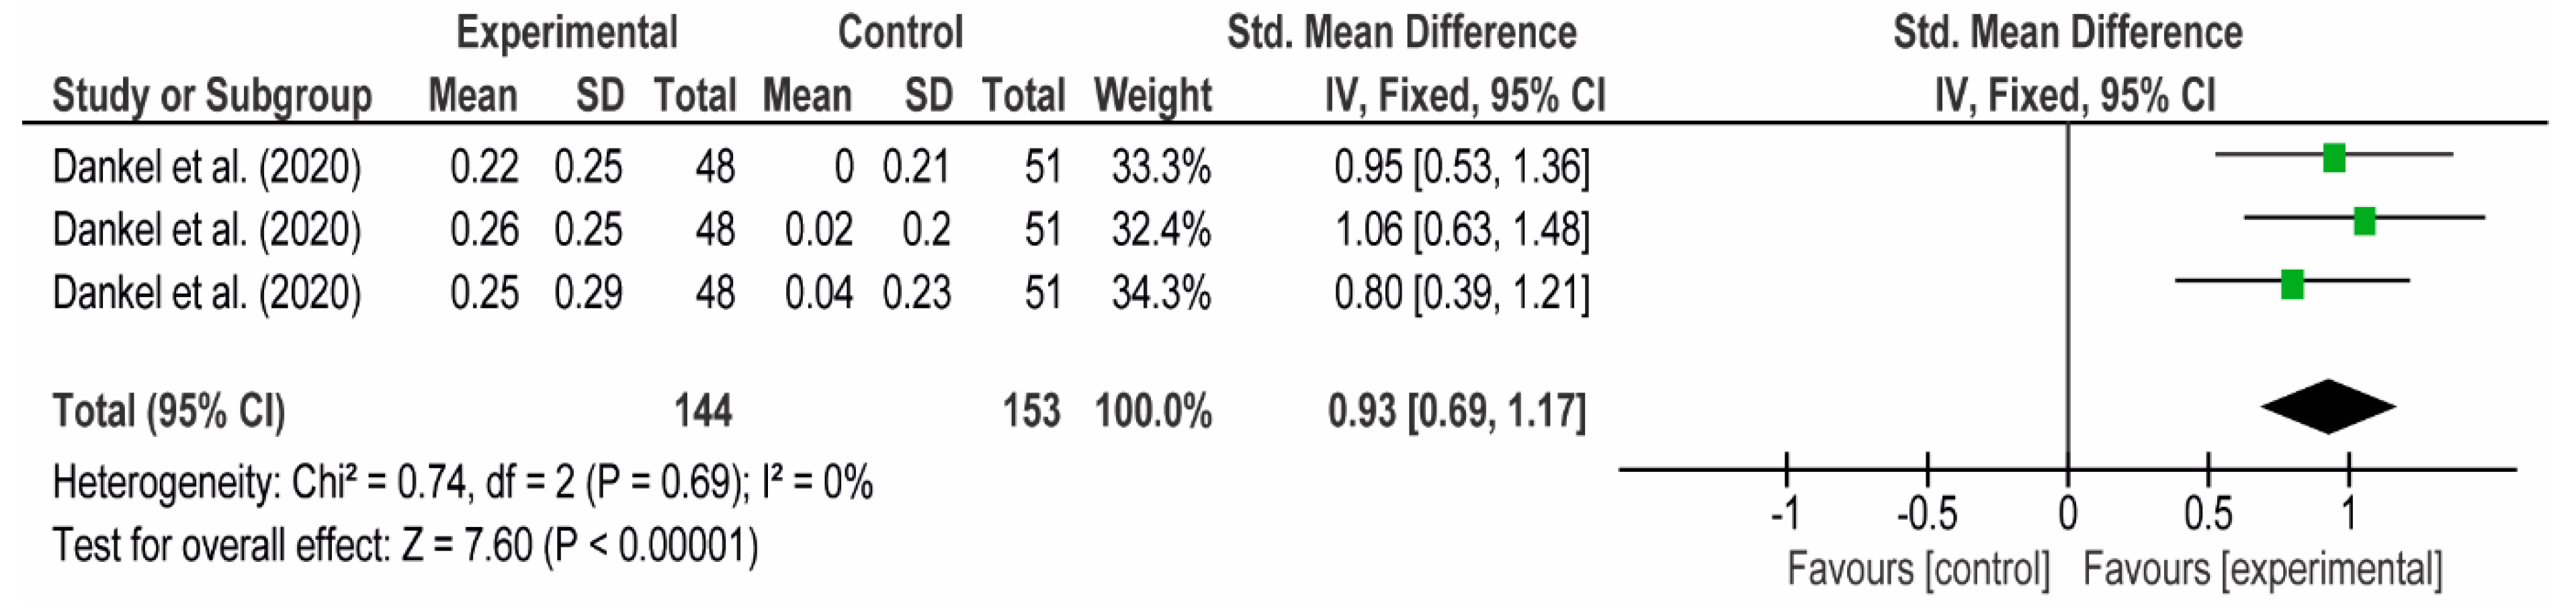
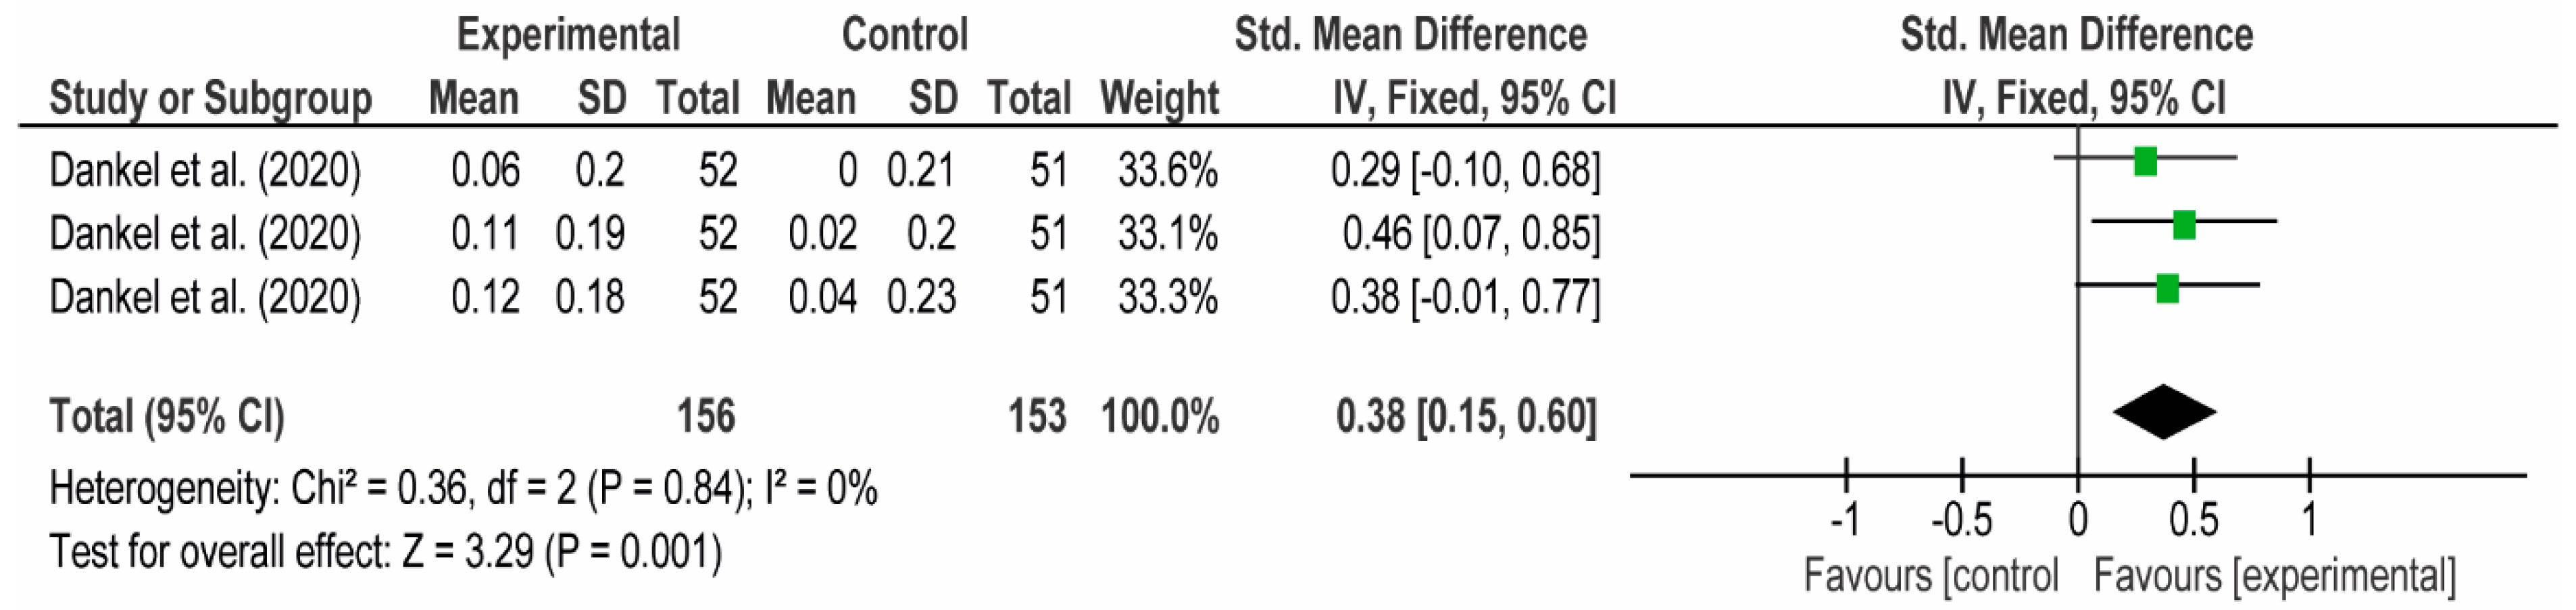
3.4.2. The Posterior Arm
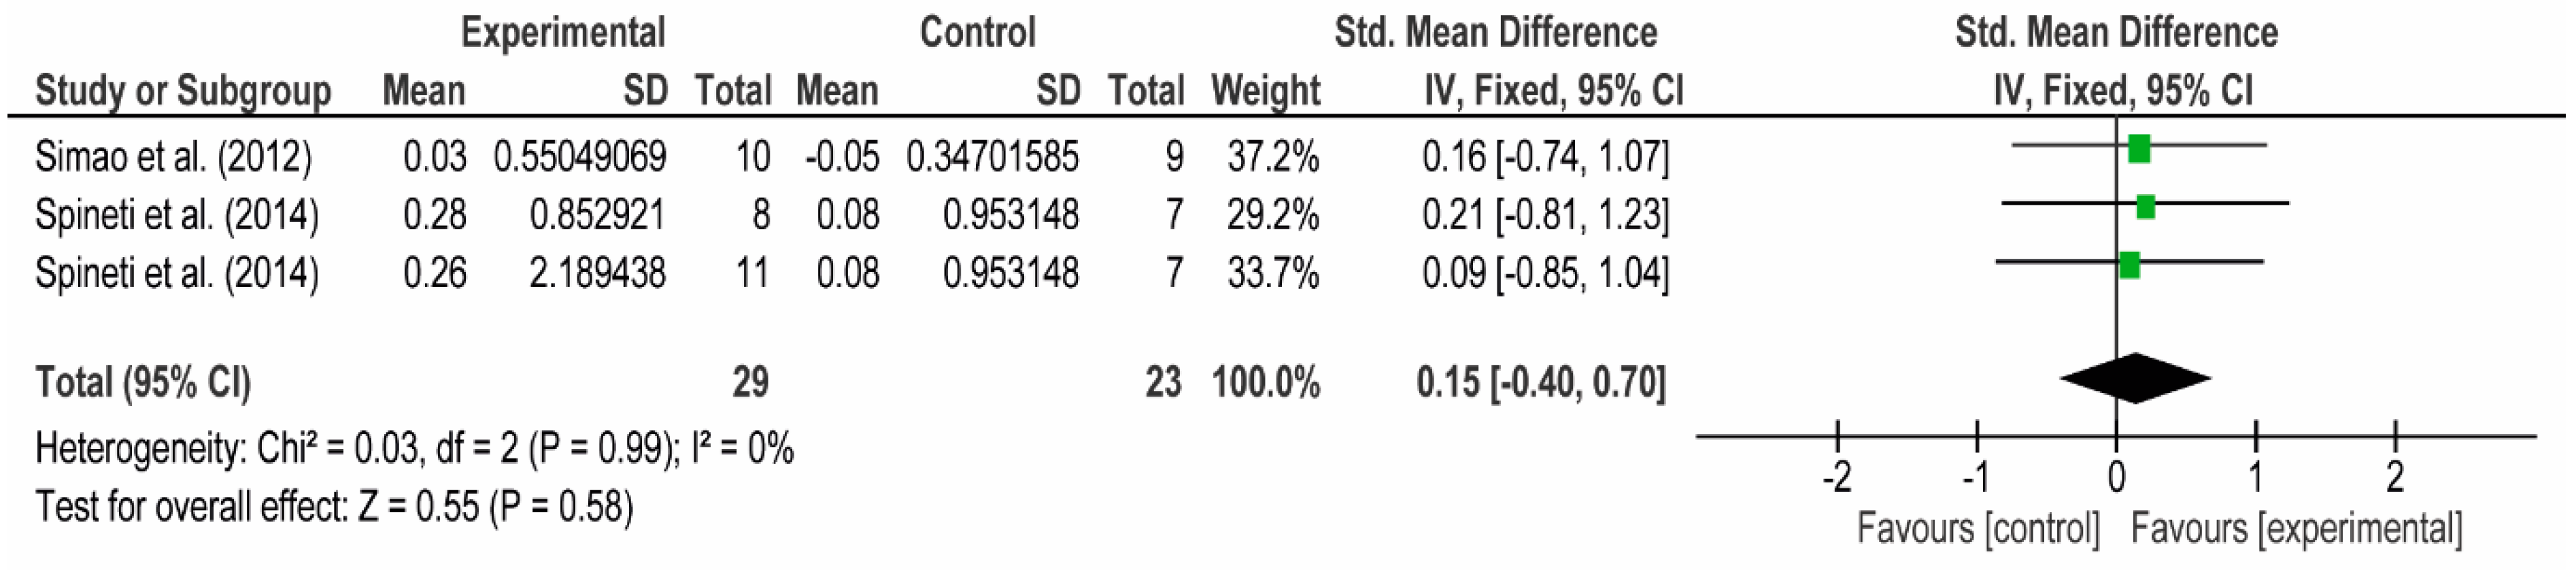
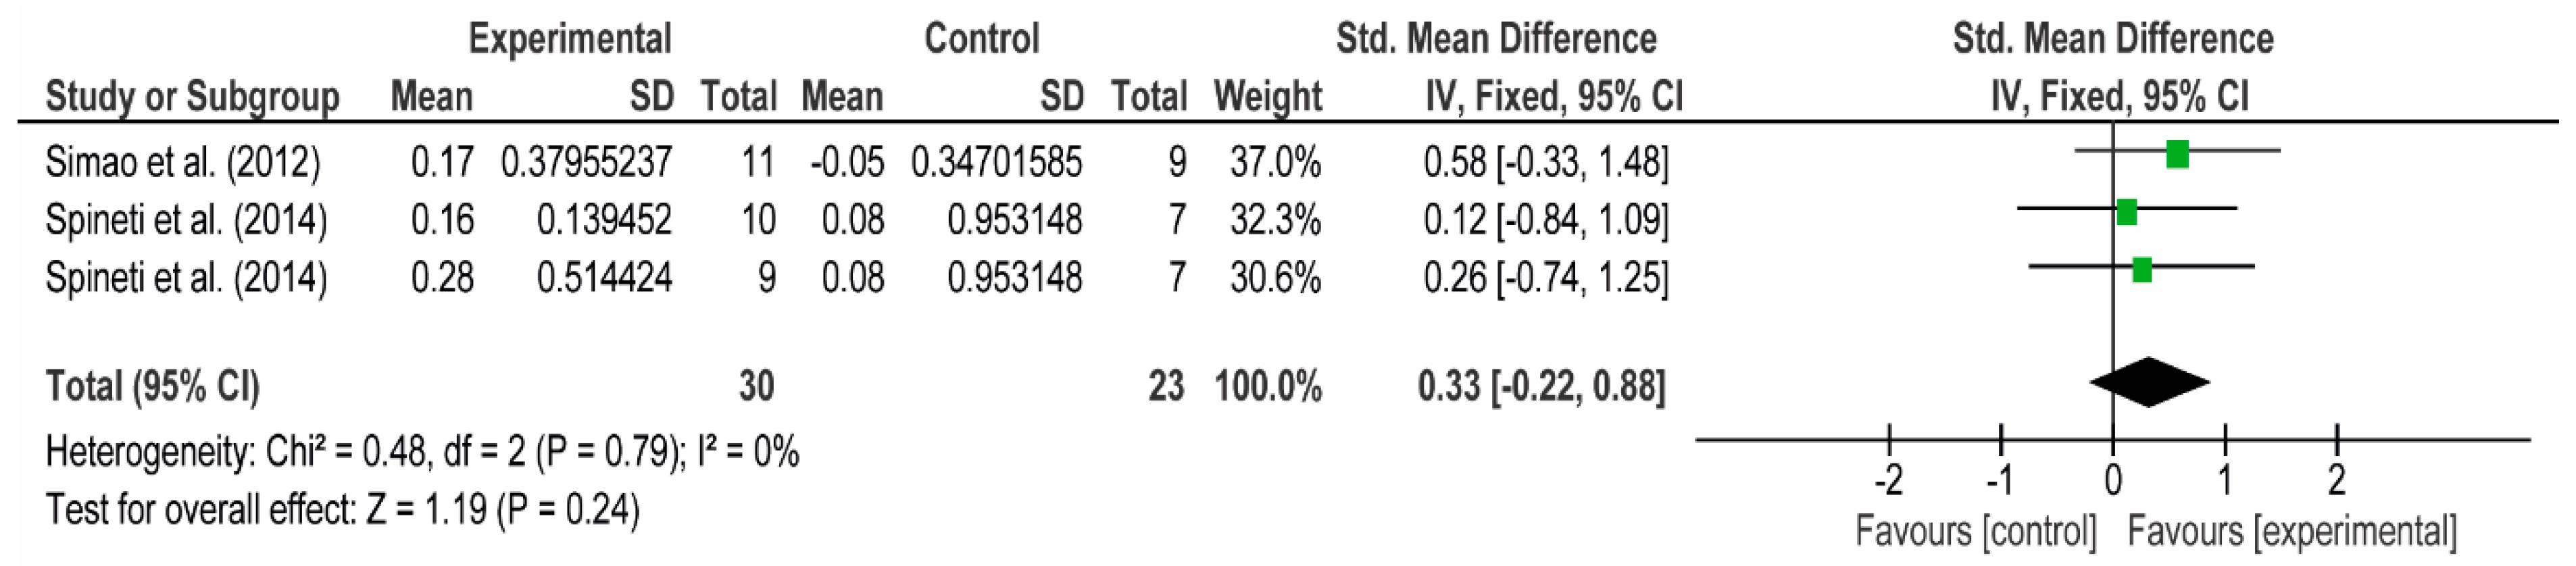
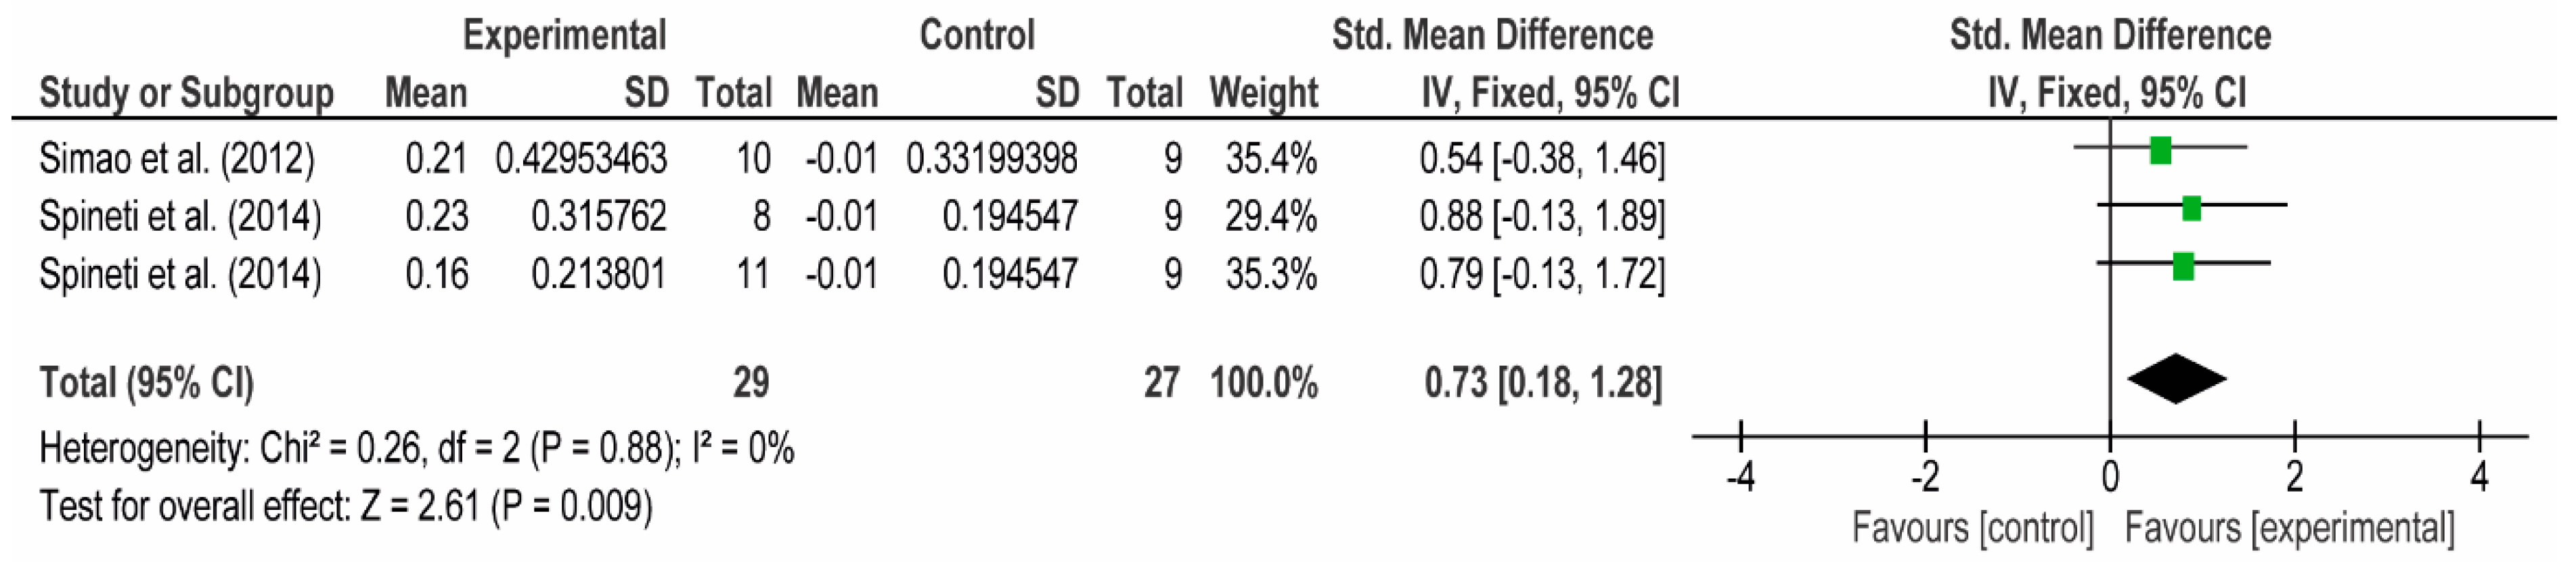
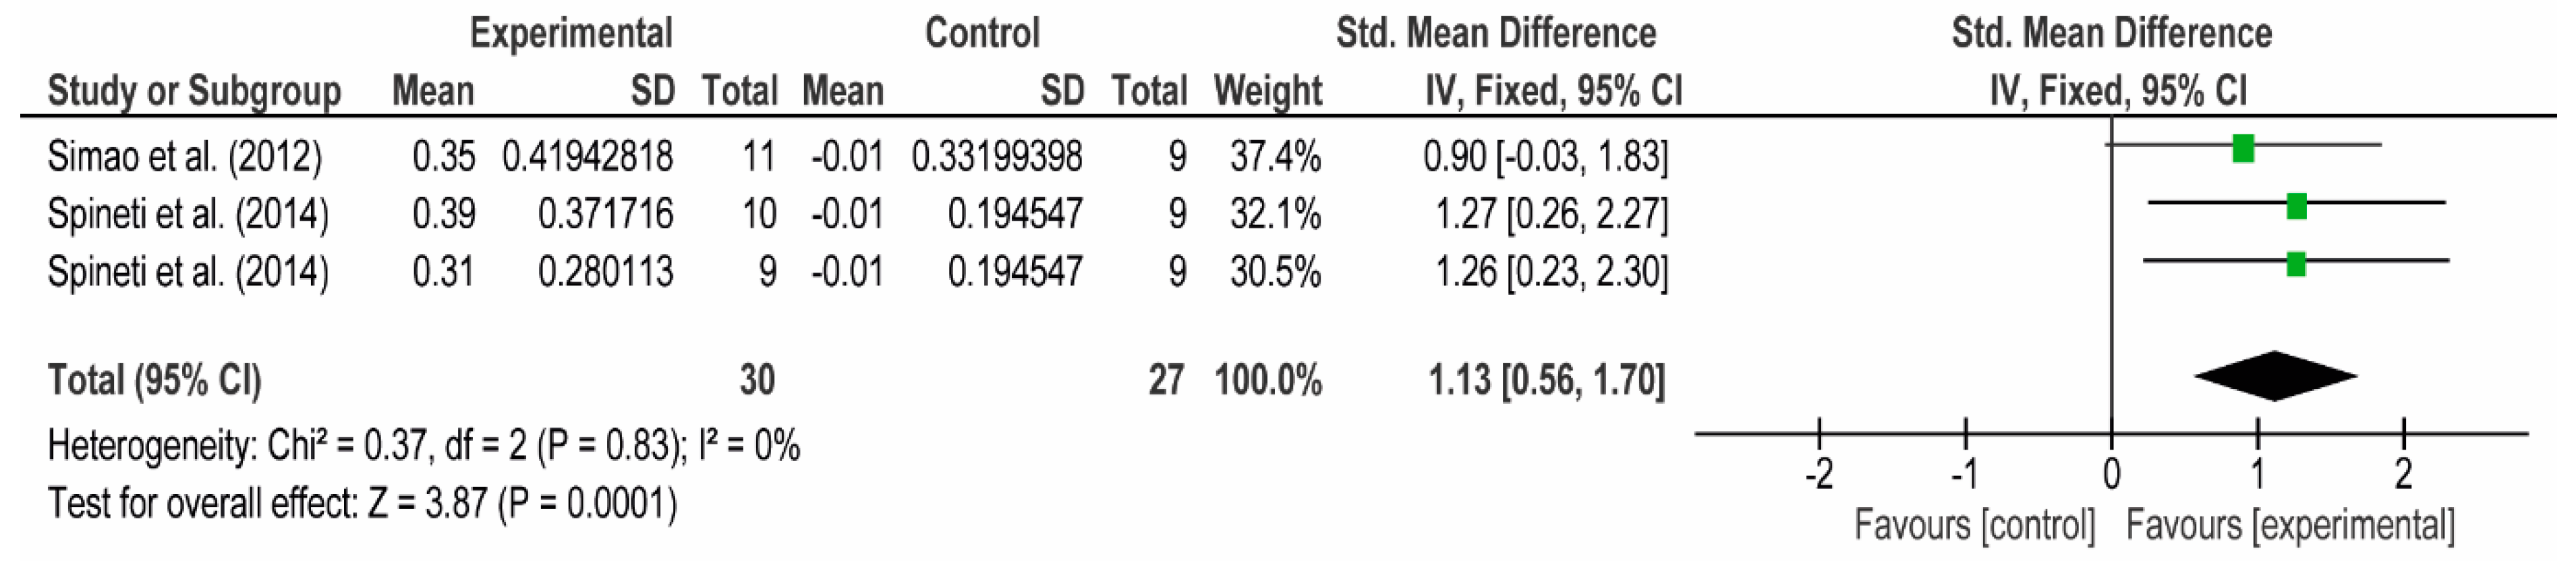
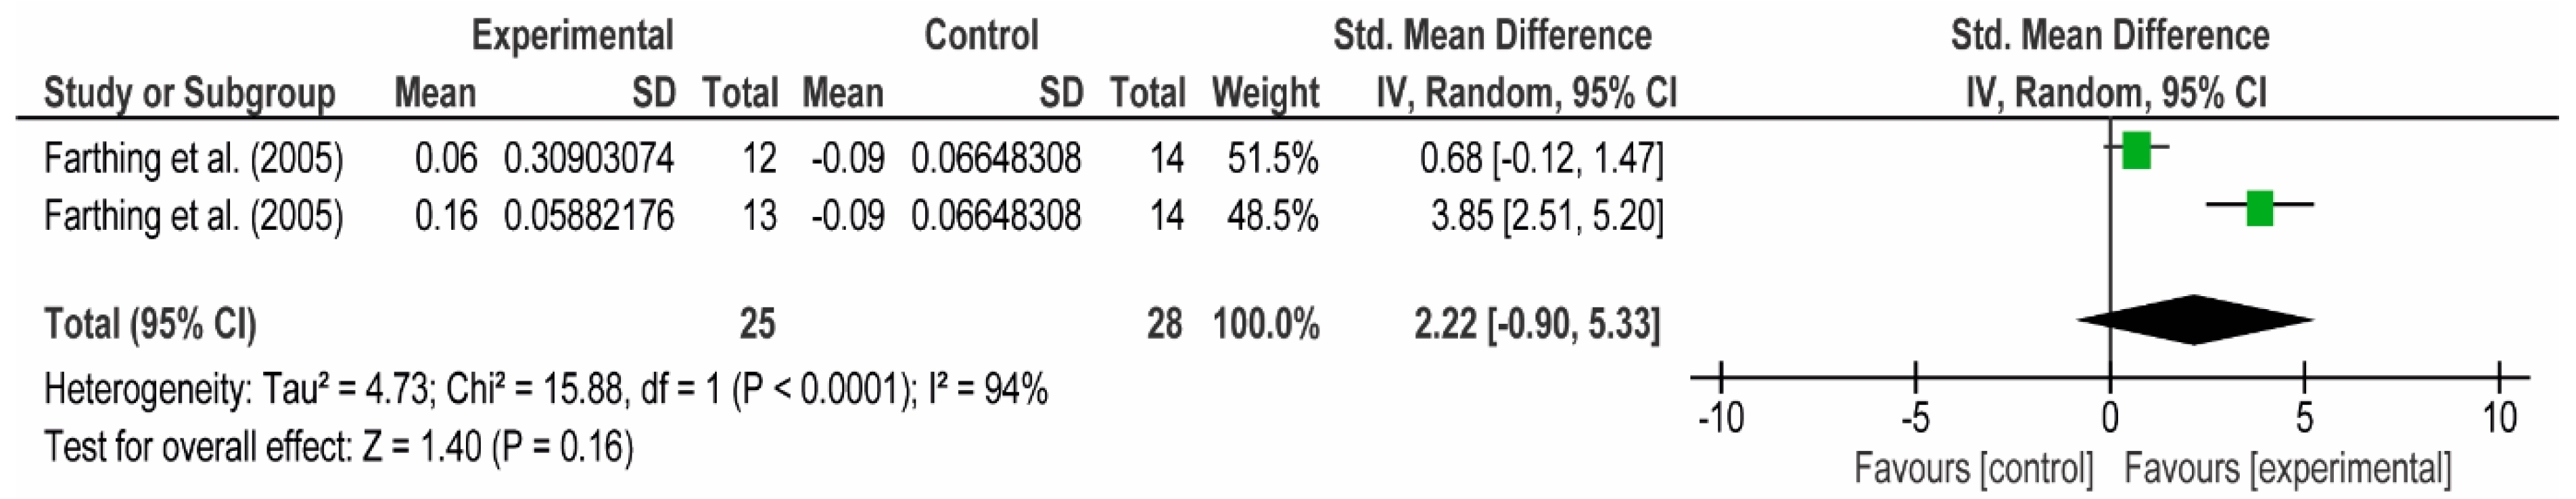
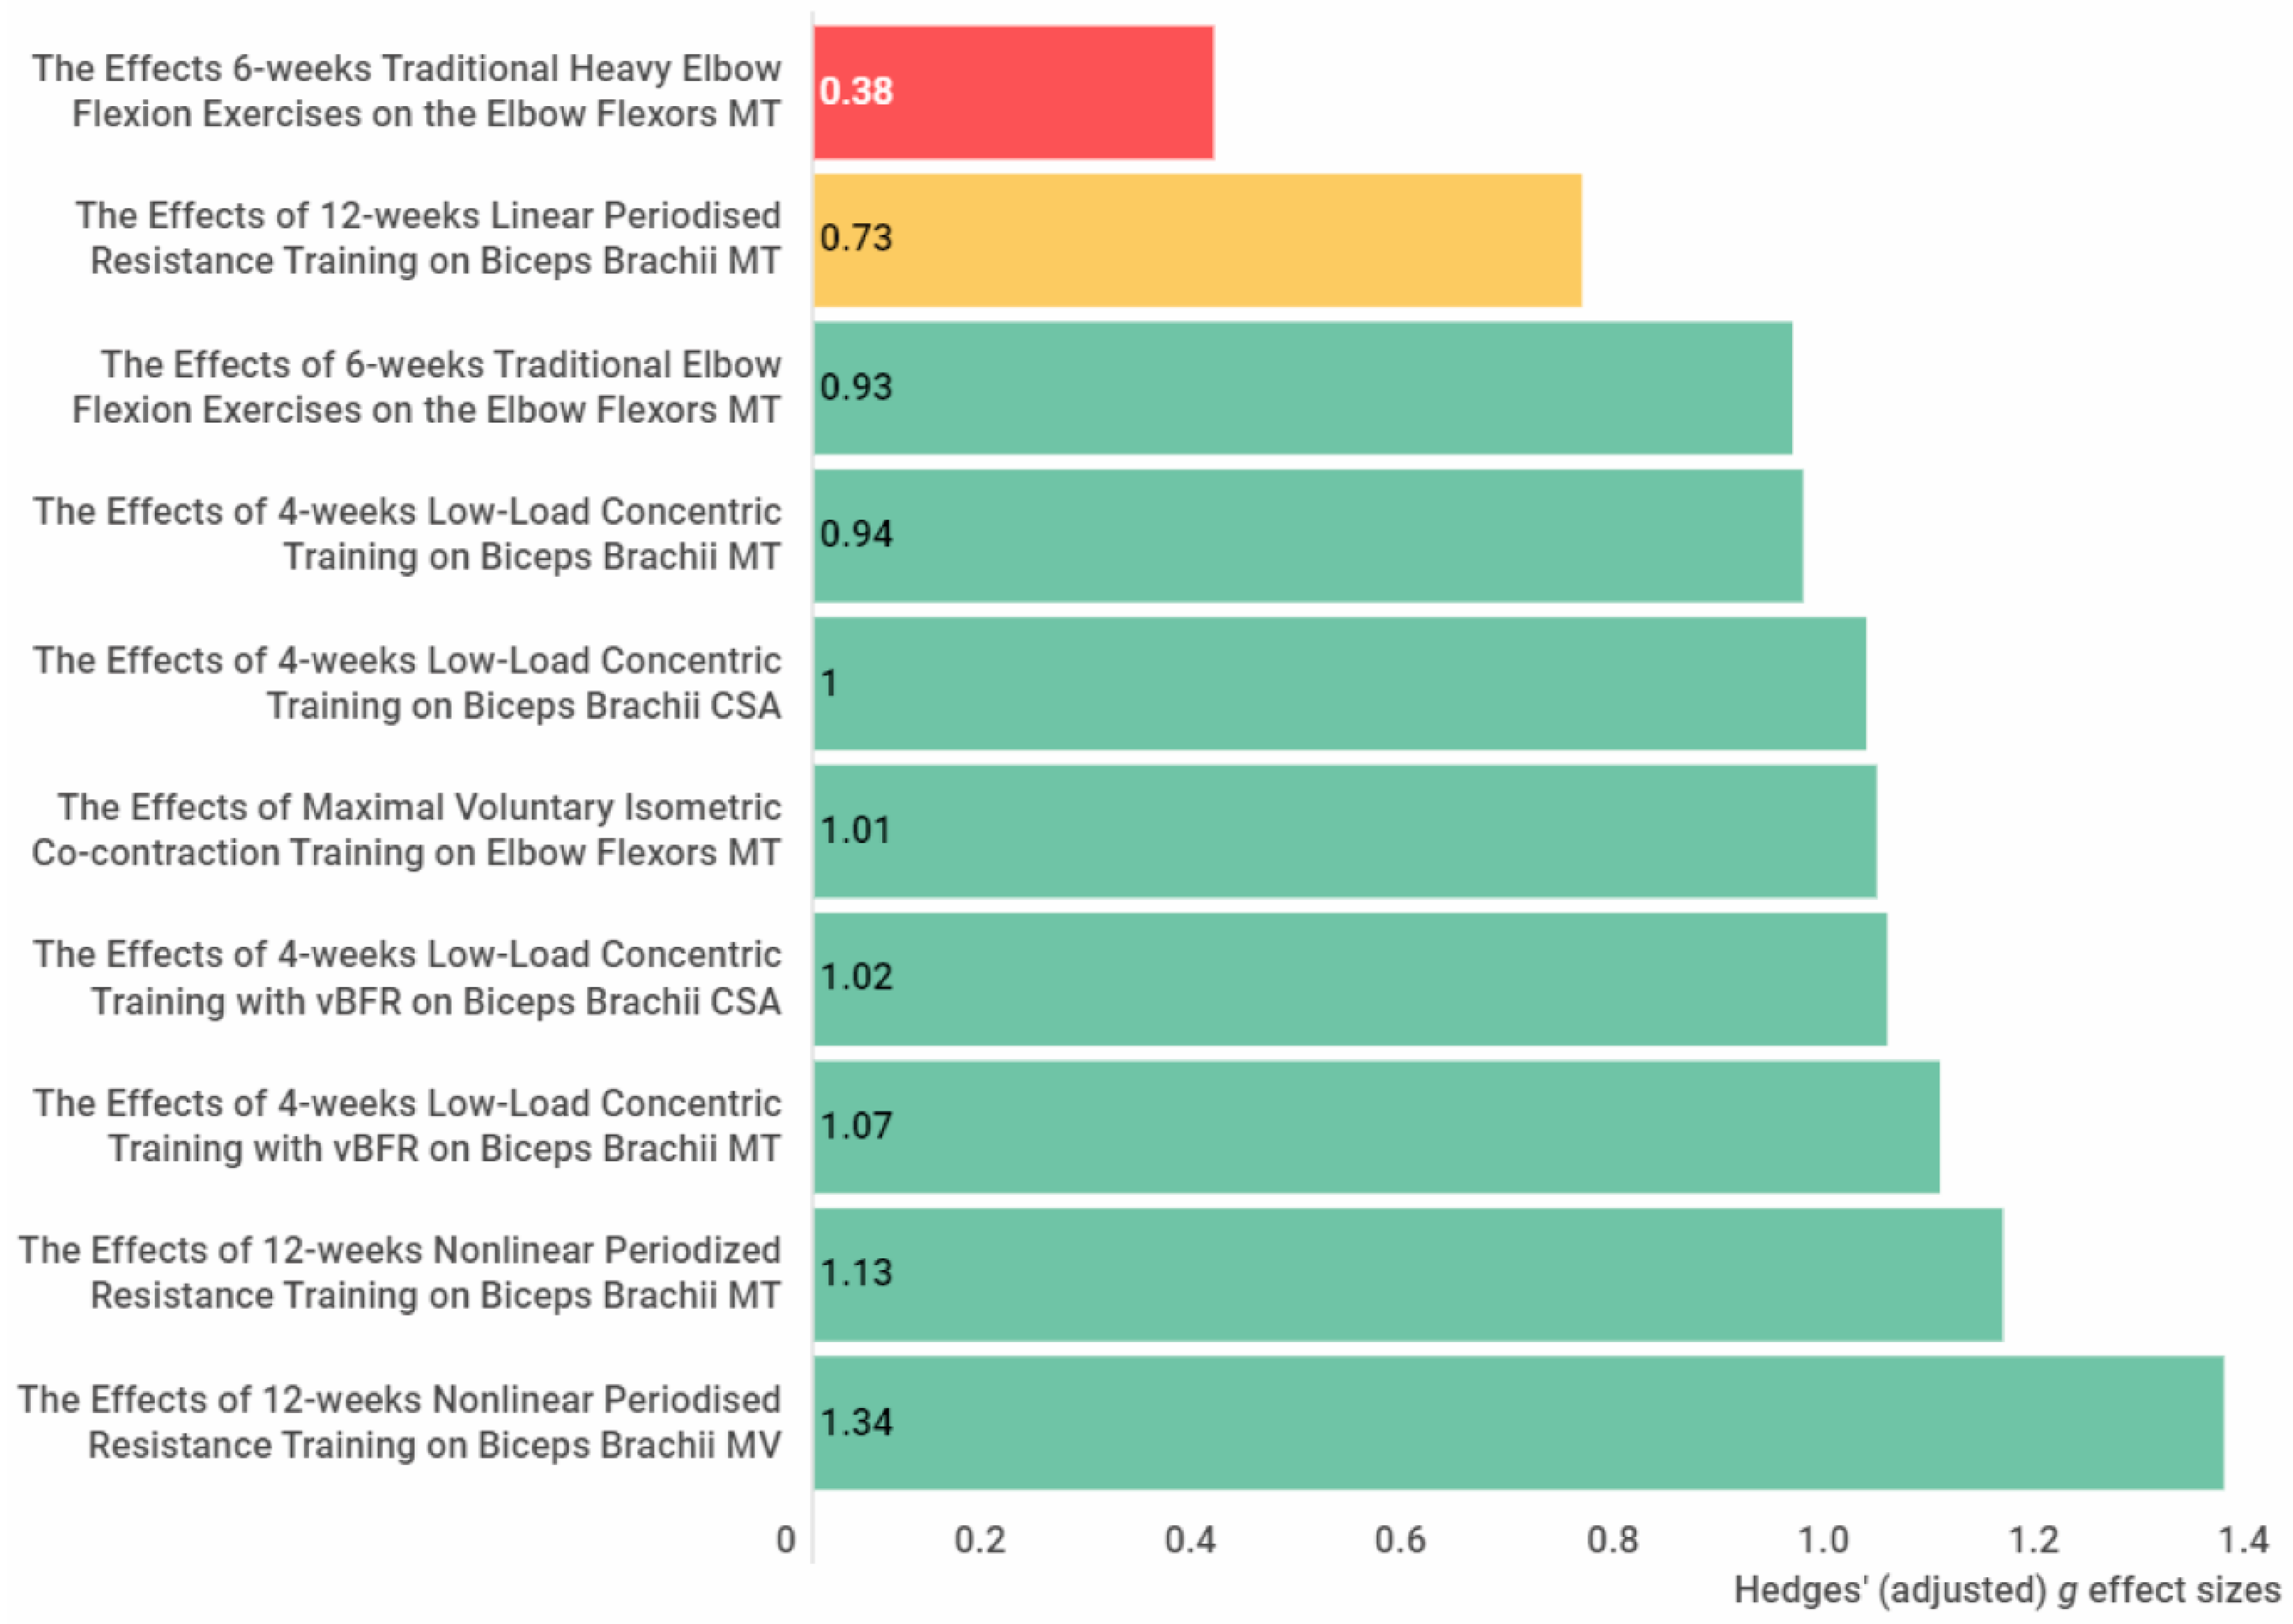
3.4.3. The Anterior Arm
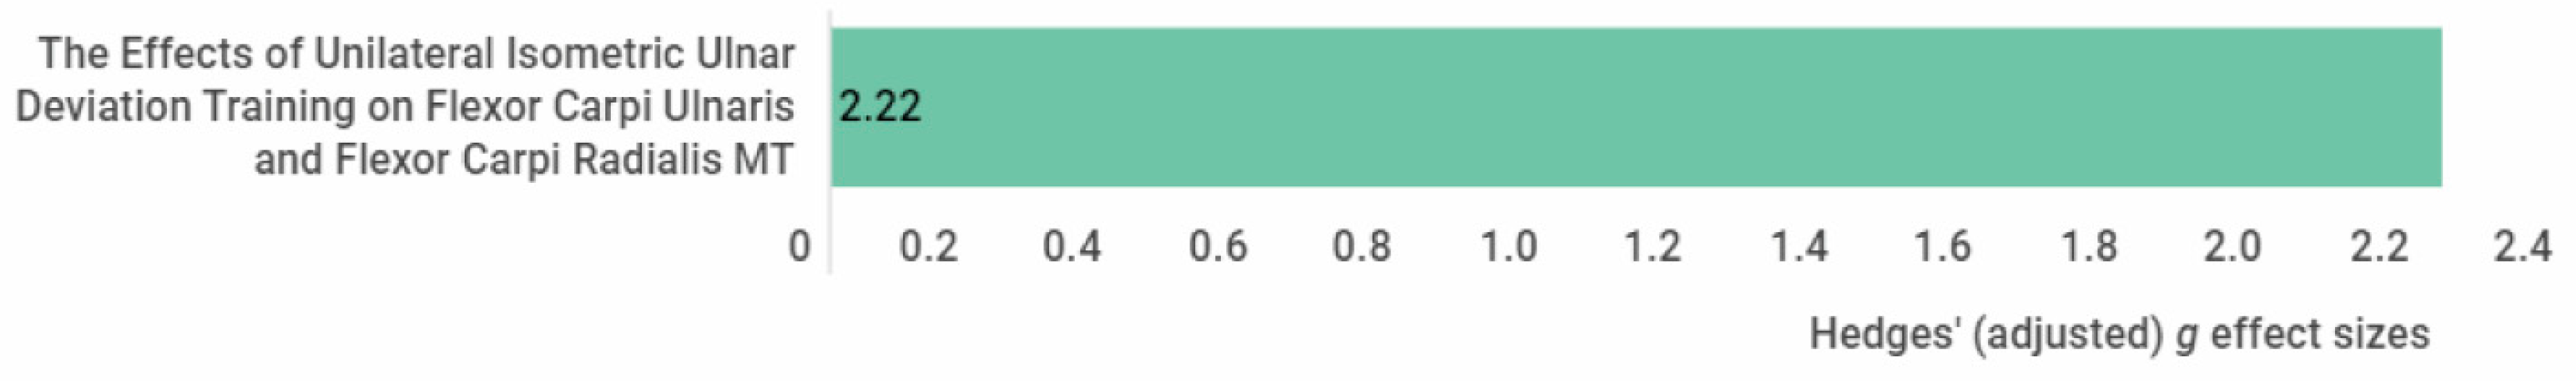
3.4.4. Forearm
3.5. Level of Evidence of the Meta-Analyses
4. Discussion
5. Conclusions
Supplementary Materials
Author Contributions
Funding
Institutional Review Board Statement
Informed Consent Statement
Data Availability Statement
Acknowledgments
Conflicts of Interest
References
- Blazevich, A. Effects of Physical Training and Detraining, Immobilisation, Growth and Aging on Human Fascicle Geometry. Sports Med. 2006, 36, 1003–1017. [Google Scholar] [CrossRef] [PubMed]
- Lieber, R.L.; Fridén, J. Functional and clinical significance of skeletal muscle architecture. Muscle Nerve 2000, 23, 1647–1666. [Google Scholar] [CrossRef]
- Abe, T.; Kojima, K.; Stager, J.M. Skeletal muscle mass and muscular function in master swimmers is related to training distance. Rejuvenation Res. 2014, 17, 415–421. [Google Scholar] [CrossRef] [PubMed]
- Abe, T.; Loenneke, J.P.; Thiebaud, R.S. Morphological and functional relationships with ultrasound measured muscle thickness of the lower extremity: A brief review. Ultrasound 2015, 23, 166–173. [Google Scholar] [CrossRef] [PubMed] [Green Version]
- Akima, H.; Kano, Y.; Enomoto, Y.; Ishizu, M.; Okada, M.; Oishi, Y.; Katsuta, S.; Kuno, S. Muscle function in 164 men and women aged 20–84 year. Med. Sci. Sports Exerc. 2001, 33, 220–226. [Google Scholar] [CrossRef]
- Freilich, R.J.; Kirsner, R.L.; Byrne, E. Isometric strength and thickness relationships in human quadriceps muscle. Neuromuscul. Disord. 1995, 5, 415–422. [Google Scholar] [CrossRef]
- Fukunaga, T.; Roy, R.R.; Shellock, F.G.; Hodgson, J.A.; Edgerton, V.R. Specific tension of human plantar flexors and dorsiflexors. J. Appl. Physiol. 1996, 80, 158–165. [Google Scholar] [CrossRef] [PubMed]
- Ikai, M.; Fukunaga, T. Calculation of muscle strength per unit cross-sectional area of human muscle by means of ultrasonic measurement. Int. Z. Angew. Physiol. 1968, 26, 26–32. [Google Scholar] [CrossRef]
- Lieber, R.L. Skeletal Muscle Structure and Function; Lippincott Williams & Wilkins: Baltimore, MD, USA, 1992. [Google Scholar]
- Maughan, R.J.; Watson, J.S.; Weir, J. Strength and cross-sectional area of human skeletal muscle. J. Physiol. 1983, 338, 37–49. [Google Scholar] [CrossRef]
- Moreau, N.G.; Simpson, K.N.; Teefey, S.A.; Damiano, D.L. Muscle architecture predicts maximum strength and is related to activity levels in cerebral palsy. Phys. Ther. 2010, 90, 1619–1630. [Google Scholar] [CrossRef]
- Narici, M.V.; Landoni, L.; Minetti, A.E. Assessment of human knee extensor muscles stress from in vivo physiological cross-sectional area and strength measurements. Eur. J. Appl. Physiol. Occup. Physiol. 1992, 65, 438–444. [Google Scholar] [CrossRef] [PubMed]
- Shephard, R.J.; Bouhlel, E.; Vandewalle, H.; Monod, H. Muscle mass as a factor limiting physical work. J. Appl. Physiol. 1988, 64, 1472–1479. [Google Scholar] [CrossRef] [PubMed]
- Strasser, E.M.; Draskovits, T.; Praschak, M.; Quittan, M.; Graf, A. Association between ultrasound measurements of muscle thickness, pennation angle, echogenicity and skeletal muscle strength in the elderly. Age 2013, 35, 2377–2388. [Google Scholar] [CrossRef] [PubMed] [Green Version]
- Abe, T.; Fukashiro, S.; Harada, Y.; Kawamoto, K. Relationship between sprint performance and muscle fascicle length in female sprinters. J. Physiol. Anthropol. Appl. Hum. Sci. 2001, 20, 141–147. [Google Scholar] [CrossRef] [PubMed] [Green Version]
- Anousaki, E.; Zaras, N.; Stasinaki, A.N.; Panidi, I.; Terzis, G.; Karampatsos, G. Effects of a 25-Week Periodized Training Macrocycle on Muscle Strength, Power, Muscle Architecture, and Performance in Well-Trained Track and Field Throwers. J. Strength Cond. Res. 2021, 35, 2728–2736. [Google Scholar] [CrossRef]
- Brechue, W.F.; Abe, T. The role of FFM accumulation and skeletal muscle architecture in powerlifting performance. Eur. J. Appl. Physiol. 2002, 86, 327–336. [Google Scholar] [CrossRef]
- Ikebukuro, T.; Kubo, K.; Okada, J.; Yata, H.; Tsunoda, N. The relationship between muscle thickness in the lower limbs and competition performance in weightlifters and sprinters. Jpn. J. Phys. Fit. Sports Med. 2011, 60, 401–411. [Google Scholar]
- Kumagai, K.; Abe, T.; Brechue, W.; Ryushi, T.; Takano, S.; Mizuno, M. Sprint performance is related to muscle fascicle length in male 100-m sprinters. J. Appl. Physiol. 2000, 88, 811–816. [Google Scholar] [CrossRef]
- Mangine, G.T.; Fukuda, D.H.; LaMonica, M.B.; Gonzalez, A.M.; Wells, A.J.; Townsend, J.R.; Jajtner, A.R.; Fragala, M.S.; Stout, J.R.; Hoffman, J.R. Influence of gender and muscle architecture asymmetry on jump and sprint performance. J. Sports Sci. Med. 2014, 13, 904–911. [Google Scholar]
- Mangine, G.T.; Fukuda, D.H.; Townsend, J.R.; Wells, A.J.; Gonzalez, A.M.; Jajtner, A.R.; Bohner, J.D.; LaMonica, M.; Hoffman, J.R.; Fragala, M.S.; et al. Sprinting performance on the Woodway Curve 3.0TM is related to muscle architecture. Eur. J. Sport Sci. 2015, 15, 606–614. [Google Scholar] [CrossRef]
- Nasirzade, A.; Ehsanbakhsh, A.; Argavani, H.; Sobhkhiz, A.; Aliakbari, M. Selected anthropometrical, muscular architecture, and biomechanical variables as predictors of 50-m performance of front crawl swimming in young male swimmers. Sci. Sports 2014, 29, e75–e81. [Google Scholar] [CrossRef]
- Nasirzade, A.; Ehsanbakhsh, A.; Ilbeygi, S.; Sobhkhiz, A.; Argavani, H.; Aliakbari, M. Relationship between sprint performance of front crawl swimming and muscle fascicle length in young swimmers. J. Sports Sci. Med. 2014, 13, 550–556. [Google Scholar] [PubMed]
- Nimphius, S.; McGuigan, M.R.; Newton, R.U. Changes in muscle architecture and performance during a competitive season in female softball players. J. Strength Cond. Res. 2012, 26, 2655–2666. [Google Scholar] [CrossRef] [PubMed]
- Zaras, N.; Stasinaki, A.-N.; Terzis, G. Biological Determinants of Track and Field Throwing Performance. J. Funct. Morphol. Kinesiol. 2021, 6, 40. [Google Scholar] [CrossRef]
- Zaras, N.D.; Stasinaki, A.N.; Methenitis, S.K.; Krase, A.A.; Karampatsos, G.P.; Georgiadis, G.V.; Spengos, K.M.; Terzis, G.D. Rate of Force Development, Muscle Architecture, and Performance in Young Competitive Track and Field Throwers. J. Strength Cond. Res. 2016, 30, 81–92. [Google Scholar] [CrossRef] [Green Version]
- Hides, J.; Frazer, C.; Blanch, P.; Grantham, B.; Sexton, C.; Mendis, M.D. Clinical utility of measuring the size of the lumbar multifidus and quadratus lumborum muscles in the Australian football league setting: A prospective cohort study. Phys. Ther. Sport 2020, 46, 186–193. [Google Scholar] [CrossRef]
- Hides, J.A.; Brown, C.T.; Penfold, L.; Stanton, W.R. Screening the lumbopelvic muscles for a relationship to injury of the quadriceps, hamstrings, and adductor muscles among elite Australian Football League players. J. Orthop. Sports Phys. Ther. 2011, 41, 767–775. [Google Scholar] [CrossRef]
- Hides, J.A.; Stanton, W.R. Can motor control training lower the risk of injury for professional football players? Med. Sci. Sports Exerc. 2014, 46, 762–768. [Google Scholar] [CrossRef] [Green Version]
- Hides, J.A.; Stanton, W.R. Predicting football injuries using size and ratio of the multifidus and quadratus lumborum muscles. Scand. J. Med. Sci. Sports 2017, 27, 440–447. [Google Scholar] [CrossRef]
- Hides, J.A.; Stanton, W.R.; Mendis, M.D.; Franettovich Smith, M.M.; Sexton, M.J. Small Multifidus Muscle Size Predicts Football Injuries. Orthop. J. Sports Med. 2014, 2, 2325967114537588. [Google Scholar] [CrossRef] [Green Version]
- Jeon, J.Y.; Kang, H.W.; Kim, D.Y.; Kim, Y.T.; Lee, D.Y.; Lee, D.-O. Relationship between calf muscle cross-sectional area and ankle fracture. Foot Ankle Surg. 2020, 27, 860–864. [Google Scholar] [CrossRef] [PubMed]
- Mangine, G.T.; Hoffman, J.R.; Gonzalez, A.M.; Jajtner, A.R.; Scanlon, T.; Rogowski, J.P.; Wells, A.J.; Fragala, M.S.; Stout, J.R. Bilateral differences in muscle architecture and increased rate of injury in national basketball association players. J. Athl. Train. 2014, 49, 794–799. [Google Scholar] [CrossRef] [PubMed] [Green Version]
- Timmins, R.G.; Bourne, M.N.; Shield, A.J.; Williams, M.D.; Lorenzen, C.; Opar, D.A. Short biceps femoris fascicles and eccentric knee flexor weakness increase the risk of hamstring injury in elite football (soccer): A prospective cohort study. Br. J. Sports Med. 2016, 50, 1524–1535. [Google Scholar] [CrossRef] [PubMed]
- Netter, F.H. Atlas of Human Anatomy; Elsevier: Amsterdam, The Netherlands, 2014. [Google Scholar]
- Nasirzadeh, A.; Sadeghi, H.; Sobhkhiz, A.; Mohammadian, K.; Nikouei, A.; Baghaian, M.; Fatahi, A. Multivariate analysis of 200-m front crawl swimming performance in young male swimmers. Acta Bioeng. Biomech. Wroc. Univ. Technol. 2015, 17, 137–143. [Google Scholar] [CrossRef]
- Tachibana, K.; Yashiro, K.; Miyazaki, J.; Ikegami, Y.; Higuchi, M. Muscle cross-sectional areas and performance power of limbs and trunk in the rowing motion. Sports Biomech. 2007, 6, 44–58. [Google Scholar] [CrossRef] [PubMed]
- Terzis, G.; Georgiadis, G.; Vassiliadou, E.; Manta, P. Relationship between shot put performance and triceps brachii fiber type composition and power production. Eur. J. Appl. Physiol. 2003, 90, 10–15. [Google Scholar] [CrossRef]
- Fukunaga, T.; Miyatani, M.; Tachi, M.; Kouzaki, M.; Kawakami, Y.; Kanehisa, H. Muscle volume is a major determinant of joint torque in humans. Acta Physiol. Scand. 2001, 172, 249–255. [Google Scholar] [CrossRef]
- Moss, B.M.; Refsnes, P.E.; Abildgaard, A.; Nicolaysen, K.; Jensen, J. Effects of maximal effort strength training with different loads on dynamic strength, cross-sectional area, load-power and load-velocity relationships. Eur. J. Appl. Physiol. Occup. Physiol. 1997, 75, 193–199. [Google Scholar] [CrossRef]
- Ichinose, Y.; Kanehisa, H.; Ito, M.; Kawakami, Y.; Fukunaga, T. Morphological and functional differences in the elbow extensor muscle between highly trained male and female athletes. Eur. J. Appl. Physiol. Occup. Physiol. 1998, 78, 109–114. [Google Scholar] [CrossRef]
- Brorsson, S.; Nilsdotter, A.; Hilliges, M.; Sollerman, C.; Aurell, Y. Ultrasound evaluation in combination with finger extension force measurements of the forearm musculus extensor digitorum communis in healthy subjects. BMC Med. Imaging 2008, 8, 6. [Google Scholar] [CrossRef] [Green Version]
- Akagi, R.; Tohdoh, Y.; Hirayama, K.; Kobayashi, Y. Relationship of pectoralis major muscle size with bench press and bench throw performances. J. Strength Cond. Res. 2014, 28, 1778–1782. [Google Scholar] [CrossRef] [PubMed]
- Thomas, S.J.; Cobb, J.; Sheridan, S.; Rauch, J.; Paul, R.W. Chronic Adaptations of the Posterior Rotator Cuff in Professional Pitchers. Am. J. Sports Med. 2021, 49, 892–898. [Google Scholar] [CrossRef] [PubMed]
- Wakahara, T.; Kanehisa, H.; Kawakami, Y.; Fukunaga, T.; Yanai, T. Relationship between muscle architecture and joint performance during concentric contractions in humans. J. Appl. Biomech. 2013, 29, 405–412. [Google Scholar] [CrossRef] [PubMed]
- Adams, G.R.; Cheng, D.C.; Haddad, F.; Baldwin, K.M. Skeletal muscle hypertrophy in response to isometric, lengthening, and shortening training bouts of equivalent duration. J. Appl. Physiol. 2004, 96, 1613–1618. [Google Scholar] [CrossRef] [Green Version]
- Franchi, M.V.; Reeves, N.D.; Narici, M.V. Skeletal Muscle Remodeling in Response to Eccentric vs. Concentric Loading: Morphological, Molecular, and Metabolic Adaptations. Front. Physiol. 2017, 8, 447. [Google Scholar] [CrossRef] [Green Version]
- Kawakami, Y.; Abe, T.; Fukunaga, T. Muscle-fiber pennation angles are greater in hypertrophied than in normal muscles. J. Appl. Physiol. 1993, 74, 2740–2744. [Google Scholar] [CrossRef]
- Pincheira, P.A.; Boswell, M.A.; Franchi, M.V.; Delp, S.L.; Lichtwark, G.A. Biceps femoris long head sarcomere and fascicle length adaptations after 3 weeks of eccentric exercise training. J. Sport Health Sci. 2021, 24, S29. [Google Scholar] [CrossRef]
- Page, M.J.; McKenzie, J.E.; Bossuyt, P.M.; Boutron, I.; Hoffmann, T.C.; Mulrow, C.D.; Shamseer, L.; Tetzlaff, J.M.; Akl, E.A.; Brennan, S.E.; et al. The PRISMA 2020 statement: An updated guideline for reporting systematic reviews. BMJ 2021, 372, n71. [Google Scholar] [CrossRef]
- Yagiz, G.; Akaras, E.; Kubis, H.-P.; Owen, J.A. Effects of Exercise on Skeletal Muscle Architecture in Healthy Adults: A systematic review of randomised controlled trials (protocol). Int. Platf. Regist. Syst. Rev. Meta-Anal. Protoc. 2020, 307, 1–4. [Google Scholar] [CrossRef]
- The EndNote Team. EndNote, EndNote X9; Clarivate: Philadelphia, PA, USA, 2013. [Google Scholar]
- Ouzzani, M.; Hammady, H.; Fedorowicz, Z.; Elmagarmid, A. Rayyan—A web and mobile app for systematic reviews. Syst. Rev. 2016, 5, 210. [Google Scholar] [CrossRef] [Green Version]
- Higgins, J.P.T.; Altman, D.G.; Gøtzsche, P.C.; Jüni, P.; Moher, D.; Oxman, A.D.; Savović, J.; Schulz, K.F.; Weeks, L.; Sterne, J.A.C. The Cochrane Collaboration’s tool for assessing risk of bias in randomised trials. BMJ 2011, 343, d5928. [Google Scholar] [CrossRef] [PubMed] [Green Version]
- The Cochrane Collaboration. Review Manager, Version 5.4.1; The Nordic Cochrane Centre: Copenhagen, Denmark, 2020. [Google Scholar]
- Deeks, J.; Higgins, J.; Statistical Methods Group of The Cochrane Collaboration. Statistical Algorithms in Review Manager 5. 2007, pp. 1–11. Available online: https://www.researchgate.net/publication/252093205_Statistical_Algorithms_in_Review_Manager_5 (accessed on 11 January 2022).
- Lakens, D. Calculating and reporting effect sizes to facilitate cumulative science: A practical primer for t-tests and ANOVAs. Front. Psychol. 2013, 4, 863. [Google Scholar] [CrossRef] [PubMed] [Green Version]
- Hedges, L.V.; Olkin, I. Statistical Methods for Meta-Analysis; Academic Press: Cambridge, MA, USA, 2014. [Google Scholar]
- Cohen, J. Statistical Power Analysis for the Behavioral Sciences, 2nd ed.; Lawrence Erlbaum Associates: Hillsdale, NJ, USA, 1988. [Google Scholar]
- Brydges, C.R. Effect Size Guidelines, Sample Size Calculations, and Statistical Power in Gerontology. Innov. Aging 2019, 3, igz036. [Google Scholar] [CrossRef] [PubMed]
- Higgins, J.; Thomas, J.; Chandler, J.; Cumpston, M.; Tianjing, L.; Page, M.; Welch, V. Cochrane Handbook for Systematic Reviews of Interventions Version 6.2; Cochrane: London, UK, 2021. [Google Scholar]
- Shida, N.; Yagiz, G.; Yamada, T. The Effects of Exergames on Muscle Architecture: A Systematic Review and Meta-Analysis. Appl. Sci. 2021, 11, 10325. [Google Scholar] [CrossRef]
- Yagiz, G.; Akaras, E.; Kubis, H.-P.; Owen, J.A. Heterogeneous effects of eccentric training and nordic hamstring exercise on the biceps femoris fascicle length based on ultrasound assessment and extrapolation methods: A systematic review of randomised controlled trials with meta-analyses. PLoS ONE 2021, 16, e0259821. [Google Scholar] [CrossRef]
- Borenstein, M.; Hedges, L.V.; Higgins, J.P.T.; Rothstein, H.R. Effect Sizes Based on Means. In Introduction to Meta-Analysis; John Wiley & Sons: Hoboken, NJ, USA, 2009; pp. 21–32. [Google Scholar]
- Higgins, J.P.T.; Green, S. Cochrane Handbook for Systematic Reviews of Interventions, Version 5.1.0 (Updated March 2011); The Cochrane Collaboration: London, UK, 20 2011. [Google Scholar]
- Rosenthal, R. Meta-Analytic Procedures for Social Research; Sage Publications: Newbury Park, CA, USA, 1993. [Google Scholar]
- Berlim, M.T.; McGirr, A.; dos Santos, N.R.; Tremblay, S.; Martins, R. Efficacy of theta burst stimulation (TBS) for major depression: An exploratory meta-analysis of randomized and sham-controlled trials. J. Psychiatr. Res. 2017, 90, 102–109. [Google Scholar] [CrossRef]
- Kallapiran, K.; Koo, S.; Kirubakaran, R.; Hancock, K. Review: Effectiveness of mindfulness in improving mental health symptoms of children and adolescents: A meta-analysis. Child Adolesc. Ment. Health 2015, 20, 182–194. [Google Scholar] [CrossRef]
- McGirr, A.; Berlim, M.T.; Bond, D.J.; Neufeld, N.H.; Chan, P.Y.; Yatham, L.N.; Lam, R.W. A systematic review and meta-analysis of randomized controlled trials of adjunctive ketamine in electroconvulsive therapy: Efficacy and tolerability. J. Psychiatr. Res. 2015, 62, 23–30. [Google Scholar] [CrossRef]
- Papadopoulos, V.; Filippou, D. Nocturia in CPAP-Treated Obstructive Sleep Apnea Patients: A Systematic Review and Meta-Analysis. SN Compr. Clin. Med. 2020, 2, 2799–2807. [Google Scholar] [CrossRef]
- Deeks, J.J.; Higgins, J.P.T.; Altman, D.G. Analysing data and undertaking meta-analyses. In Cochrane Handbook for Systematic Reviews of Interventions, Version 5.0.2; The Cochrane Collaboration: London, UK, 2011. [Google Scholar]
- Higgins, J.P.T.; Thompson, S.G.; Deeks, J.J.; Altman, D.G. Measuring inconsistency in meta-analyses. BMJ 2003, 327, 557–560. [Google Scholar] [CrossRef] [Green Version]
- DerSimonian, R.; Laird, N. Meta-analysis in clinical trials. Control. Clin. Trials 1986, 7, 177–188. [Google Scholar] [CrossRef]
- GRADEpro GDT: GRADEpro Guideline Development Tool [Software]. McMaster University and Evidence Prime: Hamilton, ON, Canada, 2021. Available online: gradepro.org (accessed on 11 January 2022).
- Schünemann, H.; Brożek, J.; Guyatt, G.; Oxman, A. GRADE Handbook for Grading Quality of Evidence and Strength of Recommendations; GRADE Working Group: Oslo, Norway, 2013. [Google Scholar]
- Akagi, R.; Shikiba, T.; Tanaka, J.; Takahashi, H. A Six-Week Resistance Training Program Does Not Change Shear Modulus of the Triceps Brachii. J. Appl. Biomech. 2016, 32, 373–378. [Google Scholar] [CrossRef] [PubMed]
- Dankel, S.J.; Bell, Z.W.; Spitz, R.W.; Wong, V.; Viana, R.B.; Chatakondi, R.N.; Buckner, S.L.; Jessee, M.B.; Mattocks, K.T.; Mouser, J.G.; et al. Assessing differential responders and mean changes in muscle size, strength, and the crossover effect to 2 distinct resistance training protocols. Appl. Physiol. Nutr. Metab. 2020, 45, 463–470. [Google Scholar] [CrossRef] [PubMed]
- Farthing, J.P.; Chilibeck, P.D.; Binsted, G. Cross-education of arm muscular strength is unidirectional in right-handed individuals. Med. Sci. Sports Exerc. 2005, 37, 1594–1600. [Google Scholar] [CrossRef]
- Hill, E.C.; Housh, T.J.; Keller, J.L.; Smith, C.M.; Anders, J.V.; Schmidt, R.J.; Johnson, G.O.; Cramer, J.T. Low-load blood flow restriction elicits greater concentric strength than non-blood flow restriction resistance training but similar isometric strength and muscle size. Eur. J. Appl. Physiol. 2020, 120, 425–441. [Google Scholar] [CrossRef]
- Hill, E.C.; Housh, T.J.; Keller, J.L.; Smith, C.M.; Schmidt, R.J.; Johnson, G.O. Early phase adaptations in muscle strength and hypertrophy as a result of low-intensity blood flow restriction resistance training. Eur. J. Appl. Physiol. 2018, 118, 1831–1843. [Google Scholar] [CrossRef]
- Krentz, J.R.; Chilibeck, P.D.; Farthing, J.P. The effects of supramaximal versus submaximal intensity eccentric training when performed until volitional fatigue. Eur. J. Appl. Physiol. 2017, 117, 2099–2108. [Google Scholar] [CrossRef]
- Kubo, K.; Ikebukuro, T.; Yata, H. Effects of 4, 8, and 12 Repetition Maximum Resistance Training Protocols on Muscle Volume and Strength. J. Strength Cond. Res. 2021, 35, 879–885. [Google Scholar] [CrossRef]
- Maeo, S.; Yoshitake, Y.; Takai, Y.; Fukunaga, T.; Kanehisa, H. Neuromuscular adaptations following 12-week maximal voluntary co-contraction training. Eur. J. Appl. Physiol. 2014, 114, 663–673. [Google Scholar] [CrossRef]
- Maeo, S.; Yoshitake, Y.; Takai, Y.; Fukunaga, T.; Kanehisa, H. Effect of short-term maximal voluntary co-contraction training on neuromuscular function. Int. J. Sports Med. 2014, 35, 125–134. [Google Scholar] [CrossRef]
- Matta, T.; Simão, R.; de Salles, B.F.; Spineti, J.; Oliveira, L.F. Strength training’s chronic effects on muscle architecture parameters of different arm sites. J. Strength Cond. Res. 2011, 25, 1711–1717. [Google Scholar] [CrossRef] [PubMed]
- Pinto, R.S.; Gomes, N.; Radaelli, R.; Botton, C.E.; Brown, L.E.; Bottaro, M. Effect of range of motion on muscle strength and thickness. J. Strength Cond. Res. 2012, 26, 2140–2145. [Google Scholar] [CrossRef] [PubMed]
- Radaelli, R.; Fleck, S.J.; Leite, T.; Leite, R.D.; Pinto, R.S.; Fernandes, L.; Simão, R. Dose-response of 1, 3, and 5 sets of resistance exercise on strength, local muscular endurance, and hypertrophy. J. Strength Cond. Res. 2015, 29, 1349–1358. [Google Scholar] [CrossRef] [PubMed]
- Simão, R.; Spineti, J.; de Salles, B.F.; Matta, T.; Fernandes, L.; Fleck, S.J.; Rhea, M.R.; Strom-Olsen, H.E. Comparison between nonlinear and linear periodized resistance training: Hypertrophic and strength effects. J. Strength Cond. Res. 2012, 26, 1389–1395. [Google Scholar] [CrossRef] [PubMed] [Green Version]
- Spineti, J.; de Salles, B.F.; Rhea, M.R.; Lavigne, D.; Matta, T.; Miranda, F.; Fernandes, L.; Simão, R. Influence of exercise order on maximum strength and muscle volume in nonlinear periodized resistance training. J. Strength Cond. Res. 2010, 24, 2962–2969. [Google Scholar] [CrossRef] [Green Version]
- Spineti, J.; Figueiredo, T.; Miranda, H.; de Salles, B.; Oliveira, L.; Simão, R. The effects of exercise order and periodized resistance training on maximum strength and muscle thickness. Int. SportMed J. 2014, 15, 374–390. [Google Scholar]
- Yasuda, T.; Ogasawara, R.; Sakamaki, M.; Bemben, M.G.; Abe, T. Relationship between limb and trunk muscle hypertrophy following high-intensity resistance training and blood flow-restricted low-intensity resistance training. Clin. Physiol. Funct. Imaging 2011, 31, 347–351. [Google Scholar] [CrossRef]
- Yasuda, T.; Ogasawara, R.; Sakamaki, M.; Ozaki, H.; Sato, Y.; Abe, T. Combined effects of low-intensity blood flow restriction training and high-intensity resistance training on muscle strength and size. Eur. J. Appl. Physiol. 2011, 111, 2525–2533. [Google Scholar] [CrossRef]
- Stasinaki, A.N.; Zaras, N.; Methenitis, S.; Tsitkanou, S.; Krase, A.; Aggeliki, K.; Terzis, G. Triceps Brachii Muscle Strength and Architectural Adaptations with Resistance Training Exercises at Short or Long Fascicle Length. J. Funct. Morphol. Kinesiol. 2018, 3, 28. [Google Scholar] [CrossRef] [Green Version]
- Winnard, A.; Scott, J.; Waters, N.; Vance, M.; Caplan, N. Effect of Time on Human Muscle Outcomes During Simulated Microgravity Exposure Without Countermeasures—Systematic Review. Front. Physiol. 2019, 10, 1046. [Google Scholar] [CrossRef] [Green Version]
- Šimunič, B.; Koren, K.; Rittweger, J.; Lazzer, S.; Reggiani, C.; Rejc, E.; Pišot, R.; Narici, M.; Degens, H. Tensiomyography detects early hallmarks of bed-rest-induced atrophy before changes in muscle architecture. J. Appl. Physiol. 2019, 126, 815–822. [Google Scholar] [CrossRef] [PubMed] [Green Version]
- Wall, B.T.; Dirks, M.L.; Snijders, T.; Senden, J.M.G.; Dolmans, J.; van Loon, L.J.C. Substantial skeletal muscle loss occurs during only 5 days of disuse. Acta Physiol. 2014, 210, 600–611. [Google Scholar] [CrossRef] [PubMed]
- Schulz, K.F.; Altman, D.G.; Moher, D. CONSORT 2010 Statement: Updated guidelines for reporting parallel group randomised trials. BMJ 2010, 340, c332. [Google Scholar] [CrossRef] [PubMed]
- Medeiros, D.M.; Marchiori, C.; Baroni, B.M. Effect of Nordic Hamstring Exercise Training on Knee Flexors Eccentric Strength and Fascicle Length: A Systematic Review and Meta-Analysis. J. Sport Rehabil. 2020, 30, 482–491. [Google Scholar] [CrossRef]


Publisher’s Note: MDPI stays neutral with regard to jurisdictional claims in published maps and institutional affiliations. |
© 2022 by the authors. Licensee MDPI, Basel, Switzerland. This article is an open access article distributed under the terms and conditions of the Creative Commons Attribution (CC BY) license (https://creativecommons.org/licenses/by/4.0/).
Share and Cite
Yagiz, G.; Akaras, E.; Kubis, H.-P.; Owen, J.A. The Effects of Resistance Training on Architecture and Volume of the Upper Extremity Muscles: A Systematic Review of Randomised Controlled Trials and Meta-Analyses. Appl. Sci. 2022, 12, 1593. https://doi.org/10.3390/app12031593
Yagiz G, Akaras E, Kubis H-P, Owen JA. The Effects of Resistance Training on Architecture and Volume of the Upper Extremity Muscles: A Systematic Review of Randomised Controlled Trials and Meta-Analyses. Applied Sciences. 2022; 12(3):1593. https://doi.org/10.3390/app12031593
Chicago/Turabian StyleYagiz, Gokhan, Esedullah Akaras, Hans-Peter Kubis, and Julian Andrew Owen. 2022. "The Effects of Resistance Training on Architecture and Volume of the Upper Extremity Muscles: A Systematic Review of Randomised Controlled Trials and Meta-Analyses" Applied Sciences 12, no. 3: 1593. https://doi.org/10.3390/app12031593