Featured Application
Extraction and selective isolation and purification of oleanolic and maslinic acids from olive leaves.
Abstract
The present study reports on the use of the flash chromatography for the isolation and purification of oleanolic and maslinic acids from olive leaf extracts. Although the separation and identification of these acids is considered challenging due to the similarity in their structure, oleanolic and maslinic acids were detected, identified, and separated. Solubility prediction was used to help to match compatibility of extraction solvent with targeted triterpenoid acids. Aqueous washing was used, to first selectively remove unwanted interferents from the extraction solvent. The extracts obtained with different solvents and solvent mixtures were fractionated using flash chromatography and then analyzed. HPTLC chromatography was used to assess collected fractions as either semi-pure or pure, and to identify the fractions containing oleanolic and maslinic acids. The yields of oleanolic and maslinic acids reported here are significantly higher than yields obtained in previously reported isolations. The presence and purity of oleanolic and maslinic acid in collected fractions was confirmed by ATR-FTIR and NMR spectrometry.
1. Introduction
It is well documented that plant secondary metabolites have played a vital part in modern drug discovery of antibacterial and antitumoral drugs [1,2]. The search for a healthier way of life has focused recent attention on pentacyclic triterpenoids found in plants. Pentacyclic triterpenes, a major class of bioactive chemical compounds, are associated with the mechanisms of action and pharmacological effects of many medicinal plants used in traditional medicine. Besides their antioxidant activity, they have many other pharmacological properties beneficial for human health. They have been reported as anti-inflammatory, antiviral, antimicrobial, and antitumoral agents, and having immunomodulator, metabolic and growth effects [3,4,5,6]. Oleanolic, ursolic and maslinic acids are pentacyclic triterpenoid acids that are frequently found together due to their similar structural features. Oleanolic acid (3β-hydroxyolean-12-en-28-oic acid) and ursolic acid (3β-hydroxyurs-12-en-28-oic acid) are structural isomers, differing in the location of the methyl group, while maslinic acid has an additional hydroxyl group at the C-2 position. Although ursolic acid shares a common cooccurrence with oleanolic acid, it features a more restricted distribution when compared to oleanolic acid. The addition of a hydroxy group in maslinic acid increases its antioxidant properties compared to oleanolic and ursolic acids [7].
Both oleanolic acid and ursolic acid are known to have many biological activities, such as anticancer, antidiabetic, antimutagenic, anti-inflammatory, antioxidative and antiprotozoal properties [8,9,10,11,12]. A recent study has reported that oleanolic acid also has beneficial effects on multiple sclerosis [13]. Maslinic acid and its synthetic derivates have been shown to exert substantial antitumor effects [14,15]. Moreover, maslinic acid has been reported to possess antimalarial and anti-hyperglycemic activities [16,17].
The presence of pentacyclic terpenoic acids in olive (Olea europaea) tree leaves has been associated with many health benefits. Thus, there has been increasing interest in studying olive leaves for their bioactive compounds [18]. Olive leaves have been widely used in traditional herbal medicine for centuries to prevent and treat various diseases especially in Mediterranean countries. Olive leaves are a highly available agricultural residue of olive tree pruning and a by-product from the table olive and olive oil production.
Oleanolic acid is known to be one of the main bioactive components (3.0–3.5% dry weight) in olive leaves, followed by significant amounts of maslinic acid [19]. However, separation of maslinic from oleanolic acid and its isomer, ursolic acid, is considered challenging due to the similarity in their structures. Extraction efficiency of maslinic acid from plant material is low, the extraction cycle is long, and the amount of raw material waste produced is significant. The process for its chemical synthesis is also complicated.
A problem is that maslinic acid commonly occurs in olive leaves together with oleanolic acid, its position isomer with respect to methyl group, which makes it difficult to obtain maslinic acid in pure form, thus limiting its medical usability. Maslinic acid can be prepared by chromatographic isolation from plant extracts [18]. However, chromatographic isolation is not a practical method due to the low content of maslinic acid in the plant material and low chromatographic separation efficiency. On the other hand, maslinic acid has been synthesized from oleanolic acid in good yields, though it is a multistep process requiring expensive reagents and catalysts [20]. Another high yielding chromatographic separation of maslinic and oleanolic acid from olive extract was reported. However, the compounds obtained needed further purification through column chromatography [21].
Thus, the aim of this work was to optimize the process of extraction from olive leaves that would enable separation of these triterpenoid acids with flash chromatography and their isolation in pure forms from extracts. HPTLC chromatography was used to assess fractions as either semi-pure or pure, and to confirm separated compounds and the structures of the isolated compounds, using NMR spectrometry and ATR-FTIR spectroscopy.
Flash chromatography was originally developed for rapid and easy purification of products of organic synthetic reactions in synthetic chemistry [22]. However, it’s use in natural products research for the separation of complex natural product mixtures such as plant extracts has been underutilized [23]. Column chromatography and thin layer chromatography (TLC) are commonly used for extract clean-up/work-up and identification in natural product chemistry. However, column chromatography does not offer automated peak collection, is tedious (can take days), and is less flexible in relation to stationary phases than flash chromatography. Separation using flash chromatography offers quick, superior results and high loading capacity, which is suitable for large-scale separation of products.
2. Materials and Methods
2.1. Solvents and Chemicals
Ethyl acetate and hexadeuterodimethyl sulfoxide (DMSO-d6) were obtained from Sigma Aldrich (Castle Hill, Australia). Acetic acid, ethanol, methanol, n-hexane and sulfuric acid were purchased from Merck (Darmstadt, Germany). Anisaldehyde was sourced from ACROS organics (Morris Plains, NJ, USA), and Milli-Q (Millipore, Darmstadt, Germany) water was used to prepare all aqueous solutions. Silica gel 60, 0.032–0.063 mm (230–450 mesh), used for preparing samples for flash chromatography, was from Alfa Aesar (Heysham, UK).
2.2. Olive Leaves Extracts
Approximately 500 g of olive tree leaves were harvested from Olea europaea L. (‘Kalamata’). Species identification was performed by D. Morton. Leaves were collected in April 2021, in Bendigo (geographical coordinates: latitude 36.7570° S, longitude 144.2787° E), central Victoria region, Southeast Australia. Collected olive leaves were washed with distilled water and frozen at −80 °C for 6 h. After freezing, samples were thawed in an incubator for 2 h at 20 °C, and then the freeze–thaw process was repeated twice. Samples were then air dried to remove moisture, ground to a fine powder and kept at 4 °C until used. Extracts with ethanol, ethyl acetate and water/ethyl acetate mixture (1:1) were prepared by macerations. Then, 10 g of powdered material was transferred into an Erlenmeyer flask, and extracted 3 times with the respective solvent/solvent mix (50 mL) using a mechanical stirrer at room temperature, at a constant stirring rate of 200 rpm. The combined extracts for each solvent were evaporated to a dry residue. For HPTLC fingerprinting, 10 mg/mL solutions in the extraction solvent were prepared.
In the case of extraction with water/ethyl acetate mixture, the ethyl acetate rich phase was separated from the water phase by fractional freezing of the mixture at −18 °C (the freezing point of ethyl acetate is −83 °C). After freezing, the water and plant component were in a solid frozen phase, while the ethyl acetate rich extract was present as a liquid phase. The ethyl acetate extract was then decanted and evaporated to dryness to remove the ethyl acetate and residual water.
2.3. HPTLC
HPTLC separations were performed on 20 × 10 cm normal phase Silica gel 60 F254 HPTLC glass plates (Merck, Darmstadt, Germany). Samples (20 µL) were applied as bands with a Linomat 5 TLC sampler (CAMAG, Muttenz, Switzerland), with 12 mm distance from each side, and a minimum distance of 3 mm between tracks at 8 mm distance from plate’s bottom edge.
HPTLC separation was accomplished with n-hexane-ethyl acetate-acetic acid (60:36:4, v/v/v) in an Automated Multiple Development chamber (AMD2, CAMAG, Muttenz, Switzerland) up to a migration distance of 75 mm, which took 20 min. Plate images were captured with the TLC Visualizer Documentation System (CAMAG, Muttenz, Switzerland) operated with winCATS software (CAMAG, Muttenz, Switzerland).
Developed chromatographic plates were derivatized with freshly prepared anisaldehyde/sulfuric acid reagent by dipping the plate into the derivatizing agent for 1 s. The reagent was freshly prepared by dissolving the 0.5 mL p-anisaldehyde in a cold solution of 5 mL concentrated sulfuric and 10 mL acetic acid in 85 mL methanol. After derivatization, the plate was heated for 10 min at 110 °C, or until maximum visualization of spots.
2.4. Flash Chromatography
In a round bottomed flask, one part of the dried extract (approximately 1 g, accurately weighed) was dissolved in sufficient methanol and mixed with 3 parts of dry silica gel 60, 0.032–0.063 mm, to form a silica gel slurry. The solvent was evaporated under reduced pressure on a rotary evaporator (Rotavapor® R-300, BÜCHI Labortechnik AG, Flawil, Switzerland) to give a dry homogeneous mixture, which was then transferred to a Grace solid loader tube (3 g) (Grace Discovery Sciences, Epping, Victoria, Australia), packed well, and sealed with frits. The dry sample loader assembly was then connected to the inlet of a Reveleris X2 flash chromatography system (Grace Discovery Sciences, Deerfield, IL, USA). A Reveleris HP Silica 20 µm size, 24 g cartridge (Grace Discovery Sciences, Epping, Victoria, Australia) was used as the elution column. Solvent system flow rate and pressure were kept to default values as detected by the flash chromatograph, while the equilibration time was set to 3 min. Three different wavelengths of UV (254 nm, 265 nm, 280 nm) were set for detection along with evaporating light scattering detection (ELSD). Only the absorption peaks were set to be collected in the vials. The solvent gradient was initially set to be 100% of hexane, for at least 1 min, and then the percentage of the second solvent (ethyl acetate or ethyl acetate-acetic acid) was gradually increased from 0 to 100% over a period of 22 min. The gradient was held to give isocratic elution whenever absorption peaks were observed, which did increase the total run time. Fractions were collected in 25 mL (18 mm o.d. × 150 mm H) test tubes. HPTLC was then used to detect the presence of triterpenoid acids in the fractions. Fractions containing the same compounds were then combined, and the solvent evaporated to dryness on a rotary evaporator (Rotavapor® R-300, BÜCHI Labortechnik AG, Flawil, Switzerland).
2.5. FTIR Measurements
The Fourier Transform Infrared spectra (FTIR) of the samples were recorded on a Cary 630 FTIR Spectrometer (Agilent Technologies Pty Ltd, Mulgrave, Australia) fitted with a diamond ATR accessory. Spectra, in the absorbance mode, were recorded from 4000 to 650 cm−1, by accumulation of 64 scans at a resolution of 4 cm−1. The baseline correction, ATR correction, and the spectra average were performed using the Resolution Pro FTIR Software program (version 5.2.0, Agilent Technologies Pty Ltd., Mulgrave, Australia).
2.6. 1H and 13C NMR Measurements
Approximately 10 mg of dried sample was dissolved in 0.5 mL of hexadeuterodimethyl sulfoxide (DMSO-d6). The dissolved samples were then transferred into NMR tubes. All 1H NMR and 13C NMR spectra were recorded on a Bruker Avance 400 NMR spectrometer (Bruker, Ettlingen, Germany) at 400 MHz for 1H and 100 MHz for 13C, respectively. Spectra were recorded at room temperature with 1024 scans at a spectral width of 240 ppm for 13C NMR. 1H and 13C NMR chemical shifts recorded in DMSO-d6 were relative to the solvent peaks of 2.5 and 39.5 ppm, respectively. In addition, for 1H NMR, water peaks could not be avoided and were present at 3.3–3.4 ppm.
2.6.1. Oleanolic Acid
13. C NMR (d6-DMSO, 300 K) δ 181 (C-28), 145.2 (C-13), 121 (C-12), 82.6 (C-3), 55.2 (C-5), 47.5 (C-9), 47.3 (C-17), 46.8 (C-19), 46.6 (C-14), 41.9 (C-18), 38.5 (C-8), 38 (C-4), 33.4 (C-1), 33 (C-10), 30.2 (C-21), 29.4 (C-29), 29.2 (C-7), 28.1 (C-22), 27.7 (C-20), 27.3 (C-23), 25.8 (C-15), 25.6 (C-2), 25.5 (C-27), 23.7 (C-30), 23.7 (C-16), 23.4 (C-11), 17.8 (C-6), 17.5 (C-26), 16.8 (C-24), 14.5 (C-25).
2.6.2. Maslinic Acid
13. C NMR (d6-DMSO, 300 K) δ 179 (C-28), 144.3 (C-13), 121.8 (C-12), 82.6 (C-3), 67.6 (C-2), 55.2 (C-5), 47.5 (C-9), 47.2 (C-1), 46.1 (C-17), 45.9 (C-19), 41.8 (C-18), 41.2 (C-14), 40.5 (C-4), 40.3 (C-10), 38.1 (C-8), 33.7 (C-21), 33.2 (C-7), 32.7 (C-22), 32.5 (C-29), 30.8 (C-20), 29.2 (C-23), 27.6 (C-15), 26 (C-16), 23.8 (C-11), 23.4 (C-27), 23.04 (C-30), 18.5 (C-6), 17.5 (C-26), 17.3 (C-25), 16.7 (C-24).
2.7. Solubility Descriptors Calculation
The 3D molecular structures of oleanolic, maslinic and ursolic acids, and selected extraction solvents were optimized to minimum energy, with solubility descriptors calculated using Molecular Modeling Pro® 5.1 (Chem SW, Fairfield, CT, USA).
3. Results and Discussion
3.1. Flash Chromatography and HPTLC
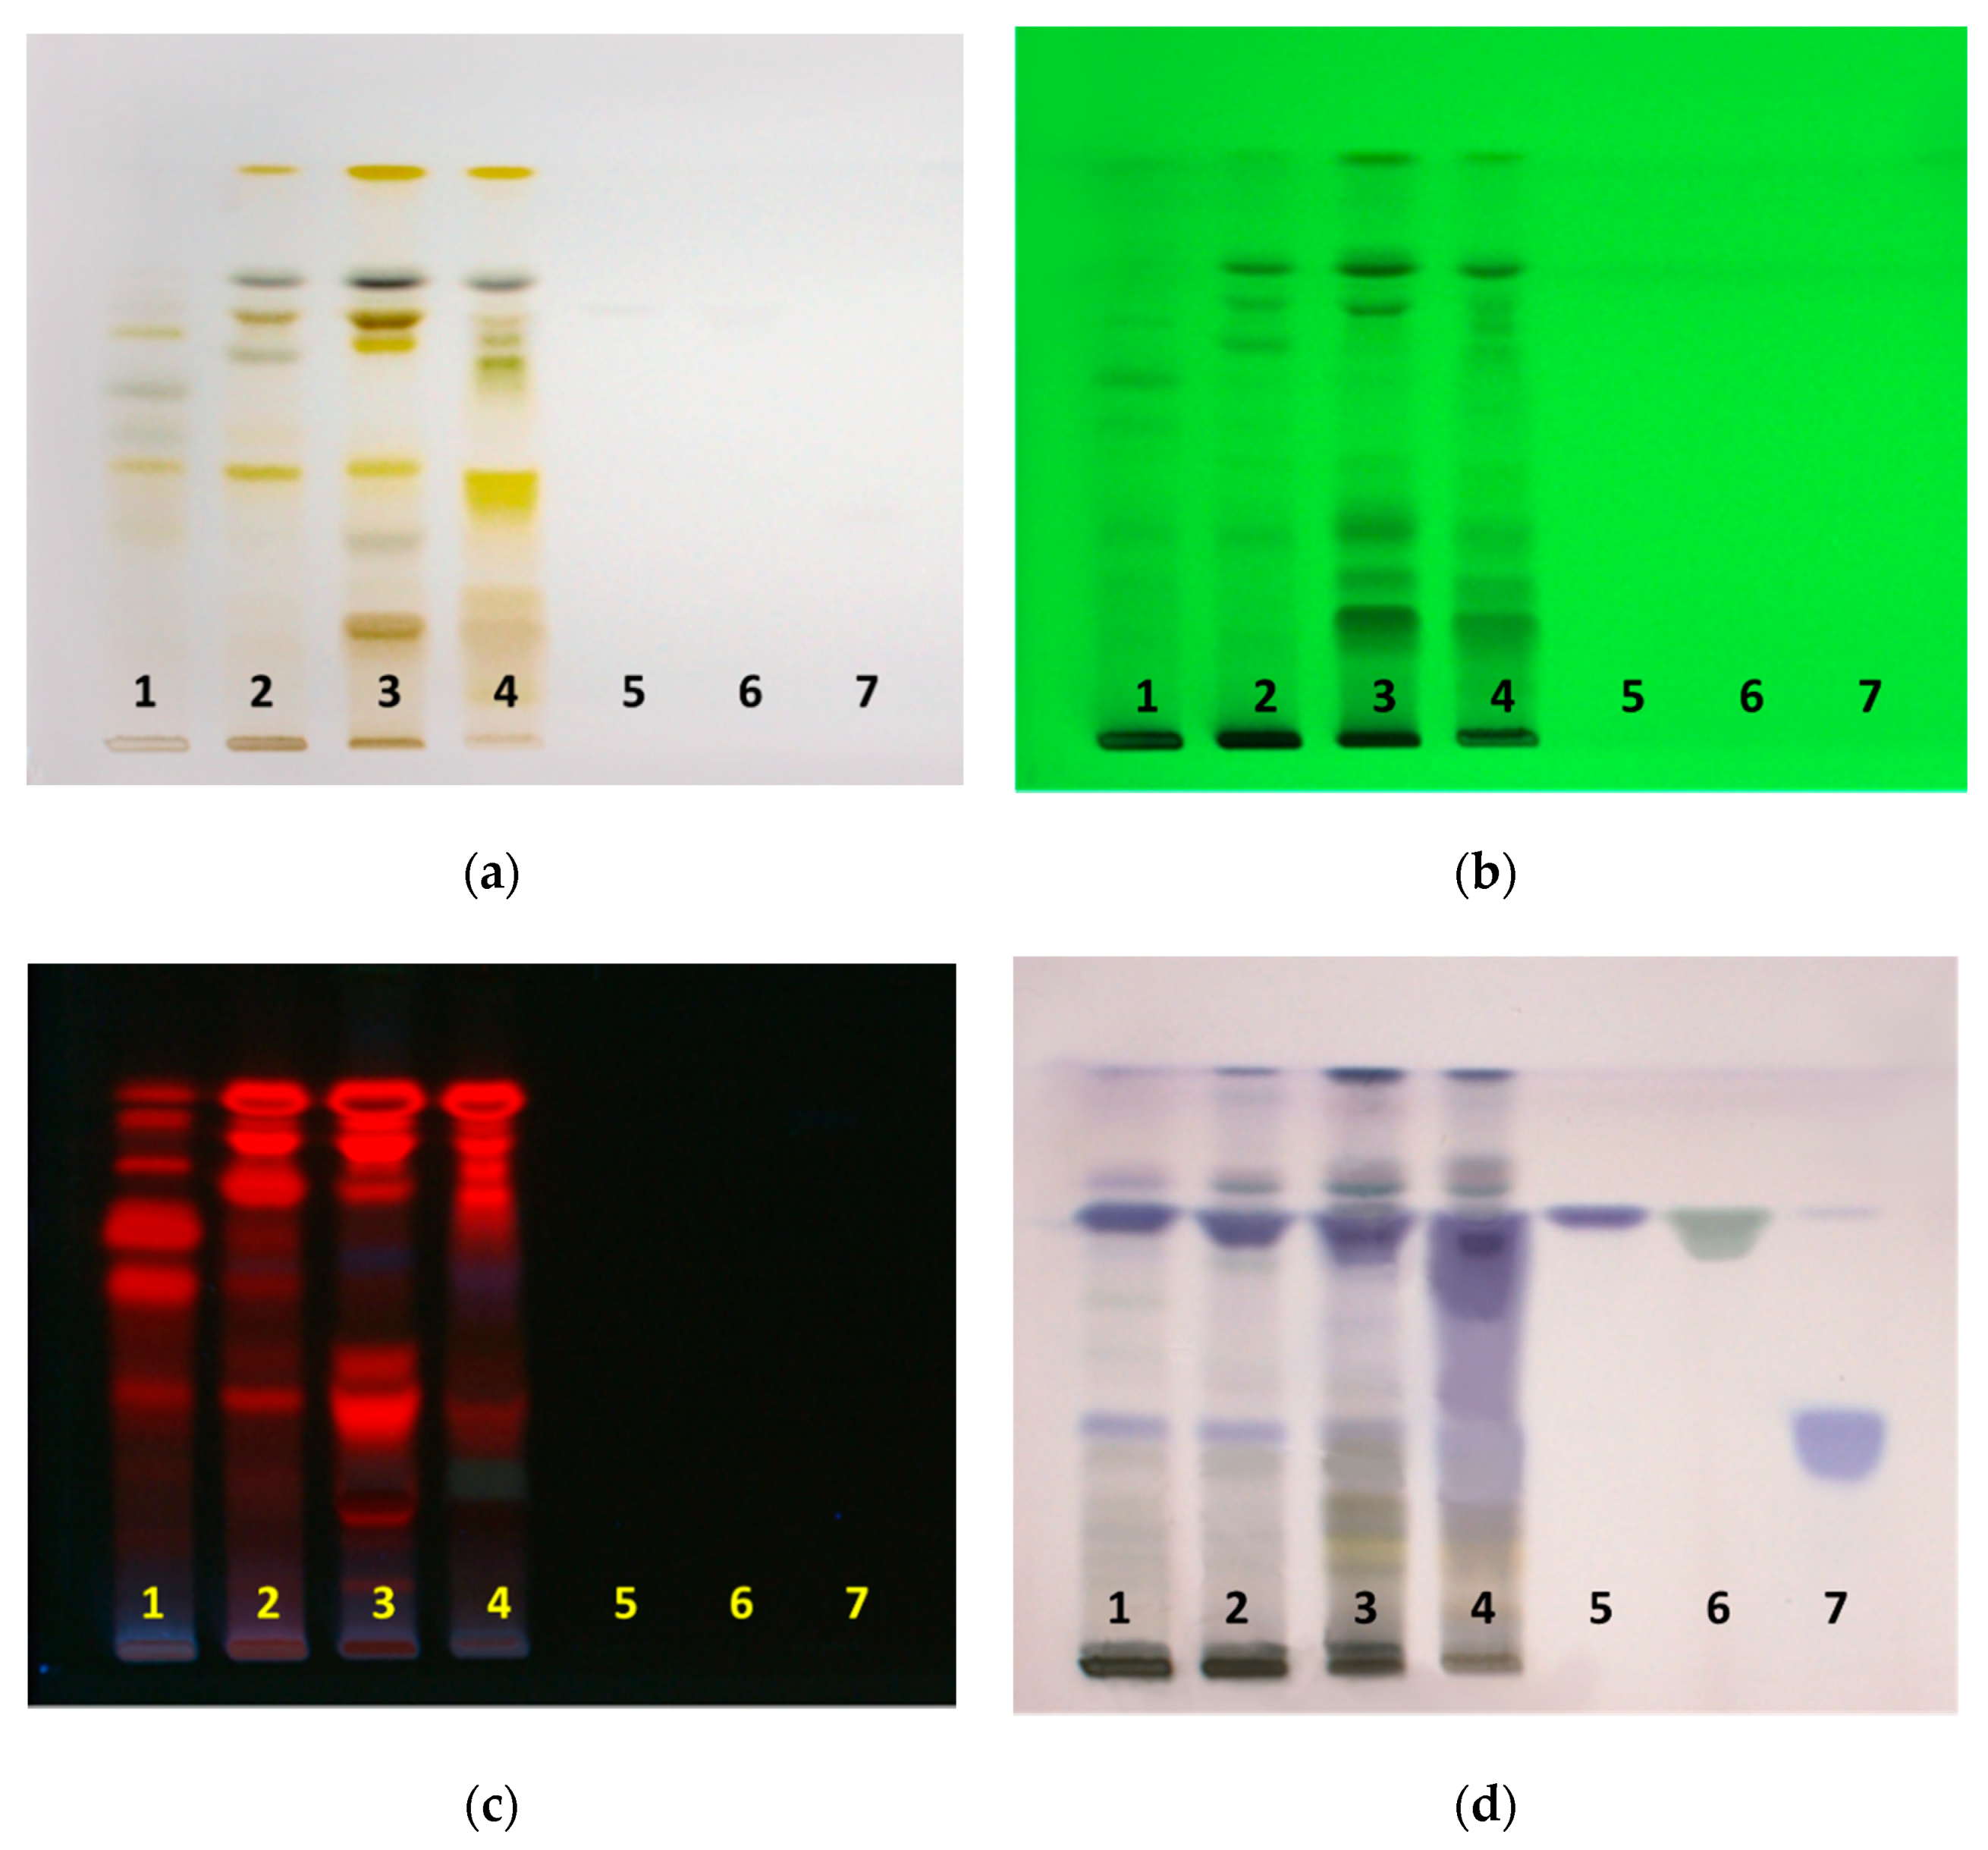
Olive leaves were pre-treated using the freeze–thaw method to maximize extraction. The freeze–thaw method causes disintegration of plant tissue and cell membrane, and induces the maximum degree of cell membrane permeabilization [24]. Prepared extracts in different solvents were separated on HPTLC plates, with n-hexane-ethyl acetate-acetic acid (60:36:4, v/v/v) as the mobile phase, and then observed under white light, 254 nm and 366 nm, and after derivatization with anisaldehyde/sulfuric acid reagent. HPTLC fingerprint profiles of extracts and standards of oleanolic, ursolic and maslinic acids are shown in Figure 1. Derivatization of separated components on HPTLC plates, with anisaldehyde/sulfuric acid reagent was necessary, in order to visualize and detect the presence oleanolic, ursolic, and maslinic acids. These acids are non-chromophoric and non-UV active, and therefore require derivatization to make them visible.
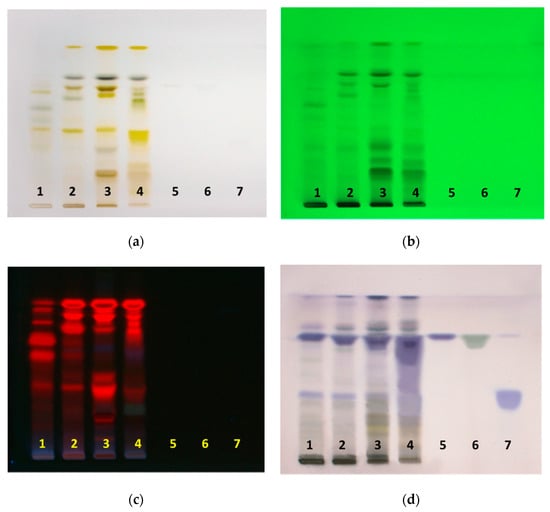
Figure 1.
HPTLC fingerprints of olive leaf extracts and triterpenoid acids under (a) white light (b) 254 nm (c) 366 nm (d) after derivatization with anisaldehyde/sulfuric acid under white light. Track 1, methanol extract; track 2, ethanol extract; track 3, ethyl acetate extracts; track 4, ethyl acetate phase from the water: ethyl acetate extract; track 5 oleanolic acid; track 6, ursolic acid; track 7, maslinic acid.
Although scraping the zones of the analyte of interest from developed HPTLC plates can be used to extract the bioactive compounds into a solvent, it does not yield significant amounts of pure compounds. Another important consideration is the detection of oleanolic and maslinic acids on the plate. Identifying non-chromophoric compounds such as oleanolic and maslinic acid from complex mixtures is difficult. Additionally, compounds with very similar retention factor (RF) values are hard to differentiate and separate by scraping the respective bands from the HPTLC plate. In this work, the extracts were fractionated with flash chromatography, using n-hexane and ethyl acetate as mobile phases A and B, respectively. Conventional flash chromatography, used for isolating natural products, cannot detect compounds that are non-chromophoric. However, the use of evaporative light scattering detection (ELSD), in addition to UV detection, allows for detection and isolation of both chromophoric and non-chromophoric compounds (deficient in a UV-absorbing chromophore) in a single run. Collected fractions were then analyzed via HPTLC in order to detect fractions with high amounts of oleanolic and maslinic acids. The presence of oleanolic and maslinic acids in these fractions was confirmed using NMR and ATR-FTIR spectroscopy.
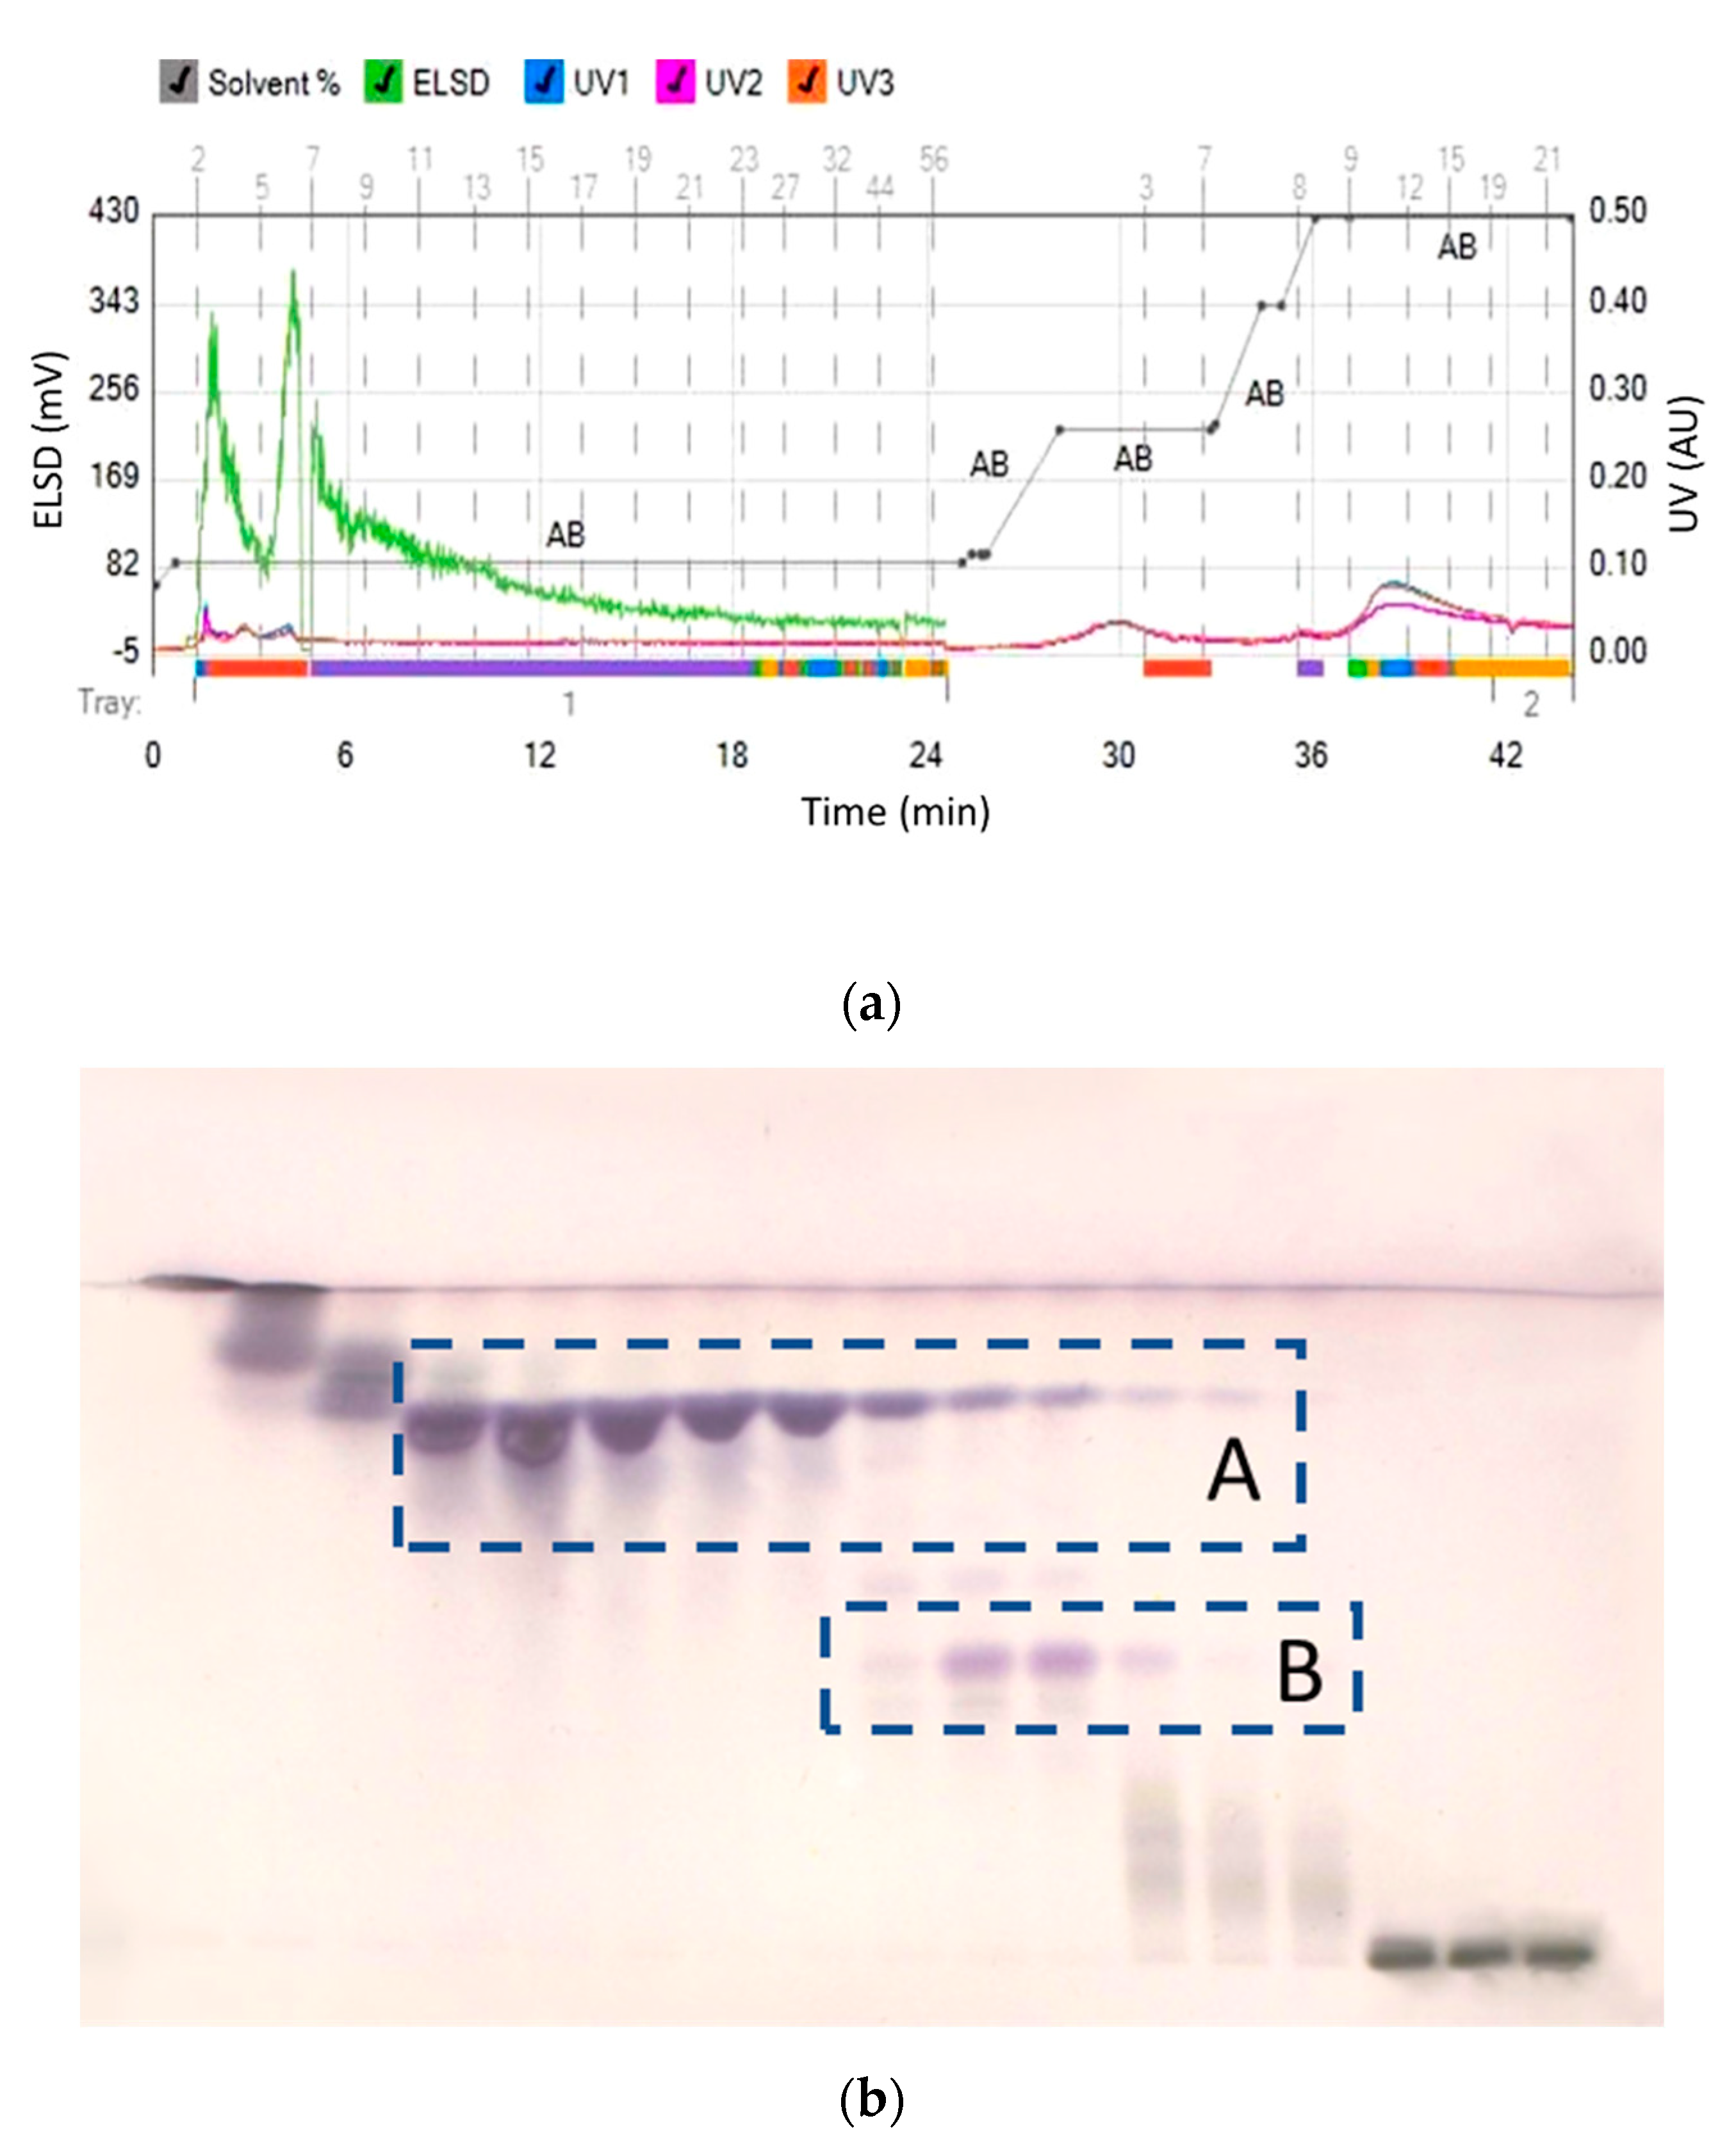
Separation efficiency of flash chromatography from the combined methanol and ethanol extracts was not sufficient to allow for the full resolution of oleanolic and maslinic acids from the extracts (Figure 2). Both acids started to elute when the mobile phase contained 21% of ethyl acetate (79% n-hexane). Therefore, maslinic acid could not be isolated in a pure form, since all fractions with maslinic acid also contained either oleanolic acid, and/or more polar compounds with lower RF values, as impurities.

Figure 2.
(a) Separation of combined methanol and ethanol extracts and (b) HPTLC assessment of collected fractions (A–oleanolic acid and B–maslinic acid).
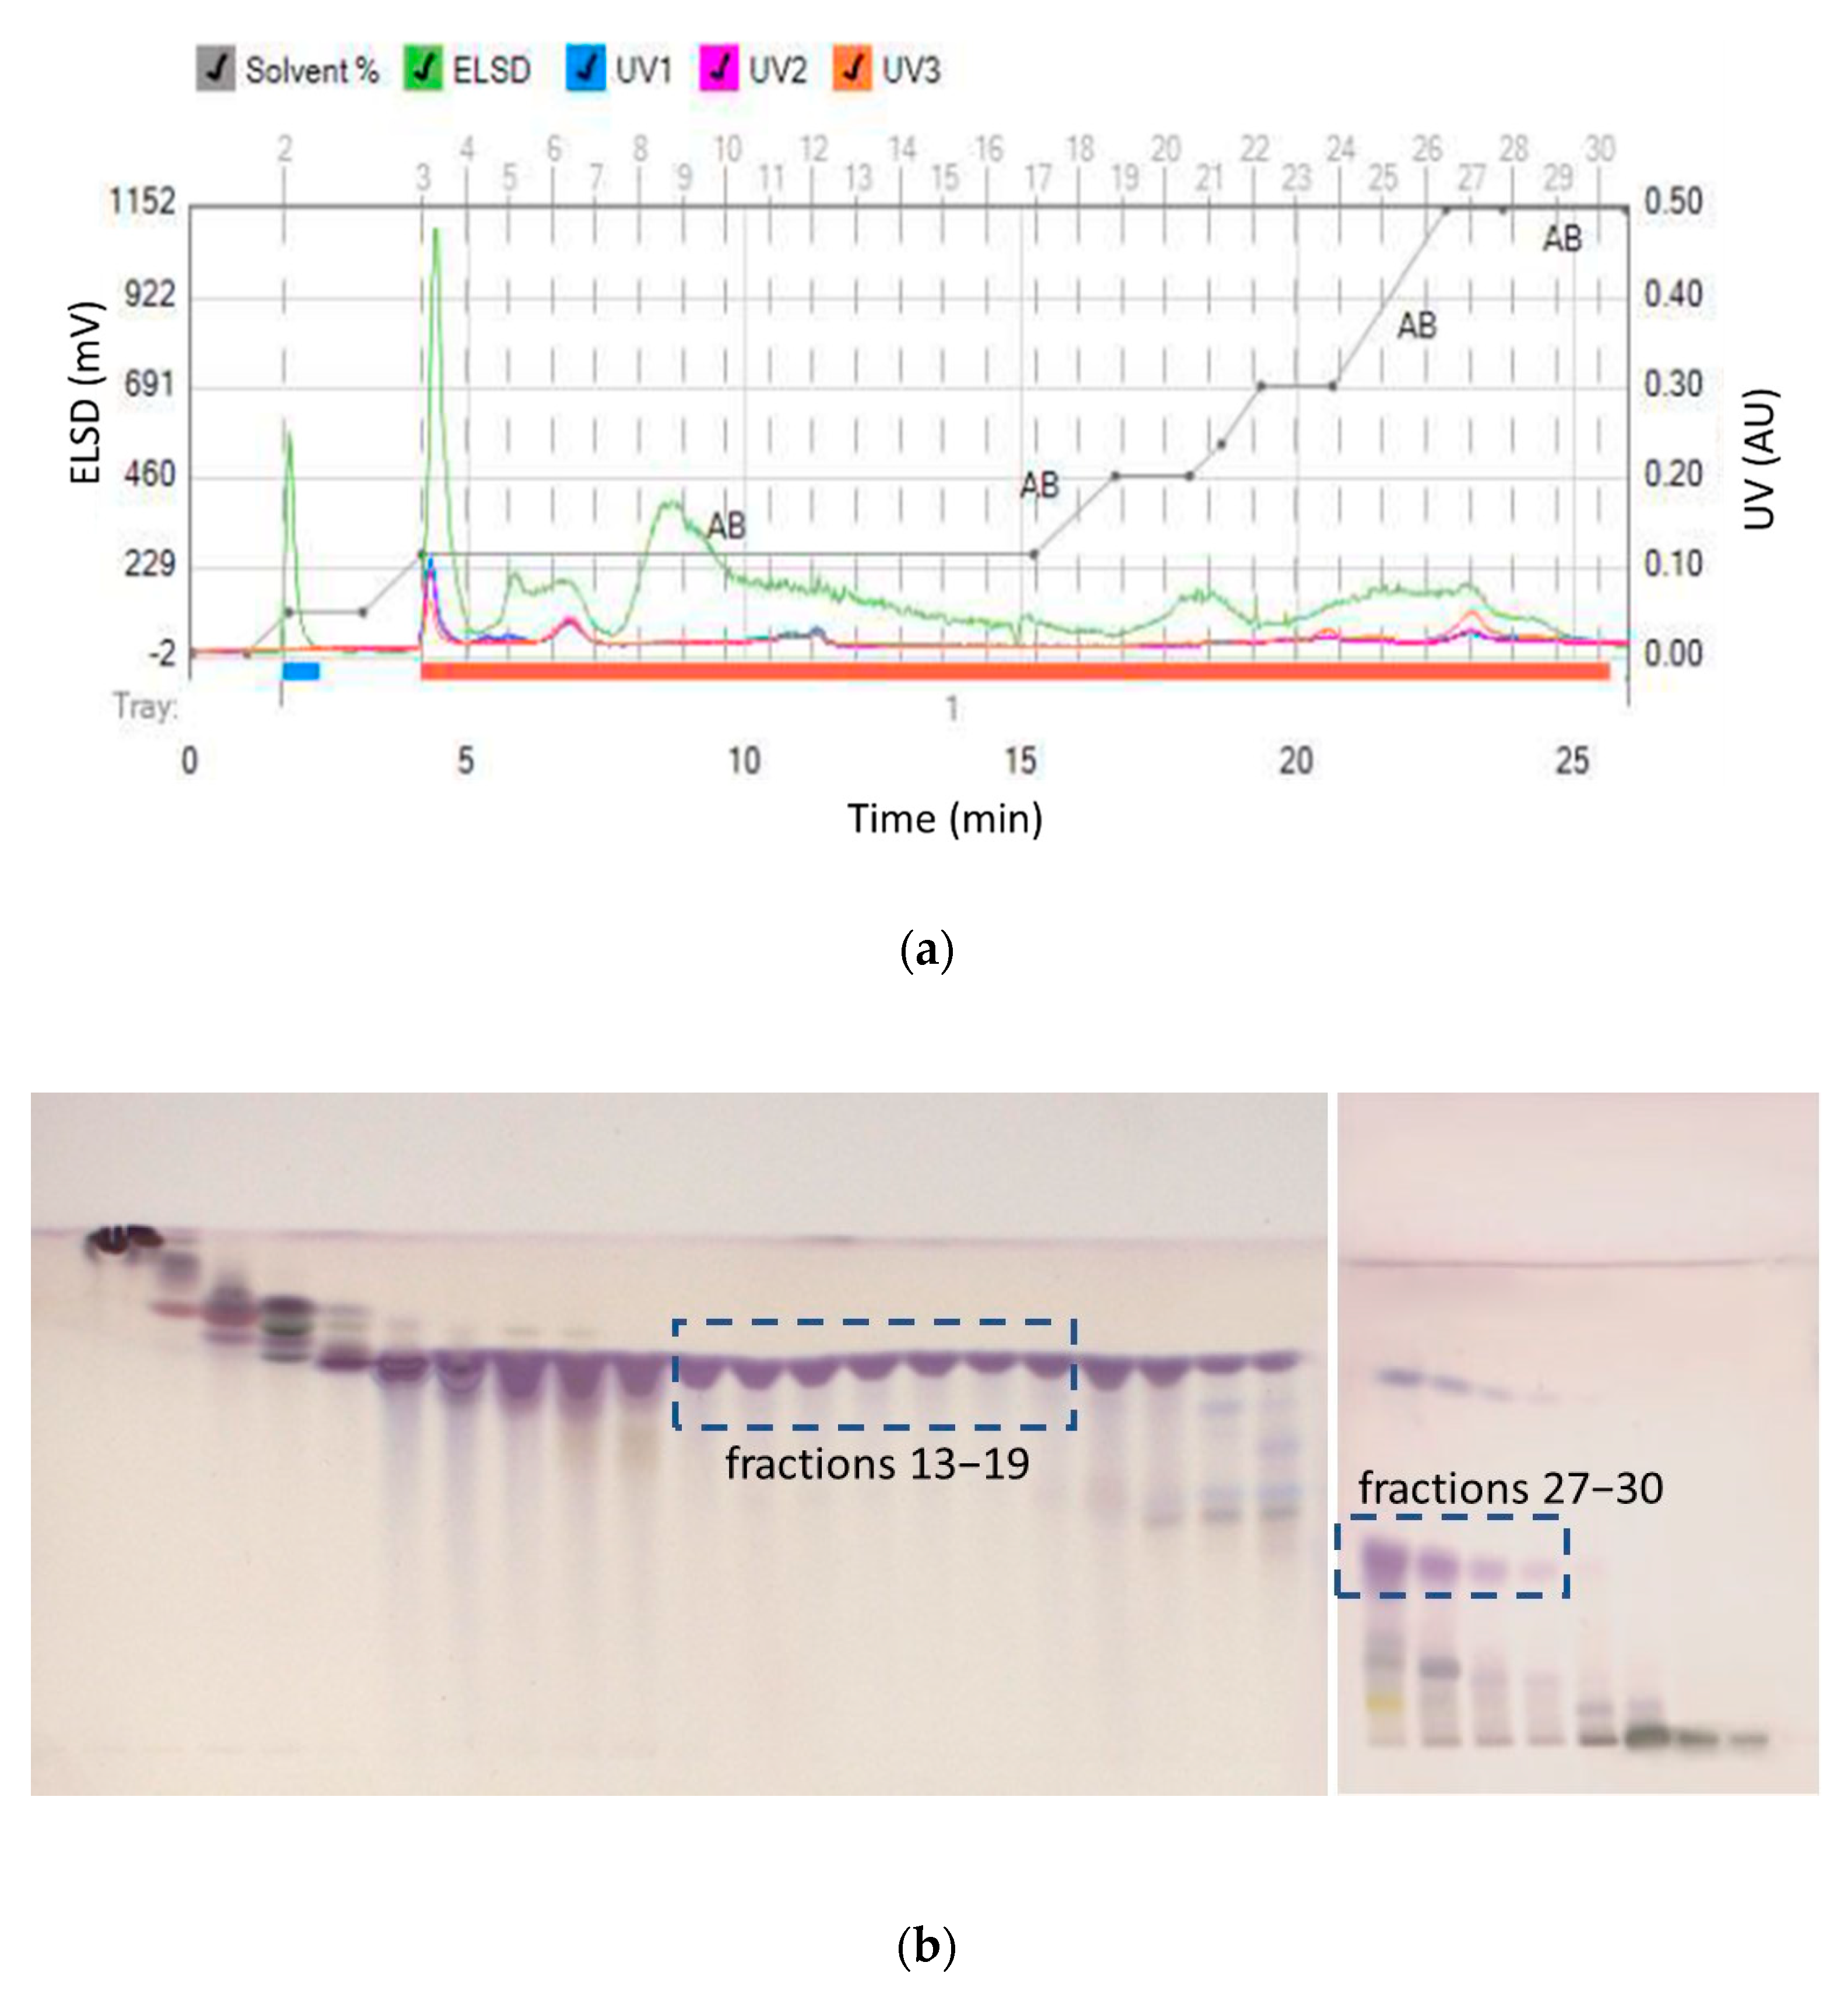
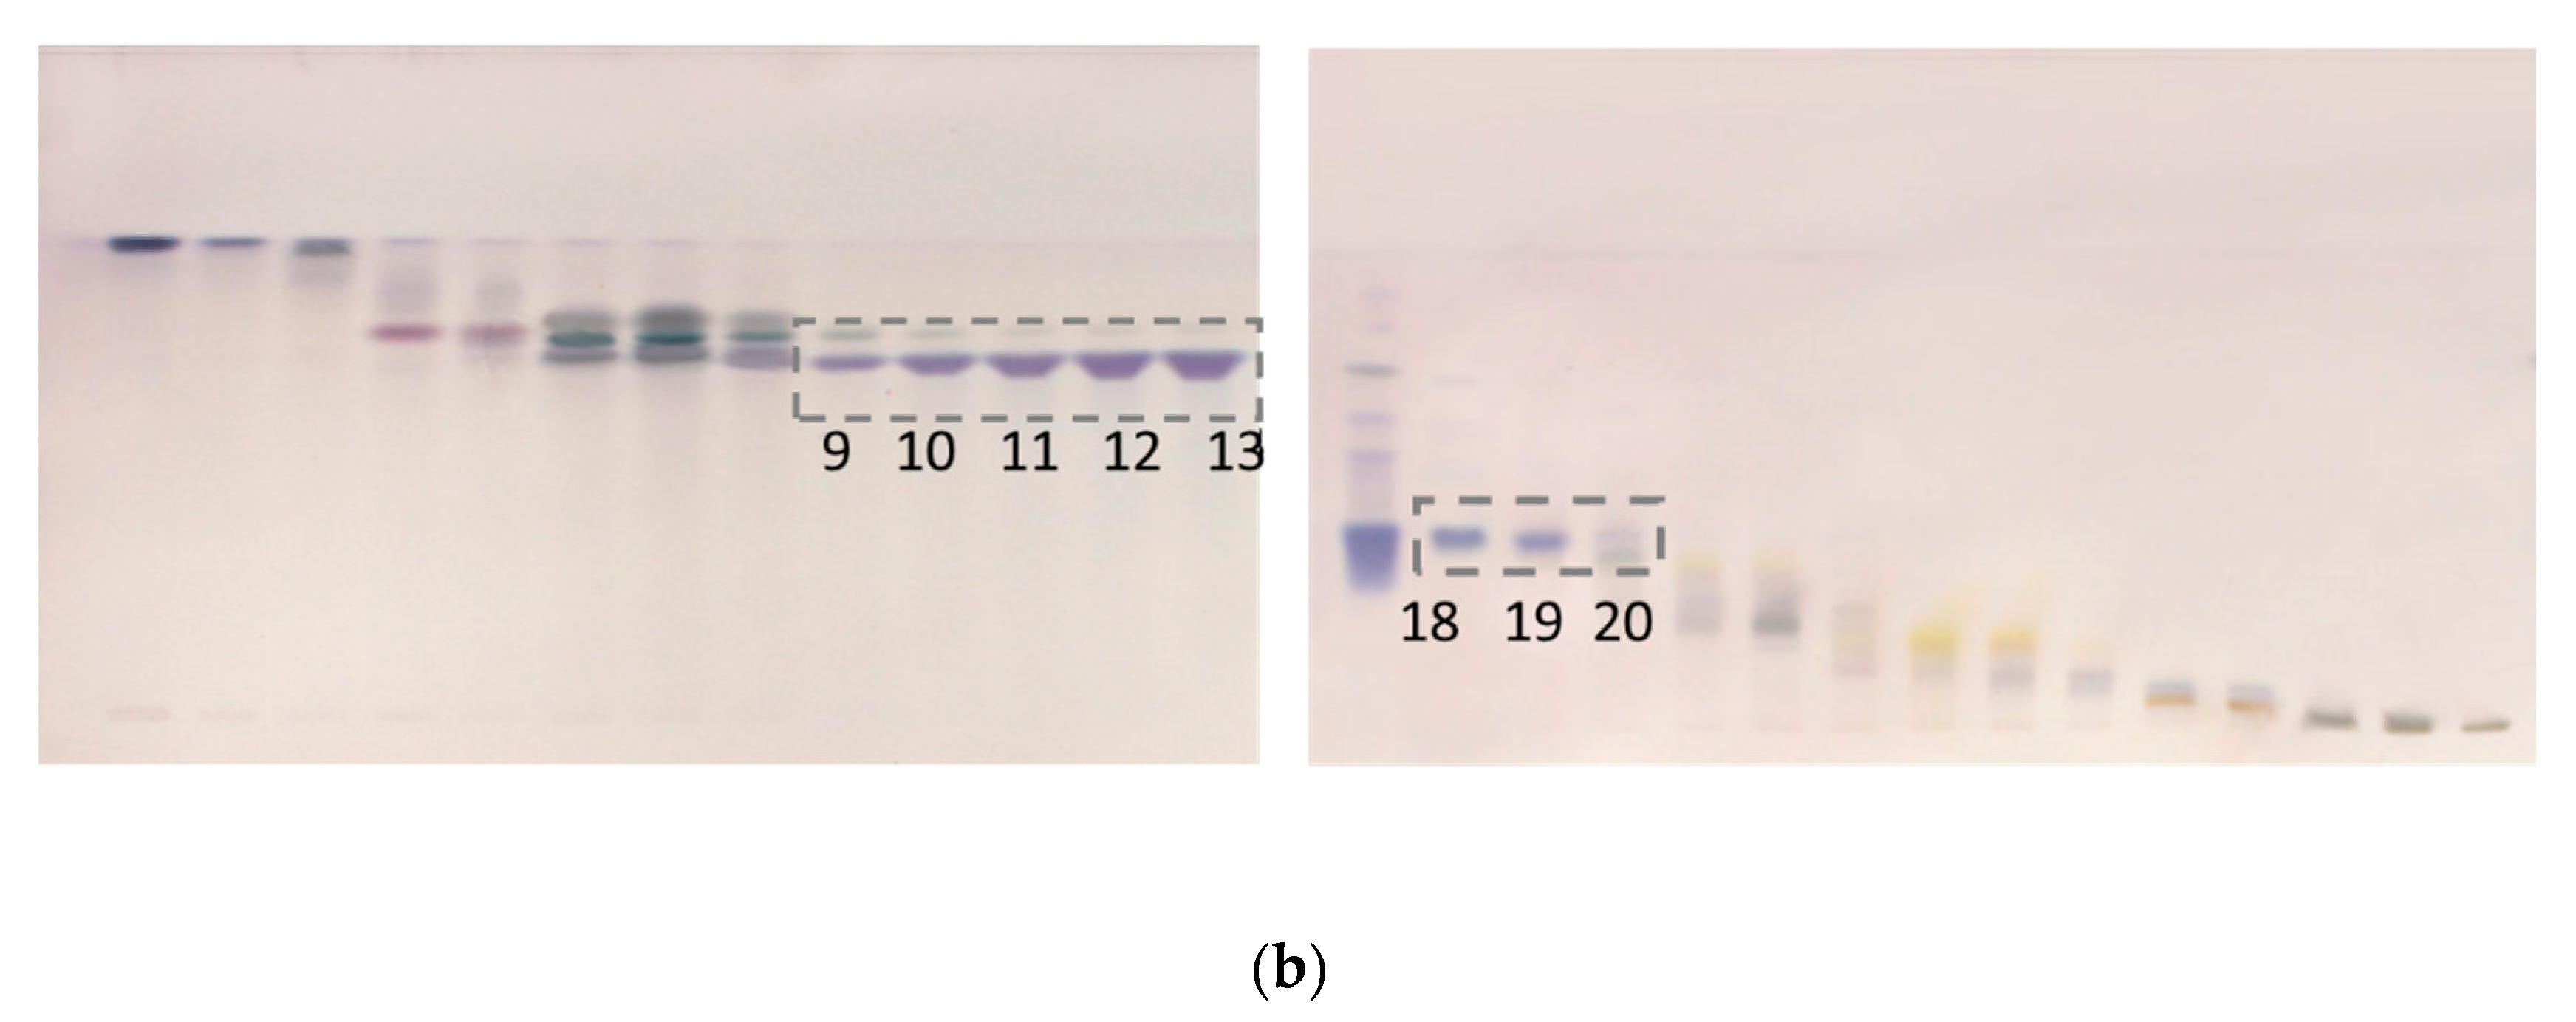
Due to the higher solubility of maslinic acid in ethyl acetate, larger amounts of maslinic acid were expected to be isolated from the ethyl acetate extract. In a longer chromatographic run from ethyl acetate extracts, oleanolic acid started eluting at 21% of ethyl acetate, while maslinic acid started eluting at 60% of ethyl acetate (Figure 3). While collected fractions 13–19 contained oleanolic acid of high purity, maslinic acid rich fractions 27–30 also contained oleanolic acid and more polar compounds with lower RF values (the lower part of the HPTLC chromatogram).
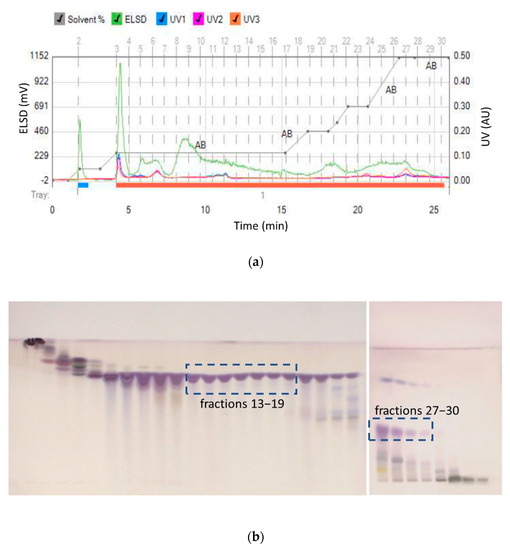
Figure 3.
(a) Separation of ethyl acetate extract and (b) HPTLC assessment of collected fractions (13–19 high purity oleanolic acid and 27–30 low purity maslinic acid).
Fractions 13–19 were combined, and pure oleanolic acid was obtained with a 9.08% w/w concentration from 1.2 g of crude extract. Thus, flash chromatography of this sample provided 109 mg of pure oleanolic acid from 10 g of plant material (10.9 mg/g) within an hour. This is a significantly higher yield than has been previously reported. Previous work reported that optimized ultrasonic assisted extraction and then centrifugation isolation, yielded 3.6 mg/g of oleanolic acid [25], compared to solid–liquid extraction (maceration) that yielded 0.4–0.5 mg/g [19] and 0.015 mg/g [26]. Solid–liquid extraction (centrifugation) yielded 0.185–0.565 mg/g [27], ultrasonic assisted extraction yielded 0.838–1.003 mg/g [28], while solid–liquid, then ultrasonic-assisted extraction yielded 3.4 mg/g of oleanolic acid [29]. Please note that in these studies, oleanolic and maslinic acid were not isolated from the extracts. They were only quantified with either gas liquid or high performance liquid chromatography. In our work, the identity and purity of the isolated oleanolic acid compound was determined by ATR-IR spectroscopy and NMR. The presence of pure oleanolic acid was confirmed. However, the presence of maslinic acid could not be confirmed with NMR in fractions 27–30, due to the interference from other compounds that coeluted in these fractions.
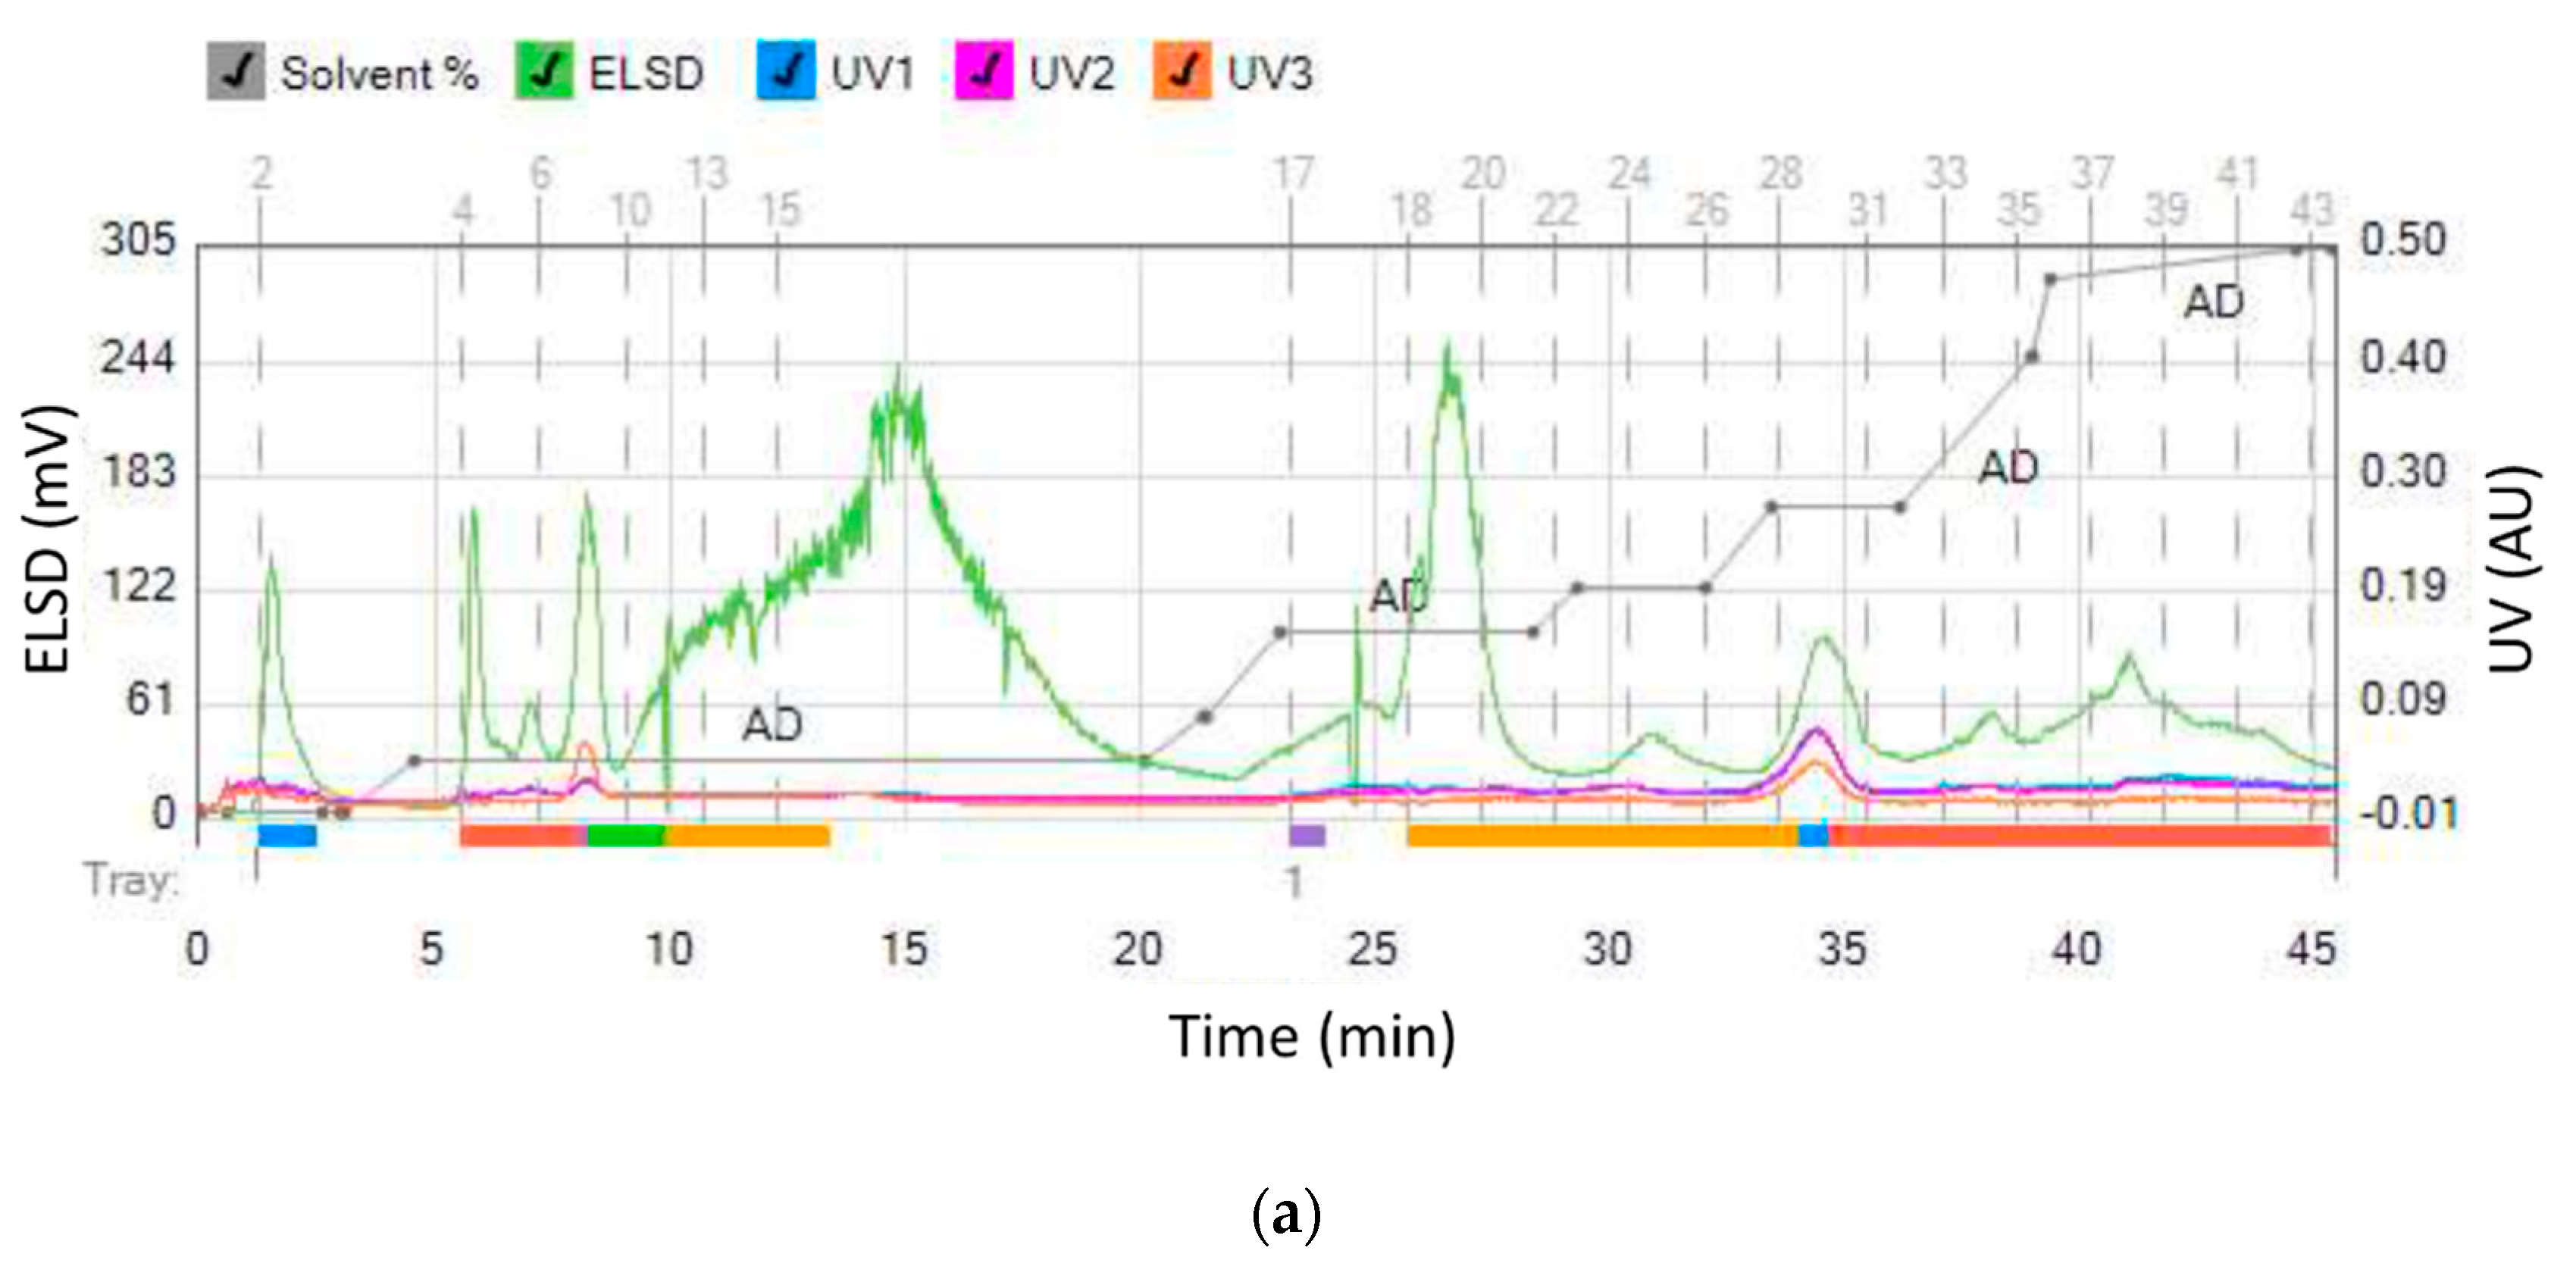
In order to selectively remove more polar compounds (lower RF values on the HPTLC plate) from the ethyl acetate extract while retaining others, water was used as the wash solvent. Aqueous washing is used to remove water soluble compounds from organic phase, since maslinic acid will be dissolved in the organic layer. The goal was to remove interferents present in the fractions containing maslinic acid. Olive leaves were extracted using a mixture of ethyl acetate and water (1:1), with only the ethyl acetate phase separated using flash chromatography. Furthermore, 10% of acetic acid was added to the ethyl acetate mobile phase to improve the separation efficiency and peak shape of ionizable organic acids. When separating acidic compounds, adding a small amount of a volatile organic acid to the solvent system will minimize any secondary H-bonding interactions with the silica by keeping the acids protonated. Oleanolic acid started eluting at 8% of ethyl acetate/acetic acid (mobile phase D), while maslinic acid started eluting at 31% ethyl acetate/acetic acid (Figure 4). Maslinic acid was present in a pure form in the fractions 18–20. In a single chromatographic run, a yield of 6.25 mg/g pure maslinic acid was obtained from the crude extract. This is comparable to previously reported maslinic acid yields of 9.2 mg/g using optimized ultrasonic assisted extraction and then centrifugation [25], and 8.5 mg/g using solid–liquid, then ultrasonic-assisted extraction [29]. Moreover, our yield was significantly higher than previously reported yields of 1.2–1.5 mg/g [19] and 0.034 mg/g [26] using solid–liquid extraction (maceration), and yields of 0.295–0.904 mg/g using solid–liquid extraction (centrifugation) [27] and ultrasonic assisted extraction [28].
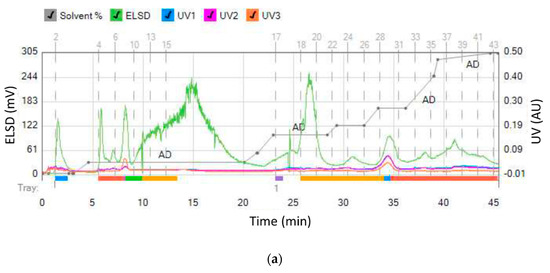
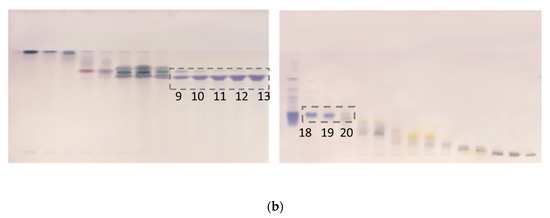
Figure 4.
(a) Separation of ethyl acetate fraction from the water-ethyl acetate extract and (b) HPTLC assessment of collected fractions (9–13 oleanolic acid and 18–20 maslinic acid).
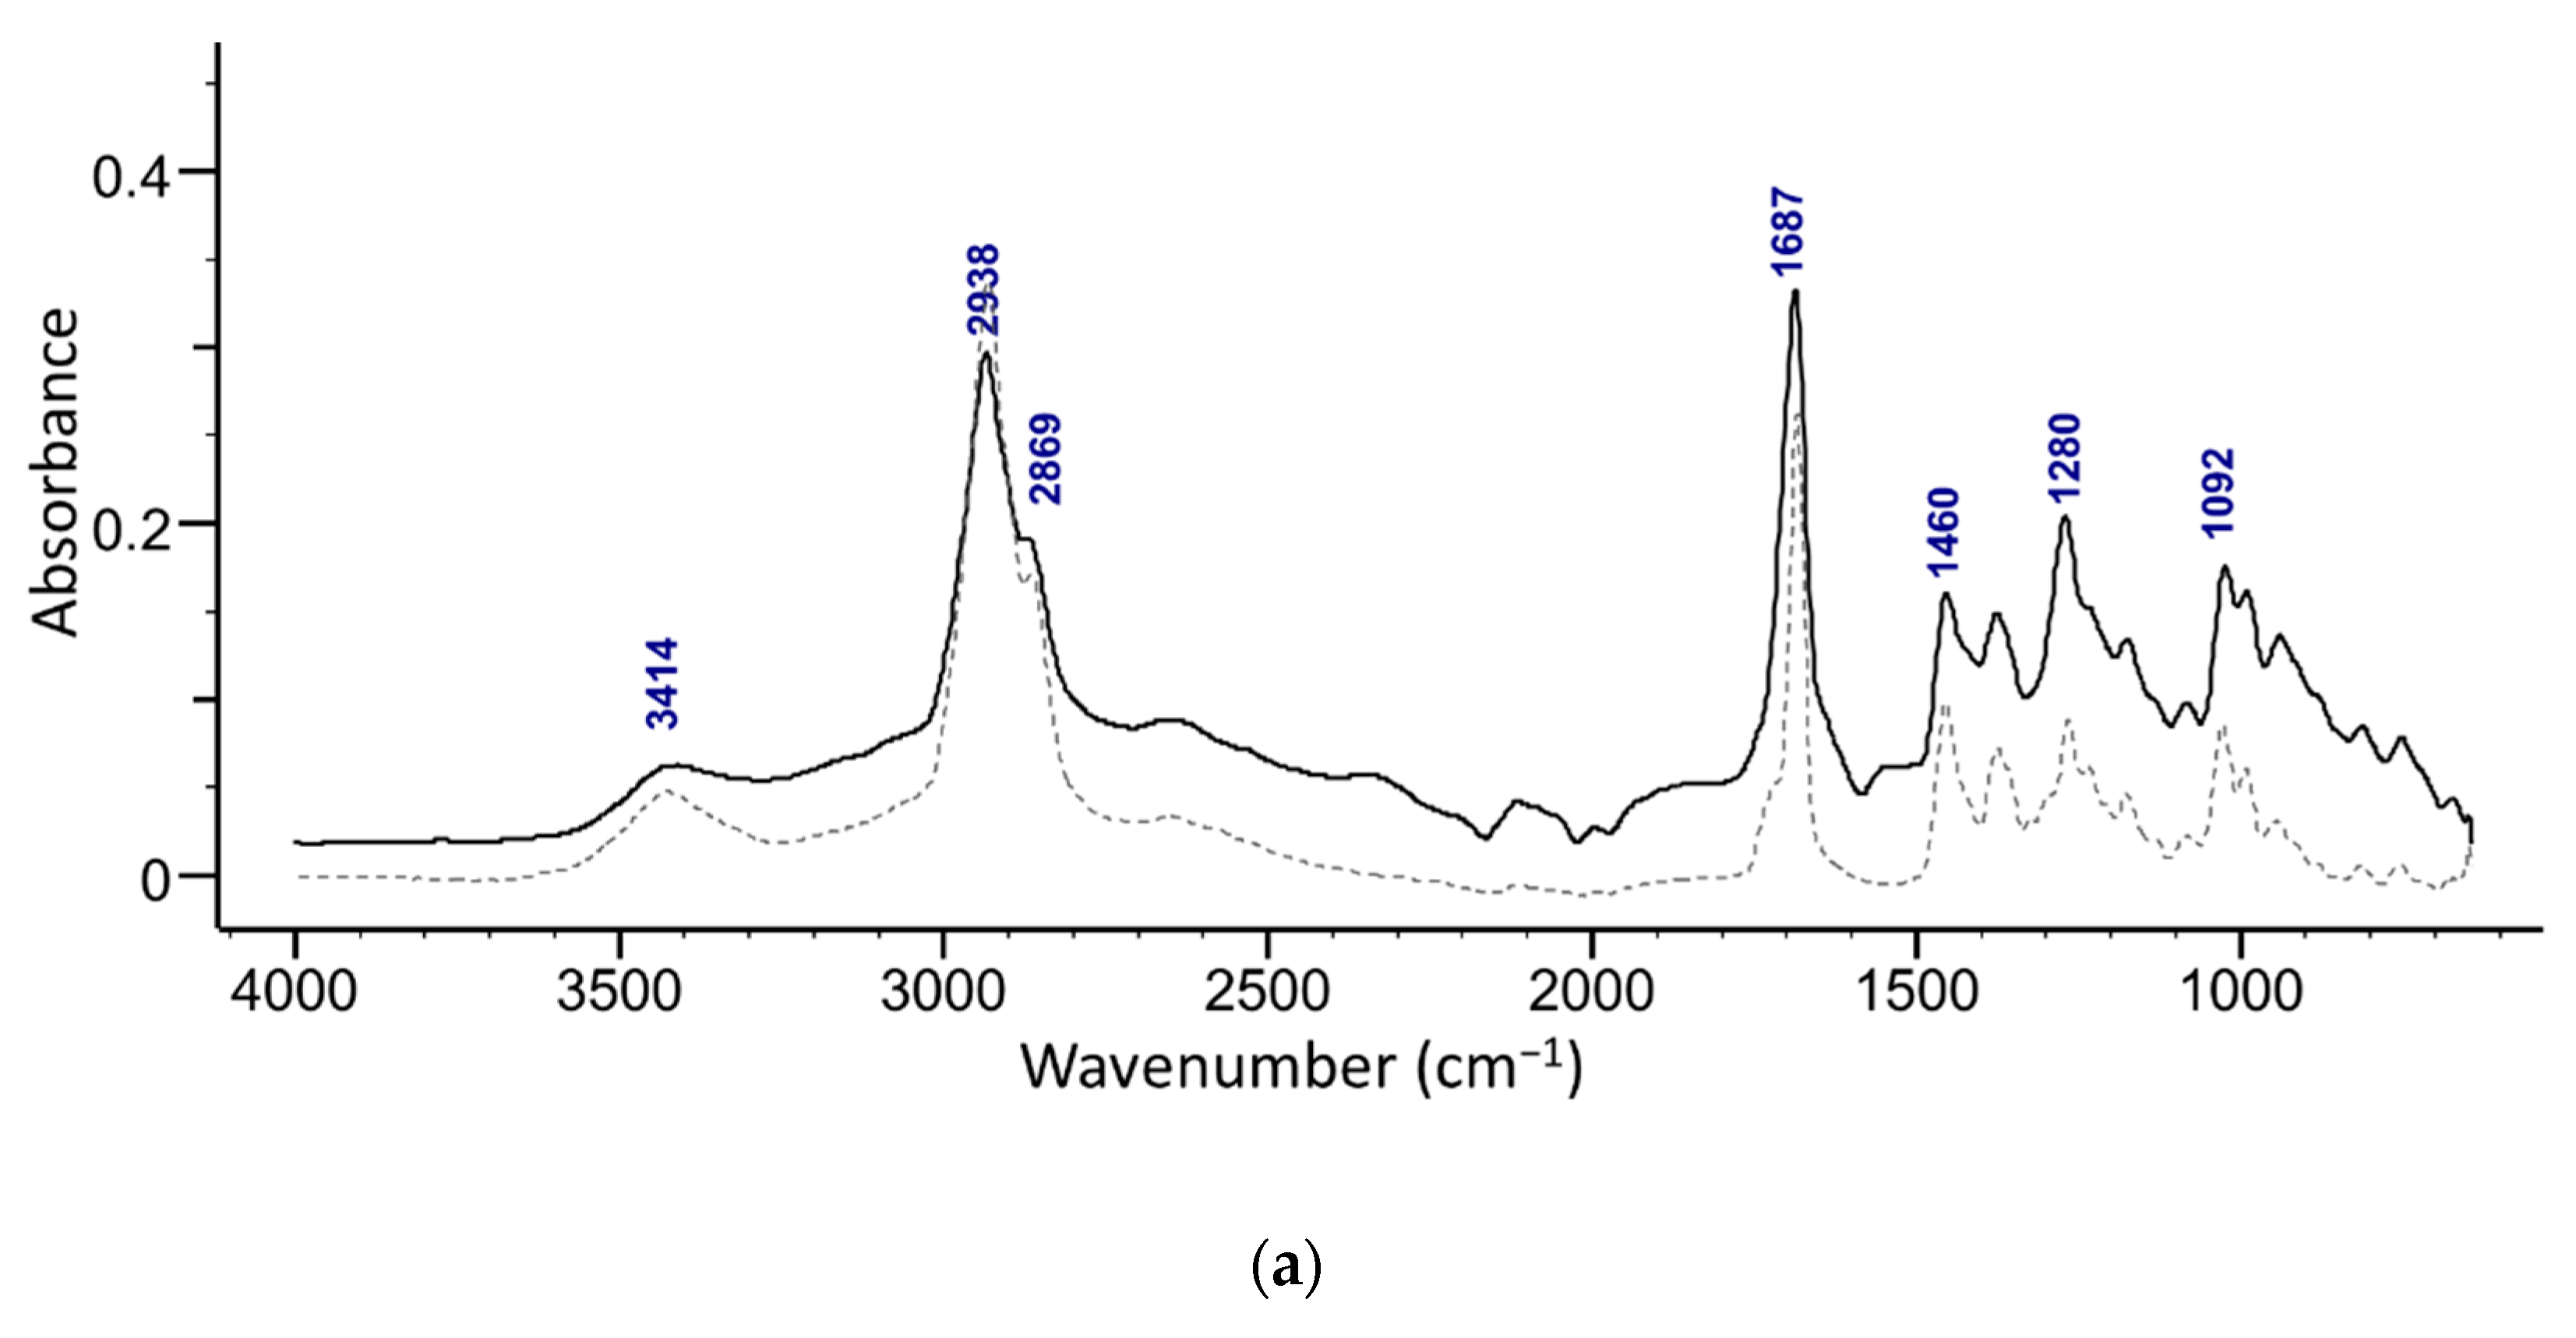
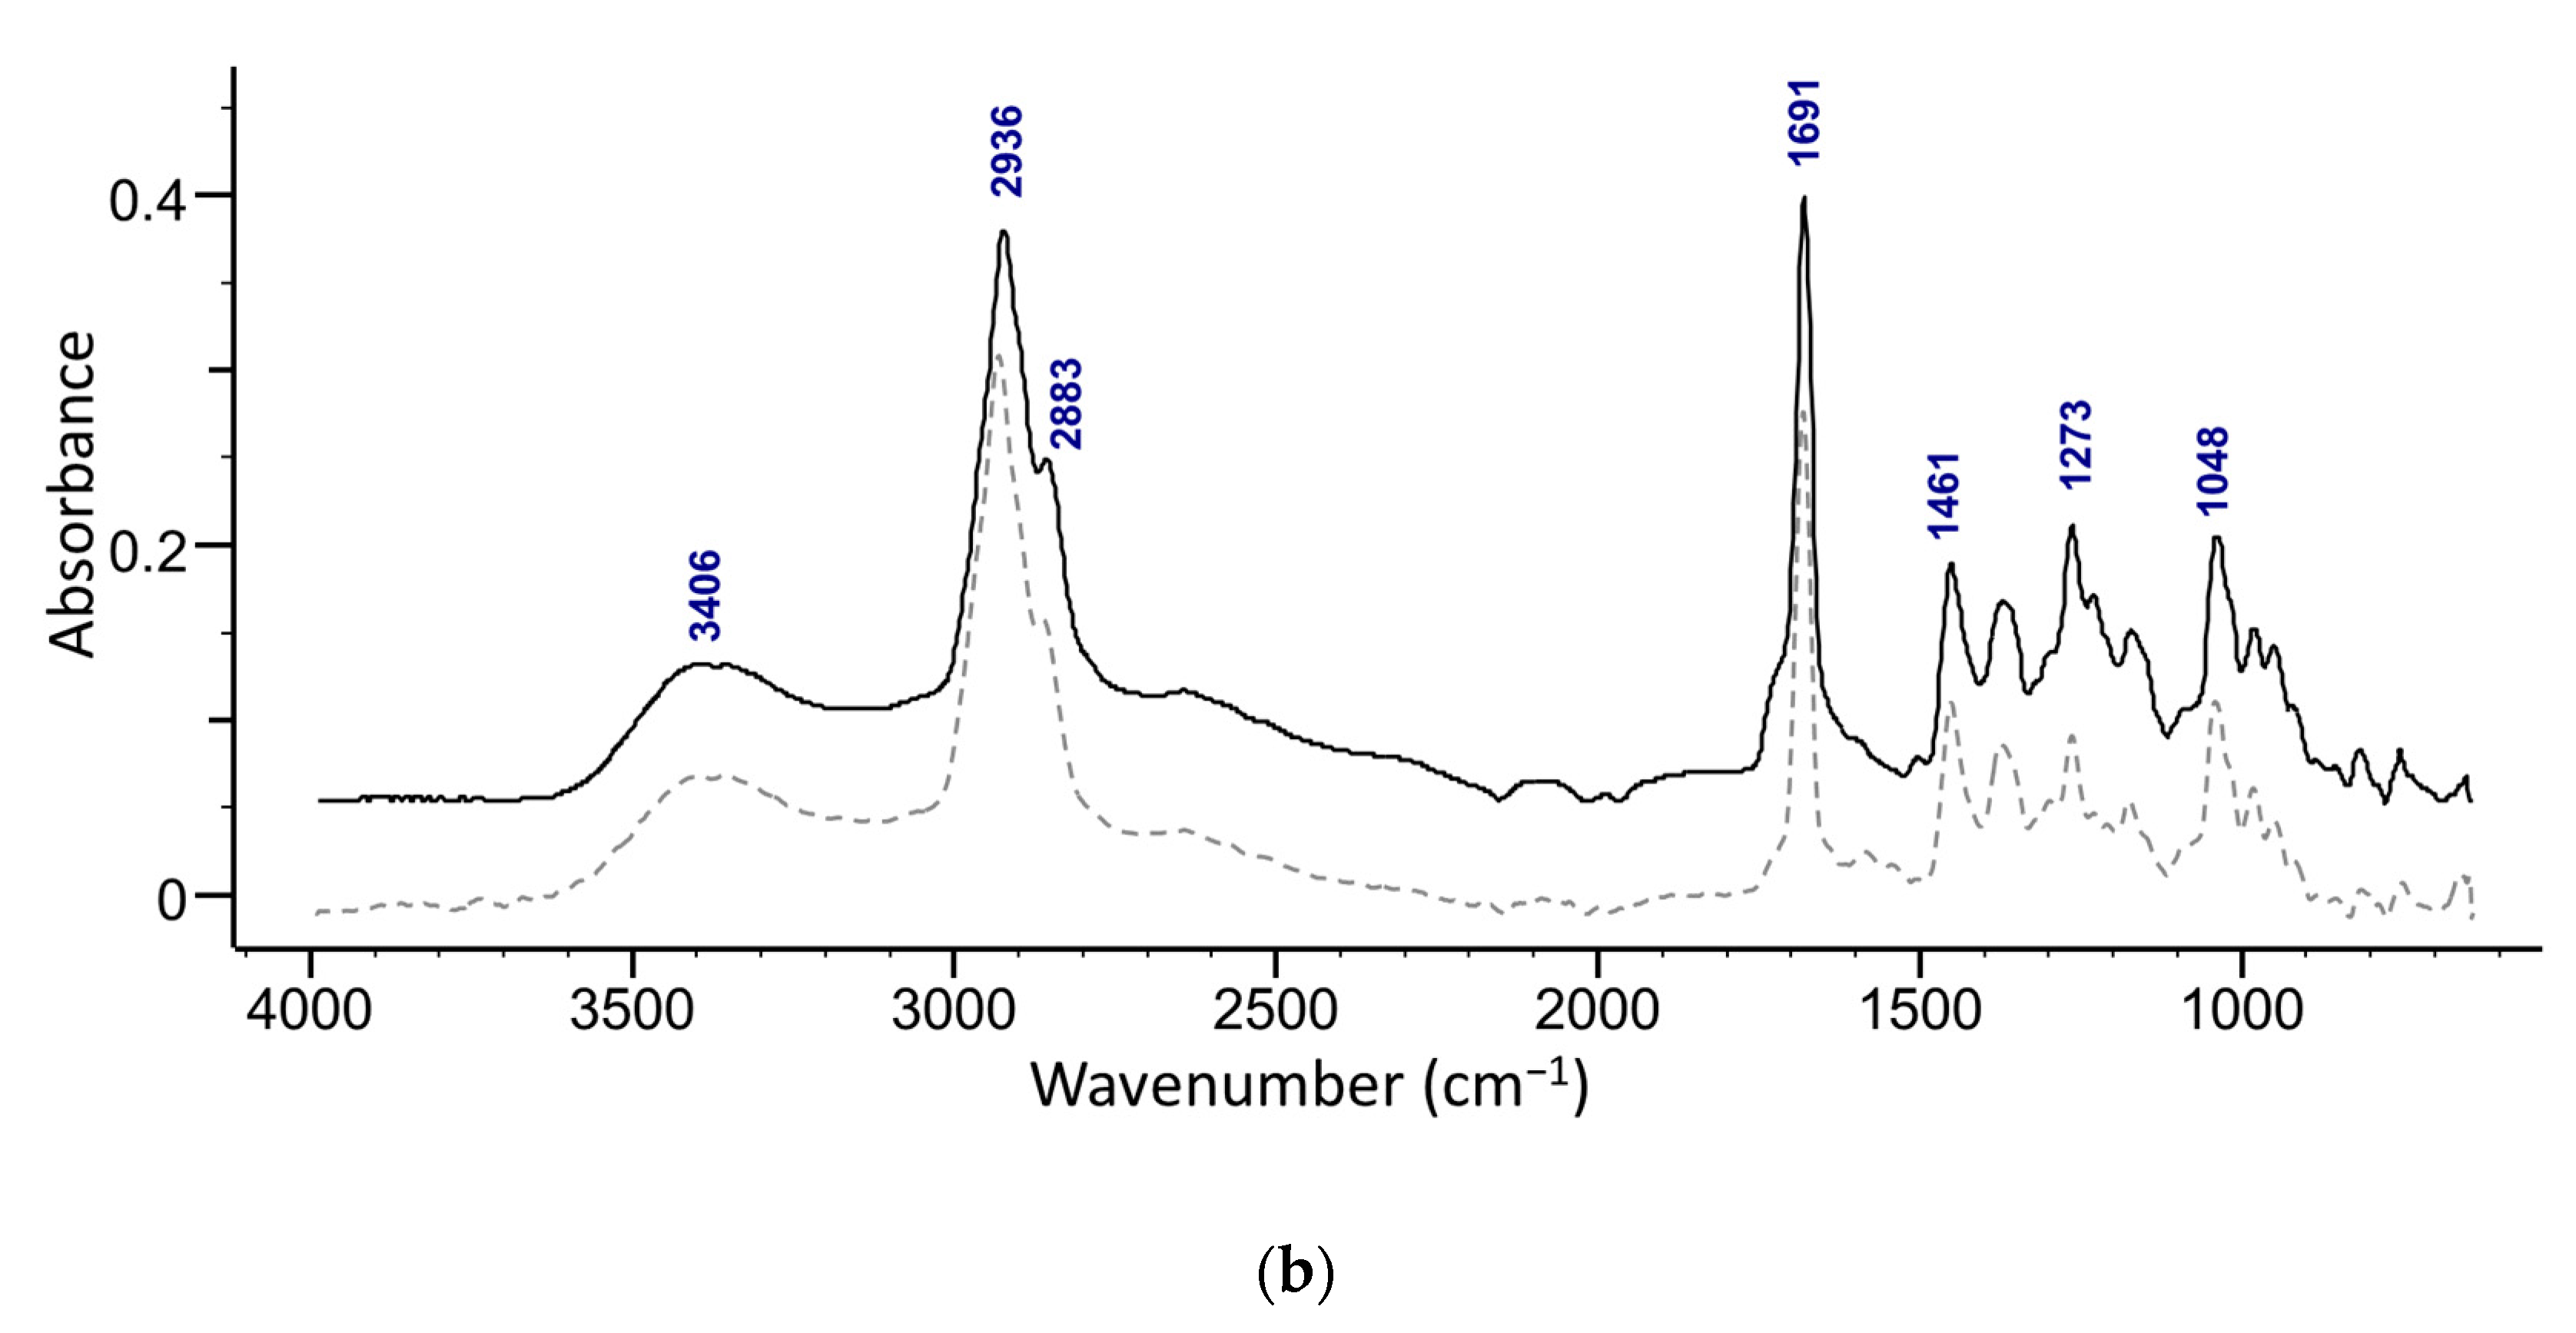
The presence of maslinic acid in fractions 18–20 was confirmed with ATR-FTIR (Figure 5b) and NMR. The ATR-FTIR spectrum of the isolated acids show the presence of OH (broad peak at around 3400 cm−1) along with a characteristic secondary alcohol peak (1092 cm−1) (Figure 5). Strong peaks of C-H in the methyl stretching region (2850−3000 cm−1) of methyl and cyclic alkane can be attributed to terminal methylene and methyl groups. A strong sharp peak of carbonyl from a carboxylic acid (-C=O, COOH) was observed at around 1690 cm−1 [30]. A weak band at around 1280 cm−1 in oleanolic acid and at 1273 cm−1 in the maslinic acid spectrum is related to stretching vibrations of C-O. Furthermore, several peaks found in the region 1050–1150 cm−1 can be attributed to stretching vibrations of C-O and C-C.
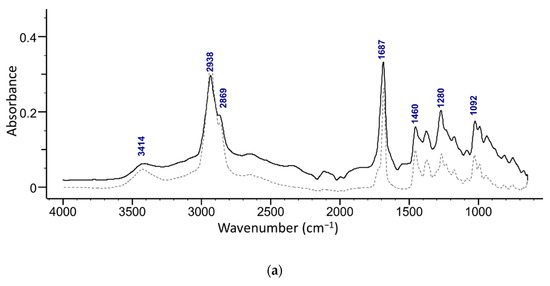
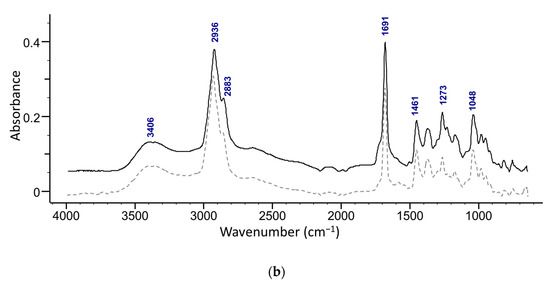
Figure 5.
Superimposed ATR-FTIR spectra of (a) an isolated compound from combined 13–19 fractions from ethanol extract and oleanolic acid standard (dashed line), and (b) s compound isolated from the fractions 18–20 from the ethyl acetate extract and maslinic acid standard (dashed line).
3.2. Solubility Prediction
Due to the complex nature of the sample matrix and diverse chemical characteristics of its constituents, there is no single standard method that can be used to extract or separate every bioactive natural product from plant material. Solvent extraction is the most commonly used method of extraction. Trends in green chemistry have pushed the focus towards the use of ‘green’ solvents. Thus, simple alcohols, ethanol and methanol, as universal solvents, are commonly chosen as extraction solvents. Alcohols, ethanol and methanol, as universal solvents, are commonly chosen as extraction solvents [31]. Due to methanol toxicity [32], ethanol is commonly selected as a green solvent with low toxicity for phytochemical studies. Guided by the law of similarity and intermiscibility (like dissolves like), the extraction of organic components from plant materials is directly related to the polarity of the extraction solvent, which should match the polarity of targeted compounds (solute). The polarity of the solvent and the solubility of the targeted compound in the solvent must be considered. In general, solutes whose polarity matches that of the solvent will generally be soluble in the solvent. Thus, solubility is a key parameter when selecting a solvent for separation processes and can be used to screen for possible candidates. Calculated solubility and solubility-related parameters are often related to the ionic and electronic characteristics of a molecule, while polarity of a molecule can be described by its dipole moment. The ability for a solvent to dissolve various compounds depends primarily on its polarity. Calculated solubility parameter, dipole moment, and hydrophilic surface area of ethyl acetate were found to match to those of oleanolic, ursolic and maslinic acids (Table 1).

Table 1.
Calculated solubility and polarity descriptors for extraction solvents and triterpenoid acids.
The three-dimensional Hansen solubility parameter (HSP) is a three component solubility parameter, a combination of dispersion, polarity and hydrogen bonding values (δD, δP, and δH). This combination gives a vector in 3D space that describes a radius of interaction sphere R of a molecule [33]. HSPs are useful for predicting solvent–solute affinity. They have been widely used to predict the solubility of polymers in different solvents and their compatibility with other polymers [34]. Dipole moment is a measure of the distribution and strength of partial charges in a molecule. Molecular Modelling Pro® 5.1 (ChemSW, Fairfield, CA, USA) was used to calculate the dipole moment from the partial charges of the individual atoms using semi-empirical quantum chemistry methods. Hydrophobic Surface Area, or HSA descriptors, were designed to measure molecular size related to solvent-accessible surface area of hydrophobic and hydrophilic features. Hydrophilicity or hydrophobicity are essential when dealing with liquids and miscibility. Log P values, could not be used to match solubilities. The log P value for a compound is the logarithm of the partition coefficient (P). The partition coefficient (P) is the ratio of a compound’s solubility in an organic (oil) phase to its solubility in aqueous phase. Thus, log P values do not directly correlate with solubility.
4. Conclusions
Natural products play an important role in the development of new drugs for medicinal purposes. However, multiple steps are required to isolate and purify natural products from crude plant extracts. A flash chromatographic technique has been successfully applied for the simple isolation and purification of the oleanolic and maslinic acids from crude olive leaf extracts. Quantitative characterization of solubility parameters was used to support extraction behavior of selected triterpenoid acids into the extraction solvent. It helped in choosing the extraction solvent to target extraction of triterpenoid acids from the plant matrix. Aqueous washing was used to selectively remove unwanted interferents from the extracts.
The developed method is rapid and inexpensive, providing analytes with high purity that can be used for further biological activity studies. The separation and yields of pure oleanolic and maslinic acids obtained by this method are reproducible.
Author Contributions
Conceptualization, S.A.-K.; methodology, S.A.-K. and E.U.R.M.; investigation, S.A.-K., H.K., E.U.R.M. and D.W.M.; writing—original draft preparation, S.A.-K. and E.U.R.M.; writing—review and editing, V.G. and D.W.M.; visualization, D.W.M.; project administration, V.G.; supervision S.A.-K. All authors have read and agreed to the published version of the manuscript.
Funding
This research received no external funding.
Institutional Review Board Statement
Not applicable.
Informed Consent Statement
Not applicable.
Data Availability Statement
The data presented in this study are available on request from the corresponding author.
Conflicts of Interest
The authors declare no conflict of interest.
References
- Demain, A.L.; Vaishnav, P. Natural products for cancer chemotherapy. Microb Biotechnol 2011, 4, 687–699. [Google Scholar] [CrossRef] [PubMed] [Green Version]
- Mahady, G.B.; Huang, Y.; Doyle, B.J.; Locklear, T. Natural Products As Antibacterial Agents. In Studies in Natural Products Chemistry, Atta ur, R., Ed.; Elsevier: Amsterdam, The Netherlands, 2008; Volume 35, pp. 423–444. [Google Scholar]
- Sethi, G.; Ahn, K.S.; Pandey, M.K.; Aggarwal, B.B. Celastrol, a novel triterpene, potentiates TNF-induced apoptosis and suppresses invasion of tumor cells by inhibiting NF-κB–regulated gene products and TAK1-mediated NF-κB activation. Blood 2007, 109, 2727–2735. [Google Scholar] [CrossRef] [PubMed] [Green Version]
- Khlebnicova, T.S.; Piven, Y.A.; Lakhvich, F.A.; Sorokina, I.V.; Frolova, T.S.; Baev, D.S.; Tolstikova, T.G. Betulinic acid-azaprostanoid hybrids: Synthesis and pharmacological evaluation as anti-inflammatory agents. Antiinflamm. Antiallergy Agents Med. Chem. 2020, 19, 254–267. [Google Scholar] [CrossRef] [PubMed]
- Ríos, J.L. Effects of triterpenes on the immune system. J. Ethnopharmacol. 2010, 128, 1–14. [Google Scholar] [CrossRef]
- Lee, J.-H.; Koo, T.H.; Yoon, H.; Jung, H.S.; Jin, H.Z.; Lee, K.; Hong, Y.-S.; Lee, J.J. Inhibition of NF-κB activation through targeting IκB kinase by celastrol, a quinone methide triterpenoid. Biochem. Pharmacol. 2006, 72, 1311–1321. [Google Scholar] [CrossRef] [PubMed]
- Montilla, M.P.; Agil, A.; Navarro, M.C.; Jiménez, M.I.; García-Granados, A.; Parra, A.; Cabo, M.M. Antioxidant activity of maslinic acid, a triterpene derivative obtained from Olea europaea. Planta Med. 2003, 69, 472–474. [Google Scholar] [PubMed]
- Silva, F.S.; Oliveira, P.J.; Duarte, M.F. Oleanolic, Ursolic, and Betulinic Acids as Food Supplements or Pharmaceutical Agents for Type 2 Diabetes: Promise or Illusion? J. Agric. Food Chem. 2016, 64, 2991–3008. [Google Scholar] [CrossRef]
- Jesus, J.A.; Lago, J.H.G.; Laurenti, M.D.; Yamamoto, E.S.; Passero, L.F.D. Antimicrobial activity of oleanolic and ursolic Acids: An update. Evid.-Based Complementary Altern. Med. 2015, 2015, 620472. [Google Scholar] [CrossRef] [PubMed]
- Cárdenas, C.; Quesada, A.R.; Medina, M.A. Effects of ursolic acid on different steps of the angiogenic process. Biochem. Biophys. Res. Commun. 2004, 320, 402–408. [Google Scholar] [CrossRef]
- Zhang, P.; Li, H.; Chen, D.; Ni, J.; Kang, Y.; Wang, S. Oleanolic acid induces apoptosis in human leukemia cells through caspase activation and poly (ADP-ribose) polymerase cleavage. Acta Biochim. Biophys. Sin. 2007, 39, 803–809. [Google Scholar] [CrossRef] [Green Version]
- van Baren, C.; Anao, I.; Lira, P.D.L.; Debenedetti, S.; Houghton, P.; Croft, S.; Martino, V. Triterpenic acids and flavonoids from Satureja parvifolia. Evaluation of their antiprotozoal activity. Z. Naturforsch. C 2006, 61, 189–192. [Google Scholar] [CrossRef] [Green Version]
- Gutierrez, B.; Gallardo, I.; Ruiz, L.; Alvarez, Y.; Cachofeiro, V.; Margolles, A.; Hernandez, M.; Nieto, M.L. Oleanolic acid ameliorates intestinal alterations associated with EAE. J. Neuroinflammation 2020, 17, 363. [Google Scholar] [CrossRef]
- Fernández-Navarro, M.; Peragón, J.; Esteban, F.J.; de la Higuera, M.; Lupiáñez, J.A. Maslinic acid as a feed additive to stimulate growth and hepatic protein-turnover rates in rainbow trout (Onchorhynchus mykiss). Comp. Biochem. Physiol. Part C Toxicol. Pharmacol. 2006, 144, 130–140. [Google Scholar] [CrossRef] [PubMed]
- Rufino-Palomares, E.E.; Reyes-Zurita, F.J.; García-Salguero, L.; Mokhtari, K.; Medina, P.P.; Lupiáñez, J.A.; Peragón, J. Maslinic acid, a triterpenic anti-tumoural agent, interferes with cytoskeleton protein expression in HT29 human colon-cancer cells. J. Proteomics 2013, 83, 15–25. [Google Scholar] [CrossRef]
- Liu, J.; Sun, H.; Duan, W.; Mu, D.; Zhang, L. Maslinic acid reduces blood glucose in KK-Ay mice. Biol. Pharm. Bull. 2007, 30, 2075–2078. [Google Scholar] [CrossRef] [Green Version]
- Moneriz, C.; Marín-García, P.; García-Granados, A.; Bautista, J.M.; Diez, A.; Puyet, A. Parasitostatic effect of maslinic acid. I. Growth arrest of Plasmodium falciparum intraerythrocytic stages. Malar. J. 2011, 10, 82. [Google Scholar] [CrossRef] [PubMed] [Green Version]
- Mirochnick, M.; Thomas, T.; Capparelli, E.; Zeh, C.; Holland, D.; Masaba, R.; Odhiambo, P.; Fowler, M.G.; Weidle, P.J.; Thigpen, M.C. Antiretroviral concentrations in breast-feeding infants of mothers receiving highly active antiretroviral therapy. Antimicrob. Agents Chemother. 2009, 53, 1170–1176. [Google Scholar] [CrossRef] [Green Version]
- Guinda, Á.; Rada, M.; Delgado, T.; Gutiérrez-Adánez, P.; Castellano, J.M. Pentacyclic triterpenoids from olive fruit and leaf. J. Agric. Food Chem. 2010, 58, 9685–9691. [Google Scholar] [CrossRef] [PubMed]
- Nelson, A.T.; Camelio, A.M.; Claussen, K.R.; Cho, J.; Tremmel, L.; DiGiovanni, J.; Siegel, D. Synthesis of oxygenated oleanolic and ursolic acid derivatives with anti-inflammatory properties. Bioorg. Med. Chem. Lett. 2015, 25, 4342–4346. [Google Scholar] [CrossRef] [Green Version]
- Huang, X.Y.; Zhang, X.; Pei, D.; Liu, J.F.; Gong, Y.; Aisa, H.A.; Di, D.L. Continuous separation of maslinic and oleanolic acids from olive pulp by high-speed countercurrent chromatography with elution-extrusion mode. J. Sep. Sci. 2019, 42, 2080–2088. [Google Scholar] [CrossRef]
- Still, W.C.; Kahn, M.; Mitra, A. Rapid chromatographic technique for preparative separations with moderate resolution. J. Org. Chem. 1978, 43, 2923–2925. [Google Scholar] [CrossRef]
- Chen, C.; Chen, T.; Liu, Y.; Zou, D.; You, J.; Li, Y. Rapid screening, identification, separation, and purification of four bioactive compounds from Swertia mussotii Franch. Sep. Sci. Technol. 2015, 50, 604–610. [Google Scholar] [CrossRef]
- Meyer, H.W.; Richter, W. Freeze-fracture studies on lipids and membranes. Micron 2001, 32, 615–644. [Google Scholar] [CrossRef]
- Soltane, R.; Chrouda, A.; Mostafa, A.; Al-Karmalawy, A.A.; Chouaïb, K.; dhahri, A.; Pashameah, R.A.; Alasiri, A.; Kutkat, O.; Shehata, M.; et al. Strong inhibitory activity and action modes of synthetic maslinic acid derivative on highly pathogenic coronaviruses: COVID-19 drug candidate. Pathogens 2021, 10, 623. [Google Scholar] [CrossRef] [PubMed]
- Gil, M.; Haidour, A.; Ramos, J.L. Identification of two triterpenoids in solid wastes from olive cake. J. Agric. Food Chem. 1997, 45, 4490–4494. [Google Scholar] [CrossRef]
- Romero, C.; García, A.; Medina, E.; Ruíz-Méndez, M.V.; de Castro, A.; Brenes, M. Triterpenic acids in table olives. Food Chem. 2010, 118, 670–674. [Google Scholar] [CrossRef]
- Goulas, V.; Manganaris, G.A. Towards an efficient protocol for the determination of triterpenic acids in olive fruit: A comparative study of drying and extraction methods. Phytochem. Anal. 2012, 23, 444–449. [Google Scholar] [CrossRef]
- Chouaïb, K.; Hichri, F.; Asma Nguir, A.; Daami-Remadi, M.; Elie, N.; Touboul, D.; Ben Jannet, H.; Ali Hamza, M.A. Semi-synthesis of new antimicrobial esters from the natural oleanolic and maslinic acids. Food Chem. 2015, 183, 8–17. [Google Scholar] [CrossRef]
- Rali, S.; Oyedeji, O.O.; Aremu, O.O.; Oyedeji, A.O.; Nkeh-Chungag, B.N. Semisynthesis of derivatives of oleanolic acid from Syzygium aromaticum and their antinociceptive and anti-inflammatory properties. Mediat. Inflamm. 2016, 2016, 8401843. [Google Scholar] [CrossRef] [Green Version]
- Zhou, C.; Sheng, Y.; Zhao, D.; Wang, Z.; Tao, J. Variation of oleanolic and ursolic acid in the flesh of persimmon fruit among different cultivars. Molecules 2010, 15, 6580–6587. [Google Scholar] [CrossRef] [Green Version]
- Jacobsen, D.; McMartin, K.E. Methanol and ethylene glycol poisonings. Mechanism of toxicity, clinical course, diagnosis and treatment. Med. Toxicol. 1986, 1, 309–334. [Google Scholar] [CrossRef] [PubMed]
- Hansen, C.M. The Three Dimensional Solubility Parameter and Solvent Diffusion Coefficient. Their Importance in Surface Coating Formulation.; Danish Technical Press: Copenhagen, Denmark, 1967. [Google Scholar]
- Agrawal, A.; Saran, A.D.; Rath, S.S.; Khanna, A. Constrained nonlinear optimization for solubility parameters of poly(lactic acid) and poly(glycolic acid)-validation and comparison. Polymer 2004, 45, 8603–8612. [Google Scholar] [CrossRef]
Publisher’s Note: MDPI stays neutral with regard to jurisdictional claims in published maps and institutional affiliations. |
© 2022 by the authors. Licensee MDPI, Basel, Switzerland. This article is an open access article distributed under the terms and conditions of the Creative Commons Attribution (CC BY) license (https://creativecommons.org/licenses/by/4.0/).

