Perspective

Making Sense of Light: The Use of Optical Spectroscopy Techniques in Plant Sciences and Agriculture

1
CEOT, Campus de Gambelas, Universidade do Algarve, FCT, Ed.2, 8005-189 Faro, Portugal
2
INOV INESC Inovação, 1000-029 Lisbon, Portugal
3
CeFEMA, Universidade de Lisboa, 1049-001 Lisbon, Portugal
4
Faculty of Sciences, BioISI–Biosystems and Integrative Sciences Institute, Universidade de Lisboa, 1749-016 Lisbon, Portugal
5
Physics Department, Campus de Gambelas, Universidade do Algarve, FCT, Ed.2, 8005-189 Faro, Portugal
*
Author to whom correspondence should be addressed.
Appl. Sci. 2022, 12(3), 997; https://doi.org/10.3390/app12030997
Submission received: 31 October 2021 / Revised: 28 December 2021 / Accepted: 30 December 2021 / Published: 19 January 2022
(This article belongs to the Special Issue Applications of Optical Spectroscopy in Plant Sciences)

Abstract

:
As a result of the development of non-invasive optical spectroscopy, the number of prospective technologies of plant monitoring is growing. Being implemented in devices with different functions and hardware, these technologies are increasingly using the most advanced data processing algorithms, including machine learning and more available computing power each time. Optical spectroscopy is widely used to evaluate plant tissues, diagnose crops, and study the response of plants to biotic and abiotic stress. Spectral methods can also assist in remote and non-invasive assessment of the physiology of photosynthetic biofilms and the impact of plant species on biodiversity and ecosystem stability. The emergence of high-throughput technologies for plant phenotyping and the accompanying need for methods for rapid and non-contact assessment of plant productivity has generated renewed interest in the application of optical spectroscopy in fundamental plant sciences and agriculture. In this perspective paper, starting with a brief overview of the scientific and technological backgrounds of optical spectroscopy and current mainstream techniques and applications, we foresee the future development of this family of optical spectroscopic methodologies.

1. Introduction

The future of humanity on Earth is dependent on plants. They provide not only the oxygen needed to support aerobic respiration but also the food for an increasing global population. In fact, plants and other photosynthetic organisms (e.g., algae and cyanobacteria) provide all the energy that fuels the biosphere, with the exception of chemosynthetic processes present on some bacteria. These might have local importance, such as in the underwater volcanic hydrothermal springs, but do not contribute significantly to the biosphere energy budget. Therefore, fostering progress in plant sciences must be a strategic goal for the forthcoming decades. Formidable advances in the knowledge of plants’ molecular biology have been made in the last decades, but the understanding of integrative phenomena and their regulation at the whole-plant level have somehow lagged behind. Fortunately, there is an increasing number of non-invasive technologies applied for monitoring the physiology of plants and other photosynthetic organisms under diverse conditions, arising from the development of optical spectroscopy techniques. They are implemented in devices with different functionalities and hardware, assisted by the increasingly accessible computing power and the concomitant development of machine learning techniques.
Optical spectroscopy has been used to establish the microstructure and composition of plant tissues; to evaluate crops quality and yield; to assess plants responses to biotic and abiotic stress; to screen various disorders and pathologies; to determine the impact of plant species onto the ecosystems’ biodiversity and stability; and to assess, remotely the physiological status of photosynthetic biofilms. These many applications have been compiled in various recent reviews on the research topic [1,2,3,4,5]. The emergence of high-throughput plant phenotyping technologies and the concomitant need for rapid and contactless technologies for the assessment of plant performance renewed the interest in the application of optical spectroscopy techniques in plant sciences [6,7,8,9]. Furthermore, the new generations of earth observation satellites brought increased attention to techniques such as the spectral analysis of solar-induced fluorescence (SIF). Finally, various optical spectroscopic techniques have become valuable smart tools in precision agriculture as well as in the assessment of horticultural product quality across the supply chains. This has contributed to a more sustainable, safe, traceable, and high-quality fresh commodities production [10,11,12]. In this perspective paper, departing from a brief review of the scientific and technological history of optical spectroscopy, and an overview of the current main methodologies and applications in the fundamental plant sciences and in agriculture, we foresee future developments of this family of optical spectroscopy techniques.

2. Historical Perspective

Although spectral phenomena such as the rainbow have been known to humans since ancient times, spectroscopy as a science emerged in the 17th century. At that time, experimenting with sunlight and prisms, Sir Isaac Newton first demonstrated that white light is composed of seven visible colors [13]. Soon after, the investigations were extended to light from stars and flames, and the first signs that the spectra are related to the chemical composition of the burning sample were observed. Afterward, spectroscopy started to develop more intensively, accompanying the First Industrial Revolution. The foundations of the wave theory of light and its interference were formed. The pioneer Newtonian setup, built around a small hole and a prism, was improved by using a slit for the light beam formation and, later, a diffraction grating [14,15,16] for the light dispersion. This enabled William Wollaston, Joseph von Fraunhofer and, later, Anders Ångström to observe and describe the position (wavelengths) of about a thousand thin dark lines of the solar spectrum [17,18,19], presently known as the Fraunhofer lines. For the accurate measurements of the angular position of the lines, a two-prism setup and a telescope were mounted on a precise rotation stage to observe the spectrum, turning the optical arrangement into what we today call a spectroscope (see [20] for more details). The establishment of a quantitative wavelength scale served as the basis for a consistent cooperative examination and classification of spectra observed in different laboratories, from diverse sources, and using various instruments. By examining starlight and flames with the spectroscope, it was found that they also can emit bright spectral lines [14]. Further critical development of spectroscopy was made by Gustav Kirchhoff and Robert Bunsen, who reinforced the initial assumption of the relationship between spectra and chemical composition with solid experimental data [21].
By the beginning of the 21st century, the ever-increasing progress in the manufacture of optical components—together with the development of each time more sensitive and accurate photodetection techniques and devices—formed the foundations of spectroscopy as we know it today. The rhythm of this progress in the field of specialized instrumentation, such as fiber optics, gratings, and CCD, is well tracked in a number of fast-paced online publications [22].
It grew into a broad and one of the most important fields of physics and chemistry, going beyond the framework of optics and inorganic chemical analysis. Since then, spectroscopy has evolved using different strategic physical concepts, including such exotic ones as acoustic spectroscopy and dynamic mechanical analysis [23]. The study of radiation remains the predominant area of activity; however, radiation has been considered in its broadest sense, giving rise to microwave, terahertz, traditional optical (i.e., far/near/mid-infrared, visible-light, and ultraviolet), X-ray, and gamma spectroscopy. Spectroscopic methods can also be classified in accordance with the nature of the interactions between radiation and materials [24]. Here, along with the simplest elastic-scattering and reflection techniques, one can distinguish several others, based on more complex light-matter interactions, including, absorption, emission, Raman, Brioullin, coherent and nuclear spectroscopy. The interested reader is referred to the extensive treatise [25], and other vast literature on the subject.
In plant sciences, the spectroscopic methods are applied to the solution of a wide range of problems, from plant tissues and composition analysis to the detection and characterization of motile species and biofilms. In view of the great diversity of these problems, the plant scientists use a wide arsenal of spectroscopic methods covering nearly all spectral ranges of electromagnetic radiation and various types of its interaction with matter [22,24], from simple reflectance up to laser ablation inductively coupled plasma mass spectrometry. Within the limited frame of this perspective article, the discussion will be restricted to the most widely used and promising techniques and applications, namely, the non-invasive visible/near/mid-infrared spectroscopy (“point” spectral and imaging techniques), spatially and time resolved spectroscopy, Raman spectroscopy and fluorescence.
In the larger picture, these spectroscopic techniques have contributed largely to the knowledge warranted to intervene as soon as possible in the ecosystems and the supply chains of major crops and avoid detrimental effects on plants’ growth, yield, survival and biodiversity, resulting in higher yield, quality, sustainability, and food safety, as envisaged in the Sustainable Development Goals (SDGs) of the UN Agenda 2030 (https://www.undp.org/sustainable-development-goals; accessed on 20 September 2021).

3. Main Techniques

Various branches of spectroscopy provide the researcher with different opportunities, perspectives, and observations—resonance frequencies, spectral amplitudes, and line shapes, etc. In this section, we present the most interesting traditional and novel techniques of optical spectroscopy for plant science that have demonstrated significant recent achievements. The general basic principles of the most common spectroscopic techniques are described below and depicted in Figure 1.

3.1. Elastic Spectroscopy

Elastic scattering represents the simplest and most efficient interaction between photons and matter. Thus, elastic spectroscopy has found numerous applications in various domains of biology [24]. Essentially, this methodology examines the spectrum of photons scattered elastically, that is, without changing the energy and wavelength, reflected from the sample under study (Figure 1). The incident and reflected spectra differ because part of the photons is extinguished in the path between source and detector. Photon extinction is due to wavelength-dependent absorption and scattering. The light input is obtained from an illuminator that emits a continuous or line spectrum in the range of interest. The active setups use broadband light sources based on flames, high-temperature filaments (e.g., tungsten lightbulbs), discharges (arc lamps) or tunable (dye, semiconductor, free-electron, etc.) lasers. The passive setups use external broadband light sources, primarily solar radiation.
Usually, active setups are chosen for the in situ and/or “point” spectral measurements on both plants and fruit, where a specific site is targeted, producing an average spectrum for that site only. Otherwise, multi- and hyperspectral (MHS) imaging, applied to plant or fruit sections, may use both active (indoors) and passive (outdoors) setups. MHS produces a “cube” of data, the three dimensions corresponding to the 2D pixel matrix times the 1D spectral component. This cube may be sectioned along a plane of constant wavelength to create an image of the measured areas/sections at that wavelength band or along constant x or y to create a spatially resolved reflectance map [26]. The main difference between multi- and hyperspectral modes is the number of wavebands used and how narrow the bands are [27]. Multispectral imaging uses a set of filters and a common digital camera to deliver typically no more than ten bands, while hyperspectral cameras merge imaging and spectral separation in the optical hardware to produce hundreds of contiguous wavebands [26]. The light-source-free spectral imagery equipment is efficient and lightweight; therefore, it has found wide application in the air- and spaceborne diagnostics of individual plants and vegetation landscapes [28,29].
Among the various elastic spectroscopy techniques used in plant sciences and in precision agriculture, for “point” spectral measurements and MHS imaging, either in situ or remotely, visible-near infrared reflectance spectroscopy (Vis-NIRS) has undoubtedly a prominent and versatile role in the assessment of whole plants, fruit, field crops, orchards and forestry [1,26,30]. Vis–NIRS covers the electromagnetic spectrum wavelength range of 400–2500 nm, although the upper limit of 2500 nm is not consensual among authors. The choice made here is the most common, and one of the reasons to adopt it is that it coincides with the detection limit of the InGaAs detectors equipping the standard NIR spectrometers. The NIR radiation was discovered by Friedrich Wilhelm Herschel in 1800 and was first used in agricultural applications to measure the moisture in grain in the late 1960s [31]. The first Vis–NIRS application was commercialized in Japan in 1989 to sort peaches based on their soluble solids content (SSC) in an automated grading line. However, the research on its principles, applications and on the development of new customized systems have only followed some decades later, being a flourishing area nowadays [10,11,32]. Overall, devices and systems have been developed and used to produce a large bulk of significant and cutting-edge knowledge, which has been published throughout several decades [32]. Furthermore, there are more and more commercial applications available by industrial vendors, which are used on a daily basis, particularly in agriculture and the agro-food sector [10,11,33,34].
Other major spectroscopic techniques used in plant science, mainly since the 1990s–2000s, include the spatially resolved spectroscopy (SRS), which can also be associated with both the MHS imaging [26,35] and the time resolved spectroscopy (TRS). SRS was first developed to understand the light propagation in turbid media [36,37] and was further applied to the determination of the optical properties of biological tissues [38,39]. In this technique, a small continuous-wave light beam illuminates the sample’s surface, and the reemitted light is measured at different distances from the light source. The absorption coefficient (μa) and the reduced scattering coefficient (μs’) can then be extracted from the measured SRS reflectance profiles by using an appropriate numerical method [26]. In TRS, a short monochromatic pulse is injected into a turbid medium, such as a plant or fruit tissue, and the temporal distribution of the emitted light, which is attenuated, broadened, and delayed due to light scattering, is measured and fitted with an appropriate model of photon migration to estimate the optical properties of the medium [26,40,41]. Application of TRS imaging systems have been reported for the 3D imaging of biological tissues [42], but not in plants.
Apart from the property of the matter under investigation, the recorded spectrum of the reflected radiation highly depends on the spectrum of the internal or external illumination source, observation geometry and parameters of the electro-optical system in use. For this reason, signal processing includes calibration and normalization procedures designed to ultimately synthesize a certain characteristic that solely represents a property of the sample—usually, the reflection coefficient of the illuminated sample surface.
The collection geometry for Vis-NIRS, either in the modalities of “point” and imaging, depends on the goal of the measurement. In any case, it is always a recommended procedure to avoid specularly reflected light since it is mostly devoid of information from the sample. One possibility is to send and collect light along the same oblique angle. Another possibility is to use geometries such a 0/d, meaning that light is incident along the normal to the surface, and the diffusively reflected light is collected along an oblique angle. Diffuse reflected light is originated either by the surface roughness, or by scattering inside the tissue. In some applications, it is important to collect only the photons scattered inside the tissue, because these are the most informative. To do that, it is necessary to reject the superficial component of the diffuse reflected light. The simplest way to achieve it is to perform contact measurements, with light being injected and collected by optical fibers separated by a few millimeters. However, the same effect may also be achieved with lenses and baffles. The corresponding geometry is usually called interactance. Finally, there is also the transmittance geometry, where light injection and collection are performed at opposite sides of the sample. This automatically implies that only the light crossing the tissue is detected.
Thus, in most systems the elastic reflection represents the overwhelming part of the total reflection, and the elastic spectroscopy provides good sensitivity, achieved with robust equipment that is cost-effective in terms of manufacturing, operation and maintenance. It is also a very versatile technique, as nearly all biological materials reflect a sufficient portion of the incident optical light. However, the elastic-scattering spectra of related plant samples demonstrate significant similarities, which in many cases result in the low selectivity of this technique.

3.2. Other Spectroscopic Techniques

Far more selective techniques can be developed based on interactions between light and matter that result in changes in the photon energy and wavelength. These changes are characteristic of the biological material and, as a rule, yield spectra that are more information-rich than those due to the elastic scattering. The two main types of such phenomena are fluorescence and Raman scattering (Figure 1), the latter firstly discovered in 1928 [43]. As both imply detection of light emitted by the irradiated sample, the fluorescence and Raman emissions are often observed simultaneously, with the same experimental setup.
The main difference between fluorescence and Raman processes is that the former is emission from a relatively long-lived (typically, 10−8–10−9 s) excited electronic state, whereas in the latter, light scattering occurs nearly instantly—more precisely, via emission of a photon from a short-lived (less than ca. 10−15 s) excited virtual state—see a more detailed comparison in [44]. For fluorescence, the long excited-state lifetime results in the molecules having sufficient time to relax to the same metastable energy state prior to emission. The energy of the virtual state, from which the radiative transition takes place, is determined by the energy of the incident photon. Thus, the wavelength of fluorescent radiation is weakly dependent on it, while the wavelength of Raman scattering increases with the wavelength of the exciting light. In most cases, the light due to fluorescence and Raman scattering possesses lower quantum energy (longer wavelength) than the initial radiation (Stokes shift). However, when the molecules are already in an excited state, the emitted light has higher energy (smaller wavelength) than the initial radiation (anti-Stokes shift—see Figure 1 for illustration of anti-Stokes in Raman scattering). Anti-Stokes lines are much weaker than the Stokes lines because there are far fewer molecules in the excited state than in the ground state. Due to a lower probability of interactions, the fluorescence and Raman spectroscopy lead, in general, to worse sensitivity than the elastic-scattering methods. Reliable detection requires intensive sample irradiation, i.e., powerful sources (such as lasers or flashlamps), which makes the instrumentation more complex, less robust and costlier, both in manufacturing and operation. The method versatility is limited to the irradiation wavelength–material pairs that have good quantum yield for the process of interest.
Filtering the fluorescence and Raman signals is essential, because they are orders of magnitude smaller than diffuse reflected light. Fluorescence and Raman are competing processes (fluorescence being usually more intense), so they also need, in turn, to be separated. The shielding from specular and diffuse reflectance is obtained by the same geometrical methods described for Vis-NIRS, taking care to avoid the specular reflection angles. Additionally, high-pass, low-pass and/or band-pass optical filters are used to remove the unwanted wavelengths. Consider an example with blue excitation/red fluorescence. At the excitation, a low-pass filter is used to remove any red component from the incident light, while at the detection, a high-pass filter is used to remove any reflected blue from the red fluorescence. For the separation of Raman from fluorescence, the most common approach is the careful selection of the excitation wavelength. Choosing a NIR or UV laser wavelength can avoid exciting fluorescence. In the first case, because the radiation does not have enough energy to excite fluorescence. In the second case, there is fluorescence, but the emission is widely separated in energy from the Raman signal, allowing to measure it in a fluorescence-free wavelength range. It is also possible to fine tune the position of the Raman spectrum by shifting the laser wavelength because the energy differences between excitation and Raman peaks are always the same, while the fluorescence spectra have fixed positions.
At present, the spectroscopist’s arsenal has many means to overcome the above general shortcomings and thus, being highly selective, Raman and fluorescence have found wide application in many areas of research and technology, including plant sciences. For instance, Raman spectroscopy has been intensively developed regarding the instrumentation, data acquisition and processing, as well as the necessary spectral databases used as standards to identify data acquired. Overall, it allows the fingerprinting of a very wide range of compounds, which renders it a very accurate tool for the analysis of highly complex plant tissues [45], as discussed further in the sections below.

4. Current Applications and Future Perspectives

4.1. Elastic Spectroscopy

One of the most important and illustrative applications of elastic spectroscopy comprises the widespread use of MHS imaging sensors and devices in precision agriculture. The rapid development of computer and information technologies has led to a dramatic reduction in the time of complex computations. It enabled the practitioners to process previously unthinkable amounts of spectral data obtained by these sensors, used in many different applications. This is made possible not only to significantly improve the methods of vegetation detection [46] but also to develop models capable of predicting, with various degrees of accuracy, a wide range of parameters describing plants, their physiology, and interaction with the environment. Published research on this subject includes the assessment of the plant biomass, chlorophyll, nitrogen and lignin-cellulose content [8,47,48,49]; vegetation classification [50,51] and phenotyping [52]; and detection and mapping of pest (invasive species, diseases, etc.) [2,8,53,54] among major crops supply chains.
The most prospective approach in providing the largest and most extensive information on many crops, forests and ecosystems, is the remote light-source-free spectral imagery sensing based on sunlight reflection. Its widespread and rapid development relies on several factors, in addition to the enhanced computer and information technologies capacity. These factors comprise: (i) advances in materials engineering that have led to the creation of compact, lightweight, reliable and low-energy-consumption instrumentation for MHS imaging; (ii) with the advent of geographical information systems (GIS) and Geostatistics, the recorded images have been linked, easily and precisely, with their location on the map (georeferenced); (iii) this, in its turn, made it possible to evaluate large areas using not only inevitably limited terrestrial observations but airborne and spaceborne remote sensing as well [12,50,55,56,57]. A major example of the latter is the study by Zheng et al. [58], which has explored and shown the potential of the Sentinel-2 Multispectral Instrument (MSI), a launched satellite with refined spatial resolution and three red-edge bands for discriminating between yellow rust infection severity in winter wheat over large areas up to a regional scale.
A wide set of hyperspectral imaging applications, both in situ and remotely, have been used in agriculture. Rice cultivation is among the major examples that has made extensive use of those applications to assess growth, stress conditions, pests, yield, harvest, as well as for the determination of grain quality, viability and geographical origin [12]. These applications have been extended to other species and crops, namely, to discriminate between multiple cultivars of a crop species [59], to predict critical crops yield, and in the early detection of potentially dangerous diseases. These include the laurel wilt disease in avocado [60]; fire blight in pear trees [61,62]; canker, black spot, decay, and Huanglongbing (HLB) in citrus [1,10,11,32,63]; Yellow Rust in wheat [64]; Southern Corn Rust (SCR) [65]; the Potato Virus Y (PVY) disease in visually asymptomatic infected potato plants [59]; or to identify and classify grapevines inoculated with the Grapevine Vein-Clearing Virus (GVCV) at the early asymptomatic stages, under field conditions [57].
However, for most of these crops, including rice [1,26], the assessment through manual in situ measurements is still the predominant procedure [12]. For instance, when evaluating the fruit quality and ripening on-tree, the canopy foliage is still a major impediment to the specific and accurate evaluation through airborne or spaceborne imaging sensing, namely those based on Vis-NIRS [66]. As an alternative, MHS imaging has been used in robotic harvesting, as successfully demonstrated for a non-destructive fruit quality monitoring prototype system, consisting of a light detection and ranging (LiDAR) and Vis-NIRS sensors installed on an inclined conveyor for mimicking real-time citrus fruit size and SSC measurement, respectively, during harvest [67]. Another remote-controlled field robot, RobHortic, equipped with color, multispectral, and hyperspectral (400–1000 nm) cameras and specific software, has been developed and tested under field conditions for the detection of infected plants (symptomatic and asymptomatic) with “Candidatus Liberibacter solanacearum”, across carrot fields, with an accuracy of about 60 %, based on several machine learning-based models [68]. Other common applications of Vis-NIRS MHS imaging comprise the sorting of horticultural products by assessing their external (EQA) and internal quality attributes (IQA) in the postharvest, with portable, benchtop devices and in automated grading lines [1,31,35,36,66,69,70,71,72,73], commercialized by several vendors (e.g., Aweeta, Maf-Roda, Greefa, Compaq, Unitec). The majority of these commercial devices, particularly those installed on inline grading systems, seldom provide their actual proven assessment capacity due to industrial secrecy. However, there are numerous examples of MHS imaging systems used under laboratory conditions that have demonstrated their high potential to convey valuable information regarding, for instance, fruit quality. It is worth mentioning the development of a hyperspectral insect damage detection algorithm in coffee, which can automatically detect insect-damaged beans using only a few bands and one spectral signature [70]. The demonstration of the feasibility of using these imaging techniques to rapidly measure pectin polysaccharides in intact mulberry fruits is also of significance [72]. Furthermore, their utility for high-throughput phenotyping of plant chemical traits was also established for maize and soybean plants in a greenhouse exposed to varying levels of either water deficit and nutritional stress [7]. Regardless of all the apparent advantages and the numerous reports on their application, there are a few drawbacks that might limit the future extensive use of MHS imaging systems [12,33]. These include: (i) their high cost, this being particularly critical in automated grading machines that usually include various sorter lines, each of them must include a separate sensor system; (ii) the slower MHS image acquisition in comparison to other cameras; (iii) the warranted extensive investigation on the acquisition and image processing software; and (iv) the necessary step towards the development of more user-friendly spectral acquisition and results in access by the non-expert in the various fields of plant sciences, particularly those related to agriculture. Still, based on the last decade’s trend, vendors seem consensual regarding the continuous cost drop in this technology despite their expected upgrade [33]. This outcome is based on the development of more powerful and comprehensive machine learning techniques dealing with big data, such as deep learning, as well as to their storage and management using the state-of-the-art Blockchain approach [74]. Overall, both vendors and researchers firmly believe that the MHS systems will be able to perform the effective sorting of various grades of horticultural produce, as well as to contribute to their traceability and safety across the supply chain, a pressing issue in the agro-food sector [75,76,77]. Utterly, this would lead to a reduced cost/benefit ratio for both producers and packinghouses, relying on a limited number of employees for quality inspection, and guaranteeing the best quality and the highest market prices for their commodities, while reducing food loss [37].
For the time being, however, the majority of both experimental studies and practical applications, at least on Vis-NIRS, involve spectral “point” measuring systems instead of MHS imaging. They have been used to assess several plant and fruit quality attributes, disorders and pathologies [10,11,54,78,79,80]. They have also been incorporated in many commercial applications to be used on inline, benchtop and handheld devices, which similarly to the MHS imaging systems, may benefit from the non-linear techniques of machine and deep learning to obtain the best calibration models. However, there are several issues regarding the full potential and limitations of this technology that require further attention and research to provide the robustness and accuracy warranted by researchers when acquiring information on the composition and structure of plant tissues and by the daily basis assessment routines in various crops supply chains. First of all, and despite the many recommendations [31,81], the calibration models’ robustness still needs to be accounted for and solved through stringent multi-year, multi-cultivar and multi-orchard validations, such as previously reported for mango and orange [56,57]. This is of the utmost importance when considering the assessment of fruit ripening on-tree across different plots of an orchard or in different orchards and essential to depart from the “proof of concept” approach and embrace the real-life conditions. Secondly, there is the effect of the rind in the assessment of the pulp quality attributes in thick rind fruit, since the NIR radiation hardly reaches the fruit pulp and both biochemical and optical properties have a major role to play in the spectral data acquired [1,59,60,61,70,72]. Thirdly, in spite of the different spectral ranges, levels of accuracy and cost-effective portable devices, only a few have been effectively used on-tree to assess fruit quality and ripening, for there are many conditions such as light and temperature that diminish the devices performance and deteriorate the calibration models predictions, as observed for citrus [10,11,66,82,83,84,85]. Finally, it is very important to add that these devices are of medium and high cost and that they are not the kind of technology to “set and forget”, as reiterated by [11]. This warrants not only for a budget to acquire the systems but also to maintain them and to keep the continuous update and improvement of the calibration models, which in most cases need the selling company’s assistance. Overall, producers and packinghouses must be able to add commercial value to crops supply chains through these systems and direct the consumer willingness to pay for the fresh commodities graded in terms of IQA such as sugar content, acidity and nutraceutical properties.
Both SRS and TRS have been shown to be valuable tools in the sorting of both fruit and vegetables based on the assessment of their quality attributes, external and internal defects caused by several disorders and pathologies, and the identification of contaminants [26,36,40]. However, compared to SRS, TRS is considered to be more accurate in measuring optical properties and able to reach larger depths in tissues. This turned TRS into a smart sorting tool regarding the non-destructive assessment of IQA and disorders of various fruit [26,40,41]. However, TRS is also expensive and complex, even for a portable TRS device, starting on the requirement of good contact between the detection probe and the sample during the measurement, which may introduce some difficulties when working with intact fruit and plants with curved or irregular shape. Similarly, to all other spectroscopic techniques, computation of the optical parameters from the SRS and TRS measurements usually requires sophisticated numerical methods to access all the physiological information from the spectral data acquired, which presents a major drawback, based on the substantial computational time needed. Lu et al. [26] presented a comprehensive review on some potential solutions that would significantly benefit and upgrade the analytic process, such as to build a library of simulated SRS profiles or the use of databased models, such as metamodels.
For airborne methods, the real breakthrough came with the advent of UAVs capable of carrying spectral cameras, which has dramatically reduced the cost and complexity of data collection [28]. Airborne multispectral surveillance has become affordable for organizations of any profile and size; the turn-key integrated systems with automation of flight control and georeferencing eliminate the need to hire expensive specialists [49]. As to the satellite-borne surveillance, since the early Landsat missions, the set of satellites has grown into an impressive constellation, with the tendency of harnessing each time more precise, sensitive instruments with an increasing number of spectral channels [50,51].
Overall, for all sensors systems described above, the ultimate breakthrough is linked with today’s explosive development of advanced and powerful machine learning methods of data processing, harnessing big data to infer critical information, such as, the classic partial least squares (PLS), support vector machines, artificial neural networks, classification techniques, deep learning, and other artificial intelligence (AI) approaches [60,65,68,70,81,86,87,88,89]. This opens a number of novel perspectives in the assessment and classification, beyond the state-of-the-art, whose current landmarks can be represented by the following examples: the automated identification and classification of Chinese medicinal plants with different sensing techniques, including Vis-NIRS [90]; the prediction of quality attributes and internal browning disorder in “Rocha” pear by Vis-NIRS reflectance and semi-transmittance spectra taken under real-life conditions met in an automated inline grading system [79,80,91]; the assessment of citrus ripening on-tree [83]; the in situ grapevine identification (down to the level of varieties) via leaf reflectance spectra [92]; the anthocyanins fingerprinting in intact grape berries [93]; the detection of mercury induced stress in tobacco plants [94]. Additionally, it is worth mentioning the use of specific algorithms, as the hyperspectral insect damage detection algorithm (HIDDA), which allowed automatic detection of insect-damaged coffee beans using only a few bands and one hyperspectral signature [70]; or the RELIEF-F algorithm used to select the most discriminative features (wavelengths) and two band normalized differences for developing spectral disease indices for SCR detection and severity classification [65].

4.2. Other Methods

Despite the impressive progress in processing multispectral images, which made it possible to indirectly assess a plethora of ecosystem parameters and provided valuable applications in agriculture, the elastic spectroscopy alone is not capable of providing adequate technical solutions to many topical problems of plant sciences. By its nature, the spectra of elastically scattered light—photons that underwent rather simple and relatively weak interaction with matter—lack information about the biological sample state and composition. On frequent occasions, such a lack “cannot be remedied by any mathematical trickery” [95], and more complex optical phenomena must be brought into the scene to provide the required data reliability.
The introduction of new and improved Raman devices that simplify data collection, along with the possibility of conducting analyses without the need for prior labeling and complicated sample preparation, has turned this spectroscopic technique into a reliable “solution” for some of the limitations met by the elastic spectroscopy [45]. Raman produces specific spectral fingerprints, allowing the non-destructive detection and quantitation of several key compounds, which makes it a powerful tool in the monitoring of the physiological status of plants, the assessment of fruit quality, pathologies and ripening [1,45,73,96,97,98]. In fact, Raman is another optical spectroscopic technique claimed by precision agriculture, which has the potential for significantly improving the capacity of farming management, quality assessment, detection of biological and/or chemical contamination, contributing to food safety, productivity, and profitability.
Similar to other spectroscopic techniques, the information extraction from the spectra acquired from plant tissues requires the use of various machine learning techniques and the mandatory access to spectral databases comprising the standards for the identification of every fingerprint acquired [45,97,99]. These spectral libraries, which are becoming more comprehensive and extensive by the day, allow the interpretation of the collected tissues fingerprints in terms of the plant physiological status, the stress factor involved, the fruit ripening stages, and the detection of pathologies and/or disorders.
Raman spectroscopy has further been used in the development of high-throughput phenotyping of plants under biotic and abiotic stress [98,100]. The latter was demonstrated for Coleus (Plectranthus scutellarioides) subjected to various abiotic stress conditions [101]. This technique was also used to determine the nitrogen status in Arabidopsis thaliana and two varieties of leafy vegetable crops, namely, Pak Choi (Brassica rapa var. chinensis) and Choy Sum (Brassica rapa var. parachinensis), under different nitrogen soil concentrations [96]. A specific spectral signature was identified for the plant nitrogen status, which can be used in the early diagnosis of its deficiency in plants before the onset of any visible symptoms. Handheld Raman spectrometers that allow a form of laser-induced biochemical fingerprinting of living plants, yield precise access to the plants’ physiological responses under field conditions [97] by both farmers and plant researchers. This was demonstrated in a study by [101], where a portable leaf-clip Raman sensor was once again successfully used for the early diagnosis of nitrogen deficiency in Brassica spp.
Relative success has been achieved when applying Raman in the quantitation of various compounds, such as pigments and SSC of various fruits and vegetables, namely, tomato, mango, and kiwifruit; the bruise identification on apples; and the detection of heavy metals contamination in rice, wheat and corn grain [1,73,102]. Additionally, it has further been used in the non-invasive assessment of lignin structure, its distribution and cellular level of dissociation, which along with cellulose, is the only non-fossil natural resource providing renewable aryl compounds [103].
Nevertheless, Raman is still a very costly technique, and its application under real-life conditions warrants further research and new approaches that allow its upgrade from a “proof of concept” to their integration in plant sciences and agriculture in field-grown crops. This warrants the use of advanced analytical tools, such as the Internet of things (IoT), the incorporation of AI techniques to evaluate the spectral data acquired and assure calibration models with enough accuracy, and robustness to withstand all the biological variability met across various species, environmental conditions, farming sites and seasons [73,97]. Then, all data produced by this analysis must be translated into meaningful and user-friendly information for plant science researchers, producers and packinghouses dealing with the crop supply chains. Although Raman spectroscopy has been successfully tested for remote sensing of some materials, such as minerals [104,105], its use regarding plant systems has not yet been established.
As far as botany focuses on spectroscopy of complicated organic molecules, the wavelength-shifting light–matter interactions manifest themselves in wide spectral intervals as fluorescence. Here, the lower reflection efficiency (with respect to the linear photon scattering process) is compensated in part by the fact that several characteristic substances, predominantly pigments and proteins, presented in plants have a high quantum yield of the fluorescence emission. Of these, the most prominent is chlorophyll, which provides information-rich and characteristic peaks in the visible and infrared spectral ranges. With the advent of the laser, capable of irradiating the sample by extremely bright light, laser-induced fluorescence (LIF) has become one of the most popular methods of spectroscopic studies.
The present achievements of LIF include very reliable and non-destructive in vivo assessment of drought stress in natural and genetically modified plants [106,107,108]; quite selective characterization of the algae intoxication by a wide range of contaminants, such as Co, Cd, Cr, Cu, Ni, Hg, Pb, and Zn [108,109,110,111], as well as the detection and characterization of photosynthetic biofilms [49,58,112]. All of them are predominantly connected with the particular fluorescence signature of in vivo chlorophyll obtained for a given laser wavelength. In most cases, the LIF setup is built around a cheap and robust frequency-doubled Q-switched Nd:YAG laser, generating at the 532 nm wavelength.
As in the previous cases, a significant part of the advances observed is related to modern numerical signal processing methods, including the AI tools for extracting features that are more complex than just the positions and amplitudes of characteristic fluorescence peaks. This AI approach also provides the opportunity to fuse heterogeneous data, that is, enhance the measurement, diagnosis, and classification techniques by applying several of them to the same sample and then combining sensory data such that the resulting information is more precise or reliable than would be possible if these techniques were used individually. A very illustrative and promising example of such an approach is using LIF as one of the data sources in high-throughput plant phenotyping [113,114]. In this application, several spectroscopic, imaging, and other methods can be successfully combined to monitor the performance of improved genotypes to increase the sustainability of agricultural production and to provide a more comprehensive understanding of the regional agricultural environments [114].
A significant breakthrough in this area, providing more reliable equipment and information-rich data, is the development of a fluorescence induction system in which the laser is replaced by a broad-spectrum lamp. The resulting sensor uses two monochromators and a wide-range PMT detector. Its internal microprocessor performs a consistent scan of the excitation (λex) and emission (λem) wavelengths, providing the fluorescence spectrum as a 3D intensity plot (surface) in 2D spectral coordinates λex, λem, whose discrete representation is known as the spectral fluorescence signature (SFS) [114,115] or excitation-emission matrix (EEM) [116]. The latter term is mostly associated with high-resolution spectra obtained with costly stationary laboratory equipment for identification and characterization in mixture analysis, see, e.g., [117]. In contrast, contemporary SFS spectrometry is associated with low-cost, small-size and portable instrumentation capable of working for hours in the field using an internal battery, without any supporting infrastructure [49]. These features have shaped a trend in the future development of 3D spectral scanning, based on increasingly cheaper, autonomous, and user-friendly instruments.
All of the above developments were made possible by recent impressive advances in microelectronics and engineering of light-sensitive materials and dispersive optical elements. These same advances have led to another remarkable breakthrough—in the field of passive fluorescence spectroscopy, which studies the fluorescence emission excited by sunlight and uses its spectrum as a data source for deriving numerous vegetation indicators related, among others, to the fluorescence-photosynthesis relationships and stress effects. Before the late 1990s, the solar-induced fluorescence (SIF) technology was limited in its ability to provide conclusive evidence that a very weak upwelling fluorescence emission induced by natural light could be reliably distinguished from the dominant reflected radiation in the same waveband [118]. Early conclusive measurements of SIF relied on the Fraunhofer line-depth principle (FLDP), which is based on the upwelling vegetation emission measurements in the spectral ranges corresponding to absorption lines (minimums) of solar radiation [119]. Remarkably, nowadays numerous efforts of scientists and engineers, stimulated by the revealed close relationship between SIF and the actual plant photosynthetic rate, have resulted in a plethora of reliable SIF assessment methods that bring together state-of-the-art spectrometers as well as innovative signal processing, calibration techniques and modeling [120]—to exclude the influence of numerous intervening processes in the vegetation and environment that affect quenching, light absorption, re-absorption and scattering of fluorescence signals [118]. The SIF methodologies have gone far beyond on-the-spot measurements, embracing dedicated spaceborne instruments [121,122] and affordable airborne measurements using UAVs [122,123].

5. Emerging Technologies for Portable Spectroscopy

The massive adoption of portable spectrometers, observed in the last twenty years, was achieved thanks to small spectrometers with USB connection, which allowed the instruments to be reduced to the size of a cards deck. These spectrometers reproduce, on a small scale, the optics of bench instruments and generally include mirrors for collimation and focusing, a diffraction grating and an array sensor, usually a charge couple device (CCD) or a complementary metal oxide semiconductor (CMOS). This geometry, however, needs some spacing to allow the light to separate properly, which places limits on miniaturization. On the other hand, the quantity of optical components required also limits the price, and a high-quality array sensor weighs heavily on the final cost of the spectrometer.
In recent years, the miniaturization of spectrometers has continued to advance towards reducing size and weight. New technological approaches played a crucial role, which allowed to overcome the limitations mentioned above. Thus, there are currently available alternatives for light separation that eliminate the need for a diffraction grating, saving space. On the other hand, there are also alternative schemes that use just a simple photodiode instead of a CMOS array, lowering the price of the spectrometer. There are still alternatives that combine the two advantages. Obviously, this simplification does not come without a compromise in terms of quality, signal-to-noise ratio and sensitivity, which will be explored further below.
Figure 2 shows the fundamental concepts associated with the main emerging technologies. It is important to note that these are simplified schemes. In all cases, components are omitted, so that the figure retains only the fundamental process associated with each technique. In Figure 2a the conventional setup is shown. At its core, there is a diffraction grating (2) and an array sensor (3). Light is dispersed by the grating and focused on the sensor array (focusing optics not represented). Each sensor pixel receives light in a narrow band determined by the entrance slit (1), the grating characteristics and geometrical factors through appropriate algorithms. However, this approach does not offer the best spectral resolution. The SCiO spectrometer (Israel, www.consumerphysics.com/scio-for-consumers/; accessed on 10 October 2021) uses this type of technology, working in the range 740–1070 nm.
In Figure 2b, a filter array (5) upon a CMOS photographic sensor (4) is one of the conceptually simpler approaches to obtain a spectrum from non-dispersive elements. The filter array may be composed of Fabry–Pérot elements with tailored characteristics. Knowing the transmission curve of each filter allows retrieving more bands than the number of filters. In Figure 2c, a linear variable filter (LFV) (6), which is a wedged filter, and whose spectral properties vary linearly, allows to separate light as a function of the position. An array sensor (3) placed immediately after the filter acquires the spectral information. This technique offers the advantage of a higher light throughput, while offering at the same time a compact arrangement. The MicroNIR spectrometer (Viavi, San Jose, CA, USA, www.viavisolutions.com/en-us/osp/products/micronir-spectrometers; accessed on 10 October 2021) is based in this solution, with a resolution of 6 nm in the range 900–1700 nm.
In Figure 2d, a digital micromirror device (DMD) (7) is at the core of the system. It receives light already sent through a slit (1) and separated in a diffraction grating (2) and redirects it into a single photodiode (8). The DMD consists of hundreds or thousands of micromirrors acted on by coupled micro-electro-mechanical systems (MEMS). The purpose of the DMD is to implement an Hadamard spectrometer, which is a multiplex device that observes more than one wavelength at a time using (Hadamard) masks. In practice, this means that the DMD focuses successively on the different combinations of spectral bands emerging from the diffraction grating of the photodiode. Knowing the distribution of the bands in each combination (mask), it is possible to invert the data in order to resolve the spectrum. The DLP NIRscan (Texas Instruments, Sherman, TX, USA, https://www.ti.com/tool/DLPNIRSCANEVM; accessed on 10 October 2021) is based on this solution. It offers a resolution of 10 nm in a spectral range of 900–1700 nm. Replacing the array sensor with a single photodiode, the DMD-based spectrometer has a lower cost while yielding a good signal-to-noise ratio. In Figure 2e light selection is performed through a Fabry–Pérot interferometer or etalon (9), which is an optical cavity made from two parallel reflecting surfaces. Light bounces back and forth, creating a superposition of waves that is destructive for all wavelengths, except for those resonant with the cavity, that is, when the etalon spacing is a half integer of the wavelength. The resonant wavelengths are transmitted, while the others are strongly attenuated. Tuning the filtered wavelength is just a matter of changing the etalon spacing. In this case, this is achieved by coupling one of the mirrors to a MEMS. A photodiode (8) aligned with the optical axis of the etalon performs the light detection in synchrony with the MEMS cycle, in a scan that originates the full spectrum. Etalon spectrometers such as the NIRONE (Spectral Engines, Helsinki, Finland, https://www.spectralengines.com/; accessed on 10 October 2021) or the MEMS-FPI (Hamamatsu, Japan, https://www.hamamatsu.com/eu/en/product/optical-sensors/spectrometers/mems-fpi-spectrum-sensor/index.html; accessed on 10 October 2021) are based on this principle. They feature a good throughput and signal-to-noise ratio at an affordable price. However, they have relatively narrow spectral ranges (typically 300 nm).
In Figure 2f, the principle of measurement is that of Fourier Transform Infrared Spectroscopy (FTIR) [124]. It uses a MEMS-based Michelson interferometer, and it is constituted by a fixed mirror (10), beam-splitter (12), photodiode (8) and movable mirror (11). The novelty is that the movable mirror is acted on by a MEMS and all the optics are implemented in a small wafer. This technology allows bringing the power of FTIR to portable applications. In principle, they benefit also from the so-called Jacquinot’s advantage. This concept is usually mentioned in the context of comparing FTIR spectroscopy and conventional dispersive spectroscopy. To understand it, it is necessary to remember that the spectral resolution in a dispersive spectrometer depends inversely on the width of the input slit. Thus, to obtain a high resolution, it is necessary to use a very narrow slit, which limits the amount of light that enters the device and, ultimately, the signal-to-noise ratio. There is, therefore, a tradeoff between the resolution and the signal-to-noise ratio in a dispersive spectrometer. This tradeoff does not apply to an FTIR spectrometer, as the resolution does not depend on the size of the input aperture, and it is this fact that constitutes the Jacquinot’s advantage. In fact, it is not just the system in Figure 2f that displays the Jacquinot’s advantage. Systems depicted in Figure 2b,c,e also have it, as they do not need an input slit.
Another important concept in comparing spectrometers is the Fellgett’s advantage [125]. This advantage comes from multiplexing the measurement, that is, the simultaneous measurement of several wavelengths by the same detector. For example, in FTIR spectroscopy, all wavelengths are measured simultaneously in the detector for each position of the moving mirror. This is the extreme example of multiplexing, encompassing all wavelengths. In system (d), with DMDs, there is also multiplexing, as it is a Hadamard spectrometer, as explained above. Multiplexed measurements allow the reduction in the signal-to-noise ratio by a factor √N, where N is the number of elements sampled in the spectrum [125]. On the other hand, classic dispersive spectrometers do not have this advantage because each of the detectors (pixels) receives only one wavelength at a time. However, Fellgett’ s advantage also entails a disadvantage. As all wavelengths are processed simultaneously to obtain the spectrum, noise limited to one of the spectral components ends up being spread across the entire spectrum. This disadvantage is important if, for some reason, there is a particularly noisy spectral component. The systems in Figure 2d,f benefit from Fellgett´s advantage. A summary of the main spectrometers characteristics previously described is presented in Table 1.
The advantages described above are, however, not decisive when choosing these new devices. The sensitivity of the detectors employed and the geometric factors associated with light coupling are also of critical importance for the overall behavior of these systems. The interest and potential of the new spectrometers are quite clear. Their more affordable price, higher portability and the possibility to operate the equipment wirelessly are the characteristics necessary to implement spectroscopic networks in the context of IoT. We are, therefore, at the dawn of a new age, in which spectroscopic sensors can be used on a large scale. This intensive use can be the result of its operation by a large number of users or its autonomous integration into the IoT, remotely and automatically. In either case, the issue of managing and analyzing large amounts of data will be raised in the context of what is called big data.
With the new spectrometers, it will be possible to infer in real-time the evolution of spectral characteristics of leaves or fruit on-tree, orchards, forests and also in indoor environments, such as greenhouses or cold storage chambers. The evolution of these spectral characteristics, by itself, may be enough to infer the physiological states of plants and fruit. However, the spectral data acquired may also feed calibration models based on classical chemometric methods or on the recent deep learning methods to predict physiological parameters. The management of information from the end user’s point of view may involve the use of a second layer of analysis to make averages, interpolations and spatio-temporal forecasts.
It is not the purpose of this article to review all works in the field, but the following short list below offers the reader a brief overview of the work that has already been performed with these emerging devices. These are mainly comparative studies with classic dispersive spectrometers, including benchtop instruments. In general, the conclusion reached by these investigations is that the new spectrometers have a performance only slightly inferior to that of bench instruments. There are, however, some cases where the performance of the new spectrometers is considerably lower than that of the reference instruments and also other cases where the performances are perfectly equivalent. It is also necessary to bear in mind that these studies are essentially proof of concept, not demonstrations of model robustness, as there are, in general, no studies with data from several years and different sources. This type of prolonged study is yet to be performed. Finally, the articles presented do not yet illustrate the integration of the new spectrometers into a true IoT philosophy, which will probably be observed in the coming years.
Thus, a setup of AS7265x multispectral sensors (AMS, Premstaetten, Austria; b-type in Figure 2 and Table 1) has been compared with an Ocean Optics USB2000+ (Ocean Insight, Orlando, USA) dispersive spectrometer (classical a-type in Figure 2 and Table 1) for the assessment of SSC in apples [126]. The two pieces of equipment delivered similar performance. In another study [127], a NIRONE (Spectral Engines, Finland), which is an e-type spectrometer (MEMS-based Fabry-Pérot; Figure 2, Table 1), was compared with a hyperspectral imaging system (DV Optics, Padova, Italy) to predict the QA of treated ground peppercorns. Again, the new spectrometer performed as well or better than the classical counterpart. In the same way, a SCiO spectrometer (consumer physics, Tel Aviv, Israel; b-type; Figure 2, Table 1) was compared with a reference bench spectrometer, a NIRFlex (Büchi, Flawil, Switzerland), in the context of cheese analysis. Although the NIRFlex delivered slightly better results, the SCiO produced equally good models [128]. The investigation by [129] represents one of the most comprehensive comparisons made so far, involving two dispersive instruments, the LabSpec4 (ASD, Boulder, CO, USA) and the F750 (Felix Instrument Inc., Camas, WA, USA), two digital micromirror devices of d-type, the NIRscan Nano (Texas instruments Inc., Sherman, TX, USA), and the TellSpec (Tellspec Inc., Toronto, Ontario, Canada), a two linear variable filter device of c-type, the MicroNIR1700 and MicroNIR2200 (Viavi Solution, Milpitas, CA, USA), a MEMS-triggered Fabry–Pérot of e-type (NIRONE 2.2) and a filter array device of b-type (SCiO) (Figure 2, Table 1). The comparison was performed regarding the determination of sugarcane properties (total sugar and crude protein content). The results were given through cross-validation, which is of limited interest in evaluating the true performance of the devices under real conditions but which nevertheless provides a relative measure of their performance. The LabSpec delivered the best results for both parameters, which demonstrates that high-grade classical dispersive instruments are still the best choice. The F750 did not deliver such good results probably because of the limited wavelength range compared to the LabSpec 4. Globally, the MicroNIR devices were the ones matching more closely the performance of LabSpec 4. For total sugars, all the other devices yielded a prediction error 2 to 3 times higher, while for crude protein, all the tested devices delivered comparable errors, except for the digital micromirror devices (NIRscan Nano and TellSpec), which produced prediction errors clearly above the others.

6. Conclusions

Fostering the progress in plant sciences is undoubtedly a strategic goal for the forthcoming decades in order to comply with the increasing demand for agricultural products, fueled by a growing world population. Numerous biotic and abiotic environmental stresses impair crop productivity and lead to significant losses in agricultural yield worldwide. Additionally, many strains caused by global warming and human-intensive use of natural resources on the various ecosystems across the planet have already had a clear negative impact on the biodiversity of many species, starting with plants. Against this backdrop, there has been an increasing demand for more and high-throughput phenotyping on the plants’ physiological responses and regulatory mechanisms under unfavorable conditions, which will allow early and effective intervention to avoid crop loss. Furthermore, the agro-food industry warrants new and smart tools that allow sustainable agriculture practices and smart management to produce crops with higher yield and quality required by the highly demanding markets and consumers and significantly reduce the current food loss.
Numerous spectroscopic techniques, used in situ or remotely, have been proved to comply with these requests, and seem to become more and more helpful towards the major challenges comprised in plant sciences fundamental and applied research, as well as in various applications already claimed by precision agriculture. They have already granted the development of effective tools capable of studying plant physiology and reporting stress events, and provided many devices used in the management of various crops supply chains. However, there is still much to investigate regarding these systems’ accuracy and robustness and their resulting cost-benefit to make their access by end users easier and to grant significant advances in high-throughput phenomics. The latter need to occur across scales of phenotyping platforms to sustain and improve crop yields from greenhouses to natural settings, accounting for the unavoidable constraining imposed by seasonal growing conditions.
There is also space for the combination of some of these techniques, as well as with others of electronic nature in a sensors-fusion approach, that can reach farther and provide more insight into plant structure, responses and behavior under various conditions. In some cases, the improvement of the current spectroscopic techniques, aside from their reliance on more powerful and effective data analysis techniques, may further depend on the signal amplification emitted by plant structures and pathways through the inclusion in situ nanosensors, such as fluorescence or carbon dots that provide specific spectral signatures and can be monitored in real-time, even remotely, and allow, for instance, the field-based phenotyping platforms to collect high-throughput trait measurements over large areas.
Satellite imaging can detect pests, diseases, and weed infestations on a larger scale with less complexity, but the frequency of data updates and cost to retrieve them is still a bottleneck. The major challenges with drones are the reliability issues and accuracy of the mosaic image. Now, they comprise sophisticated software for auto flight and automatic image stitching of the whole field and reasonably low-cost, which will, in the near future, help new researchers to explore more drone-based multi-view stereopsis (MVS) methods in agriculture. The spectral response of the remote sensing data can be affected by variable soil backgrounds and residue covers, which will affect the detection accuracy, and more attention must be given to this issue. Widespread commercialization of MVS in agriculture is possible only with robust, low-cost, automated, unified detection systems (pest, weed, and diseases). The future research focus must be on MVS capable of detecting all yield affecting factors of a particular crop. A multi-crop detection variant is preferable since farmers use the same field for different crops in different seasons in a year.
IoT can be exploited in agriculture for the real-time automatic pest detection. Its price can be reduced by using low-cost programmable hardware (Arduino, Raspberry Pi, BeagleBone, and so forth) with open software connected to cloud servers (Amazon web services, Microsoft Azure, Google Cloud and others) for processing the image information to detect stress and alerting the farmer to take action at a particular geo-location. The new types of miniaturized spectrometers will allow for simpler integration with IoT sensor networks.
In an optimistic vision of the future, it is possible to envisage that before the farmer awakens every morning, UAVs fitted with sophisticated cameras will take off and locate whether there are any crop health issues within the field. However, there are still many notable deficiencies related to the image sensor’s ability, platform dependability, and lack of standardized procedure. With the advancements in image processing methods, low-cost hardware and more research focus in this domain, precision agriculture is expected to highly benefit from these systems.
Overall, the analytical spectroscopic techniques highlighted here may be of the utmost importance in early stress detection in crops. However, to facilitate widespread adoption of these technologies in agriculture, their economic potential and reliability need to be validated to ensure that they remain affordable and more effective than the existing approaches.

Author Contributions

Conceptualization, A.M.C., A.B.U., J.M.d.S. and R.G.; methodology, A.M.C., A.B.U., J.M.d.S. and R.G.; resources, A.M.C., A.B.U., J.M.d.S. and R.G; writing—original draft preparation, A.M.C., A.B.U., J.M.d.S. and R.G.; writing—review and editing, A.M.C., A.B.U., J.M.d.S. and R.G.; visualization, A.M.C., A.B.U., J.M.d.S. and R.G.; supervision, A.M.C., A.B.U., J.M.d.S. and R.G; project administration, A.M.C., A.B.U., J.M.d.S. and R.G; funding acquisition, A.M.C., A.B.U., J.M.d.S. and R.G. All authors have read and agreed to the published version of the manuscript.

Funding

This research was funded by FCT—Fundação para a Ciência e a Tecnologia, Portugal, for funding the CEOT project UIDB/00631/2020 CEOT BASE and UIDP/28 00631/2020 CEOT PROGRAMATICO, research unit BioISI (UID/MULTI/04046/2019), and the R&D project INTERPHENO (PTDC/ASP-PLA/28726/2017).

Institutional Review Board Statement

Not Applicable.

Informed Consent Statement

Not Applicable.

Data Availability Statement

Not Applicable.

Acknowledgments

Ana M. Cavaco and Rui Guerra would like to acknowledge all their CEOT collaborators for their expertise, hard work, team spirit and contributions to the knowledge regarding the scope of this research topic over the past 14 years.

Conflicts of Interest

The authors declare no conflict of interest.

References

  1. Arendse, E.; Fawole, O.A.; Magwaza, L.S.; Opara, U.L. Non-destructive prediction of internal and external quality attributes of fruit with thick rind: A review. J. Food Eng. 2018, 217, 11–23. [Google Scholar] [CrossRef]
  2. Ali, M.M.; Bachik, N.A.; Muhadi, N.; Yusof, T.N.T.; Gomes, C. Non-destructive techniques of detecting plant diseases: A review. Physiol. Mol. Plant Pathol. 2019, 108. [Google Scholar] [CrossRef]
  3. Berauer, B.J.; Wilfahrt, P.A.; Reu, B.; Schuchardt, M.A.; Garcia-Franco, N.; Zistl-Schlingmann, M.; Dannenmann, M.; Kiese, R.; Kühnel, A.; Jentsch, A. Predicting forage quality of species-rich pasture grasslands using vis-NIRS to reveal effects of management intensity and climate change. Agric. Ecosyst. Environ. 2020, 296, 106929. [Google Scholar] [CrossRef]
  4. Payne, W.Z.; Kurouski, D. Raman-Based Diagnostics of Biotic and Abiotic Stresses in Plants. A Review. Front. Plant Sci. 2021, 11, 616672. [Google Scholar] [CrossRef]
  5. Fang, S.; Cui, R.; Wang, Y.; Zhao, Y.; Yu, K.; Jiang, A. Application of multiple spectral systems for the tree disease detection: A review. Appl. Spectrosc. Rev. 2021, 1–27. [Google Scholar] [CrossRef]
  6. Fahlgren, N.; Gehan, M.A.; Baxter, I. Lights, camera, action: High-throughput plant phenotyping is ready for a close-up. Curr. Opin. Plant Biol. 2015, 24, 93–99. [Google Scholar] [CrossRef] [PubMed] [Green Version]
  7. Pandey, P.; Ge, Y.; Stoerger, V.; Schnable, J.C. High Throughput In vivo Analysis of Plant Leaf Chemical Properties Using Hyperspectral Imaging. Front. Plant Sci. 2017, 8, 1348. [Google Scholar] [CrossRef] [Green Version]
  8. Mishra, P.; Asaari, M.S.M.; Herrero-Langreo, A.; Lohumi, S.; Diezma, B.; Scheunders, P. Close range hyperspectral imaging of plants: A review. Biosyst. Eng. 2017, 164, 49–67. [Google Scholar] [CrossRef]
  9. Huang, Y.; Ren, Z.; Li, D.; Liu, X. Phenotypic techniques and applications in fruit trees: A review. Plant Methods 2020, 16, 1–22. [Google Scholar] [CrossRef]
  10. Walsh, K.B.; Blasco, J.; Zude-Sasse, M.; Sun, X. Visible-NIR ‘point’ spectroscopy in postharvest fruit and vegetable assessment: The science behind three decades of commercial use. Postharvest Biol. Technol. 2020, 168, 111246. [Google Scholar] [CrossRef]
  11. Walsh, K.; McGlone, V.; Han, D. The uses of near infra-red spectroscopy in postharvest decision support: A review. Postharvest Biol. Technol. 2020, 163, 111139. [Google Scholar] [CrossRef]
  12. Arias, F.; de Panamá, E.D.U.T.; Zambrano, M.; Broce, K.; Medina, C.; Pacheco, H.; Nunez, Y.; Ciencias, I.Y.T.-A. Hyperspectral imaging for rice cultivation: Applications, methods and challenges. AIMS Agric. Food 2021, 6, 273–307. [Google Scholar] [CrossRef]
  13. Newton, I. Opticks: Or, A Treatise of the Reflections, Refractions, Inflexions and Colours of Light; Printed for Sam. Smith, and Benj. Wal-ford: London, UK, 1704; p. 458. [Google Scholar]
  14. Thomas, N.C. The early history of spectroscopy. J. Chem. Educ. 1991, 68. [Google Scholar] [CrossRef]
  15. Hopkinson, F.; Rittenhouse, D. An optical problem, proposed by Mr. Hopkinson, and solved by Mr. Rittenhouse. Trans. Am. Phil. Soc. 1786, 2, 201–206. [Google Scholar] [CrossRef]
  16. Von Fraunhofer, J. Neue Modifikation des Lichtes durch gegenseitige Einwirkung und Beugung der Strahlen, und Gesetze derselben (New modification of light by the mutual influence and the diffraction of [light] rays, and the laws thereof). Denkschr. Königlichen Akad. Wiss. Zu München (Mem. R. Acad. Sci. Munich) 1821, 8, 3–76. [Google Scholar]
  17. Wollaston, W.H. A Method of examining refractive and dispersive powers, by prismatic reflection. Philos. Trans. R. Soc. Lond. 1802, 92, 365–380. [Google Scholar]
  18. Fraunhofer, J. Bestimmung des Brechungs- und des Farben-Zerstreuungs—Vermögens verschiedener Glasarten, in Bezug auf die Vervollkommnung achromatischer Fernröhre (Determination of the refractive and color-dispersing power of different types of glass, in relation to the improvement of achromatic telescopes). Annal. Phys. 1817, 56, 264–313. [Google Scholar]
  19. Ångström, A.J. Recherches sur le Spectre Solaire; W. Schultz: Uppsala, Sweden, 1868; p. 78. [Google Scholar]
  20. Masters, B.R. A Brief History of Spectral Analysis and Astrospectroscopy. Opt. Photon- News 2009, 20, 34–39. [Google Scholar] [CrossRef]
  21. Kirchhoff; Bunsen. XXIV. On chemical analysis by spectrum-observations. Q. J. Chem. Soc. 1861, 13, 270–289. [Google Scholar] [CrossRef]
  22. Mark, H.; Bradley, M.S. Review of New Spectroscopic Instrumentation. Spectroscopy 2021, 36, 28–47. Available online: https://www.spectroscopyonline.com/view/2021-review-of-new-spectroscopic-instrumentation (accessed on 5 October 2021).
  23. What Is Dynamic Mechanical Analysis (DMA)? Available online: https://coventivecomposites.com/explainers/dynamic-mechanical-analysis-dma/ (accessed on 27 December 2020).
  24. Tuchin, V.V. Tissue Optics and Photonics: Light-Tissue Interaction. J. Biomed. Photon- Eng. 2015, 1, 98–134. [Google Scholar] [CrossRef]
  25. Skoog, D.A.; Holler, F.J.; Crouch, S.R. Principles of Instrumental Analysis; Thomson Brooks/Cole Publishing: Pacific Grove, CA, USA, 2007; p. 1039. [Google Scholar]
  26. Lu, R.; Van Beers, R.; Saeys, W.; Li, C.; Cen, H. Measurement of optical properties of fruits and vegetables: A review. Postharvest Biol. Technol. 2019, 159, 111003. [Google Scholar] [CrossRef]
  27. Multispectral vs Hyperspectral Imagery Explained. Available online: https://gisgeography.com/multispectral-vs-hyperspectral-imagery-explained/ (accessed on 27 December 2020).
  28. Sankaran, S.; Khot, L.R.; Espinoza, C.Z.; Jarolmasjed, S.; Sathuvalli, V.R.; VanDeMark, G.J.; Miklas, P.N.; Carter, A.H.; Pumphrey, M.O.; Knowles, N.R.; et al. Low-altitude, high-resolution aerial imaging systems for row and field crop phenotyping: A review. Eur. J. Agron. 2015, 70, 112–123. [Google Scholar] [CrossRef]
  29. Oerke, E.-C. Remote Sensing of Diseases. Annu. Rev. Phytopathol. 2020, 58, 225–252. [Google Scholar] [CrossRef] [PubMed]
  30. Cozzolino, D.; Roberts, J. Applications and Developments on the Use of Vibrational Spectroscopy Imaging for the Analysis, Monitoring and Characterisation of Crops and Plants. Molecules 2016, 21, 755. [Google Scholar] [CrossRef] [PubMed] [Green Version]
  31. Nicolaï, B.M.; Beullens, K.; Bobelyn, E.; Peirs, A.; Saeys, W.; Theron, K.I.; Lammertyn, J. Nondestructive measurement of fruit and vegetable quality by means of NIR spectroscopy: A review. Postharvest Biol. Technol. 2007, 46, 99–118. [Google Scholar] [CrossRef]
  32. Cattaneo, T.M.P.; Stellari, A. Review: NIR Spectroscopy as a Suitable Tool for the Investigation of the Horticultural Field. Agronomy 2019, 9, 503. [Google Scholar] [CrossRef] [Green Version]
  33. Cavaco, A.M.; Passos, D.; Pires, R.M.; Antunes, M.A.; Guerra, R. Nondestructive Assessment of Citrus Fruit Quality and Ripening by Visible–Near Infrared Reflectance Spectroscopy. In Citrus—Research, Development and Biotechnology [Working Title]; Sarwar Khan, M.S., Khan, I., Eds.; IntechOpen Limited: London, UK, 2021; ISBN 978-1-83968-723-5. [Google Scholar] [CrossRef]
  34. Hogan, H. The Food Industry’s Appetite for Hyperspectral Imaging Grows. Photonics Spectra 2021, 38–41. Available online: https://www.photonics.com/ (accessed on 1 June 2021).
  35. Qin, J.; Lu, R. Measurement of the optical properties of fruits and vegetables using spatially resolved hyperspectral diffuse reflectance imaging technique. Postharvest Biol. Technol. 2008, 49, 355–365. [Google Scholar] [CrossRef]
  36. Lu, Y.; Huang, Y.; Lu, R. Innovative Hyperspectral Imaging-Based Techniques for Quality Evaluation of Fruits and Vegetables: A Review. Appl. Sci. 2017, 7, 189. [Google Scholar] [CrossRef]
  37. Reynolds, L.; Johnson, C.; Ishimaru, A. Diffuse reflectance from a finite blood medium: Applications to the modeling of fiber optic catheters. Appl. Opt. 1976, 15, 2059–2067. [Google Scholar] [CrossRef] [PubMed]
  38. Langerholc, J. Beam broadening in dense scattering media. Appl. Opt. 1982, 21, 1593–1598. [Google Scholar] [CrossRef] [PubMed]
  39. Marquet, P.; Bevilacqua, F.; Depeursinge, C.; Dehaller, E.B. Determination of reduced scattering and absorption-coefficients by a single charge-coupled-device array measurement. 1. comparison between experiments and simulations. Opt. Eng. 1995, 34, 2055–2063. [Google Scholar] [CrossRef]
  40. Torricelli, A.; Contini, D.; Dalla Mora, A.; Martinenghi, E.; Tamborini, D.; Villa, F.; Tosi, A.; Spinelli, L. Recent advances in time-resolved nir spectroscopy for nondestructive assessment of fruit quality. Chem. Eng. Trans. 2015, 44, 43–48. [Google Scholar] [CrossRef]
  41. Rizzolo, A.; Vanoli, M. Time-resolved technique for measuring optical properties and quality of food. In Light Scattering Technology for Food Property, Quality and Safety Assessment; Lu, R., Ed.; CRC Press: Boca Raton, FL, USA, 2016; pp. 187–224. [Google Scholar]
  42. Pifferi, A.; Taroni, P.; Torricelli, A.; Messina, F.; Cubeddu, R.; Danesini, G. Four-wavelength time-resolved optical mammography in the 680-980-nm range. Opt. Lett. 2003, 28, 1138–1140. [Google Scholar] [CrossRef]
  43. Raman, C.V.; Krishnan, K.S. A New Type of Secondary Radiation. Nature 1928, 121, 501–502. [Google Scholar] [CrossRef]
  44. Clarke, R.J.; Oprysa, A. Fluorescence and light scattering. J. Chem. Educ. 2004, 81, 705–707. [Google Scholar] [CrossRef]
  45. Saletnik, A.; Saletnik, B.; Puchalski, C. Overview of Popular Techniques of Raman Spectroscopy and Their Potential in the Study of Plant Tissues. Molecules 2021, 26, 1537. [Google Scholar] [CrossRef]
  46. Yu, X.L.; Hoff, L.E.; Reed, I.S.; Chen, A.M.; Stotts, L.B. Automatic target detection and recognition in multiband imagery: A uni-fied ml detection and estimation approach. IEEE Trans. Image Process. 1997, 6, 143–156. [Google Scholar]
  47. Galvao, L.; Formaggio, A.R.; Tisot, D.A. Discrimination of sugarcane varieties in Southeastern Brazil with EO-1 Hyperion data. Remote Sens. Environ. 2005, 94, 523–534. [Google Scholar] [CrossRef]
  48. Teke, M.; Deveci, H.S.; Haliloglu, O.; Gurbuz, S.Z.; Sakarya, U. A short survey of hyperspectral remote sensing applications in agriculture. In Proceedings of the 2013 6th International Conference on Recent Advances in Space Technologies (RAST), Istanbul, Turkey, 12–14 June 2013; pp. 171–176. [Google Scholar]
  49. Resta, V.; Utkin, A.B.; Neto, F.M.; Patrikakis, C.Z. Cultural Heritage Resilience Against Climate Change and Natural Hazards; Pisa University Press: Pisa, Italy, 2019; p. 294. [Google Scholar]
  50. Transon, J.; D’Andrimont, R.; Maugnard, A.; Defourny, P. Survey of Hyperspectral Earth Observation Applications from Space in the Sentinel-2 Context. Remote Sens. 2018, 10, 157. [Google Scholar] [CrossRef] [Green Version]
  51. Tatem, A.; Goetz, S.; Hay, S. Fifty Years of Earth-Observation Satellites. American Scientist. Available online: https://www.americanscientist.org/article/fifty-years-of-earth-observation-satellites (accessed on 17 October 2021).
  52. Costa, J.M.; Marques da Silva, J.; Pinheiro, C.; Barón, M.; Mylona, P.; Centritto, M.; Haworth, M.; Loreto, F.; Uzilday, B.; Turkan, I.; et al. Opportunities and Limitations of Crop Phenotyping in Southern European Countries. Front. Plant Sci. 2019, 10, 1125. [Google Scholar] [CrossRef] [Green Version]
  53. Carter, G.A.; Lucas, K.L.; Blossom, G.A.; Lassitter, C.L.; Holiday, D.M.; Mooneyhan, D.S.; Fastring, D.R.; Holcombe, T.R.; Griffith, J.A. Remote Sensing and Mapping of Tamarisk along the Colorado River, USA: A Comparative Use of Summer-Acquired Hyperion, Thematic Mapper and QuickBird Data. Remote Sens. 2009, 1, 318–329. [Google Scholar] [CrossRef] [Green Version]
  54. Bock, C.H.; Barbedo, J.G.A.; Del Ponte, E.M.; Bohnenkamp, D.; Mahlein, A.-K. From visual estimates to fully automated sensor-based measurements of plant disease severity: Status and challenges for improving accuracy. Phytopathol. Res. 2020, 2, 1–30. [Google Scholar] [CrossRef] [Green Version]
  55. Diehn, K.; Hermann, D. Hyperspectral Remote Sensing as a Management Tool for a Land Application Program; Tappi Press: Atlanta, GA, USA, 1998; pp. 549–568. [Google Scholar]
  56. Su, J.Y.; Liu, C.J.; Coombes, M.; Hu, X.P.; Wang, C.H.; Xu, X.M.; Li, Q.D.; Guo, L.; Chen, W.-H. Wheat yellow rust monitoring by learning from multispectral UAV aerial imagery. Comput. Electron. Agric. 2018, 155, 157–166. [Google Scholar] [CrossRef]
  57. Nguyen, C.; Sagan, V.; Maimaitiyiming, M.; Maimaitijiang, M.; Bhadra, S.; Kwasniewski, M.T. Early Detection of Plant Viral Disease Using Hyperspectral Imaging and Deep Learning. Sensors 2021, 21, 742. [Google Scholar] [CrossRef]
  58. Zheng, Q.; Huang, W.; Cui, X.; Shi, Y.; Liu, L. New Spectral Index for Detecting Wheat Yellow Rust Using Sentinel-2 Multispectral Imagery. Sensors 2018, 18, 868. [Google Scholar] [CrossRef] [PubMed] [Green Version]
  59. Couture, J.J.; Singh, A.; Charkowski, A.O.; Groves, R.L.; Gray, S.M.; Bethke, P.C.; Townsend, P.A. Integrating Spectroscopy with Potato Disease Management. Plant Dis. 2018, 102, 2233–2240. [Google Scholar] [CrossRef] [PubMed] [Green Version]
  60. Abdulridha, J.; Ehsani, R.; De Castro, A. Detection and Differentiation between Laurel Wilt Disease, Phytophthora Disease, and Salinity Damage Using a Hyperspectral Sensing Technique. Agriculture 2016, 6, 56. [Google Scholar] [CrossRef] [Green Version]
  61. Bagheri, N.; Mohamadi-Monavar, H.; Azizi, A.; Ghasemi, A. Detection of Fire Blight disease in pear trees by hyperspectral data. Eur. J. Remote Sens. 2017, 51, 1–10. [Google Scholar] [CrossRef] [Green Version]
  62. Bagheri, N. Application of aerial remote sensing technology for detection of fire blight infected pear trees. Comput. Electron. Agric. 2019, 168, 105147. [Google Scholar] [CrossRef]
  63. Cubero, S.; Lee, W.S.; Aleixos, N.; Albert, F.; Blasco, J. Automated Systems Based on Machine Vision for Inspecting Citrus Fruits from the Field to Postharvest—a Review. Food Bioprocess Technol. 2016, 9, 1623–1639. [Google Scholar] [CrossRef] [Green Version]
  64. Huang, W.; Lamb, D.W.; Niu, Z.; Zhang, Y.; Liu, L.; Wang, J. Identification of yellow rust in wheat using in-situ spectral reflectance measurements and airborne hyperspectral imaging. Precis. Agric. 2007, 8, 187–197. [Google Scholar] [CrossRef]
  65. Meng, R.; Lv, Z.; Yan, J.; Chen, G.; Zhao, F.; Zeng, L.; Xu, B. Development of Spectral Disease Indices for Southern Corn Rust Detection and Severity Classification. Remote Sens. 2020, 12, 3233. [Google Scholar] [CrossRef]
  66. Srivastava, S.; Sadistap, S. Non-destructive sensing methods for quality assessment of on-tree fruits: A review. J. Food Meas. Charact. 2018, 12, 497–526. [Google Scholar] [CrossRef]
  67. Yamakawa, M.; Khot, L.R.; Ehsani, R.; Kondo, N. Real-time nondestructive citrus fruit quality monitoring system: Development and laboratory testing. Agric. Eng. Int. CIGR J. 2012, 14, 117–124. [Google Scholar]
  68. Cubero, S.; Marco-Noales, E.; Aleixos, N.; Barbé, S.; Blasco, J. RobHortic: A Field Robot to Detect Pests and Diseases in Horticultural Crops by Proximal Sensing. Agriculture 2020, 10, 276. [Google Scholar] [CrossRef]
  69. Nicolaï, B.M.; Defraeye, T.; De Ketelaere, B.; Herremans, E.; Hertog, M.L.; Saeys, W.; Torricelli, A.; Vandendriessche, T.; Verboven, P. Nondestructive Measurement of Fruit and Vegetable Quality. Annu. Rev. Food Sci. Technol. 2014, 5, 285–312. [Google Scholar] [CrossRef] [Green Version]
  70. Chen, S.-Y.; Chang, C.-Y.; Ou, C.-S.; Lien, C.-T. Detection of Insect Damage in Green Coffee Beans Using VIS-NIR Hyperspectral Imaging. Remote Sens. 2020, 12, 2348. [Google Scholar] [CrossRef]
  71. Türker-Kaya, S.; Huck, C.W. A Review of Mid-Infrared and Near-Infrared Imaging: Principles, Concepts and Applications in Plant Tissue Analysis. Molecules 2017, 22, 168. [Google Scholar] [CrossRef] [Green Version]
  72. Yang, L.; Gao, H.; Meng, L.; Fu, X.; Du, X.; Wu, D.; Huang, L. Nondestructive measurement of pectin polysaccharides using hyperspectral imaging in mulberry fruit. Food Chem. 2020, 334, 127614. [Google Scholar] [CrossRef]
  73. Li, J.L.; Sun, D.W.; Cheng, J.H. Recent Advances in Nondestructive Analytical Techniques for Determining the Total Soluble Solids in Fruits: A Review. Compr. Rev. Food Sci. Food Saf. 2016, 15, 897–911. [Google Scholar] [CrossRef] [PubMed]
  74. Tsang, Y.; Choy, K.L.; Wu, C.H.; Ho, G.T.S.; Lam, H. Blockchain-Driven IoT for food traceability with an integrated consensus mechanism. IEEE Access 2019, 7, 129000–129017. [Google Scholar] [CrossRef]
  75. Canavari, M.; Centonze, R.; Hingley, M.; Spadoni, R. Traceability as part of competitive strategy in the fruit supply chain. Br. Food J. 2010, 112, 171–186. [Google Scholar] [CrossRef] [Green Version]
  76. Kondo, N. Automation on fruit and vegetable grading system and food traceability. Trends Food Sci. Technol. 2010, 21, 145–152. [Google Scholar] [CrossRef]
  77. Haleem, A.; Khan, S.; Khan, M.I. Traceability implementation in food supply chain: A grey-DEMATEL approach. Inf. Process. Agric. 2019, 6, 335–348. [Google Scholar] [CrossRef]
  78. Afonso, A.M.; Guerra, R.; Cavaco, A.M.; Pinto, P.; Andrade, A.; Duarte, A.; Power, D.M.; Marques, N.T. Identification of asymptomatic plants infected with Citrus tristeza virus from a time series of leaf spectral characteristics. Comput. Electron. Agric. 2017, 141, 340–350. [Google Scholar] [CrossRef]
  79. Passos, D.; Rodrigues, D.; Cavaco, A.M.; Antunes, M.D.; Guerra, R. Non-Destructive Soluble Solids Content Determination for ‘Rocha’ Pear Based on VIS-SWNIR Spectroscopy under ‘Real World’ Sorting Facility Conditions. Sensors 2019, 19, 5165. [Google Scholar] [CrossRef] [PubMed] [Green Version]
  80. Cruz, S.; Guerra, R.; Brazio, A.; Cavaco, A.M.; Antunes, D.; Passos, D. Nondestructive simultaneous prediction of internal browning disorder and quality attributes in ‘Rocha’ pear (Pyrus communis L.) using VIS-NIR spectroscopy. Postharvest Biol. Technol. 2021, 179, 111562. [Google Scholar] [CrossRef]
  81. Wang, H.; Peng, J.; Xie, C.; Bao, Y.; He, Y. Fruit Quality Evaluation Using Spectroscopy Technology: A Review. Sensors 2015, 15, 11889–11927. [Google Scholar] [CrossRef] [Green Version]
  82. Rungpichayapichet, P.; Mahayothee, B.; Nagle, M.; Khuwijitjaru, P.; Müller, J. Robust NIRS models for non-destructive prediction of postharvest fruit ripeness and quality in mango. Postharvest Biol. Technol. 2016, 111, 31–40. [Google Scholar] [CrossRef]
  83. Cavaco, A.M.; Pires, R.; Antunes, M.D.; Panagopoulos, T.; Brazio, A.; Afonso, A.M.; Silva, L.; Lucas, M.R.; Cadeiras, B.; Cruz, S.P.; et al. Validation of short wave near infrared calibration models for the quality and ripening of ‘Newhall’ orange on tree across years and orchards. Postharvest Biol. Technol. 2018, 141, 86–97. [Google Scholar] [CrossRef]
  84. Zude, M.; Pflanz, M.; Kaprielian, C.; Aivazian, B.L. NIRS as a tool for precision horticulture in the citrus industry. Biosyst. Eng. 2008, 99, 455–459. [Google Scholar] [CrossRef]
  85. Sánchez, M.-T.; De la Haba, M.-J.; Serrano, I.; Pérez-Marín, D. Application of NIRS for Nondestructive Measurement of Quality Parameters in Intact Oranges During On-Tree Ripening and at Harvest. Food Anal. Methods 2012, 6, 826–837. [Google Scholar] [CrossRef]
  86. Mark, H.; Workman, J. Chemometrics in Spectroscopy, 1st ed.; Academic Press: Cambridge, UK, 2007; 558p. [Google Scholar] [CrossRef]
  87. Goyal, S. Artificial Neural Networks in Fruits: A Comprehensive Review. Int. J. Image Graph. Signal Process. 2014, 5, 53–63. [Google Scholar] [CrossRef] [Green Version]
  88. Tian, X.; Wang, Q.; Li, J.; Peng, F.; Huang, W. Non-destructive prediction of soluble solids content of pear based on fruit surface feature classification and multivariate regression analysis. Infrared Phys. Technol. 2018, 92, 336–344. [Google Scholar] [CrossRef]
  89. Abbaspour-Gilandeh, Y.; Sabzi, S.; Benmouna, B.; García-Mateos, G.; Hernández-Hernández, J.L.; Molina-Martínez, J.M. Estimation of the Constituent Properties of Red Delicious Apples Using a Hybrid of Artificial Neural Networks and Artificial Bee Colony Algorithm. Agronomy 2020, 10, 267. [Google Scholar] [CrossRef] [Green Version]
  90. Xue, J.; Fuentes, S.; Poblete-Echeverria, C.; Viejo, C.G.; Tongson, E.; Du, H.; Su, B. Automated Chinese medicinal plants classification based on machine learning using leaf morpho-colorimetry, fractal dimension and visible/near infrared spectroscopy. Int. J. Agric. Biol. Eng. 2019, 12, 123–131. [Google Scholar] [CrossRef]
  91. Daniel, M.; Guerra, R.; Brázio, A.; Rodrigues, D.; Cavaco, A.M.; Antunes, M.D.; de Oliveira, J.V. Feature discovery in NIR spectroscopy based Rocha pear classification. Expert Syst. Appl. 2021, 177, 114949. [Google Scholar] [CrossRef]
  92. Fernandes, A.M.; Utkin, A.B.; Eiras-Dias, J.; Cunha, J.; Silvestre, J.; Melo-Pinto, P. Grapevine variety identification using “Big Data” collected with miniaturized spectrometer combined with support vector machines and convolutional neural networks. Comput. Electron. Agric. 2019, 163, 104855. [Google Scholar] [CrossRef]
  93. Diago, M.P.; Fernández-Novales, J.; Fernandes, A.M.; Melo-Pinto, P.; Tardaguila, J. Use of Visible and Short-Wave Near-Infrared Hyperspectral Imaging to Fingerprint Anthocyanins in Intact Grape Berries. J. Agric. Food Chem. 2016, 64, 7658–7666. [Google Scholar] [CrossRef]
  94. Yu, K.; Fang, S.; Zhao, Y. Heavy metal Hg stress detection in tobacco plant using hyperspectral sensing and data-driven machine learning methods. Spectrochim. Acta Part A Mol. Biomol. Spectrosc. 2021, 245, 118917. [Google Scholar] [CrossRef] [PubMed]
  95. Lanczos, C. Linear Differential Operators; Van Nostrad: London, UK, 1961; p. 132. [Google Scholar]
  96. Huang, C.H.; Singh, G.P.; Park, S.H.; Chua, N.H.; Ram, R.J.; Park, B.S. Early Diagnosis and Management of Nitrogen Deficiency in Plants Utilizing Raman Spectroscopy. Front. Plant Sci. 2020, 11, 663. [Google Scholar] [CrossRef] [PubMed]
  97. Lew, T.T.S.; Sarojam, R.; Jang, I.-C.; Park, B.S.; Naqvi, N.I.; Wong, M.H.; Singh, G.P.; Ram, R.J.; Shoseyov, O.; Saito, K.; et al. Species-independent analytical tools for next-generation agriculture. Nat. Plants 2020, 6, 1408–1417. [Google Scholar] [CrossRef] [PubMed]
  98. Weng, S.; Hu, X.; Wang, J.; Tang, L.; Li, P.; Zheng, S.; Zheng, L.; Huang, L.; Xin, Z. Advanced Application of Raman Spectroscopy and Surface-Enhanced Raman Spectroscopy in Plant Disease Diagnostics: A Review. J. Agric. Food Chem. 2021, 69, 2950–2964. [Google Scholar] [CrossRef]
  99. Abbas, F.; Fares, A. Best management practices in Citrus production. Tree For. Sci. Biotechnol. 2009, 3, 1–11. [Google Scholar]
  100. Altangerel, N.; Ariunbold, G.O.; Gorman, C.; Alkahtani, M.H.; Borrego, E.; Bohlmeyer, D.; Hemmer, P.; Kolomiets, M.V.; Yuan, J.S.; Scully, M.O. In vivo diagnostics of early abiotic plant stress response via Raman spectroscopy. Proc. Natl. Acad. Sci. USA 2017, 114, 3393–3396. [Google Scholar] [CrossRef] [Green Version]
  101. Gupta, S.; Huang, C.H.; Singh, G.P.; Park, B.S.; Chua, N.-H.; Ram, R.J. Portable Raman leaf-clip sensor for rapid detection of plant stress. Sci. Rep. 2020, 10, 20206. [Google Scholar] [CrossRef]
  102. Li, F.; Lu, A.X.; Wang, J.H. Application of Raman spectroscopy in grain detection. J. Food Saf. Qual. 2016, 7, 4408–4414. [Google Scholar]
  103. Jin, K.X.; Wang, K.; Cui, H.S.; Yang, S.M.; Tian, G.L.; Ma, J.F. Application of Raman spectroscopy to the research on lignin. Sci. Silvae Sin. 2018, 54, 144–151. [Google Scholar]
  104. Angel, S.M.; Gomer, N.R.; Sharma, S.K.; McKay, C. Remote Raman spectroscopy for planetary exploration: A review. Appl. Spectrosc. 2012, 66, 137–150. [Google Scholar] [CrossRef] [Green Version]
  105. Acosta-Maeda, T.E.; Misra, A.K.; Muzangwa, L.G.; Berlanga, G.; Muchow, D.; Porter, J.; Sharma, S.K. Remote Raman measurements of minerals, organics, and inorganics at 430 m range. Appl. Opt. 2016, 55, 10283. [Google Scholar] [CrossRef]
  106. Lavrov, A.; Utkin, A.B.; da Silva, J.M.; Vilar, R.; Santos, N.M.; Alves, B. Water stress assessment of cork oak leaves and maritime pine needles based on LIF spectra. Opt. Spectrosc. 2012, 112, 271–279. [Google Scholar] [CrossRef]
  107. Gameiro, C.; Utkin, A.; Cartaxana, P.; da Silva, J.M.; Matos, A. The use of laser induced chlorophyll fluorescence (LIF) as a fast and non-destructive method to investigate water deficit in Arabidopsis. Agric. Water Manag. 2015, 164, 127–136. [Google Scholar] [CrossRef]
  108. Utkin, A.B.; Felizardo, R.; Gameiro, C.; Matos, A.R.; Cartaxana, P. Laser induced fluorescence technique for environmental appli-cations. In Proceedings of the Second International Conference on Applications of Optics and Photonics, Putrajaya, Malaysia, 22 August 2019; Costa, M., Nogueira, R.N., Eds.; Spie-Int Soc Optical Engineering: Bellingham, WA, USA, 2014; Volume 9286, p. 928609. [Google Scholar]
  109. Cabrita, M.T.; Gameiro, C.; Utkin, A.B.; Duarte, B.; Caçador, I.; Cartaxana, P. Photosynthetic pigment laser-induced fluorescence indicators for the detection of changes associated with trace element stress in the diatom model species Phaeodactylum tricornutum. Environ. Monit. Assess. 2016, 188, 1–13. [Google Scholar] [CrossRef] [PubMed]
  110. Vieira, G.; Cabrita, M.T.; David, A. Portuguese Polar Program: Annual Report 2019; Centro de Estudos Geográficos, Universidade de Lisboa: Lisbon, Portugal, 2020. [Google Scholar]
  111. Duarte, B.; Gameiro, C.; Utkin, A.B.; Matos, A.R.; Caçador, I.; Fonseca, V.; Cabrita, M.T. A multivariate approach to chlorophyll a fluorescence data for trace element ecotoxicological trials using a model marine diatom. Estuarine Coast. Shelf Sci. 2021, 250, 107170. [Google Scholar] [CrossRef]
  112. Da Silva, J.M.; Utkin, A.B. Application of Laser-Induced Fluorescence in Functional Studies of Photosynthetic Biofilms. Processes 2018, 6, 227. [Google Scholar] [CrossRef] [Green Version]
  113. Marques da Silva, J. Monitoring photosynthesis by in vivo chlorophyll fluorescence: Application to high-throughput plant phe-notyping. In Applied Photosynthesis—New Progress; Najafpour, M.M., Ed.; InTechOpen: Rijeka, Croatia, 2016; ISBN 978-953-51-2267-8. [Google Scholar]
  114. Babichenko, S.M. SFS Technique; LDI Innovation: Tallinn. 2014. Available online: https://ldi-innovation.com/wp-content/uploads/data/SFStechnique.pdf (accessed on 18 March 2021).
  115. Babichenko, S. (Ed.) Spectral Fluorescent Signatures in Diagnostics of Water Environment; Tallinn Pedagogical Univ., Inst. of Ecology: Tallinn, Estonia, 2002; p. 193. ISBN 9985-58-208-. [Google Scholar]
  116. HORIBA. What Is an Excitation Emission Matrix (EEM)? Available online: https://www.horiba.com/en_en/technology/measurement-and-control-techniques/molecular-spectroscopy/fluorescence-spectroscopy/what-is-an-excitation-emission-matrix-eem/ (accessed on 3 March 2021).
  117. JASCO Inc. Application NoteFP-0021: High-Speed Measurement and EEM Interpretation for Olive Oil Analysis; JASCO: Easton, MD, USA, 2017; p. 4. [Google Scholar]
  118. Mohammed, G.H.; Colombo, R.; Middleton, E.M.; Rascher, U.; van der Tol, C.; Nedbal, L.; Goulas, Y.; Pérez-Priego, O.; Damm, A.; Meroni, M.; et al. Remote sensing of solar-induced chlorophyll fluorescence (SIF) in vegetation: 50 years of progress. Remote Sens. Environ. 2019, 231, 111177. [Google Scholar] [CrossRef]
  119. Carter, G.A.; Jones, J.H.; Mitchell, R.J.; Brewer, C.H. Detection of solar-excited chlorophyll a fluorescence and leaf photosynthetic capacity using a Fraunhofer line radiometer. Remote Sens. Environ. 1996, 55, 89–92. [Google Scholar] [CrossRef]
  120. Cogliati, S.; Verhoef, W.; Kraft, S.; Sabater, N.; Alonso, L.; Vicent, J.; Moreno, J.; Drusch, M.; Colombo, R. Retrieval of sun-induced fluorescence using advanced spectral fitting methods. Remote Sens. Environ. 2015, 169, 344–357. [Google Scholar] [CrossRef]
  121. Sabater, N.; Kolmonen, P.; Van Wittenberghe, S.; Arola, A.; Moreno, J. Challenges in the atmospheric characterization for the retrieval of spectrally resolved fluorescence and PRI region dynamics from space. Remote Sens. Environ. 2020, 254, 112226. [Google Scholar] [CrossRef]
  122. Bandopadhyay, S.; Rastogi, A.; Juszczak, R. Review of Top-of-Canopy Sun-Induced Fluorescence (SIF) Studies from Ground, UAV, Airborne to Spaceborne Observations. Sensors 2020, 20, 1144. [Google Scholar] [CrossRef] [PubMed] [Green Version]
  123. Wang, N.; Suomalainen, J.; Bartholomeus, H.; Kooistra, L.; Masiliūnas, D.; Clevers, J.G. Diurnal variation of sun-induced chlorophyll fluorescence of agricultural crops observed from a point-based spectrometer on a UAV. Int. J. Appl. Earth Obs. Geoinf. 2020, 96, 102276. [Google Scholar] [CrossRef]
  124. Bureau, S.; Cozzolino, D.; Clark, C.J. Contributions of Fourier-transform mid infrared (FT-MIR) spectroscopy to the study of fruit and vegetables: A review. Postharvest Biol. Technol. 2018, 148, 1–14. [Google Scholar] [CrossRef]
  125. Hirschfeld, T. Fellgett’s Advantage in uv-VIS Multiplex Spectroscopy. Appl. Spectrosc. 1976, 30, 68–69. [Google Scholar] [CrossRef]
  126. Tran, N.-T.; Fukuzawa, M. A Portable Spectrometric System for Quantitative Prediction of the Soluble Solids Content of Apples with a Pre-calibrated Multispectral Sensor Chipset. Sensors 2020, 20, 5883. [Google Scholar] [CrossRef] [PubMed]
  127. Esquerre, C.A.; Achata, E.M.; García-Vaquero, M.; Zhang, Z.; Tiwari, B.K.; O’Donnell, C.P. Use of an NIR MEMS spectrophotometer and visible/NIR hyperspectral imaging systems to predict quality parameters of treated ground peppercorns. LWT 2020, 131, 109761. [Google Scholar] [CrossRef]
  128. Wiedemair, V.; Langore, D.; Garsleitner, R.; Dillinger, K.; Huck, C. Investigations into the Performance of a Novel Pocket-Sized Near-Infrared Spectrometer for Cheese Analysis. Molecules 2019, 24, 428. [Google Scholar] [CrossRef] [Green Version]
  129. Zgouz, A.; Héran, D.; Barthès, B.; Bastianelli, D.; Bonnal, L.; Baeten, V.; Lurol, S.; Bonin, M.; Roger, J.-M.; Bendoula, R.; et al. Dataset of visible-near infrared handheld and micro-spectrometers—comparison of the prediction accuracy of sugarcane properties. Data Brief 2020, 31, 106013. [Google Scholar] [CrossRef]
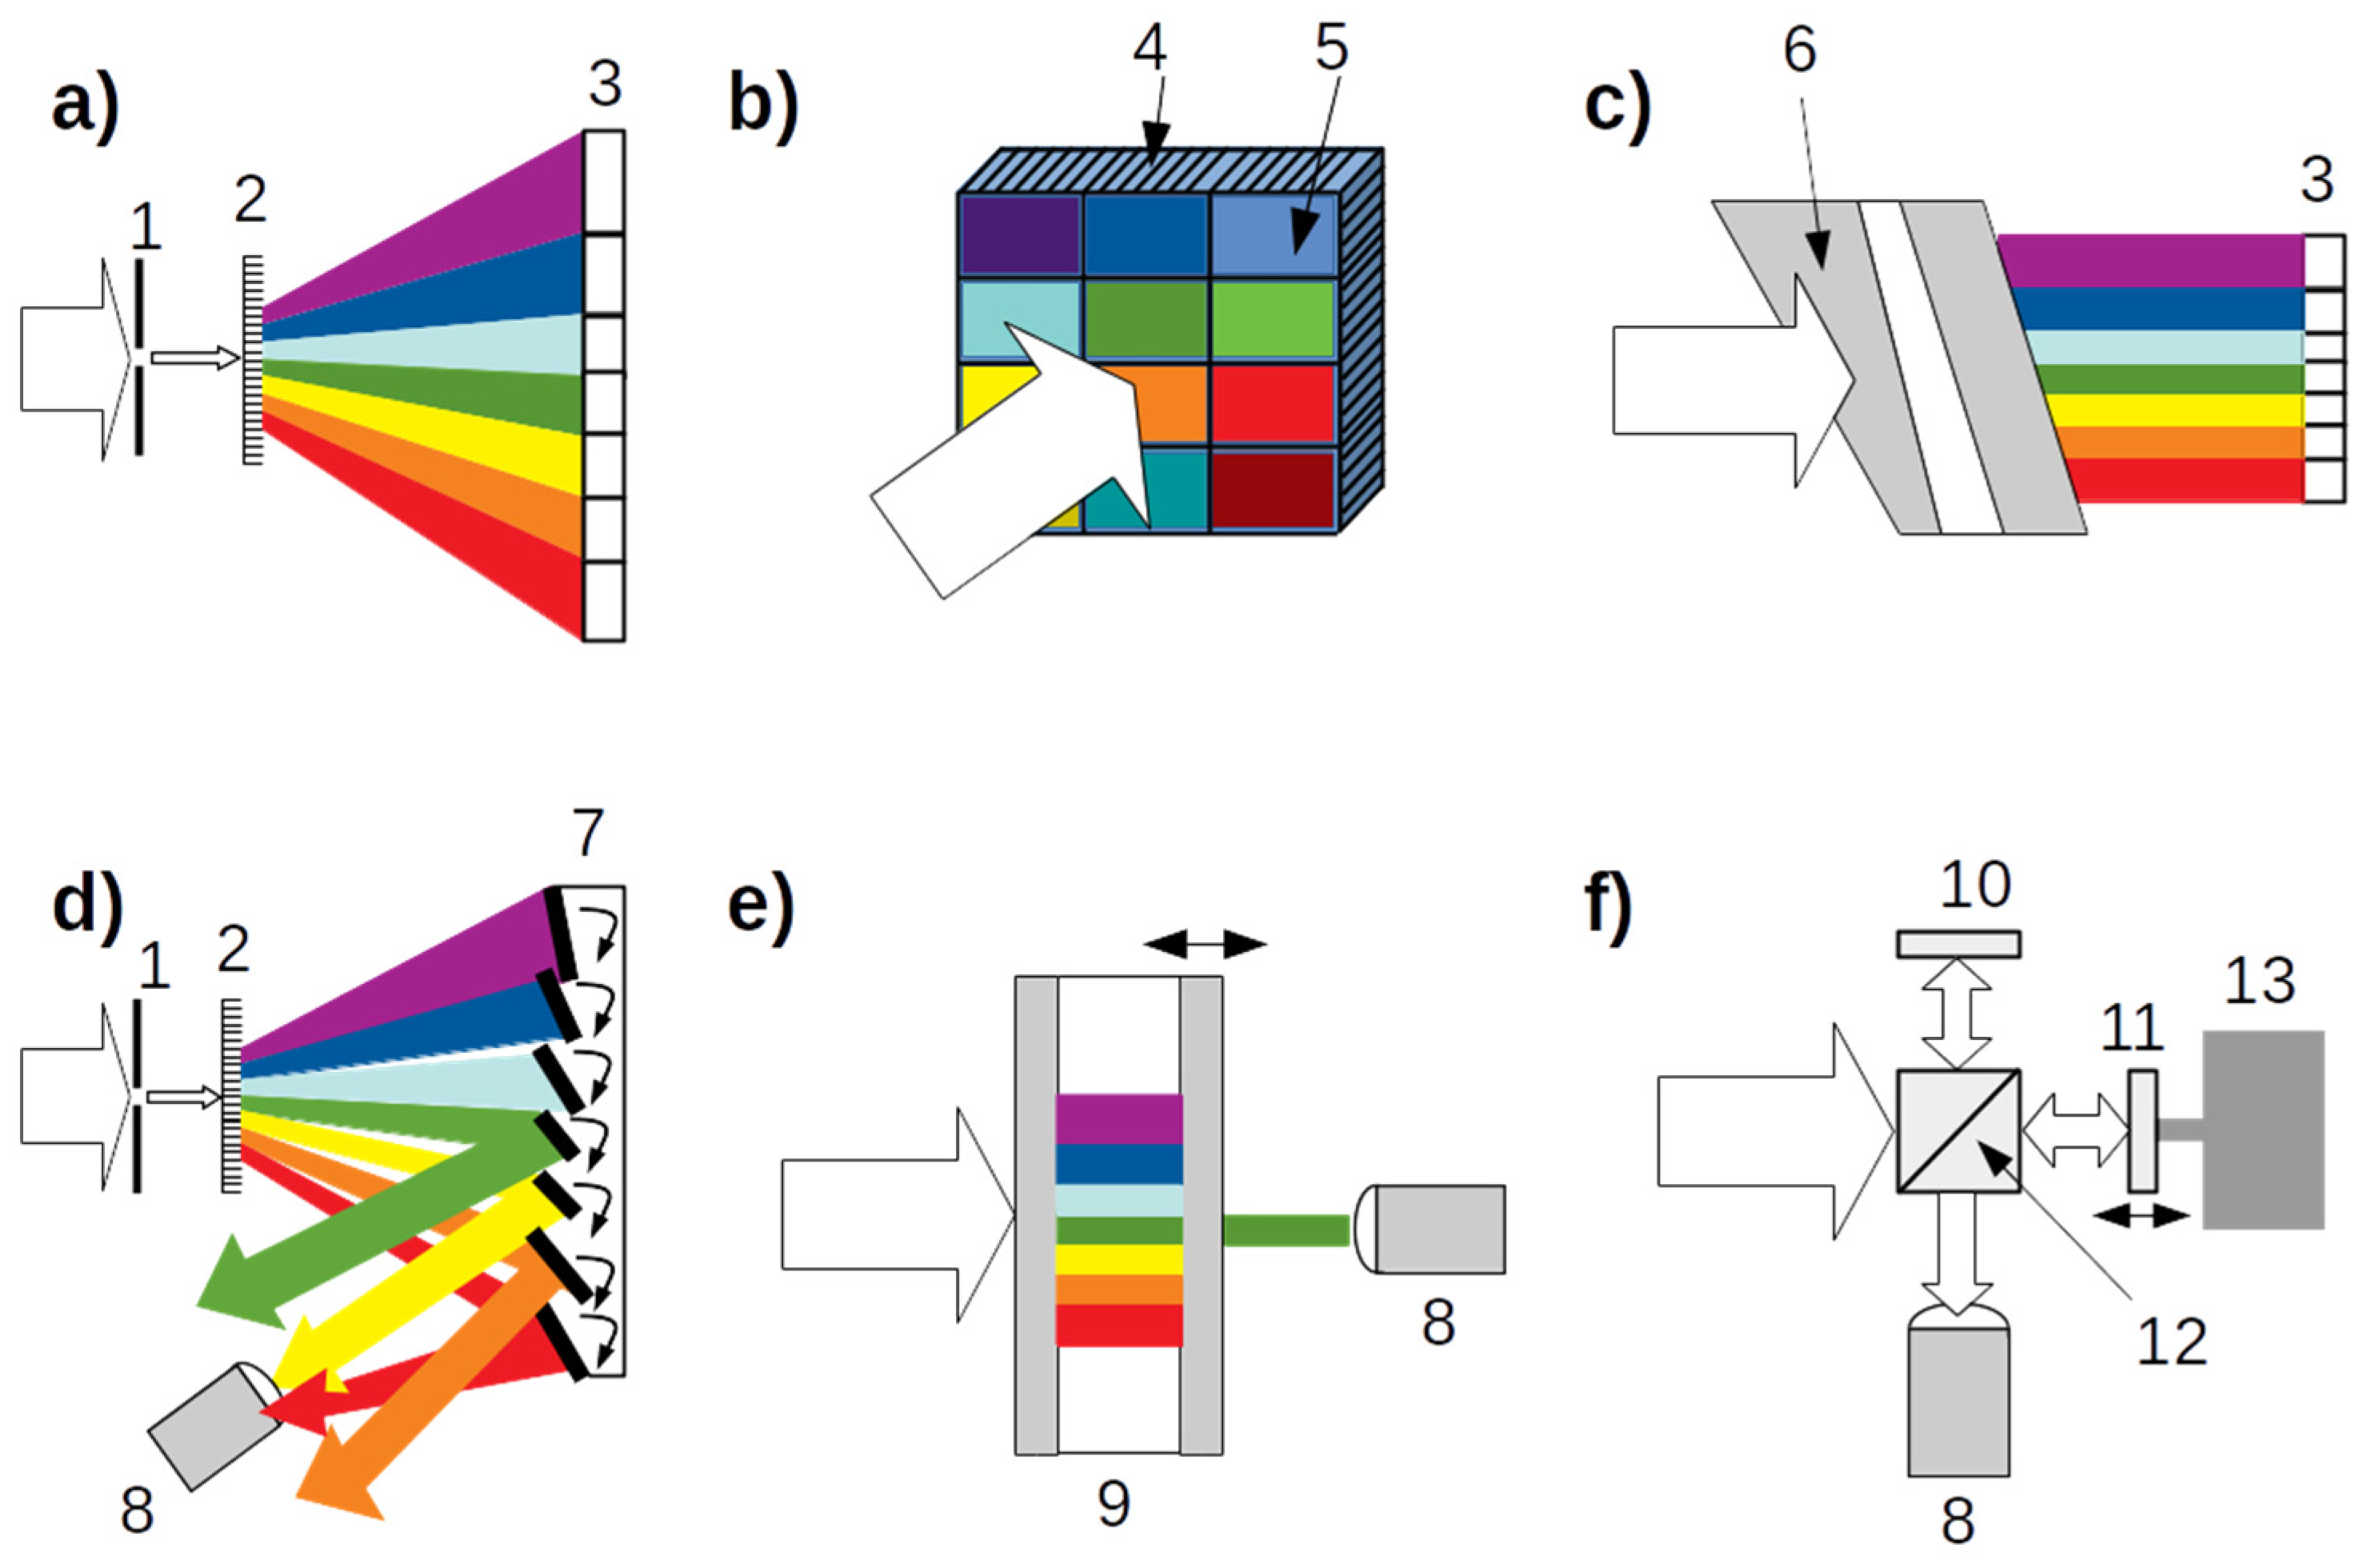
Figure 1. The basics and principles of different spectroscopic methods. The red circles represent a molecule generically. The black horizontal lines represent the quantum states of the molecule. The shadowed rectangles represent virtual states, i.e., states that do not correspond to any quantum state. The energy of a virtual transition equals that of the photon. The vertical black arrow represents radiative transitions, i.e., those involving a photon. Vertical thick white arrows represent non-radiative transitions, i.e., not involving photons. Electromagnetic radiation is represented by wavy lines, color-coded according to the photon energy: violet > blue > red.
Applsci 12 00997 g001
Figure 2. Fundamental schematics of major emerging technologies: (a) conventional, with slit (1), diffraction grating (2) and array sensor (3); (b) filter array (5) upon a CMOS photographic sensor (4); (c) linear variable filter (LVF) (6) and array sensor (3); (d) digital micromirror device (7), with slit (1), diffraction grating (2) and photodiode (8); (e) coupled micro-electro-mechanical systems (MEMS)-based Fabry–Pérot etalon (9) and photodiode (8); (f) MEMS-based Michelson interferometer, constituted by a fixed mirror (10), beam-splitter (12), photodiode (8) and movable mirror (11) moved by a MEMS (13).
Applsci 12 00997 g002
Table 1. Comparison of basic features among the different spectrometer types used in conventional and major emerging optical spectroscopic technologies.
Spectrometer TypeJacquinot’s
Advantage
Fellgett’s
Advantage
Point or
Array Detector
Achievable Spectral
Resolution
(a) DispersiveNNArrayHigh
(b) Multi-filterYNArrayLow
(c) LFVYNArrayMedium
(d) DMDNYPointMedium
(e) Fabry–PérotYNPointMedium
(f) FTIRYYPointHigh
Publisher’s Note: MDPI stays neutral with regard to jurisdictional claims in published maps and institutional affiliations.

