Abstract
Characterization of acoustic emission (AE) signals in loaded materials can reveal structural damage and consequently provide early warnings about product failures. Therefore, extraction of the most informative features from AE signals is an important part of the characterization process. This study considers the characterization of AE signals obtained from bending experiments for carbon fiber epoxy (CFE) and glass fiber epoxy (GFE) composites. The research is focused on the recognition of material structure (CFE or GFE) based on the analysis of AE signals. We propose the extraction of deep features using a convolutional autoencoder (CAE). The deep features are compared with extracted standard AE features. Then, the different feature sets are analyzed through decision trees and discriminant analysis, combined with feature selection, to estimate the predictive potential of various feature sets. Results show that the application of deep features increases recognition accuracy. By using only standard AE-based features, a classification accuracy of around 80% is obtained, and adding deep features improves the classification accuracy to above 90%. Consequently, the application of deep feature extraction is encouraged for the characterization of loaded CFE composites.
1. Introduction
Composite materials are increasingly used in lightweight transportation systems and civil engineering due to increasing weight constraints and installation costs. In the case of transportation systems such as in the aerospace and automobile industries, the use of composite materials reduces the weight, which is reflected in increasing the transportable load and reducing fuel consumption, and therefore the mechanical performance of the material is a very important and desired attribute.
The use of fiber-reinforced polymer (FRP) composites is somewhat limited due to the possibility of sudden damage under load. Damage mechanisms in FRP are heterogeneous in that they often begin in-depth and then propagate at different length scales (micro-, meso-, or macroscales). In addition, the composite constituents (fiber, matrix, and interfacial bonding), and the applied mechanical load (stress level of loading sequence, stress ratio) influence the damage evolution [1]. This aggravates the development of damage-tolerant design procedures like those used for metallic materials. In polymer composites, this is mostly related to the development of experimental techniques that can monitor material behavior and offer real-time information about damage evolution [2].
Acoustic emission (AE) monitoring is one of the most suitable techniques to detect damage occurrence and its evolution in real-time during loading of FRP. Acquired AE signals during loading are a consequence of energy release from different damage modes during loading in the form of elastic waves and can be used for real-time insight into the construction part [3]. The sensitivity of AE monitoring can offer detection of different damage sources like matrix cracking, fiber failure, delamination, debonding between matrix and fibers, fiber pull-out, interfacial debonding, and friction [4,5]. The most frequently reported damage modes of fiber composites are transverse matrix cracking, delamination, and fiber failure [6].
Damage mechanism characterization is based on analysis of acquired AE signals and prior knowledge of the nature of the damage source developed within the stressed specimen. Matrix cracking is usually connected with low amplitude signals between 40 and 60 dB, at low energy and frequency, while fiber-matrix debonding occurs between 45 and 70 dB in the medium frequency range [7]. The fiber breakage (failure) is usually associated with the highest amplitudes of 70–100 dB, at high energy and frequency, and usually occurs just before the complete failure of the specimen [8,9]. Fiber cracking and pull-out and fiber-matrix friction have amplitudes between previous mechanisms and are harder to isolate from others [9,10]. However, several studies have shown that AE signal amplitude is greatly affected by material properties, the geometry of the structure, and the acquisition system. More promising results for damage mechanism description were obtained by frequency content analysis of AE signals [11].
During composite loading, several damage mechanisms occur almost simultaneously, which creates a scientific challenge to assign a specific set of AE signal features to a particular damage mechanism. This is now most frequently solved with pattern recognition [12,13]. Tang et al. [8] used a sequential feature selection method based on a k-means clustering algorithm for the classification of AE signals in wind turbine blades loaded in the flap-wise direction. The visualization of clusters in peak frequency−frequency centroid features is used to correlate the clustering results with failure modes. Hamdi et al. [11] used the Hilbert–Huang transform to extract frequency descriptors based on intrinsic mode functions for k-means pattern recognition for unidirectional GFRP during three-point bending. Kumar et al. [14] compared the use of k-means, fuzzy C-means clustering, and Kohonen’s self-organizing map for discrimination of several failure modes in GFRP. They suggested Kohonen´s SOM as the most appropriate technique for the classification of AE signatures. Nair et al. [15] used an unsupervised k-means clustering method with a neural network based on a multi-layer perceptron (MLP) and support vector machine (SVM) algorithm for pattern recognition in CFRP retrofitted RC beams.
Automatic extraction of the intrinsic characteristics of signals based on deep learning is becoming increasingly popular. Extraction from the time-frequency domain enables the model to learn features, which more comprehensively reflect the intrinsic characteristics in the signal compared to features extracted from the time and/or frequency domain [16]. The clarity of high-fidelity characterization would enable an understanding of the local structural drivers on the damage response of composites [17]. In addition, a single methodology framework, which can be extended not only to various applications, conditions (i.e., industries), and configurations (test materials, data acquisition setups), but even broadly in different engineering domains, can be even more readily adopted [18]. For example, for milling tool wear condition monitoring, a stacked spare autoencoder has been utilized as a feature learning method [19]. The feature value extracted by the traditional method is obtained by manual construction and requires certain professional knowledge [20,21], while deep learning is used to establish a network model, allowing the network to automatically learn features, avoiding the loss of signals in the time and frequency domains during the manual feature extraction [22].
There are three main types of deep learning network models for sequential pattern recognition: deep belief network (DBN) [23], autoencoder (AE) [24], and convolutional neural network (CNN). A joint neural network model, combining CNN and AE, namely convolutional autoencoder (CAE), enables the extraction of useful higher-level representations from images, bridging the performance gap with DBN and in several cases surpassing it [25]. In CNNs, translation-invariant features enable the model to learn useful descriptors, independent of their location in the image. This property is not entirely desirable for image data where pattern location may carry a significant meaning, such as in time-frequency scalograms. For that reason, fully-connected layers, which induce spatial variance, are employed in the CAE structure at different levels.
In this paper, the AE monitoring of damage development with different damage mechanisms in pultruded materials with carbon fiber and glass fiber reinforcement is presented. The aim was to evaluate the performance of a deep convolutional autoencoder (CAE) in providing informative features for the classification and characterization of AE signals obtained from loading fiber epoxy composites. The features, extracted by the CAE model, are denoted as “deep features”, which means that these features are extracted automatically during the CAE training phase. Therefore, in comparison with “standard features” such as peak amplitude, burst signal duration, frequency centroid, etc., deep features do not have physical meaning but are designed to maximize informativeness.
The research was designed to investigate various CAE configurations as feature extractors and evaluate the performance by classifying the source material as either carbon fiber epoxy (CFE) or glass fiber epoxy (GFE) composites. Carbon and glass fibers are the most frequently used reinforcements in composites but the description of the classification capabilities with the use of different unsupervised techniques in the literature is scarce, and the application of deep features for this purpose has not been yet reported in the literature. Based on the acquired AE waveforms, deep features were extracted from continuous wavelet transform (CWT) scalograms using a convolutional autoencoder (CAE). Matrix-wise standardization was used in the pre-processing stage. To classify extracted AE features two principal methods were used: decision trees (DTs) and discriminant analysis (DA).
The presented research addresses the challenge of automated AE-based characterization of loaded CFE or GFE materials and introduces a novel application of deep learning using a convolutional autoencoder (CAE) for deep feature extraction from AE signals. The contributions of this research are in providing the methodology for automated feature extraction for characterization of loaded FRP materials by using the CAE method, and in demonstrating the benefits of the proposed approach on a dataset of CFE and GFE samples, where improved characterization accuracy was shown as significantly higher compared with the classical approach (using standard AE features).
2. Materials and Methods
Two epoxy-based polymer composites that differed in the type and size of the inlay fibers were used in the experiments. To evaluate the informativeness of time-frequency-based deep features, extracted by the means of a novel CAE, the analysis was formulated as a classification problem, for which another set of features (“standard features”) was used as a benchmark.
2.1. Experimental Setup
CFE and GFE samples (10 mm width, 4 mm thickness, and 200 mm length), manufactured with pultrusion, were used in a 3-point bending test on a reconfigurable Minitec loading machine. The loading cell has a capacity of 25 kN, the loading speed was set to 0.02 mm/s, and the loading supports were 80 mm apart. The fiber volume fraction of the composites corresponded to 65% of the overall volume. The average fiber diameters of CFE and GFE were measured to be 25 μm and 5 μm, respectively. A broadband piezoelectric AE sensor Steveco KRNBB-PCP12042 (University of California, Steven D. Glaser) with a frequency bandwidth of 20 kHz to 1000 kHz and resonance piezoelectric AE sensor VS150-M (Vallen Systeme) were attached, the first with a magnetic holder and the second with a plastic clamp on each end of the sample, 120 mm apart. A standard coupling agent (silicon grease) was added to the mounting surfaces. For this research, only the signals from the broadband sensor were ultimately used. The experimental setup is presented in Figure 1.
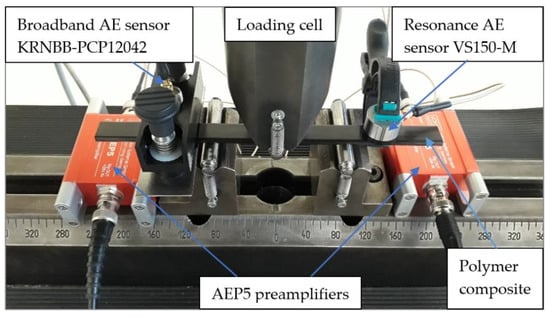
Figure 1.
Experimental setup.
The detected AE signals were amplified in AEP5 preamplifiers with 34 dB gain and sampled at 5 MHz by storing 4096 points for every hit, using the AMSY-5 AE data acquisition system. The threshold for signal acquisition of 37 dB was determined using a series of preliminary Hsu–Nielsen standard tests. A total of 44,688 AE signals, measured by the broadband sensor, were acquired from bending tests of CFE and GFE and were used for feature extraction.
2.2. Feature Extraction
Features used in the analysis were extracted from time and frequency domains, which are often used to classify damage mechanisms in polymer composites. These features are henceforth referred to as “standard features”, whereas features extracted using CAE are referred to as “deep features”.
2.2.1. Standard Features
Standard features for the characterization of AE signals were extracted and denoted as follows:
- c1:
- Peak amplitude (µV) denotes burst signal linear peak amplitude,
- c2:
- Burst signal duration (µs) represents the elapsed time after the first and until the last threshold crossing of a burst signal,
- c3:
- Burst signal energy (µV2s) according to EN 1330-9 is the integral of the squared AE-signal over time,
- c4:
- Burst signal rise-time (µs) represents the elapsed time after the first threshold crossing and until the burst signal maximum amplitude,
- c5:
- Frequency centroid (Hz) denotes the frequency at which the spectrum has its center of gravity (including only the frequencies and corresponding amplitudes in the range between 0 and 1000 kHz),
- c6:
- Frequency of the max. amplitude of the spectrum (Hz),
- c7:
- Frequency of the max. amplitude of continuous wavelet transformation (using the complex Morlet wavelet) (Hz),
- c8:
- Partial power of frequency spectrum between 0 and 200 kHz (/),
- c9:
- Partial power of frequency spectrum between 200 and 400 kHz (/),
- c10:
- Partial power of frequency spectrum between 400 and 1000 kHz (/).
2.2.2. Convolutional Autoencoder and Deep Features
The convolutional autoencoder (CAE) presented in this section is designed to extract “deep features”. These features are extracted automatically during the CAE training phase. Deep features do not have physical meaning but are designed to minimize information loss of the input-output mapping of the CAE. Deep features (denoted as d1, d2, …, d6) were extracted from continuous wavelet transform (complex Morlet wavelets) scalograms using a convolutional autoencoder (CAE). Matrix-wise standardization was used in the pre-processing stage. Training data consisted of 44,598 AE signals, transformed into the aforementioned scalograms.
The structure of the convolutional autoencoder for deep feature extraction is depicted in Figure 2. Model input is a 2-D matrix of size 48 × 432, which is, before any computations, split into four stripes of 12 × 432 matrices. The subsequent layer operations are performed separately and independently (without parameter sharing) on each of the stripes. Two convolutional layers (filter dimension 3 × 5, ReLU activation and strides 1, 3) and 2 × 2 max-pooling layers (C+P layers) with a stride of 2 were used. Then, all of the resulting output feature maps were concatenated back into one merged feature map. A single convolutional layer (filter dimension 3 × 3, ReLU activation and strides 1, 1) and a 2 × 2 max-pooling layer with a stride of 2 follow. The resulting 2-D feature map is flattened to 1-D and connected to three fully connected layers—FCL 1, FCL 2, and FCL 3. These layers complete the CAE’s encoder used to extract deep features after the whole model (with decoder) has been trained. The number of neurons set in FCL 3 translates to the dimensionality of the feature vector, which encodes each scalogram as a specific series of numbers—deep features.
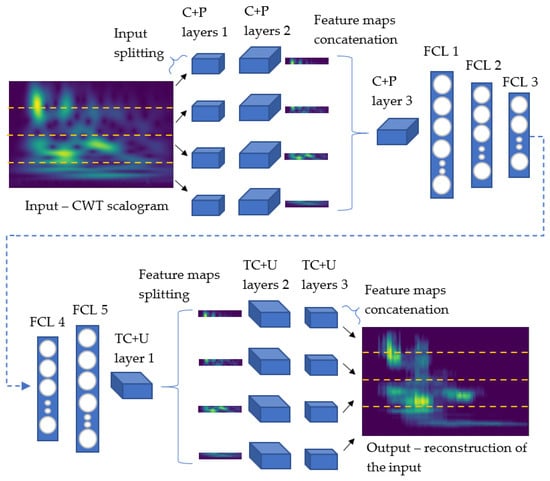
Figure 2.
Convolutional autoencoder (CAE) for deep feature extraction.
The second part of the autoencoder (decoder) consists of layers that perform inverse operations and are also stacked in reverse order compared to those in the encoder. The carefully chosen input dimensions (scalograms) enable the layer hyperparameters of the encoder and decoder to be the same, while also fulfilling the model’s input and output dimension matching requirement. The decoder consists of two fully connected layers (FCL 4 and FCL 5), a transposed convolution and upsampling layer (TC+U layers), a feature map splitting layer, two consecutive TC+U layers (in each of the resulting feature maps), and a final feature map concatenation layer.
Various convolutional autoencoder architectures were designated by selecting the following configuration parameters:
- s1:
- Number of filters used in layers C+P (1) and TC+U (3),
- s2:
- Number of filters used in layers C+P (2) and TC+U (2),
- s3:
- Number of filters used in layers C+P (3) and TC+U (1),
- s4:
- Number of neurons in fully connected layer FCL 2,
- s5:
- Number of neurons in fully connected layer FCL 3,
- s6:
- Number of training epochs,
- s7:
- Batch size of training samples.
Different CAE configurations are denoted as “s1-s2-s3-s4-s5-s6-s7” and the results for selected configurations are summarized in the Results section. Model training was performed on an NVIDIA GPU GeForce GTX 750 Ti, and lasted for each configuration up to 2 h. Configuration parameter s4 has, by far, the greatest impact on the model’s complexity. The loss function used was squared error and for the optimization algorithm, ADAM [26] was chosen.
2.3. Classification Methods
Two principal methods were used in this research to classify extracted AE features, namely decision trees (DTs) and discriminant analysis (DA). DTs already include tools to evaluate the informativeness of the extracted features. DA represents a simple yet highly efficient classifier that supports decision boundaries such as linear or quadratic. The DA method was combined with forward feature selection to provide insight into the informativeness of various combinations of selected features. The methods are briefly introduced in the following sections.
2.3.1. Decision Trees
Decision trees (DTs) are commonly used in data mining and classification [27]. DTs are built by splitting the source data set, constituting the tree’s root node, into subsets, which comprise the successor children. In these tree structures, leaves represent class labels, and branches represent conjunctions of features that lead to those class labels. The splitting is based on a set of splitting rules based on classification features. This process is repeated for each derived subset recursively until splitting no longer improves the classifications.
2.3.2. Discriminant Analysis
Discriminant analysis (DA) is a classification method used to determine the discrimination boundaries separating two or more categories of objects [28]. DA assumes that different categories generate data based on different Gaussian distributions. DA has been shown to rank among the top classifiers, which is most probably due to the bias−variance trade-off where the data can only support simple decision boundaries such as linear or quadratic, and estimates obtained by Gaussian models are stable [29]. In this study, quadratic DA was applied.
2.4. Research Framework
2.4.1. Objectives
This research aims to evaluate the performance of a deep convolutional autoencoder (CAE) in providing informative features for the classification and characterization of AE signals obtained from fiber epoxy composites. The research was designed to investigate various CAE configurations as feature extractors and evaluate the performance by classifying the source material as either carbon fiber epoxy (CFE) or glass fiber epoxy (GFE) composite.
2.4.2. Evaluation Procedure
The classification performance was evaluated by the classification accuracy, which denotes the percentage of correctly classified samples. The evaluation procedure was explicitly designed to maintain the robustness of the comparative analysis and compatibility between applied classifiers. To avoid overfitting, the following strategy was used:
- A maximum of 6 selected features was allowed as inputs for the classifiers.
- Deep feature extraction was performed in various CAE configurations consisting of 4 or 6 neurons in the 3rd fully connected layer (FCL 3), thus providing 4 or 6 deep features.
- For the DT classifier, the number of splits was limited to 15. Without this limitation, even higher accuracy (such as 95%) can be obtained, but the results are subject to overfitting.
2.4.3. Feature Selection
The DT classifier provides an inherent method for selecting the most informative features. The DA classifier was combined with a forward feature selection algorithm which progressively adds relevant features based on their contribution to the classification accuracy. Thus, the classification results with both methods, DTs and DA, indicate the relevance of included features and therefore provide a basis for the comparative evaluation of standard vs. deep features.
3. Results
Figure 3 presents the load-deflection curve with c1 and c3 AE signal features for CFE and GFE samples. CFE samples achieved, on average, a 15% higher maximum flexural load with significantly higher sample deflection than GFE samples. The load dropped sharply after the CFE specimen broke, while in the case of glass fibers that are 5 times smaller in diameter than carbon fibers, the load after sample breakage gradually decreased with accompanying fiber breakage. A clear trend of increasing amplitude and energy of AE signals with increasing load for both types of samples is observed. When the CFE sample breaks, the highest amplitudes and energies of AE signals are measured, while in the case of GFE samples, after sample breaking the values of the amplitude and energy remain high. In the tests, AE signals up to a 10% drop in load after fracture were analyzed.
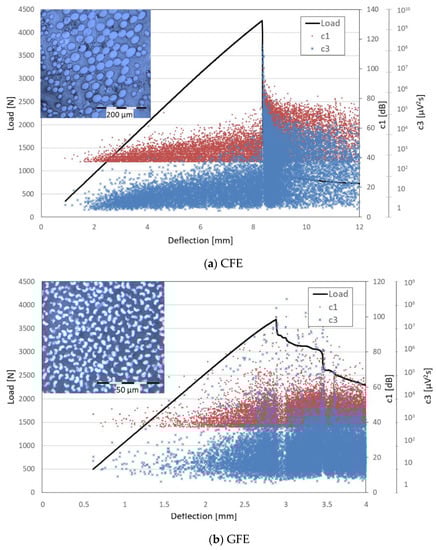
Figure 3.
Load-deflection curve with a peak amplitude and burst signal energy values for CFE sample (a) and GFE sample (b). In the upper left part of the diagrams are optical microscope photos of the sample cross-sections.
Deep features were extracted from continuous wavelet transform (complex Morlet wavelets) scalograms using a convolutional autoencoder (CAE). Different CAE configurations influence deep feature extraction and consequently classification accuracy for DT and DA classifiers. The results of the investigation of various CAE configurations as feature extractors and evaluation of the performance of classification for CFE and GFE composites are summarized in Table 1, Table 2 and Table 3. The tables are structured as follows:

Table 1.
Selected standard features in order of importance and corresponding classification accuracy for DT and DA classifiers.
Table 2.
Selected deep features in order of importance and corresponding classification accuracy for DT and DA classifiers.
Table 3.
Selected combined standard and deep features in order of importance and corresponding classification accuracy for DT and DA classifiers.
- The first column presents the architecture of the deep autoencoder that was applied to generate the corresponding deep features.
- The second and the third column present the selected features, listed in order of importance, as chosen by DT and DA classifiers.
- The last two columns denote the classification accuracy obtained by DT and DA methods.
Table 1 shows the results of applying only standard features. In this case, the accuracy measures around 80% were obtained by both classifiers. Table 1 reveals differences in the selection of relevant features, which are due to different partitioning strategies of DT and DA classifiers, and it also indicates the absence of highly relevant features that would be simultaneously selected by both classifiers.
Table 2 shows results obtained using only deep features. These results are significantly better compared to those shown in Table 1. Comparative analysis also indicates good consistency of feature selection by both classifiers, which denotes good predictive power of selected deep features. In this case, the best accuracy of 91.3% was obtained by both classifiers.
Table 3 presents results where both feature sets (standard and deep features) were available as classifier inputs. This case reveals only slight improvement compared to Table 2, which means that deep features already accurately represent the information relevant for the defined classification task.
Figure 4 shows the classification accuracies for all three feature sets and both classifiers. Deep and combined features provide a similar result that significantly outperforms the result obtained using only standard features.
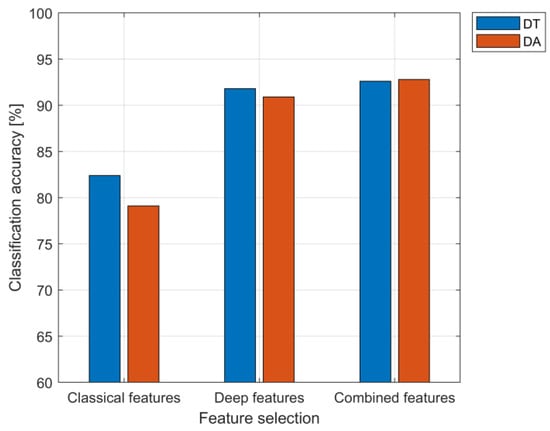
Figure 4.
Classification accuracies of DT and DA classifiers for different feature sets.
Figure 5 presents feature importance estimates as provided by the DT classifier in the case of combined features (Table 3, the third autoencoder architecture: 16-32-14-256-6-150-256). It can be observed that the first three features (the most important ones) belong to the deep features set.
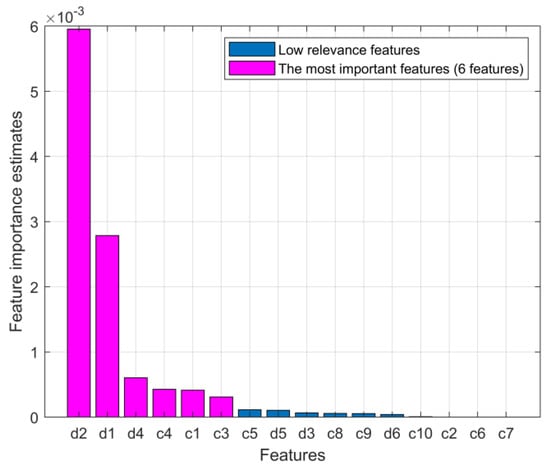
Figure 5.
Importance estimates for combined features, as provided by the DT classifier.
Figure 6 illustrates the representation of CFG and GFC samples in the space of the two most relevant features, namely d1 and d2. This result is only illustrative, as the classification in this study was performed in the space of more features (6 features, or 4 features in the case of restricted autoencoders with only 4 middle layer units).
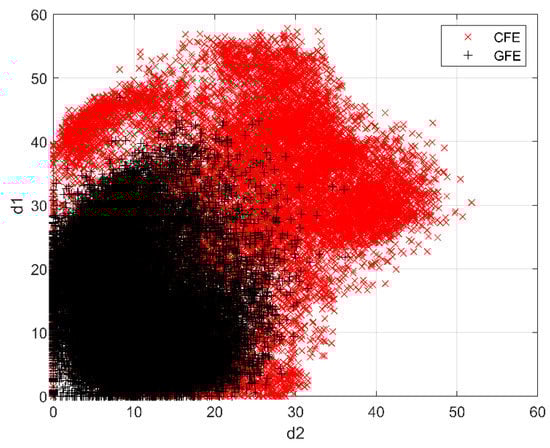
Figure 6.
The representation of CFG and GFC samples in the space of the two most relevant features (d1 and d2).
Discussion
The presented results indicate the good potential of introducing deep learning methods into the AE-based characterization of loaded materials. The proposed approach addresses the need for automated AE-based feature extraction, where the informative features are automatically extracted through the learning procedure of a convolutional autoencoder.
Although this step adequately fulfills the automation of feature extraction, it also opens new challenges of properly designing the CAE to consistently obtain good and repeatable feature extraction results. As shown in Table 2 and Table 3, different CAE architectures and corresponding selection of hyperparameters influence the results. Therefore, further research will be needed to establish guidelines for efficient and robust extraction of deep features that maximize the information content of the input information (e.g., wavelet transform scalograms) that is relevant for material deformation characterization.
4. Conclusions
The research was focused on the evaluation of the performance of a deep convolutional autoencoder (CAE) in providing informative features for the classification and characterization of AE signals obtained from stressing CFE and GFE fiber epoxy composites. Important conclusions can be summarized as follows:
- The analysis of the acquired AE signals based on standard features with decision trees (DTs) and discriminant analysis (DA) classification methods offers accuracy measures of around 80% to classify the signals according to the source specimen, whether it is CFE or GFE.
- The classification accuracy can be significantly increased if deep features, extracted from the proposed convolutional autoencoder, are used instead of standard features. In this case, the classification accuracy of 91.3% has been obtained by both classifiers. Comparative analysis also indicates good consistency of deep feature selection by both classifiers.
- The use of both feature sets (standard and deep features) reveals only a slight improvement in accuracy measures compared to the use of deep features only. This proves that deep features already accurately represent the information relevant for the defined classification task.
The results of the proposed structural health monitoring approach show that the introduction of deep learning features has a significantly higher potential for the effective characterization of damage mechanisms in fiber-reinforced polymer (FRP) composites in comparison with the use of standard AE features broadly used in the AE testing practice.
The potential practical applications of the proposed approach are foreseen in the field of AE-based characterization of loaded materials, where improved characterization of structural health monitoring and detection of damage mechanisms are expected due to the application of deep features. Another practical benefit is expected also in possible automation of the feature extraction and feature selection procedures because the CAE method automatically provides the condensed feature set (i.e., deep features) that can be directly applied for the material characterization without additional signal processing.
Future research directions will focus on the examination of various modified CAE architectures and their hyperparameters, and also on the optimization of the CAE training procedures with respect to robustness, stability, efficiency, and informativeness of the extracted features. Further research is foreseen also in the experimental characterization of different materials and mixed structures to examine the efficiency and applicability of deep features for structural health monitoring of damage modes and early detection of product failures.
Author Contributions
Conceptualization, P.P., M.M. and T.K.; methodology, P.P., M.M. and T.K.; software, P.P., M.M.; validation, P.P., M.M. and T.K.; investigation, M.M. and T.K.; resources, T.K.; data curation, M.M. and T.K.; writing—original draft preparation, P.P., M.M. and T.K.; project administration, R.Š. and E.G.; funding acquisition, R.Š. and E.G. All authors have read and agreed to the published version of the manuscript.
Funding
This work was supported by ARRS—the Slovenian Research Agency, research programs P2-0241 and P2-0270.
Institutional Review Board Statement
Not applicable.
Informed Consent Statement
Not applicable.
Data Availability Statement
Not applicable.
Conflicts of Interest
The authors declare no conflict of interest.
References
- Duchene, P.; Chaki, S.; Ayadi, A.; Krawczak, P. A review of non-destructive techniques used for mechanical damage assessment in polymer composites. J. Mater. Sci. 2018, 53, 7915–7938. [Google Scholar] [CrossRef]
- Crivelli, D.; Guagliano, M.; Monici, A. Development of an artificial neural network processing technique for the analysis of damage evolution in pultruded composites with acoustic emission. Compos. Part B Eng. 2014, 56, 948–959. [Google Scholar] [CrossRef]
- Świt, G. Acoustic Emission Method for Locating and Identifying Active Destructive Processes in Operating Facilities. Appl. Sci. 2018, 8, 1295. [Google Scholar] [CrossRef]
- Davijani, A.B.; Hajikhani, M.; Ahmadi, M. Acoustic Emission based on sentry function to monitor the initiation of delamination in composite materials. Mater. Des. 2011, 32, 3059–3065. [Google Scholar] [CrossRef]
- Kalteremidou, K.-A.; Murray, B.R.; Tsangouri, E.; Aggelis, D.G.; Van Hemelrijck, D.; Pyl, L. Multiaxial Damage Characterization of Carbon/Epoxy Angle-Ply Laminates under Static Tension by Combining In Situ Microscopy with Acoustic Emission. Appl. Sci. 2018, 8, 2021. [Google Scholar] [CrossRef]
- Aggelis, D.; Barkoula, N.-M.; Matikas, T.; Paipetis, A. Acoustic structural health monitoring of composite materials: Damage identification and evaluation in cross ply laminates using acoustic emission and ultrasonics. Compos. Sci. Technol. 2011, 72, 1127–1133. [Google Scholar] [CrossRef]
- Gutkin, R.; Green, C.; Vangrattanachai, S.; Pinho, S.; Robinson, P.; Curtis, P. On acoustic emission for failure investigation in CFRP: Pattern recognition and peak frequency analyses. Mech. Syst. Signal Process. 2011, 25, 1393–1407. [Google Scholar] [CrossRef]
- Tang, J.; Soua, S.; Mares, C.; Gan, T.-H. A Pattern Recognition Approach to Acoustic Emission Data Originating from Fatigue of Wind Turbine Blades. Sensors 2017, 17, 2507. [Google Scholar] [CrossRef]
- Monti, A.; EL Mahi, A.; Jendli, Z.; Guillaumat, L. Mechanical behaviour and damage mechanisms analysis of a flax-fibre reinforced composite by acoustic emission. Compos. Part A Appl. Sci. Manuf. 2016, 90, 100–110. [Google Scholar] [CrossRef]
- Friedrich, L.; Colpo, A.; Maggi, A.; Becker, T.; Lacidogna, G.; Iturrioz, I. Damage process in glass fiber reinforced polymer specimens using acoustic emission technique with low frequency acquisition. Compos. Struct. 2020, 256, 113105. [Google Scholar] [CrossRef]
- Hamdi, S.E.; Le Duff, A.; Simon, L.; Plantier, G.; Sourice, A.; Feuilloy, M. Acoustic emission pattern recognition approach based on Hilbert–Huang transform for structural health monitoring in polymer-composite materials. Appl. Acoust. 2013, 74, 746–757. [Google Scholar] [CrossRef]
- Sause, M.; Gribov, A.; Unwin, A.; Horn, S. Pattern recognition approach to identify natural clusters of acoustic emission signals. Pattern Recognit. Lett. 2012, 33, 17–23. [Google Scholar] [CrossRef]
- Panek, M.; Blazewicz, S.; Konsztowicz, K.J. Correlation of Acoustic Emission with Fractography in Bending of Glass–Epoxy Composites. J. Nondestruct. Eval. 2020, 39, 63. [Google Scholar] [CrossRef]
- Chelliah, S.K.; Parameswaran, P.; Ramasamy, S.; Vellayaraj, A.; Subramanian, S. Optimization of acoustic emission parameters to discriminate failure modes in glass–epoxy composite laminates using pattern recognition. Struct. Health Monit. 2018, 18, 1253–1267. [Google Scholar] [CrossRef]
- Nair, A.; Cai, C.; Kong, X. Acoustic emission pattern recognition in CFRP retrofitted RC beams for failure mode identification. Compos. Part B Eng. 2018, 161, 691–701. [Google Scholar] [CrossRef]
- Gu, Y.-K.; Zhou, X.-Q.; Yu, D.-P.; Shen, Y.-J. Fault diagnosis method of rolling bearing using principal component analysis and support vector machine. J. Mech. Sci. Technol. 2018, 32, 5079–5088. [Google Scholar] [CrossRef]
- Muir, C.; Swaminathan, B.; Almansour, A.S.; Sevener, K.; Smith, C.; Presby, M.; Kiser, J.D.; Pollock, T.M.; Daly, S. Damage mechanism identification in composites via machine learning and acoustic emission. NPJ Comput. Mater. 2021, 7, 95. [Google Scholar] [CrossRef]
- Kaji, M.; Parvizian, J.; Venn, H. Constructing a Reliable Health Indicator for Bearings Using Convolutional Autoencoder and Continuous Wavelet Transform. Appl. Sci. 2020, 10, 8948. [Google Scholar] [CrossRef]
- Ou, J.; Li, H.; Huang, G.; Zhou, Q. A Novel Order Analysis and Stacked Sparse Auto-Encoder Feature Learning Method for Milling Tool Wear Condition Monitoring. Sensors 2020, 20, 2878. [Google Scholar] [CrossRef]
- García-Martín, J.; Gómez-Gil, J.; Vázquez-Sánchez, E. Non-Destructive Techniques Based on Eddy Current Testing. Sensors 2011, 11, 2525–2565. [Google Scholar] [CrossRef]
- Gao, X.; Mo, L.; You, D.; Li, Z. Tight butt joint weld detection based on optical flow and particle filtering of magneto-optical imaging. Mech. Syst. Signal Process. 2017, 96, 16–30. [Google Scholar] [CrossRef]
- Miao, R.; Gao, Y.; Ge, L.; Jiang, Z.; Zhang, J. Online defect recognition of narrow overlap weld based on two-stage recognition model combining continuous wavelet transform and convolutional neural network. Comput. Ind. 2019, 112, 103115. [Google Scholar] [CrossRef]
- Hinton, G.E.; Salakhutdinov, R.R. Reducing the Dimensionality of Data with Neural Networks. Science 2006, 313, 504–507. [Google Scholar] [CrossRef] [PubMed]
- Kramer, M.A. Nonlinear principal component analysis using autoassociative neural networks. AIChE J. 1991, 37, 233–243. [Google Scholar] [CrossRef]
- Vincent, P.; Larochelle, H.; Lajoie, I.; Bengio, Y.; Manzagol, P.-A. Stacked Denoising Autoencoders: Learning Useful Representations in a Deep Network with a Local Denoising Criterion. J. Mach. Learn Res. 2010, 11, 3371–3408. [Google Scholar]
- Kingma, D.P.; Ba, J.L. Adam: A method for stochastic optimization. In Proceedings of the 3rd International Conference on Learning Representations, ICLR 2015, San Diego, CA, USA, 7–9 May 2015. [Google Scholar]
- Breiman, L.; Friedman, J.; Stone, C.J.; Olshen, A.R. Classification and Regression Trees; Chapman & HAll/CRC: Boca Raton, FL, USA, 1984. [Google Scholar]
- Härdle, W.K.; Simar, L. Applied Multivariate Statistical Analysis, 4th ed.; Springer: Berlin, Germany, 2015. [Google Scholar] [CrossRef]
- Kocherlakota, K.; Krzanowski, W.J. Principles of Multivariate Analysis, A User’s Perspective. Biometrics 1989, 45, 1338. [Google Scholar] [CrossRef][Green Version]


Publisher’s Note: MDPI stays neutral with regard to jurisdictional claims in published maps and institutional affiliations. |
© 2022 by the authors. Licensee MDPI, Basel, Switzerland. This article is an open access article distributed under the terms and conditions of the Creative Commons Attribution (CC BY) license (https://creativecommons.org/licenses/by/4.0/).