Article

Large Area Detection of Microstructural Defects with Multi-Mode Ultrasonic Signals

Materials Physics and Applications (MPA), Los Alamos National Laboratory, Los Alamos, NM 87545, USA
*
Author to whom correspondence should be addressed.
Appl. Sci. 2022, 12(4), 2082; https://doi.org/10.3390/app12042082
Submission received: 22 December 2021 / Revised: 4 February 2022 / Accepted: 11 February 2022 / Published: 17 February 2022

Abstract

:
Cyclic loading or other stresses can lead to development of cracks and crack growth in mechanical structures, leading to eventual failure. While ultrasound imaging can be used for non-destructive testing of such structures, conventional ultrasound techniques are often limited by crack size, density, and areal coverage. An effective characterization of real-world, large-area structures is required at an early damage stage to prevent catastrophic failure and predict remaining life. In this study, a new nonlinear ultrasonic testing (NUT) method is proposed for large-area monitoring of practical structures with arbitrary complexity by using multiple-mode guided-wave ultrasonic signals. The proposed guided-wave NUT technique requires single-element transducers, simple electronics, and a mixed time-frequency domain signal processing. As a proof-of-concept demonstration, numerical simulations and experiments are performed on an A36 carbon steel beam assembly with previously formed microstructural defects that cause nonlinearities in ultrasonic response. The quadratic dependence of the nonlinear wave excitation on the input ultrasonic signal amplitude is shown by numerical simulations, and such a nonlinear ultrasonic response is experimentally observed in the zone with a high density of microstructural defects.

1. Introduction

Ultrasonic testing (UT) has played a major role in the structural health monitoring (SHM) of various safety-critical structures. When a material is subjected to cyclic loading, it can lead to crack development, crack growth, and eventually structure failure. While ultrasound has been widely used for non-destructive testing, conventional ultrasound techniques are often limited by crack size and density—by the time the presence of cracks is detectable with such techniques, a structure may already have consumed 80–90% of its fatigue life and can be close to failure. Additionally, small cracks, sometimes termed micro-cracks or microstructural defects, can themselves compromise the mechanical strength and integrity of the structure [1]. As importantly, conventional ultrasonic techniques are also limited by the areal size and complexity of a structure, which makes comprehensive evaluation of real-world structures time-consuming, cumbersome, and incomplete [2,3].
Nonlinear effects take advantage of the fact that micro-cracks can often make up in numbers what they lack in size [4]. Typically, a micro-crack can have two ends, although more complex shapes are possible. Each end of a micro-crack typically has an acute angle which can result in stress concentration. Closing and opening of the cracks can result in local stiffness changes in the presence of ultrasonic excitation [5,6]. Common structural materials have second order elastic coefficients involved in linear scattering of ultrasonic waves and also have considerably smaller third order coefficients that can give rise to higher order scattering. Due to the relative size of the second and third order elastic coefficients, a smooth bore hole in a structure can have an insignificant nonlinear response. However, due to the combined effects of (i) stress buildup at crack ends and (ii) large numbers of micro-cracks, the aggregate nonlinear response of a field of micro-cracks can be substantial and readily detectable. Earlier studies show nonlinear ultrasonic testing (NUT) is able to detect plastic deformation or fatigue damage at an early stage [7,8,9,10].
Conventional guided wave approaches have limitations for large-area inspection. They can only be used in relatively uniform structures that support specific guided ultrasonic modes. In addition, a careful interpretation of the interaction of the selected modes with the structure is required to satisfy the phase matching condition [9,11]. In terms of mode analysis, mode identification for the guided wave generation condition has made NUT for complex structures challenging. In terms of the test system, inspection of a plate or a pipe using conventional approaches also relies on either specially designed angle beam transducers, magnetostrictive transducers (MSTs), PZT disk transducers, or arrays of such transducers [11]. The measurement setup with a large set of transducers is sometimes applicable to one geometry but not others due to different dispersion characteristics of different geometries. Restriction to specific geometries can render such approaches impractical for many SHM applications. Miniaci et al. has proposed a new type of sensor for use with nonlinear elastic wave spectroscopy (NEWS) [12]. They used photonic crystal (PC) structures in order to filter out undesired frequencies on a damaged aluminum plate. A complicated design of the host structure is generally required for the tuning of band gaps, and thus it prevents their use in real applications. There have also been many studies on the feasibility and value of the nonlinear elastic wave spectroscopy method with a time reversal process for microdamage imaging [13,14,15,16], which was accompanied by complex mathematical calculations.
This paper aims to overcome these limitations and develop nonlinear ultrasonic test in more practical manner for industry use by proposing a simple measurement system and analysis algorithm. The proposed method is in line with our previous multi-mode linear ultrasonic signal method [17] but has additional features to extract and analyze the nonlinear ultrasonic response from micro-cracks. In other words, this study demonstrates a new guided-wave NUT technique for micro-crack detection and monitoring by using nonlinear response of multi-mode guided wave ultrasonic signals, generated and received by single-element transducers and simple electronics [17]. When the multi-mode guided waves diffusely propagate through any physically-connected structure with arbitrarily complex geometry [18,19], all available guided wave modes in any interrogated zone of the structure are automatically down-selected by the medium through attenuation, dispersion, or filtering. Such remaining modes efficiently transfer energy (for example, to their second harmonic modes) when they encounter micro-cracks even in the case of irregular geometries. Thus, our proposed multi-mode ultrasonic inspection technique can be used to ultrasonically interrogate microstructural defects in an entire structure with virtually any complex geometry. Also, to avoid interference of nonlinearities in instrumentation this study generates and compares a pair of ultrasonic signals with two opposite phases for nonlinear response extraction. It enables the proposed method to analyze nonlinear ultrasonic response for micro-crack monitoring.
This manuscript is organized as follows: The analysis methodology and underlying theory used in this work are introduced in Section 2. Finite element simulations of multi-mode ultrasonic waves in a beam are presented in Section 3. This is followed by results of experimental studies in the beam in Section 4. Section 5 summarizes the results from both the numerical simulations and the experiments.

2. Analysis Methodology

2.1. Harmonic Generation and Pulse-Inversion Technique

The higher harmonic waves are generated when two conditions are satisfied: first, modal excitability given the selected transducer, andsecond, phase matching between the primary and its higher harmonics [5,20]. Once such conditions are satisfied, the amplitude of the nonlinear waves, U N L , increases for the second order interaction as
U N L β U L 2 x
where β is the ultrasonic nonlinearity, U L is the amplitude of the primary wave, and x is the length of the damaged zone in which the wave travels.
In principle, there are an infinite number of mode pairs that satisfy these conditions, and thus a careful modal analysis can be theoretically and experimentally performed. If the tested structure has a complex geometry (for example, involving an arbitrarily varying geometry such as multiple joints, anisotropic multi layers, etc.), selecting the relevant mode pairs becomes quite complicated, and might render such a nonlinear guided wave technique impractical.
Our proposed method generates multiple modes (both symmetric and antisymmetric modes) over a broad frequency range from small-area (length and width of the interrogated medium is much larger than lateral dimensions of transducer) single-element transducers with compressive excitation on the surface of the structure under test. Under such excitation, many guided wave modes with a wide range of frequencies, thus generated, are expected to strongly interact with micro-cracks (or, in general, microstructural defects) in the entire interrogated structure. To achieve broadband excitation, this study uses a chirp signal with linearly increasing frequency as an input source, written as
u i n ( t ) = ± A sin [ 2 π f min t + π ( f max f min ) t 2 / T d ]
where f min and f max are the minimum and maximum frequencies, respectively, T d is the duration of the chirp and A is the initial amplitude of the chirp. This linear chirp signal, thus injected perpendicular to the surface of the medium under test, diffusely propagates across the interrogated medium. The energy of the propagating multi-mode guided wave signal is transferred to the higher harmonic guided wave modes after interacting with micro-cracks. Such higher harmonics (so-called nonlinear guided waves) are used to assess the density of the micro-cracks in the entire interrogated zone. Since ultrasonic amplitudes at a specific site and strength of nonlinear interaction for a given microstructural defect cannot be accurately known in most situations, our proposed technique should be considered foremost as an initial, early-warning technique to determine the presence of early-stage microstructural defects such as micro-cracks in an inspection zone, which can be followed by a more systematic and quantitative examination for identifying defect types and obtaining detailed information on local distribution of defects.
The amplitude of the nonlinear guided waves can be much smaller than that of the linear primary waves [21]. To measure such small amplitude signals in the presence of much larger linear signals, a pulse-inversion technique can be used to remove the linear primary response signal and accentuate the nonlinear response signal. First, a base measurement is conducted where a signal of amplitude [A] is excited in a medium with a certain phase. It is followed by a second measurement having the same amplitude but opposite polarity [-A] as compared to the first measurement. The base measurement xb(t) and the inverted measurement xi(t) are recorded in the time domain. Due to hardware artifacts, in practice the two measurements may not have identical amplitudes. To improve estimation of the non-linear response, two signals, x b ( t ) and x i ( t ) , are normalized by the maximum amplitude, A max as
x ˜ i , b ( t ) = x i , b ( t ) / A max .
Finally, x ˜ b ( t ) and x ˜ i ( t ) can be summed together, resulting in cancellation of their linear components (which have opposite polarity) and reinforcement of their quadratic components (which have the same polarity), as shown in Table 1.

2.2. Estimation of Nonlinear Response Due to Microstructural Defects

In the previous section, a pulse-inversion technique is shown to nominally remove the linear response from the overall response, thus revealing the nonlinear response in the recorded signal. Using this technique, the nonlinear response x N L ( t ) is generated n times with n different input amplitudes to estimate β in Equation (1). These n different time domain signals x n N L ( t ) are, then, subtracted from the baseline time domain signal x 0 N L ( t ) generated by the lowest input amplitude. The resulting difference signal y n ( t ) is calculated as
y n ( t ) = x 0 N L ( t ) x n N L ( t ) .
The n-th difference signal, y n ( t ) , is transformed into a two-dimensional contour map, using short time Fourier transform (STFT) [22]. STFT of a discrete time domain signal y n ( t ) of length N is defined as
Y n ( t , f ) = m = 0 N 1 y n ( m ) ω ( m t ) e j 2 π f m / M ,
where ω ( t ) is a Hamming window function of length M < N, and the frequency index f [22]. This study utilizes multiple frequency ultrasonic signals, and STFT is used to measure the nonlinear response of micro-cracks at each frequency. Analysis of difference signals in joint time and frequency domains using STFT can provide sufficient temporal and spectral information in the absence of a more detailed complex modal analysis.
Next, the standard deviation, σ n ( f ) , of the power intensity in Y n ( t , f ) . is calculated over the investigation time at different frequencies. By summing over all frequency components of σ n ( f ) and normalizing the sum, the microstructural defect response (MDR) is obtained as
M D R n = [ k = 1 F σ n ( f k ) ] F ,
where F is the number of discretized frequencies. MDR is calculated n times and is then used to calculate actionable output (AO) which represents the proportionality of MDR to the square of the input amplitude. In the following sections, we will discuss how AO is calculated and how it is related to the density of microstructural defects (or, specifically the micro-crack density in the case of a steel beam sample examined in this study) in detail.

3. Numerical Simulations by Finite Element Method

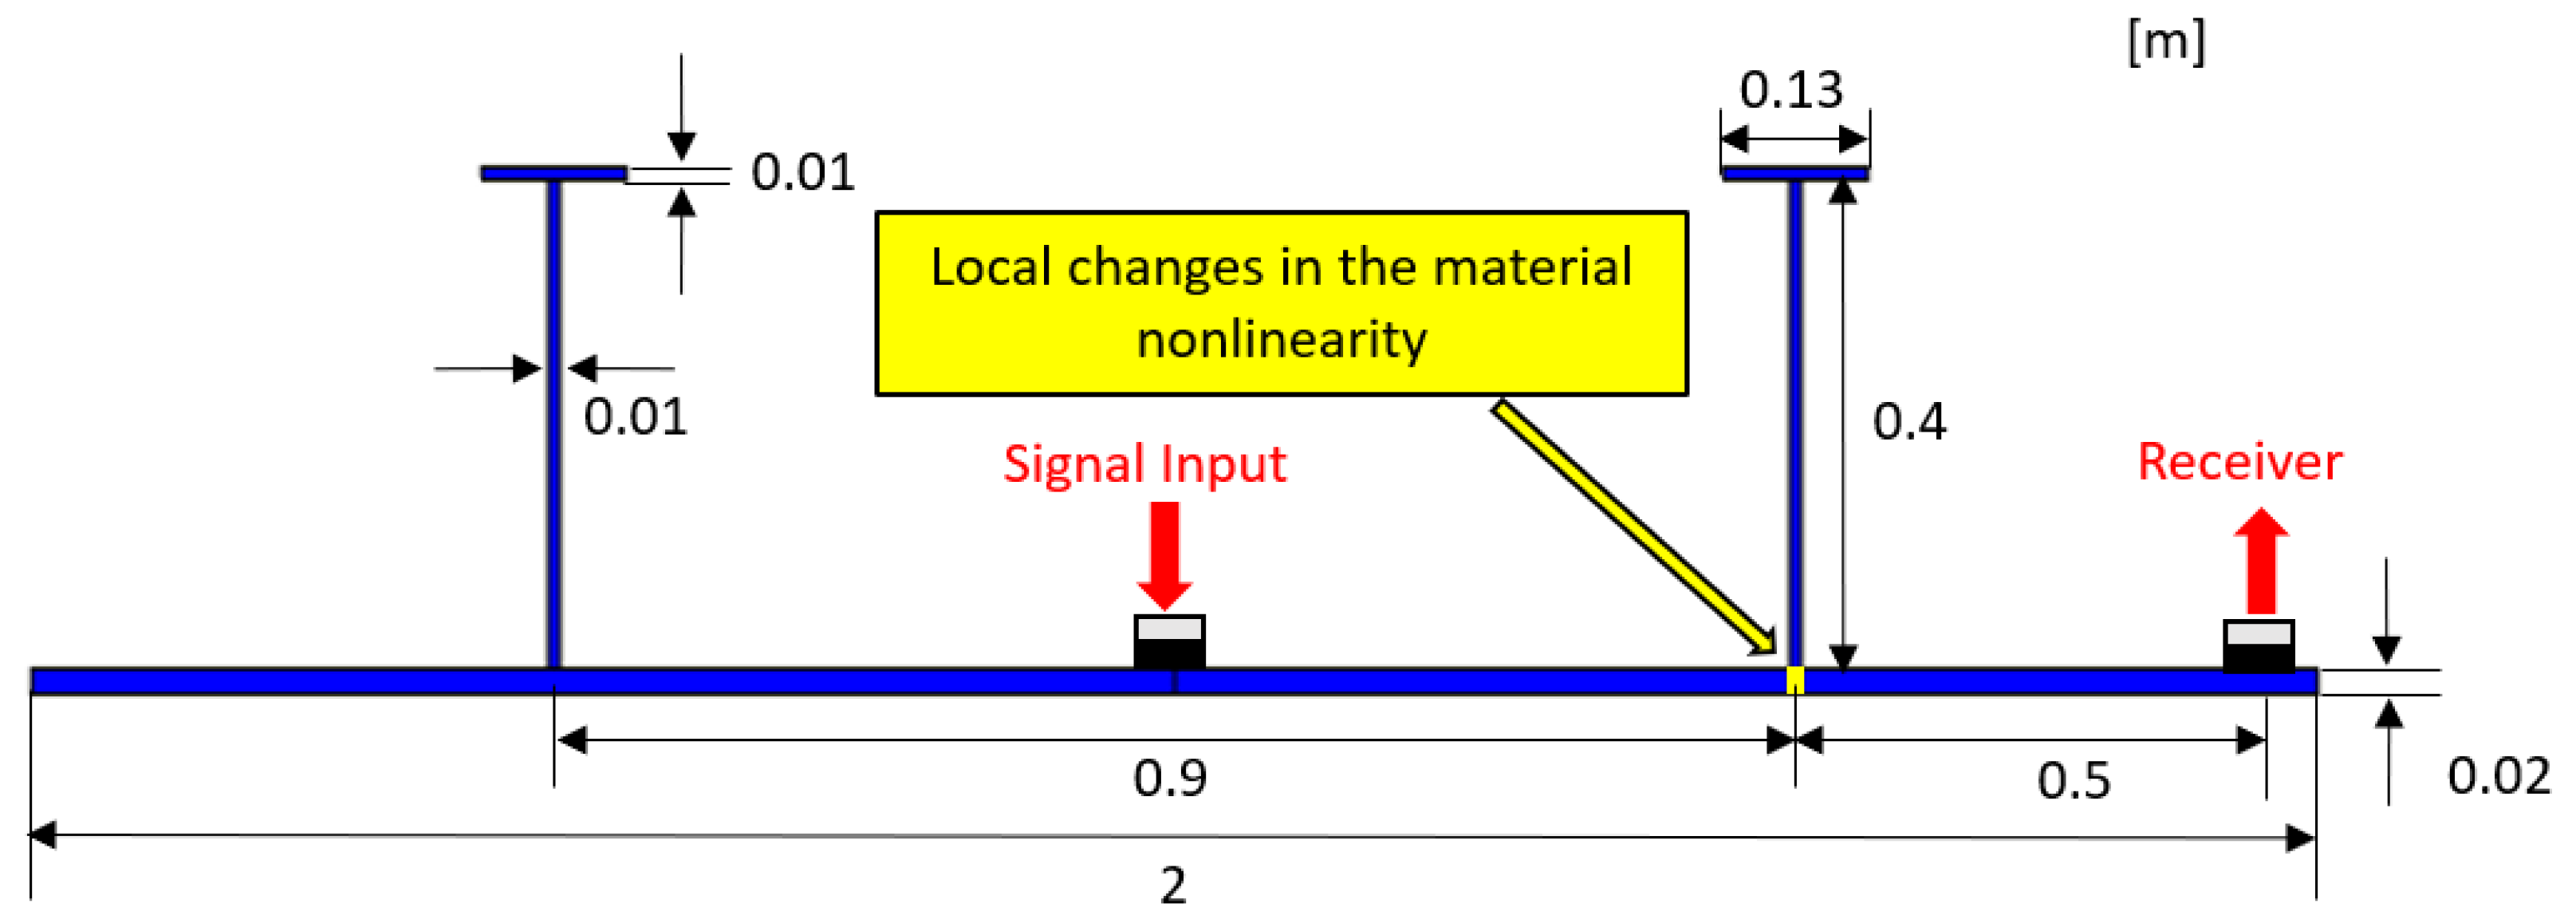
3.1. Model Definition & Simulation Procedures

In this study, a beam assembly sample, made of A36 carbon steel and including induced micro-cracks, is used, as shown in Figure 1. In order to create micro-cracks in the sample, a mechanical oscillator is attached to the free end of the sample to apply a cyclic load. As shown in Figure 1, the mechanical oscillator produces cyclic excitation load by a rotation of an un-balanced disk driven by an electrical motor. Such a load is applied until visibly large micro-cracks are created near the welds at T-joints.
For numerical studies, this beam assembly is modeled in the two-dimensional finite element method (FEM) simulations, using COMSOL Multiphysics 5.6. Figure 2 shows the dimensions of the beam and the transducer locations. For simplicity, the material microstructural defect density is initially assumed to be uniform across a joint as shown in Figure 1, and the corresponding local material nonlinearity is applied over 200 mm2 across that joint. The material properties of the beam are summarized in Table 2.
The linear chirp input from 20 kHz to 110 kHz with 0.5 ms duration is injected in the middle (center of mass) of the beam. The initial displacement amplitude, A, varies as 0.15, 0.3, 0.6, and 1.2 µm, respectively. The maximum mesh size is 1/10 of the smallest expected guided wave length (1.76 mm), and 0.2 µs is chosen as the time step [23]. Three different local material nonlinearities are assigned in the area marked in yellow in Figure 2, using Murnaghan coefficients m and l. The three different local material nonlinearities are denoted as β 0 , β 1 , and β 2 , respectively, and the corresponding Murnaghan coefficients are listed in Table 3.

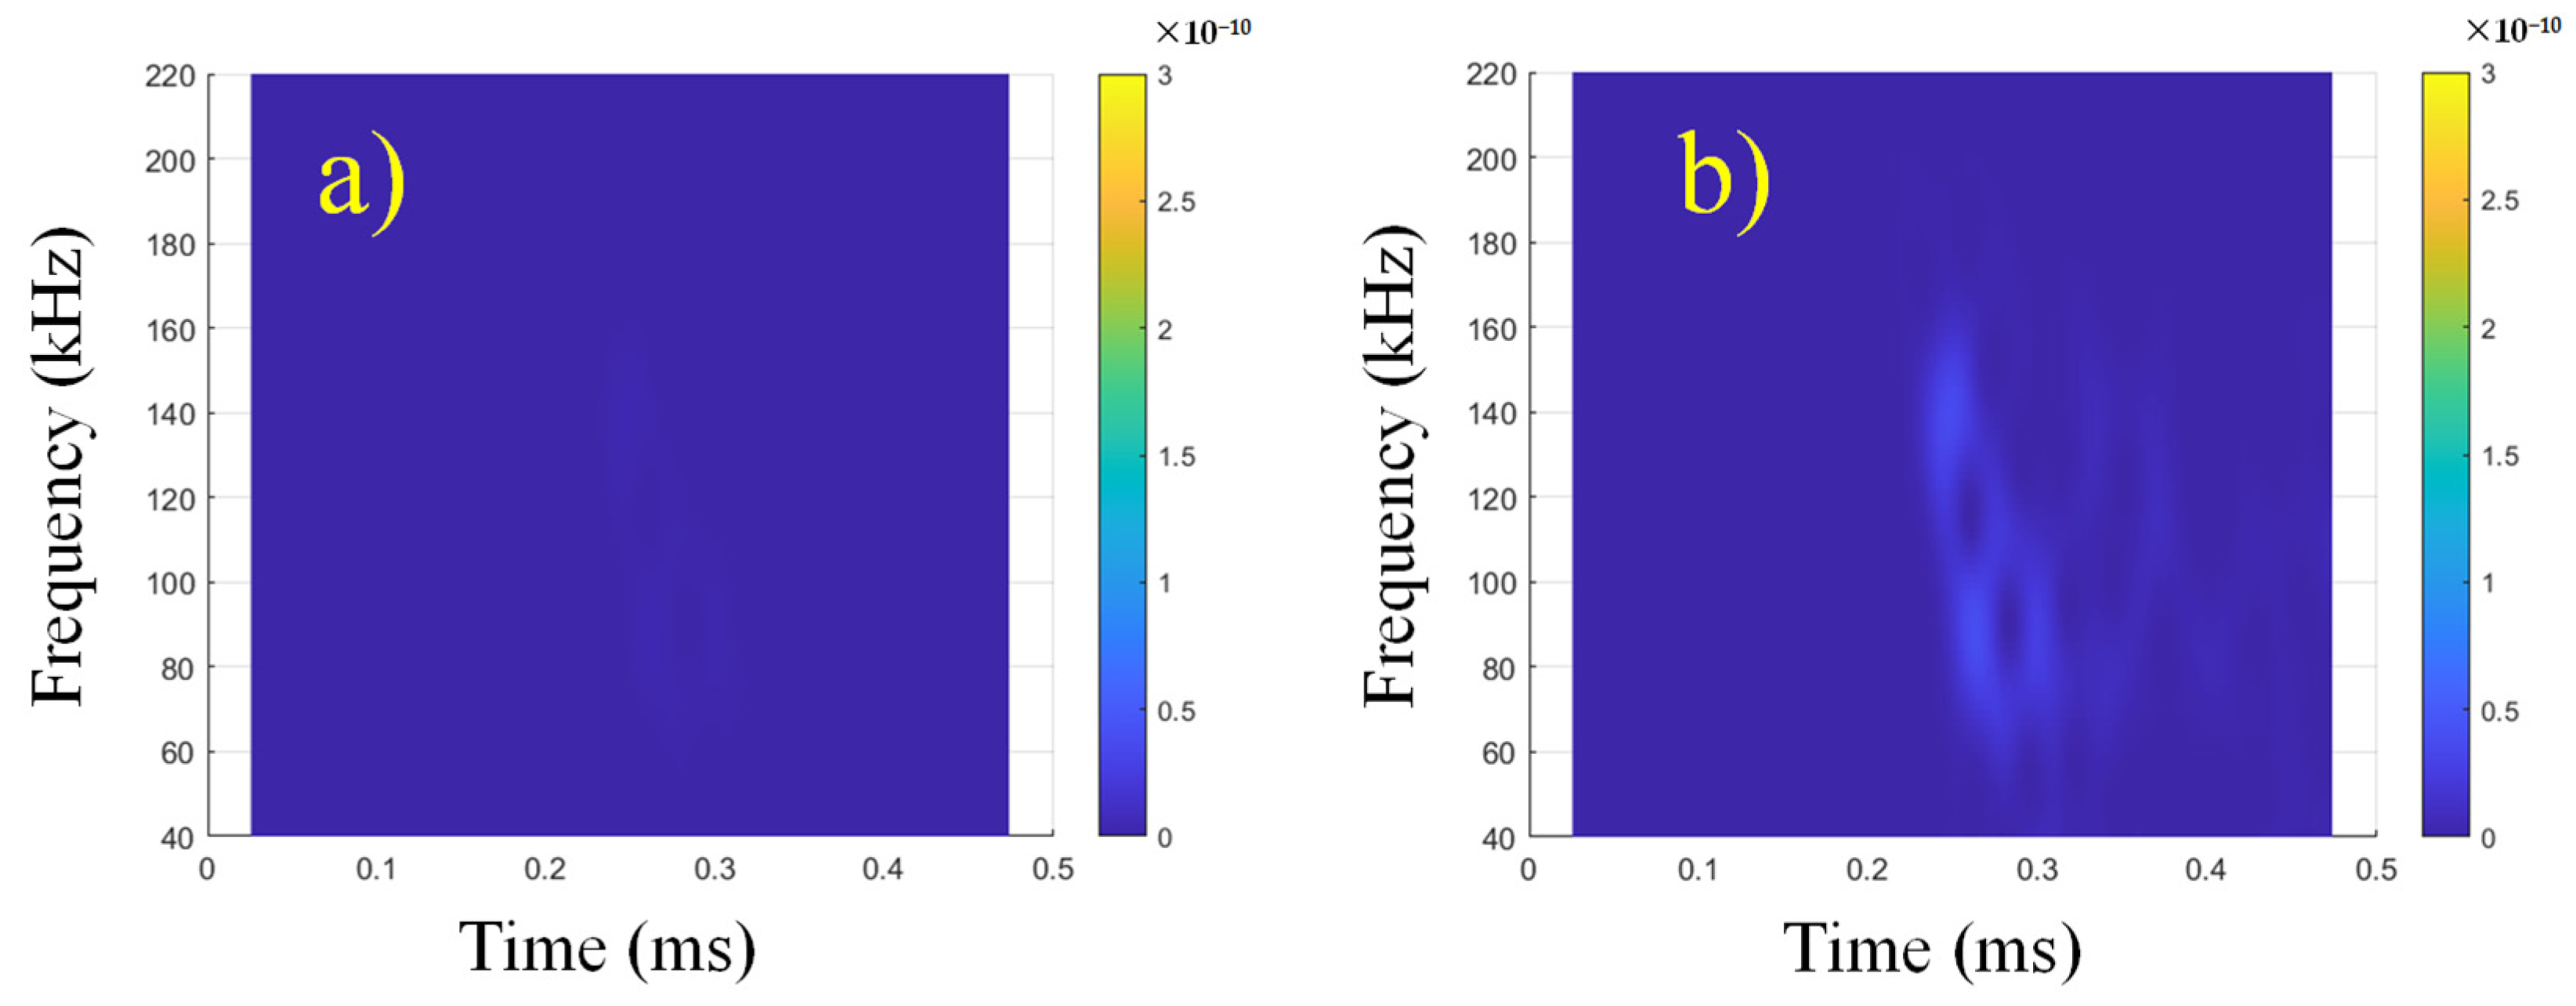
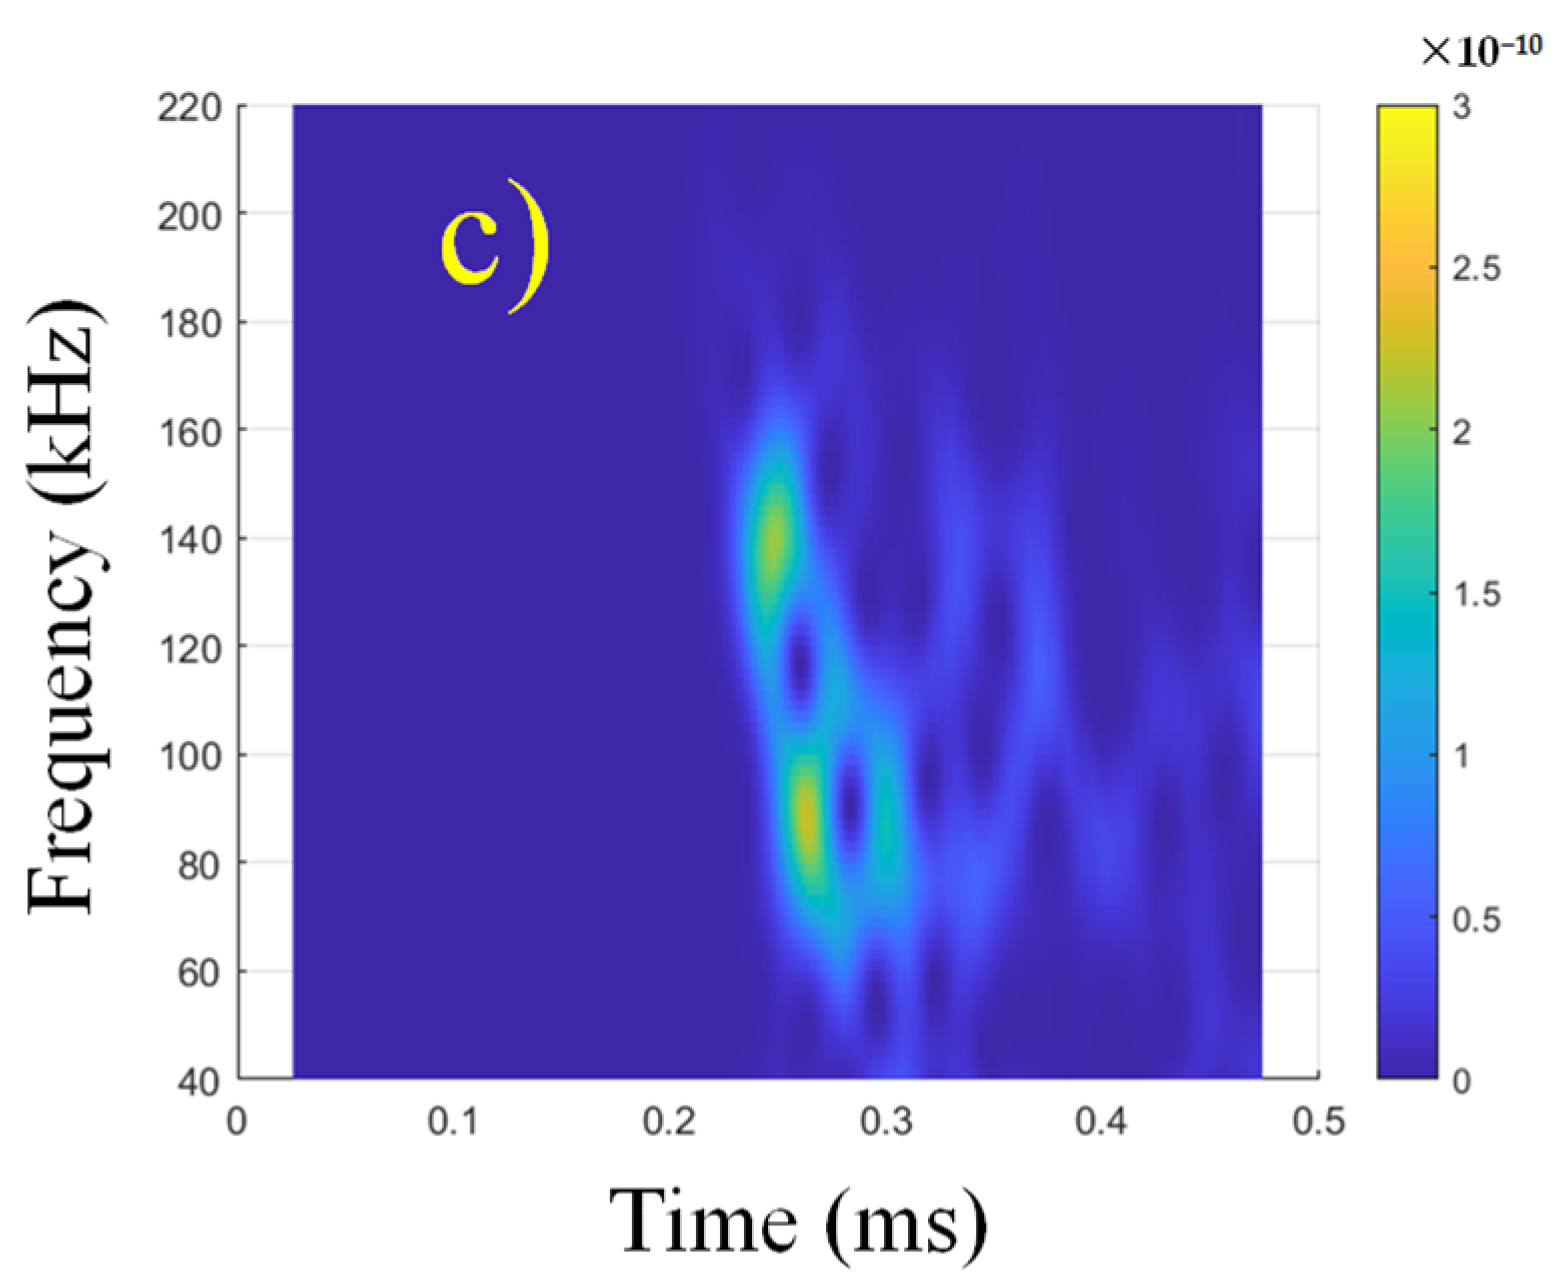
3.2. Simulation Results

Figure 3 shows an example of amplitudes using the pulse-inversion technique. Two receiver time domain signals with 180° phase difference are presented in Figure 3a, and their residual nonlinear wave is shown in Figure 3b. The residual nonlinear wave signals are then compared with that obtained using the lowest input amplitude. Figure 4 shows the spectrogram of Y(t, f) defined in Equation (5). These examples show that the spectral and time-domain energy spectra are significantly increased when the larger-amplitude signal is injected in the beam.
To estimate simulated micro-crack effect, the single scalar quantity MDR is calculated using Equation (6) as a function of square of the input amplitude. Finally, a slope of the linear interpolation line, AO, from the MDR plot is used to quantitatively correlate AO to micro-crack strength.
Figure 5 shows variations of MDR as a function of square of the input amplitude, using three different local material nonlinearities. MDR plots with β 0 , β 1 , and β 2 yield AO values of 6 × 10⁻¹⁴, 3 × 10⁻¹², and 9 × 10⁻¹², respectively. In the simulations, when the level of material nonlinearity increases, even in a small area compared to the size of the entire beam, the proposed parameter AO sensitively detects such an increase.

4. Experimental Studies of Microstructural Defect Detection Using Multimode Ultrasonic Signals

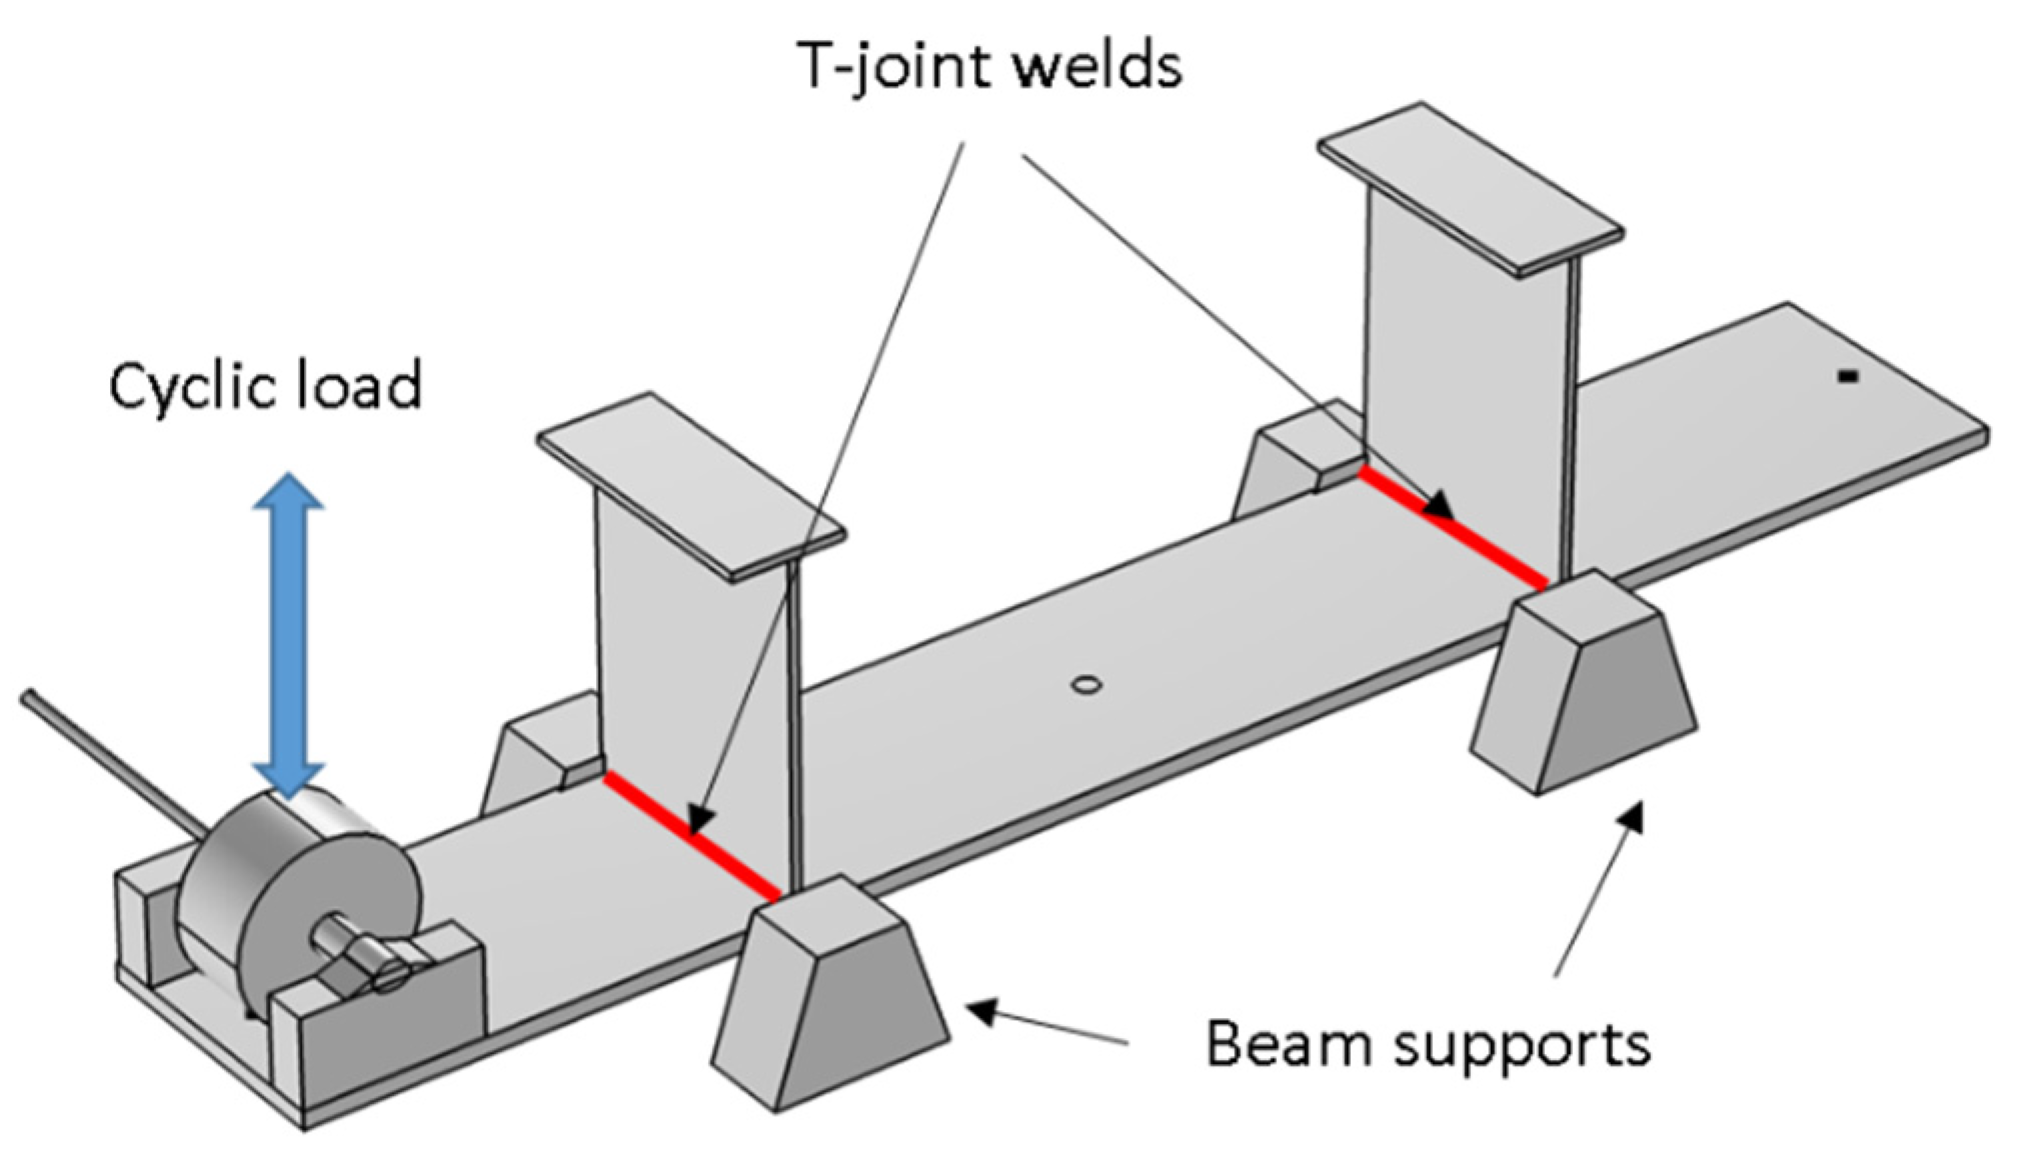
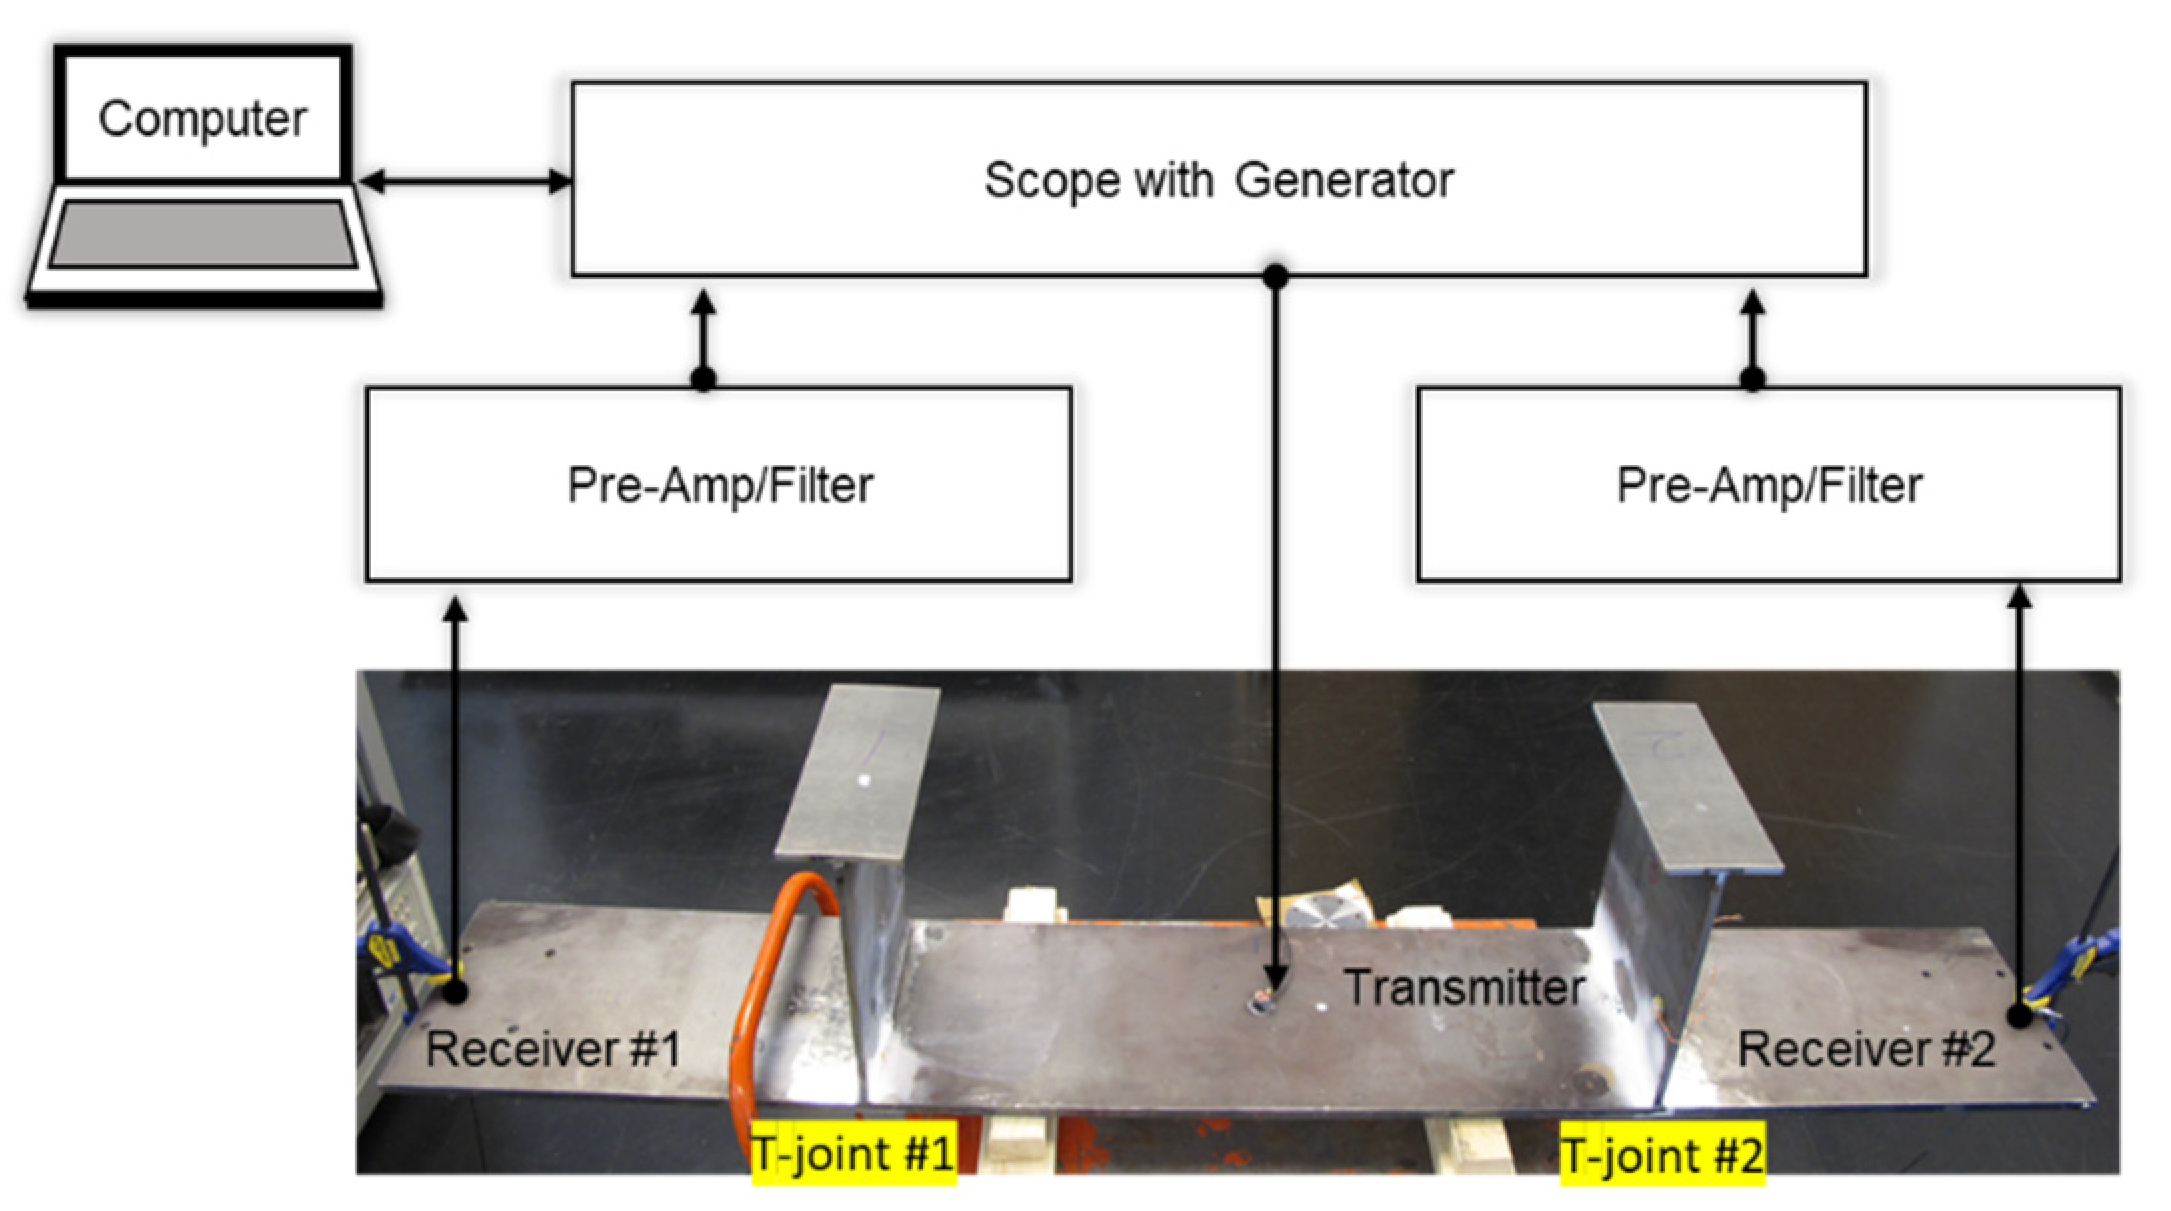
4.1. Experimental Setup and 1st Test

In this section, the proposed multi-mode nonlinear guided wave excitation and detection method is experimentally demonstrated on the beam that was modeled and numerically simulated in the previous section. The beam assembly sample under test is fabricated with induced micro-cracks as described in Figure 1 and Section 3. Micro-racks are concentrated near T-joints.
Figure 6 shows the first experimental setup for the measurements. The beam assembly used for the first test has the cross-sectional dimensions shown in Figure 2. The width of the beam is 0.3 m. For this experiment, three half-inch diameter broadband piezoelectric contact transducers (V103, PanametricsTM) are attached, as shown in Figure 2. A function generator within an oscilloscope (Handyscope HS5, TiePie) excites a compressional wave signal for 0.5 ms using the Transmitter transducer placed in the middle. The compressional wave signal is a 20–110 kHz linear chirp with a varying peak-to-peak voltage of 0.75, 1.5, 3.0, 6, and 12 V, respectively.
The other two transducers are used to receive the out-of-plane displacement of the transmitted ultrasonic signals that has traveled through welds at T-joints. Such displacement signals are recorded for 0.5 ms. The received ultrasonic signal is then amplified by a low noise preamplifier (SR560, Stanford Research Systems).
As summarized in Section 2, the base measurement is conducted for both measurement zones containing the T-joints, and its phase inverted signal is consecutively measured. Then, steps (3) through (6) are performed to estimate AO for both sides. It should be noted that the beam has concentrated micro-cracks near the welds at T-joints with a higher density of micro-cracks at T-joint #2, on the right-hand side of the beam as shown in Figure 6.

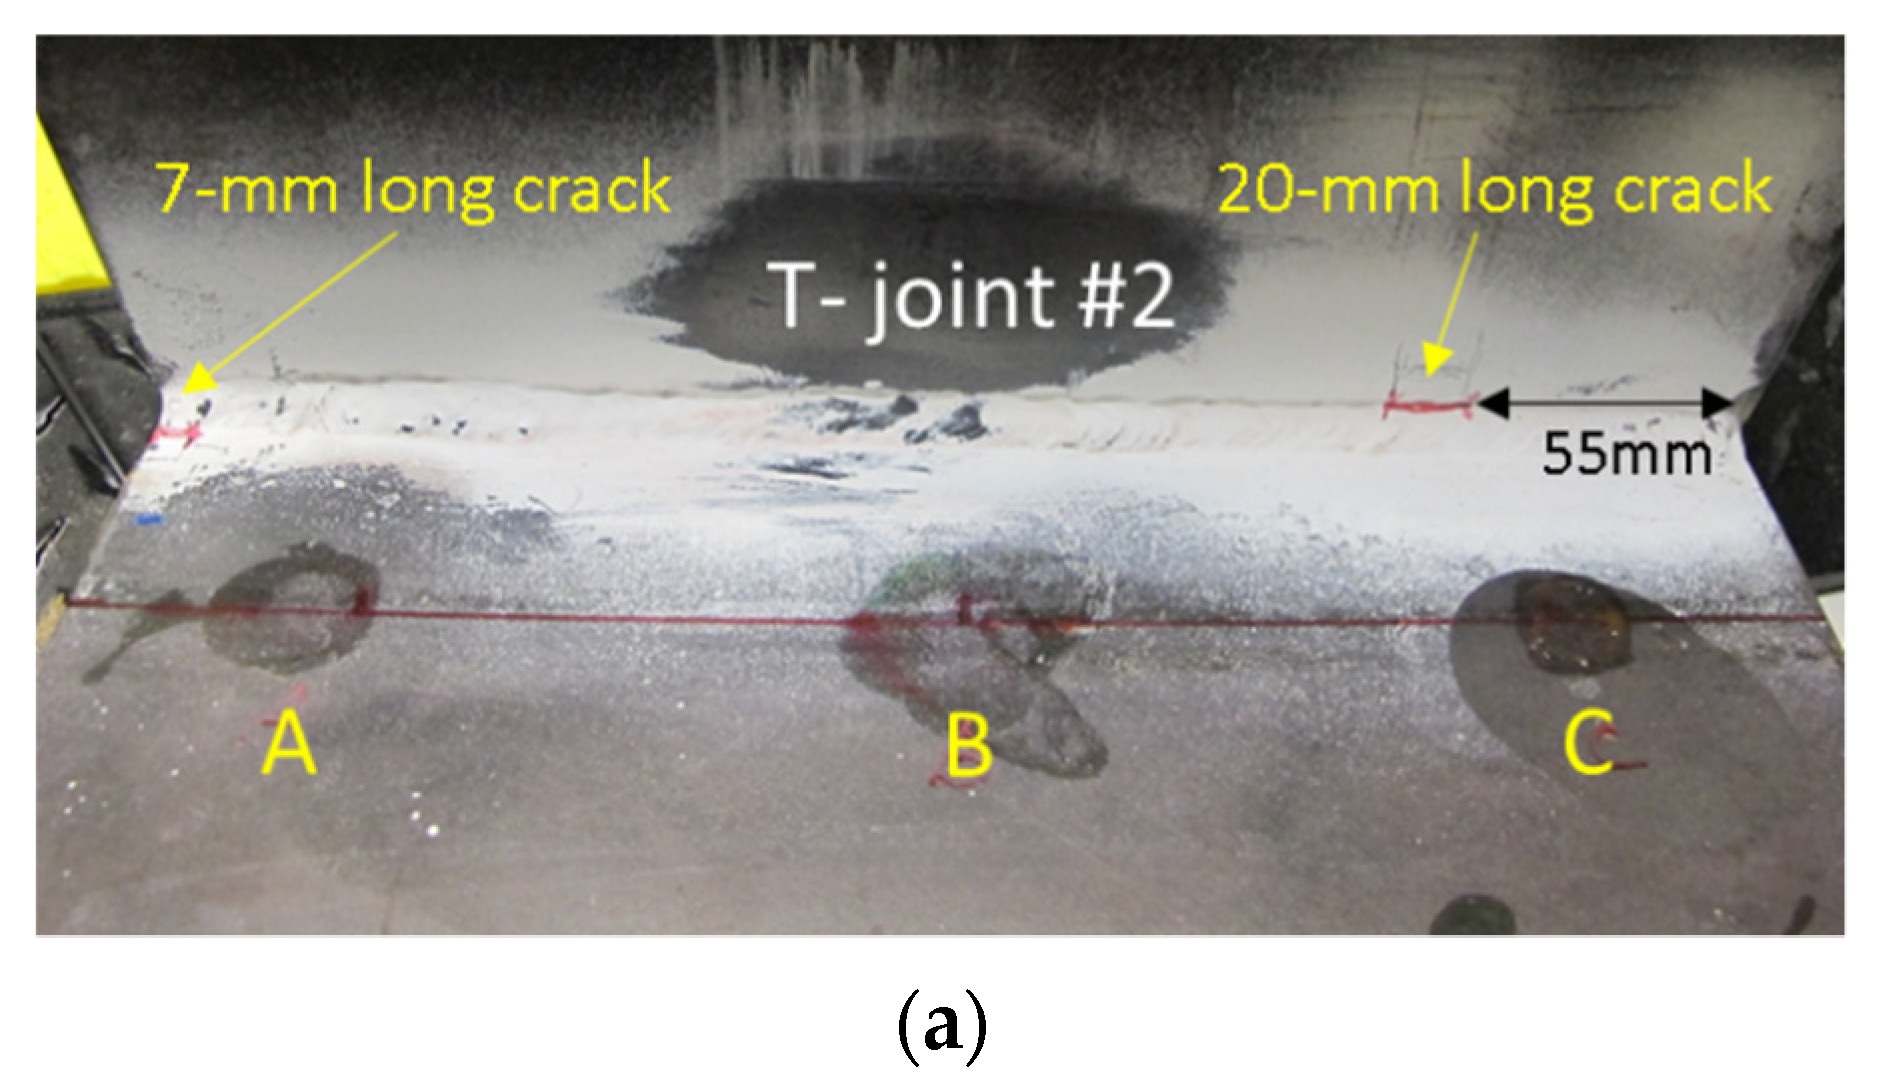
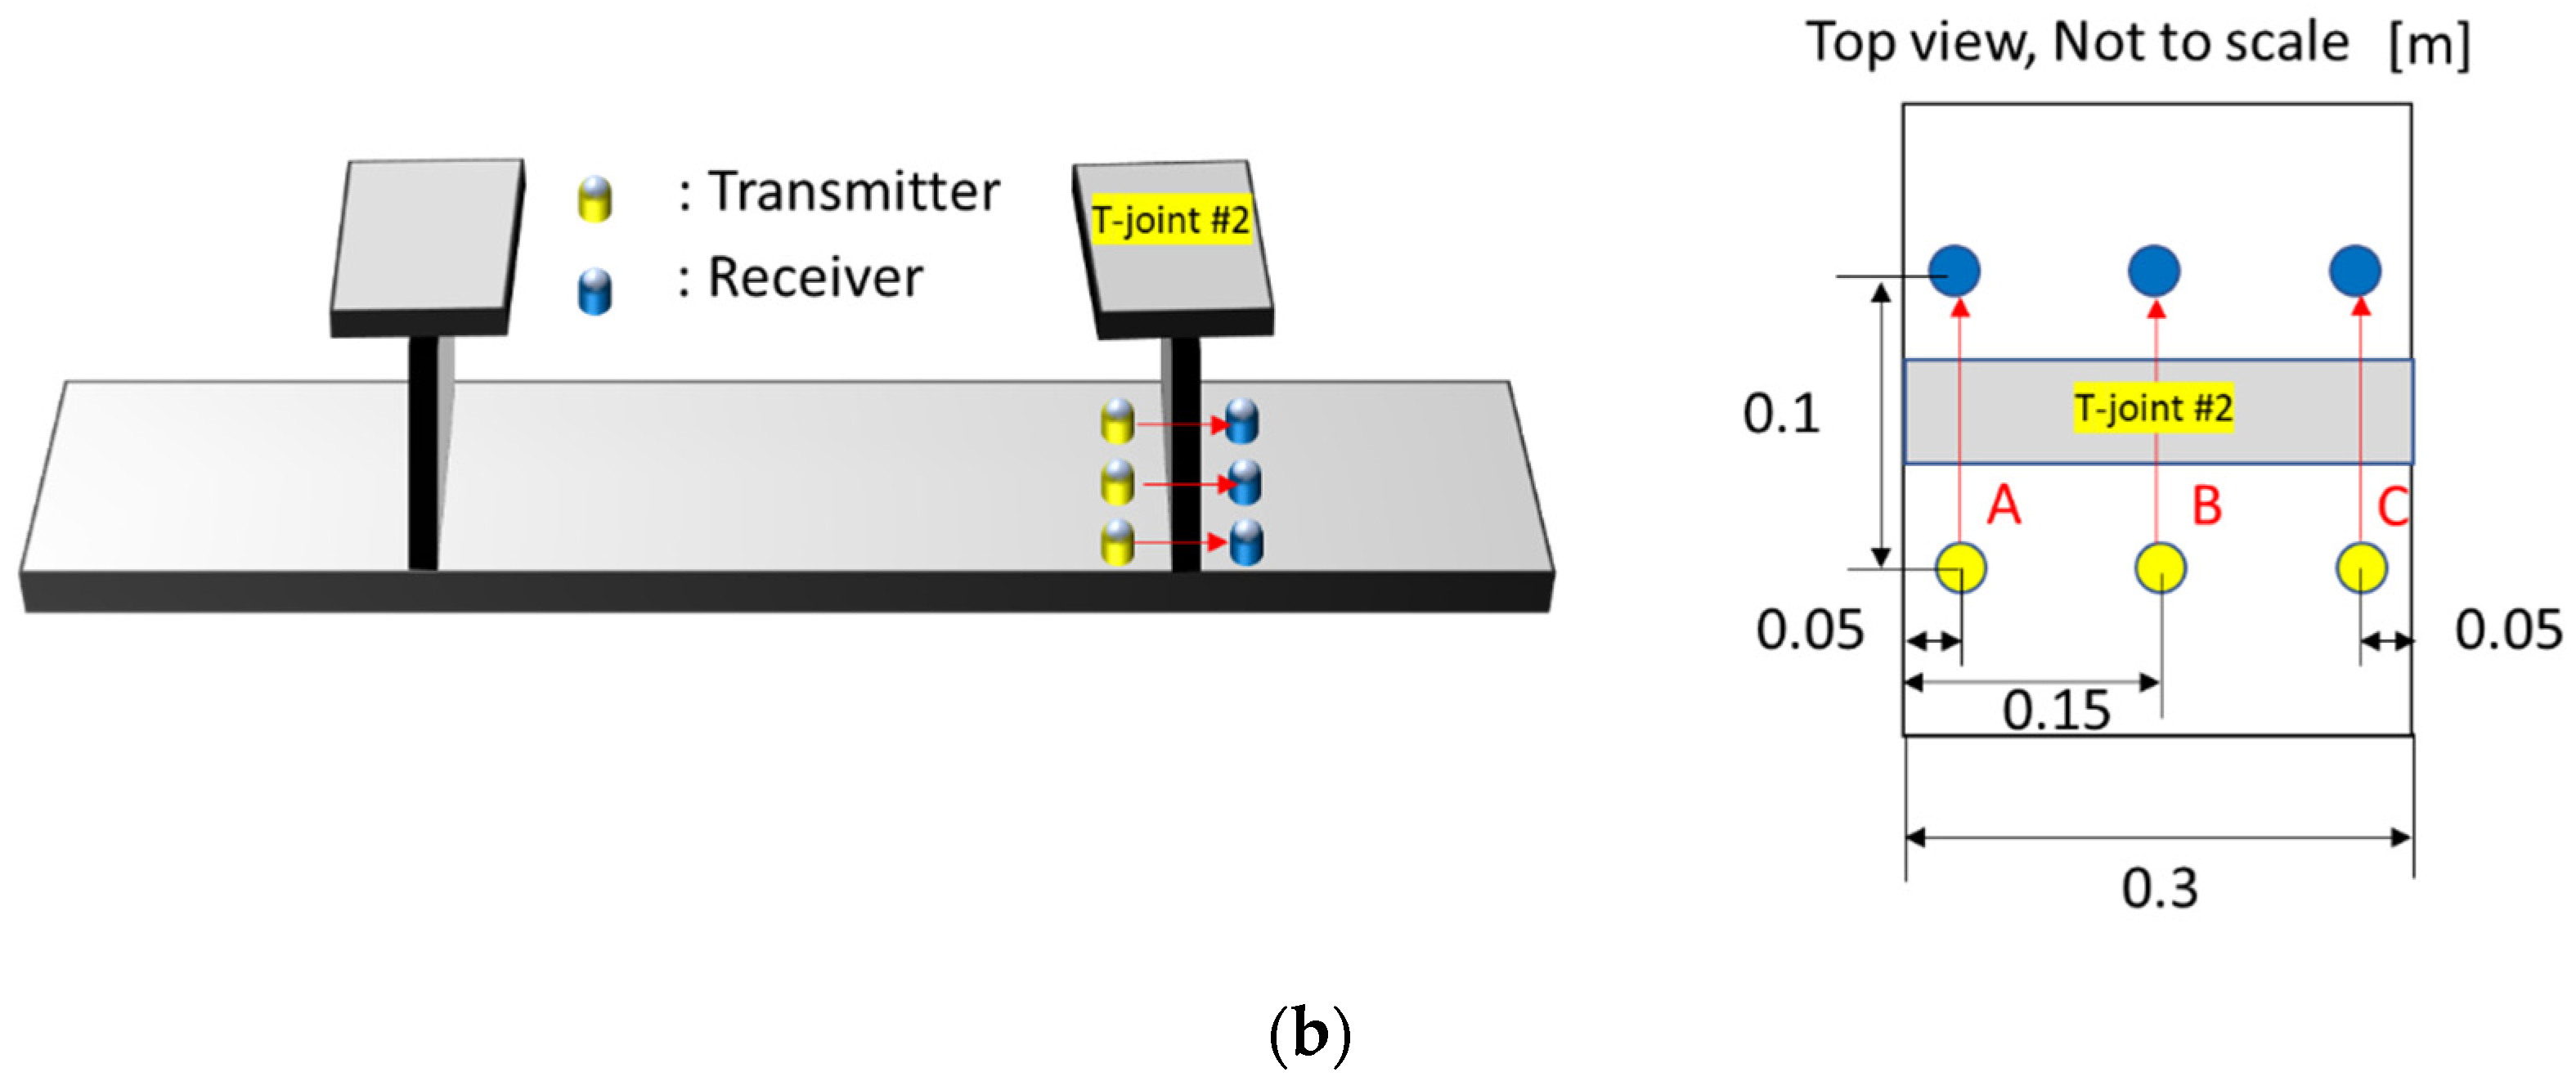
4.2. 2nd Test in the Proximity of the Microstructural Defects across T-Joint #2

As a second test, we performed additional measurements in the proximity of concentrated micro-cracks along T-joint #2. In this case, the signals are recorded for 0.15 ms due to the short propagation distances. According to a previous magnetic particle examination test (ASTM E709) report for T-joint #2, most micro-cracks are located along the welds near the supports across T-joints. Also, Figure 7a shows two noticeable macro-cracks which are 7 and 20-mm long, respectively at T-joint #2.
For this second test, the AO is investigated at three different locations using three pairs of transducers, (A), (B) and (C), as shown in Figure 7b. The distance between a transmitter and a receiver is approximately 100 mm for each pair.

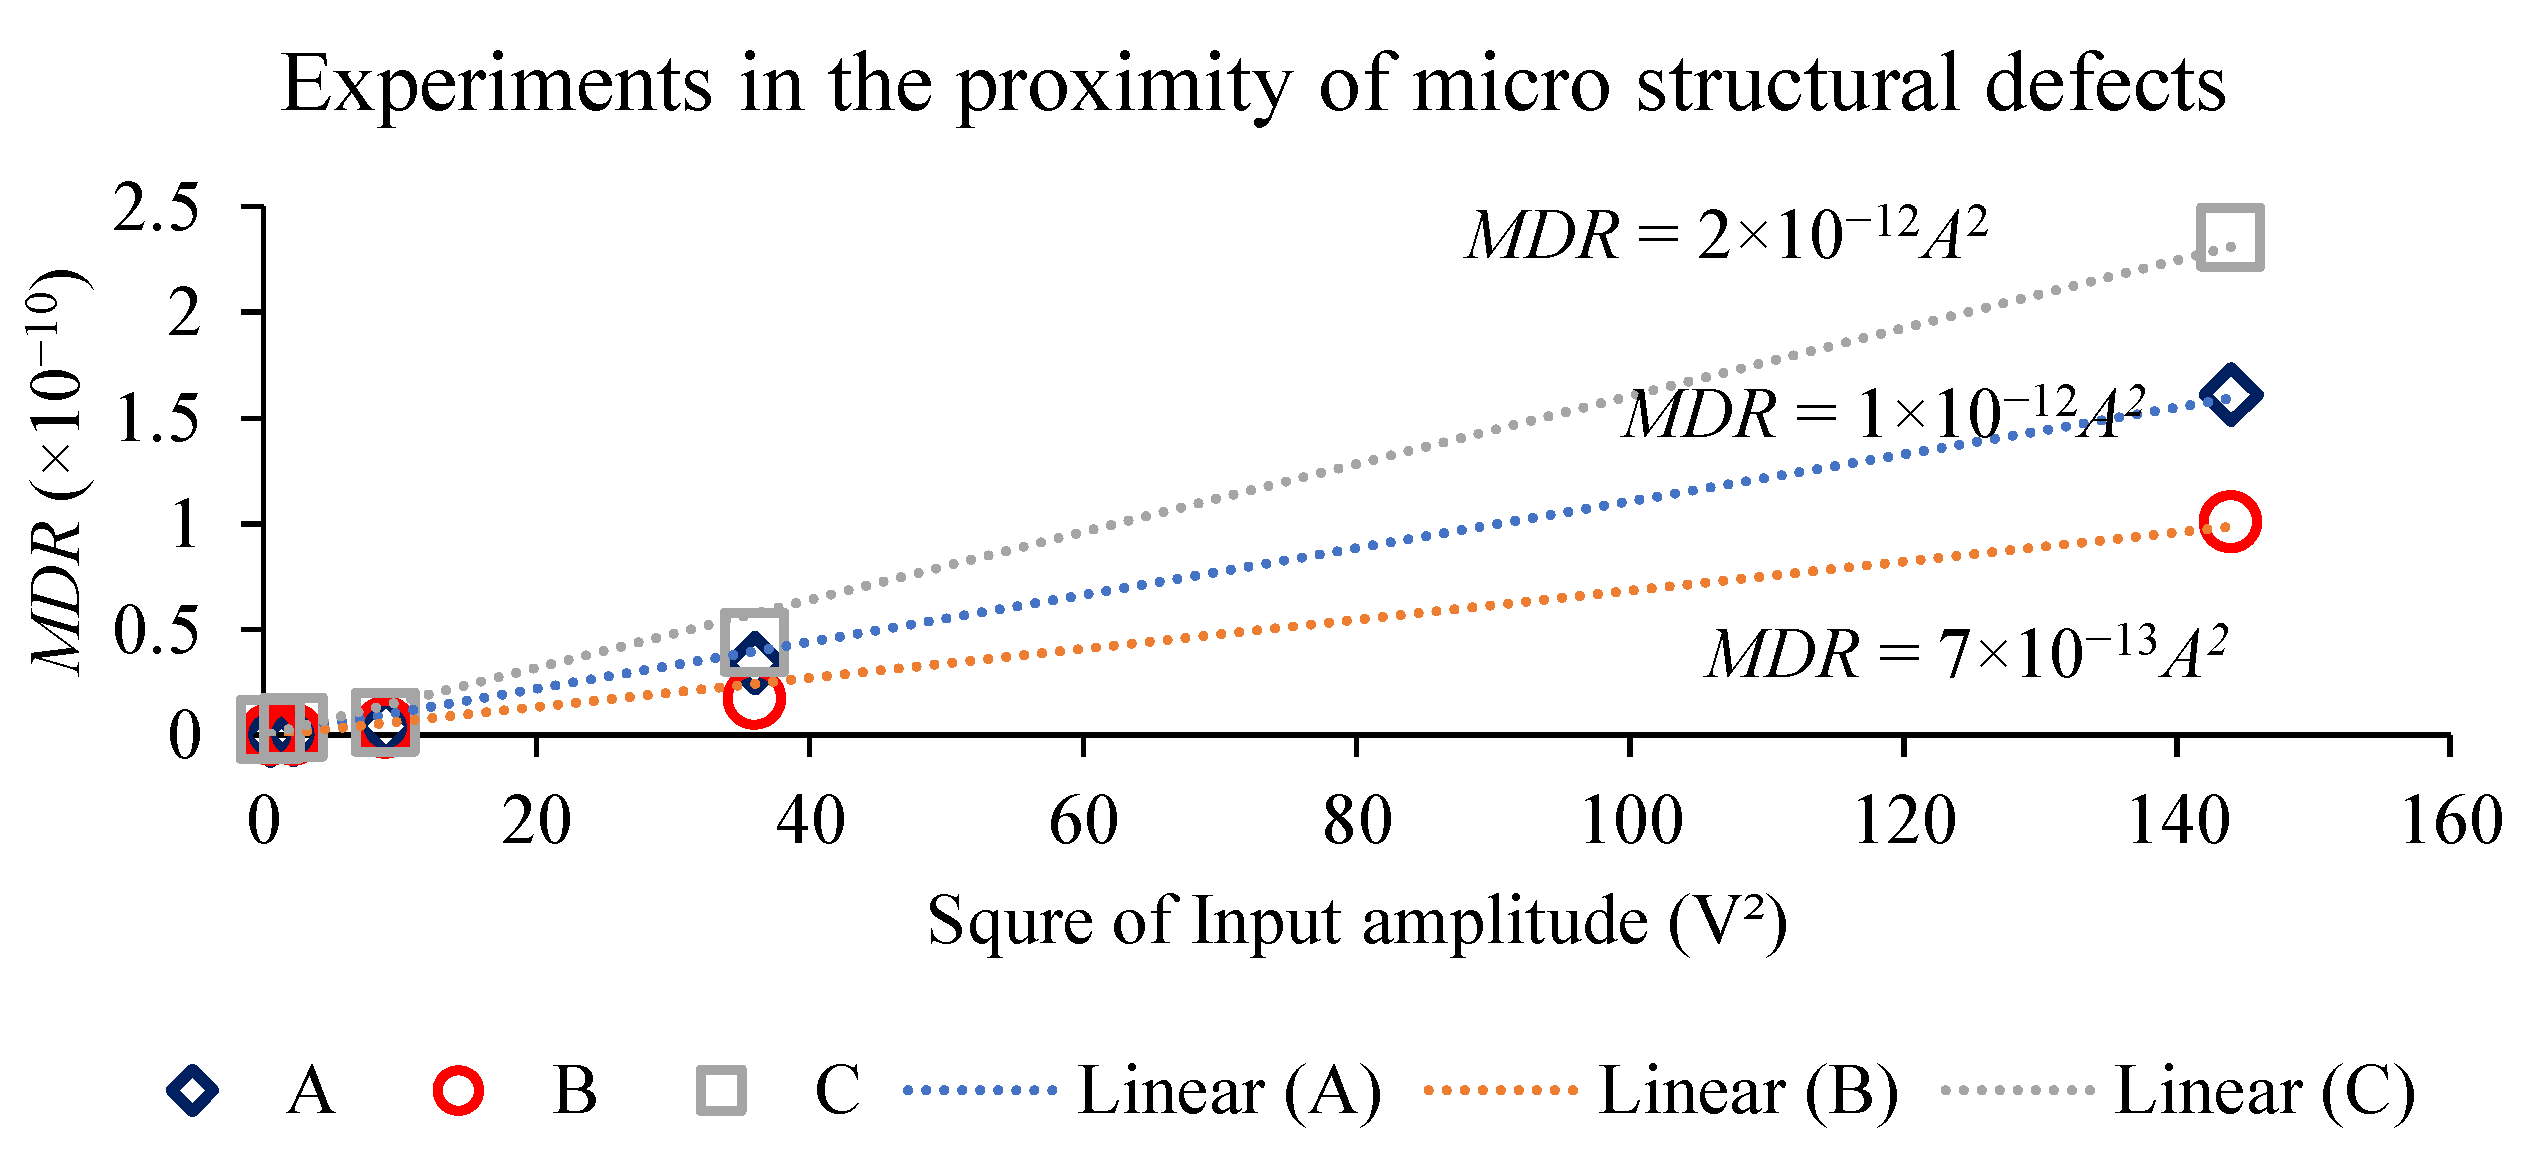
4.3. Experimental Results

As discussed in Section 2 and Section 3, the amplitude of the nonlinear acoustic response is directly correlated with the material nonlinearity in the interrogated zone. The material nonlinearity in these experiments is attributed to the presence of microstructural defects, namely micro-cracks. Figure 8 shows a rough estimation of such micro-crack density through the calculation of MDR with respect to square of the input amplitude. We note that a more precise quantitative estimation, such as identification of defect types and determination of local density of such defects, is beyond the scope of this work.
As shown in Figure 8, the zone defined by the region between the transmitter and receiver #2, which includes T-joint #2 yields nine times larger AO than that of the zone defined by the region between the transmitter and receiver #1, which includes T-joint #1. This dependence confirms that high micro-crack density leads to correspondingly large nonlinear response.
In Figure 9, MDR values are given for three different locations (defined by (A), (B), and (C) transducer pairs), as shown in Figure 7b. The MDR with respect to square of increasing input amplitudes yields three AOs calculated at three different locations. The measured AO exhibits sensitivity to detect microstructural defects created along T-joint #2. AOs measured at (A) and (C) are approximately 2.9 and 1.4 times larger, respectively, than AO at (B), confirming that stresses were concentrated at the locations of beam supports while inducing defects, and more microstructural defects were formed at the lateral-ends of the welds, at (A) and (C).
The results shown in Figure 8 and Figure 9 indicate that AO and MDR obtained by our simple analysis provide sufficient sensitivity to detect relative magnitude of micro-crack densities in this experimental configuration.
This work has been limited to studying the nonlinear ultrasonic response of a beam with existing induced microstructural defects. Further investigations would benefit from introducing microstructural defects controllably and cross-correlating the type and density of such defects with the ultrasonic nonlinear response of this method.

5. Summary and Conclusions

In this manuscript, we proposed a new nonlinear guided wave technique to nondestructively determine the presence of microstructural defects in a large-area structure with complex geometry. This study utilized multi-mode and broadband ultrasonic signals, single-element transducers, and simple electronics. To demonstrate the feasibility and effectiveness of the proposed large-area inspection technique, FEM simulations and experimental measurements are performed. The numerical simulations show that spectral response of nonlinear waves can be used to sensitively detect nonlinearities due to microstructural defects, even if they are concentrated in relatively small areas of a large-area inspection zone with geometric complexity. The experimental results are broadly consistent with numerical simulation results, indicating that the proposed method can be implemented for semi-quantitative detection or early warning indication of microstructural defects in complex, large-area structures.

Author Contributions

Formal analysis, investigation, writing—original draft, T.J.; conceptualization, writing-reviewing and editing, A.T.F. All authors have read and agreed to the published version of the manuscript.

Funding

This research received no external funding.

Institutional Review Board Statement

Not applicable.

Informed Consent Statement

Not applicable.

Data Availability Statement

Not applicable.

Acknowledgments

This work was supported by Los Alamos National Laboratory.

Conflicts of Interest

The authors declare no conflict of interest.

References

  1. Lissenden, C.J.; Liu, Y.; Rose, J.L. Use of non-linear ultrasonic guided waves for early damage detection. Insight-Non-Destr. Test. Cond. Monit. 2015, 57, 206–211. [Google Scholar] [CrossRef]
  2. Olisa, S.C.; Khan, M.A.; Starr, A. Review of Current Guided Wave Ultrasonic Testing (GWUT) Limitations and Future Directions. Sensors 2021, 21, 811. [Google Scholar] [CrossRef] [PubMed]
  3. Lowe, M.J.S.; Cawley, P. Long Range Guided Wave Inspection Usage–Current Commercial Capabilities and Research Directions; Department of Mechanical Engineering, Imperial College London: London, UK, 2006; pp. 1–40. [Google Scholar]
  4. Naugolʹnych, K.A.; Ostrovsky, L.A. Nonlinear Wave Processes in Acoustics; Cambridge University Press: Cambridge, UK, 1998; ISBN 052139984X. [Google Scholar]
  5. Wan, X.; Tse, P.W.; Xu, G.H.; Tao, T.F.; Zhang, Q. Analytical and numerical studies of approximate phase velocity matching based nonlinear S0 mode Lamb waves for the detection of evenly distributed microstructural changes. Smart Mater. Struct. 2016, 25, 045023. [Google Scholar] [CrossRef] [Green Version]
  6. Yang, Y.; Ng, C.-T.; Kotousov, A. Influence of crack opening and incident wave angle on second harmonic generation of Lamb waves. Smart Mater. Struct. 2018, 27, 055013. [Google Scholar] [CrossRef] [Green Version]
  7. Ju, T.; Achenbach, J.D.; Jacobs, L.J.; Guimaraes, M.; Qu, J. Ultrasonic nondestructive evaluation of alkali–silica reaction damage in concrete prism samples. Mater. Struct. Constr. 2016, 50, 60. [Google Scholar] [CrossRef]
  8. Ju, T.; Achenbach, J.D.; Jacobs, L.J.; Qu, J. One-way mixing of collinear waves in an adhesive layer. J. Acoust. Soc. Am. 2019, 145, 110–120. [Google Scholar] [CrossRef] [PubMed]
  9. Li, W.; Deng, M.; Cho, Y. Cumulative Second Harmonic Generation of Ultrasonic Guided Waves Propagation in Tube-Like Structure. J. Comput. Acoust. 2016, 24, 1650011. [Google Scholar] [CrossRef]
  10. Sun, X.; Shui, G.; Zhao, Y.; Liu, W.; Hu, N.; Deng, M. Evaluation of early stage local plastic damage induced by bending using quasi-static component of Lamb waves. NDT E Int. 2020, 116, 102332. [Google Scholar] [CrossRef]
  11. Chillara, V.K.; Lissenden, C.J. Review of nonlinear ultrasonic guided wave nondestructive evaluation: Theory, numerics, and experiments. Opt. Eng. 2015, 55, 011002. [Google Scholar] [CrossRef]
  12. Miniaci, M.; Gliozzi, A.S.; Morvan, B.; Krushynska, A.; Bosia, F.; Scalerandi, M.; Pugno, N.M. Proof of concept for an ultrasensitive technique to detect and localize sources of elastic nonlinearity using phononic crystals. Phys. Rev. Lett. 2017, 118, 214301. [Google Scholar] [CrossRef] [PubMed] [Green Version]
  13. Goursolle, T.; Callé, S.; Dos Santos, S.; Bou Matar, O. A two-dimensional pseudospectral model for time reversal and nonlinear elastic wave spectroscopy. J. Acoust. Soc. Am. 2007, 122, 3220–3229. [Google Scholar] [CrossRef] [PubMed]
  14. Miniaci, M.; Mazzotti, M.; Radzieński, M.; Kudela, P.; Kherraz, N.; Bosia, F.; Pugno, N.M.; Ostachowicz, W. Application of a laser-based time reversal algorithm for impact localization in a stiffened aluminum plate. Front. Mater. 2019, 6, 30. [Google Scholar] [CrossRef]
  15. Ulrich, T.J.; Sutin, A.M.; Claytor, T.; Papin, P.; Le Bas, P.-Y.; TenCate, J.A. The time reversed elastic nonlinearity diagnostic applied to evaluation of diffusion bonds. Appl. Phys. Lett. 2008, 93, 151914. [Google Scholar] [CrossRef] [Green Version]
  16. Ulrich, T.J.; Johnson, P.A.; Guyer, R.A. Interaction dynamics of elastic waves with a complex nonlinear scatterer through the use of a time reversal mirror. Phys. Rev. Lett. 2007, 98, 104301. [Google Scholar] [CrossRef] [PubMed] [Green Version]
  17. Ju, T.; Findikoglu, A.T. Monitoring of corrosion effects in pipes with multi-mode acoustic signals. Appl. Acoust. 2021, 178, 107948. [Google Scholar] [CrossRef]
  18. Findikoglu, A.T.; Sinha, D.N.; Chapman, D.R. Detection and monitoring of changes in metallic structures using multimode acoustic signals. U.S. Patent 10,473,625, 12 November 2019. [Google Scholar]
  19. Findikoglu, A.T.; Ju, T.; Chapman, D.R. Detection, Monitoring, and Determination of Location of Changes in Metallic Structures Using Multimode Acoustic Signals. U.S. Patent 10,585,069, 10 March 2020. [Google Scholar]
  20. Li, W.; Cho, Y.; Ju, T.; Choi, H.S.; Kim, N.; Park, I. Evaluation of Material Degradation of Composite Laminates Using Nonlinear Lamb Wave. In Nondestructive Testing of Materials and Structures; Springer Netherlands: Dordrecht, The Netherlands, 2013; Volume 6, pp. 593–598. ISBN 9789400707221. [Google Scholar]
  21. Matlack, K.H.; Kim, J.-Y.; Jacobs, L.J.; Qu, J. Review of Second Harmonic Generation Measurement Techniques for Material State Determination in Metals. J. Nondestruct. Eval. 2015, 34, 273. [Google Scholar] [CrossRef]
  22. Nawab, H.S. Short-time Fourier transform. In Advanced Signal Processing; Prentice-Hall, Inc.: Hoboken, NJ, USA, 1987; ISBN 0130131296. [Google Scholar]
  23. Drozdz, M.B. Efficient Finite Element Modelling of Ultrasound in Elastic Media. Ph.D. Thesis, Imperial College Londo, London, January 2008. [Google Scholar]
Figure 1. A test beam assembly with a mechanical oscillator to create micro-cracks near T-Joints.
Applsci 12 02082 g001
Figure 2. Side view of the beam assembly modeled in the numerical simulations, where locations and dimensions of local changes in the material nonlinearity are given. (Dimensions in meters).
Applsci 12 02082 g002
Figure 3. Two typical receiver signals for the pulse inversion techniques (a), and a residual nonlinear wave signal (b) when A = 1.2 µm and β = β 2 are used.
Applsci 12 02082 g003
Figure 4. Spectrograms of difference signal y ( t ) between a baseline with 0.15 µm input amplitude and monitoring signals with different input amplitudes: (a) 0.3 µm, (b) 0.6 µm, and (c) 1.2 µm input amplitudes.
Applsci 12 02082 g004aApplsci 12 02082 g004b
Figure 5. Simulation results of actionable output (AO) vs. different β through FEM simulations where β < β 1 < β 2 .
Applsci 12 02082 g005
Figure 6. Experimental setup for multi-mode ultrasonic measurements using piezoelectric transducers.
Applsci 12 02082 g006
Figure 7. Locations of two noticeable cracks across T-joint #2 (a) and experimental setup for measurements in the proximity of the defects (b).
Applsci 12 02082 g007aApplsci 12 02082 g007b
Figure 8. Experimental results of actionable output (AO) for T-joint #1 and #2. MDR due to T-joint #2 is approximately nine times larger than that due to T-joint #1.
Applsci 12 02082 g008
Figure 9. Experimental results of actionable output (AO) for three different locationsdefined by (A), (B), and (C) transducer pairs (see Figure 7), indicating larger micro-crack density near joint edges (involving (A) and (C) transducer pairs) leads to larger MDR.
Applsci 12 02082 g009
Table 1. The sign of the displacement field.
InputPrimary WaveSecond Harmonic Wave
AULUNL
-A-ULUNL
Table 2. Material properties of the beam used in the simulations.
MaterialDensity (kg/m3)Young’s Modulus (GPa)Poisson’s Ratio
AISI 403078502050.28
Table 3. Third order elastic constants in GPa used for β .
Local Material NonlinearityML
β 0 00
β 1 −300−300
β 2 −600−600
Publisher’s Note: MDPI stays neutral with regard to jurisdictional claims in published maps and institutional affiliations.

