Article

Ecosystem Service Assessments within the EU Water Framework Directive: Marine Mussel Cultivation as a Controversial Measure

by
Lukas Ritzenhofen
1,2,*,
Johanna Schumacher
1,2,
Svenja Karstens
3,4 and
Gerald Schernewski
1,2
1
Coastal and Marine Management Group, Leibniz-Institute for Baltic Sea Research Warnemünde (IOW), 18119 Rostock, Germany
2
Marine Research Institute, Klaipeda University, 92294 Klaipeda, Lithuania
3
Center for Ocean and Society, University of Kiel, 24118 Kiel, Germany
4
EUCC-Coastal Union Germany, 18119 Rostock, Germany
*
Author to whom correspondence should be addressed.
Appl. Sci. 2022, 12(4), 1871; https://doi.org/10.3390/app12041871
Submission received: 31 December 2021 / Revised: 2 February 2022 / Accepted: 8 February 2022 / Published: 11 February 2022
(This article belongs to the Special Issue Applied Geoinformatics: From Coastal to Fluvial Geography)

Abstract

:
To combat the persistent eutrophication in coastal waters, sustainable sea-based measures are recommended. Yet, they are the subject of controversial stakeholder discussion, which hampers the implementation and planning process. The aim of this study is to evaluate if a participatory mapping (PM) approach and ecosystem service assessments (ESA) can be suitable tools within Water Framework Directive (WFD) implementation to support the communication with different target groups to improve and accelerate the planning and realization of new sea-based mitigation measures. We conducted three stakeholder-based PMs to visualize the perception of sea-based mitigation measures in coastal waters and seven different ESAs to investigate the perceptions of different mussel cultivation scenarios as mitigation measures. The PMs showed that ecological measures were preferred. The ESA approach showed that, while experts rated mussel cultivation scenarios positively overall, non-expert stakeholders still seemed skeptical and preferred alternative measures like floating wetlands. The methodological results indicate that PM can be a cost-effective tool to visualize stakeholders’ perceptions, but it needs to be applied with an ESA to be beneficial for the WFD implementation process. A web-based ESA improves the discussion with stakeholders and can reveal potential misperceptions and concerns faster and lead to a more focused discussion.

1. Introduction

Anthropogenic inputs of nitrogen (N) and phosphorus (P) to coastal ecosystems became the primary cause of eutrophication and subsequent coastal ecosystem degradation worldwide, reducing biodiversity and the potential of marine ecosystems to provide valuable ecosystem goods and services [1,2,3]. However, while marine restoration actions are common, their success rates are highly variable, especially with continuous eutrophication [4]. Various policy frameworks like the European Water Framework directive (WFD) (WFD, 2000/60/EC) and Marine Strategy Framework Directive (MSFD) (MSFD, 2008/56/EC) aim to hinder its progress and to return to a good ecological status. The WFD marks a decisive turn in European water policy, management practices, and restoration trends. After 20 years of implementation in two management cycles, the WFD had been successful in setting up a governance framework for integrated water management for more than 110,000 water bodies in the EU, including transitional and coastal waters. However, as of today, WFD implementation has shown only limited success, especially in coastal waters of the Baltic Sea in regard to counteracting eutrophication and returning to a good ecological status [5]. This can be attributed to several reasons. First, land-based measures are difficult to implement, since the major nutrient input emerges from diffuse sources like agriculture or from the atmosphere [6]. In addition, water quality improvements are delayed by decades due to leaching from “legacy sources” in soils, sediments, and groundwater [7]. Furthermore, despite management plans, eutrophication in most European coastal waters is expected to increase in the upcoming decades due to human population growth and intensified agriculture practice [8,9].
Within coastal waters, internal mitigation measures, also known as “water-based”, “sea-based”, or “end-of-pipe” solutions, have come into focus to actively support restoration efforts [8,10,11]. As a consequence, the eight European Baltic Sea littoral states signed a ministerial declaration to intensify measures toward the good ecological status and good environmental status of the Baltic Sea, which includes the promotion of sustainable sea-based measures [12]. Recommendations for sea-based measures to combat eutrophication already exist, and measures can be differentiated into hydrological engineering (mechanical measures) (HE), geoengineering (chemical measures) (GG), and ecological engineering (EE) (Duarte and Krause-Jensen, 2018) [9].
In particular, ecological engineering has gained a lot of attention during recent years. The cultivation of filter feeders like the blue mussel (Mytilus spp.) as a mitigation measure has been highly discussed and is partly practiced already [13,14,15,16,17]. Longline mussel cultivation can be a sustainable method for producing highly valuable proteins for human consumption or animal stock and simultaneously function as a nutrient retention measure to relieve coastal waters of surplus nutrients [14,18,19]. However, blue mussel cultivation also has its limitations based on its physiological needs (e.g., salinity, temperature, and Chl. a concentration) and can also be associated with negative environmental impacts (e.g., increased bio deposition) [20,21]. Another example for an ecological engineering approach is floating wetlands. Floating wetlands are artificial islands planted with emergent macrophytes to remove excess nutrients from the water via the root system through incorporation into plant biomass and bacterial denitrification [22,23]. Nevertheless, these internal measures are hardly considered within the scope of the implementation of the WFD and are therefore not listed in the recent “Program of Measures” (POM) for the German coastal waters.
The introduction and implementation of internal measures is often hampered, because of several concerns and a lack of information. This is mostly because there is a concern that the mitigation focus will shift from agricultural measures to internal measures, which in turn could potentially increase the agriculture-based nutrient input. Other concerns are competition of space and the fear of potential negative side effects that cannot yet be foreseen [24]. In order to dispel misinformation and concerns of internal mitigation measures, early and comprehensive stakeholder involvement is necessary. Stakeholders typically include governmental, non-governmental, and business representatives, experts (e.g., scientists), landowners, and local users of natural resources. The benefits of early involvement of stakeholders are well-known and include a higher acceptance of measures, which accelerates planning and implementation processes [25]. The WFD encourages active involvement of stakeholders and the public. However, in practice, participatory processes are often restricted to the legally required information supply and consultation. However, especially for the implementation of new sea-based measures, an early and active participation process is crucial to take into account stakeholder concerns and increase acceptance. Here, a holistic approach would be most beneficial to capture the perception of the different stakeholders.
The ecosystem service (ES) concept can be a suitable approach to obtaining a holistic view. While the operationalization of the ES concept in EU environmental policy is already recommended [26,27], no concrete application is provided within the terms of the WFD. As a first step to improve the participation and communication between target groups, ecosystem service assessments (ESAs) have been conducted and used to understand changes caused by new measures to fulfill the WFD [28,29,30]. The ESA conducted by Schernewski et al. [25] captured experts’ views, disagreements among them, as well as potential misunderstandings of mitigation scenarios. A final discussion and the opportunity for participants to modify the ESA values ensure that it serves as a promising tool in participation and target group involvement within the coastal planning processes [28]. While former studies gave the first insights into the potential usage of ESAs for the implementation of water quality improvement measures, they lack concrete information about the application within the WFD itself. Therefore, this study aims to evaluate how and at which stage a participatory mapping approach or ESA can be used as a tool to engage stakeholders actively and successfully promote the implementation of new internal mitigation measures within the planning and implementation process of the WFD.
To accomplish this, we (1) first use a participatory mapping approach to identify stakeholder groups’ perceptions of and preferences for supportive internal measures, (2) test the use of an ESA with different target groups and different mussel mitigation scenarios, (3) evaluate different assessment methods and their suitability for different target groups, and (4) define recommendations for the use of the tested stakeholder tools within the planning and implementation process of the WFD.

2. Materials and Methods

2.1. Participatory Mapping

In three workshops (Table 1), we used a participatory approach to map the preferential sites for the application of internal measures in European coastal lagoons (Figure 1). Participatory mapping allows the documentation of spatial knowledge [31]. Maps of different European lagoons were fixed to cork walls, and workshop participants could pin flags of different colors to locations where they would regard a certain type of internal nutrient mitigation measure as suitable. The participants could choose the following flags: green for ecological engineering involving vegetation (e.g., floating wetlands and seagrass restoration), blue for ecological measures involving mussel cultivation (e.g., blue mussels and zebra mussel), yellow for mechanical measures (e.g., sediment dredging and sediment capping), red for geoengineering measures, in this case called “chemical measures” for easier differentiation (e.g., phosphorus precipitation with aluminum and oxygenation), and white flags at locations where no internal measures should take place. The participants could also pin memos next to their flags for further explanation.

2.2. Ecosystem Service Assessments

During seven workshops (Table 2), ESAs were used to compare different ecological internal mitigation scenarios for different inner coastal waters along the Danish, German, and Lithuania Baltic Sea coasts (Figure 1). The participants for the different workshops were experts and graduate students with scientific backgrounds (e.g., in marine ecology, marine aquaculture, or (marine) ecosystem services) and local stakeholders with governmental, non-governmental, or business backgrounds. They were chosen according to their potential involvement during the selection and implementation of new internal mitigation measures in coastal waters. The course of all workshops was always structured in the same way. At the beginning of each workshop, the concept of ecosystem services and their evaluation method was introduced.
The applied ecosystem service assessment is based on the Marine Ecosystem Services Assessment Tool (MESAT) [32]. In general, MESAT assesses changes in ES provision between different time periods [32], but it can also be used for different scenarios [33]. It is based on the Common International Classification of Ecosystem Service (CICES) and can be applied in a qualitative and semi-quantitative way.
Originally, the MESAT contained 31 ESs which were divided into 3 sections: provisioning, regulation and maintenance, and cultural ESs (compare with Inacio et al. [32]). For the comparison of different mussel mitigation scenarios, only ESs which were relevant to mussel cultivation were chosen for the assessment. The resulting 25 ESs are listed in Table 3. We rated the change in the ES provision (caused by the implementation of a measures) based on 11 scoring classes ranging from −5 (very high decrease) to +5 (very high increase). No change was rated as 0. For the stakeholder assessment (11.9.2019), which included a high number of stakeholders with governmental, business, and NGO backgrounds (Table 2), the number of ESs was further reduced from 25 to 8 ESs to reduce the duration of the assessment and make it more comprehensible. Adjusted to the assessment, the scoring options were reduced to 6 classes ranging from −3 (very negative change) to +3 (high positive change).
The scenarios presented include a realistic but theoretical description of the mitigation measure as well as information about the local environment (e.g., information on ecological status of coastal waters, tourism activities, and industrial infrastructure).
Altogether, two different assessment methods were tested: the paper-based approach used by Schernewski et al. [25] and a web-based application. In the paper-based assessment, the 25 ESs and their descriptions were presented as a table. The assessment of a single ES had to be entered by hand. To complete the assessment, participants had about 30 min. The web-based assessment was conducted with the tool “Mentimeter”. Mentimeter (www.mentimeter.com (accessed on 9 December 2021) is originally used for educational purposes and is a Student Response System (SRS) voting tool [34]. SRSs should help to encourage participants to engage in discussions and through their portable devices (e.g., mobile phones, laptops, or tablets). Mentimeter enables quick and anonymous feedback to both quantitative and qualitative questions. Using their devices, applicants submit their answers via a webpage, and the responses are instantaneously and anonymously displayed on a screen [34].
During the assessments, different strategies were also tested to improve the common understanding of the assessed ESs. Therefore, discussions at different stages of the assessment were used to prevent a false rating which could be based on a misunderstanding or misinformation. After the discussion, participants had the chance to adjust their values if they were willing. Discussions were conducted after the assessed scenario between ES divisions and after single services.

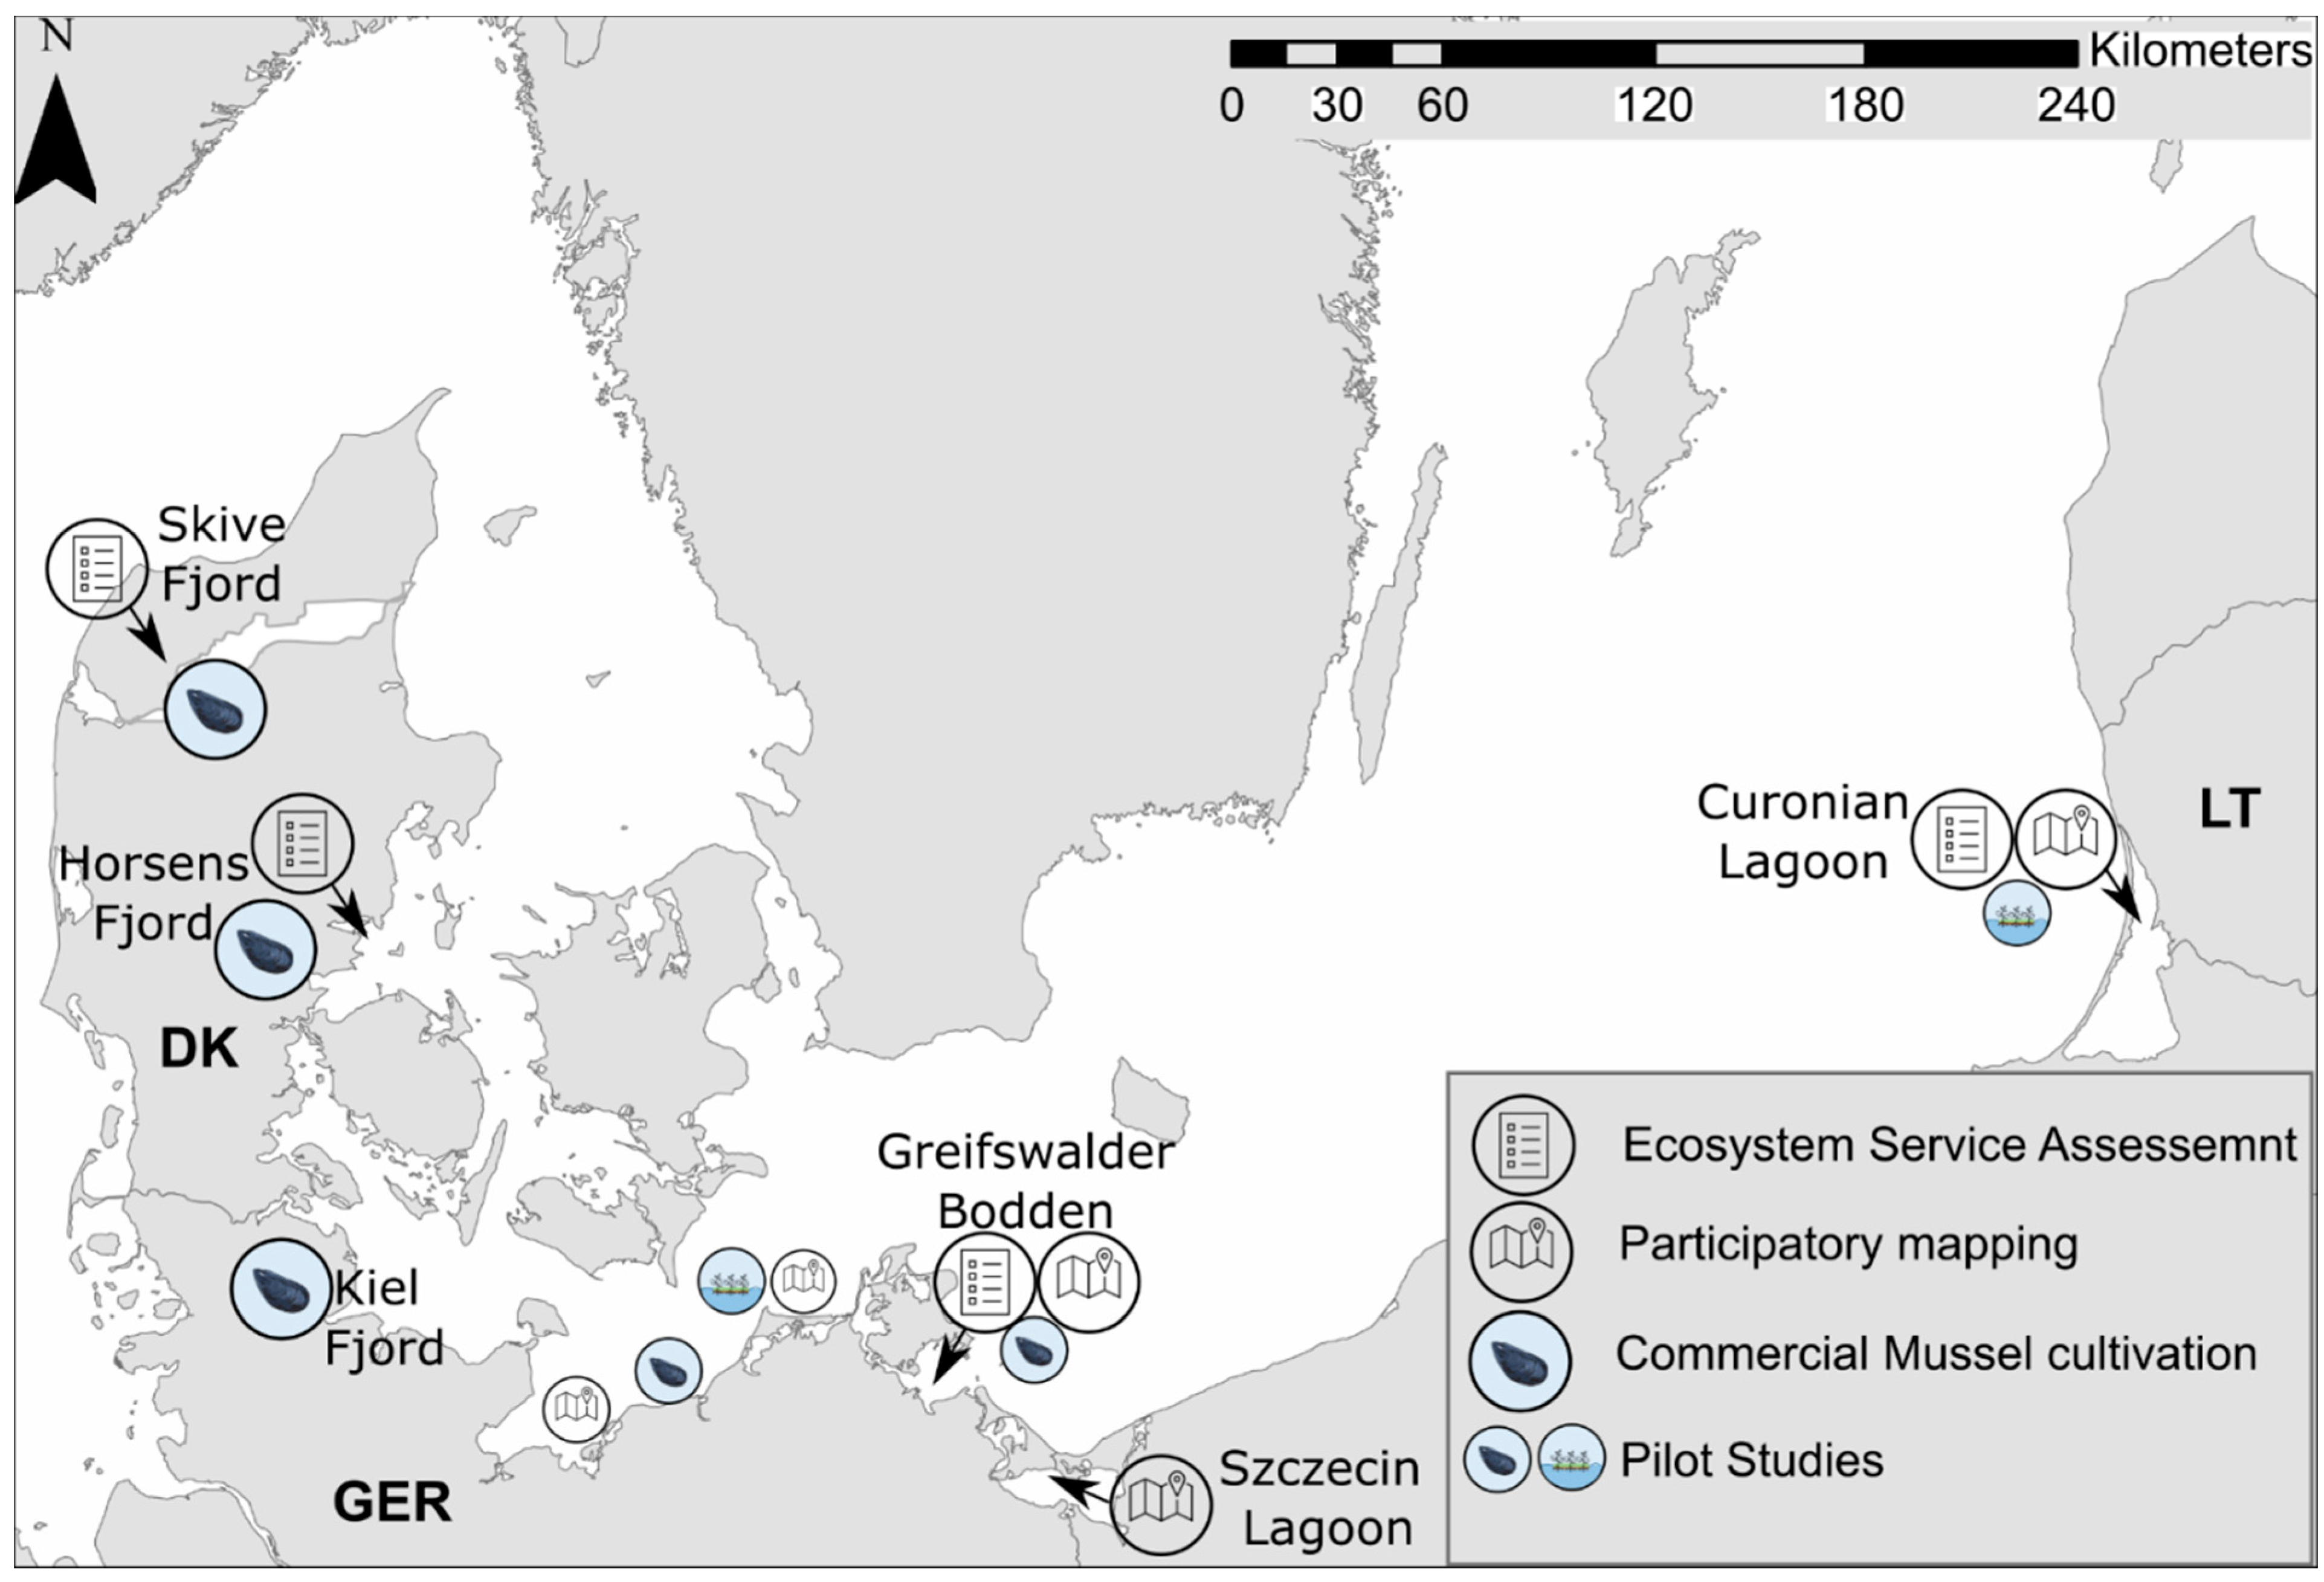
2.3. Sites and Application

Within the ESA, we concentrated on ecological measures consisting of different mussel cultivation strategies as well as the application of floating artificial wetlands (Figure 2). The different ecological measures were based on strategies to mitigate nutrients and increase water transparency, which can be found in the current literature (see description). A detailed description of the measures is given below.

2.3.1. Commercial Mitigation Mussel Farm

The concept of the mitigation mussel farm is based on mass balance principles of inorganic nutrients which are available in the marine environment and are transformed into phytoplankton, which is then immobilized by the filter feeding activity of suspended mussels [35]. Subsequently, when the mussels are harvested, the nutrients stored within the mussels are removed from the marine environment [13]. Harvested mussels can be used as a high-quality protein source and can be sold commercially. Since the mitigation cultivation strategy differs from the cultivation for human consumption, mussel products need to be sold for other purposes (e.g., mussel meal or fertilizer).

2.3.2. Integrated Multi-Trophic Aquaculture

Integrated multi-trophic aquaculture (IMTA) is the co-culturing of different species that can be used to reduce the nutrient emissions from marine fish farms [36]. The concept of IMTA uses a similar mass balance principle approach as the mitigation mussel farm strategy. Instead of dissolved nutrients emerging from land, here, the dissolved nutrients from one species (e.g., fish) are utilized by the extractive species (e.g., seaweeds or mussels) and removed from the system through harvesting [37]. However, mussels capture nutrients in particulate form, primarily as phytoplankton, and not directly capturing the dissolved nutrients released from the fish farm. In order to compensate nutrients emerging from fish farms, one option is to place mussel farms in close proximity to the fish farms or to locate mussel farms in coastal areas affected by nutrient transport from fish farms.

2.3.3. Beach Mussel Farm

The objective of the beach mussel farm is to improve the water transparency in bathing areas to increase the attractiveness for beach users. At the same time, near the shore, submerged macrophytes also benefit from the increased water transparency and the associated light availability. As a result, submerged macrophytes are able to spread and stabilize the sediments, further binding nutrients and increasing water transparency [28].

2.3.4. Floating Artificial Wetlands

Floating artificial wetlands are a “phyto-technology”, where emergent macrophytes grow on a buoyant platform and support remediation of eutrophication on several levels [38]. On the one hand, roots in the water column directly adsorb nutrients and incorporate them into plant tissue through biosynthesis. On the other hand, a biofilm on the roots enhances bacterial denitrification. In addition, floating islands attenuate wave energy and water flow and are consequently able to enhance particle settling and nutrient burial [38,39,40]. Floating wetlands with native emergent macrophytes were tested for the first time in Baltic lagoons in 2018 [39,40] and turned out to be a valuable refuge for aquatic fauna such as the endangered eel [33].
Each measure was formulated as a scenario, and two scenarios were always evaluated for one target area (Figure 3). Within the Danish coastal waters (Limfjord and Horsens Fjord), a commercial mitigation approach (Limfjord) and the IMTA approach (Horsens Fjord) were formulated as scenarios (Figure 3 (1)). For the Curonian Lagoon, a commercial mussel farm as well as a beach mussel farm were set as scenarios. Due to the reduced salinity of the Curonian Lagoon, zebra mussels were cultivated (Figure 3 (2)). For the German coastal waters, the Greifswalder Bodden was used as the scenario site. Here, a beach mussel farm and floating wetland scenario were assessed (Figure 3 (3)).

3. Results

3.1. Participatory Mapping

The participatory mapping showed that the EE measures were the preferred choice compared with the HE and GE approaches (Figure 4, Table 4). When accumulating the results of all three workshops, the EE measures involving macrophytes (44%) and mussels (22%) were pinned the most. The notion that no mitigation measure was necessary or wanted was pinned only 7% of the time in comparison. It should be noted that only the selection “no measures” was made at the German workshop in Stralsund.
Comparisons between the different nationalities of the participants were difficult to conduct, as the workshops in PM2 and PM3 were conducted on an international level (Table 1), and the participants involved were of different nationalities. However, a comparison could be made between the different results from PM1 and PM3, as local stakeholders (non-scientists: Germany = 69%; Lithuania = 50%) participated in both workshops. The comparison shows that the participants in Lithuania showed a much greater focus on the GE (33%). The mussel cultivation approach was, on the other hand, less favored compared with the results from Stralsund.
However, if we compared the results of the different workshops according to their stakeholder compositions, we saw that there were also differences in the choice of measures (Table 4). In PM2, where 95% of the participants were scientists, ecological and mechanical methods were equally pinned. During PM1, where 69% of the participants consisted of non-scientists, the ecological methods (macrophytes (50%) > mussels (30%)) were predominated. At four locations, the wish that no measures at all be implemented was stated (Figure 4). During PM3, which consisted of 50% scientists and 50% other stakeholders, the ecological measures were also preferred, but the use of GE measures (chemical applications) also had a share of 33%.
With the current conducting method, no homogeneous result could be obtained, and no recommendation could be derived. In order to achieve a homogenous result, it is necessary to define or provide homogenous background information (e.g., specify the target area, potential interactions with the environment, or define nutrient reduction scenarios). Here, a combination of the ESA approaches would be beneficial, since it supplies scenario and background information and guides the participants to reflect about possible environmental interactions.

3.2. Ecosystem Service Assessments

3.2.1. Expert-Based ESA of the Mussel Mitigation Approach in Different Coastal Systems

The comparison of the two expert-based ESAs focusing on commercial mitigation mussel farms in the coastal waters of Lithuania and Denmark (Table 5) shows that the expert groups of both countries assessed the changes of provisioning ESs by commercial mitigation mussel farming quite similarly and slightly positively (average increase of ESs by +1) (Table 5). Both groups were in agreement that the mussel farm scenarios had no effect on the ES “Physical and bioenergy”.
For regulating ESs, the most deviations between the two expert groups could be seen between the ESs “Burial of nutrients and organic matter”, “Primary productivity”, and “Oxygen provision”. In contrast, the experts from Lithuania rated the changes in “Burial of nutrients and organic matter” slightly positively (mean value +1) and with no changes in “Primary productivity”. The change in “Oxygen provision” was surprisingly rated negatively by Lithuanian experts (mean value = −2). Overall, it seems that experts in Denmark rated the changes in the regulating ESs higher compared with the experts in Lithuania.
Within the division of cultural ESs, slight differences in ratings occurred between both expert groups for the ESs “Bathing and sunbathing”, “Recreation and water sports”, and “Experimental use”. Here, the expert group in Denmark rated the changes in the above mentioned ESs slightly more positively than the expert group from Lithuania.
Overall, and despite their different levels of experience with the mussel cultivation practice, both expert groups from Denmark and Lithuania rated the changes to the ESs by a commercial mussel farm scenario slightly positively overall. The results also show that the greatest and considerable disagreements in the rating of changes to ESs appeared for regulating ESs. The results show that an ESA can also be used to identify uncertainties and where a wider discussion is needed.

3.2.2. Expert ESA Application in Danish Coastal Waters

The expert group in Denmark (with background knowledge about blue mussel cultivation) compared a commercial mussel farm and an IMTA approach (Figure 3 (1)). The results of the web-based ESA show that the majority of the provisioning ES was positively influenced by both mussel farm scenarios. This can be explained by the fact that the compensation of nutrients emerging from marine finfish cultivation increases the capacity of the additional potential marine finfish aquaculture. This fact also explains the deviating rating of the ES “Navigation and waterways” (IMTA: mean score = −1; commercial mitigation Farm: mean score = −1). Due to the higher aquaculture practice, navigation and potential waterways of marine traffic might be more restricted.
When comparing the ratings of the regulating ESs, experts assessed the “Burial of nutrients” (diff. in mean = −3), “Primary productivity” (diff. in mean = +3), and “Water transparency” (diff in mean = −2) differently. Other services were rated either with no change or slightly differently, with a deviation in the mean value of ±1 (Table 6).
The assessment of the cultural ES also showed mostly little deviation between the ratings (diff. in mean = ±1). Only the ES “Bathing and sunbathing” showed a stronger deviation (diff in mean = −2) (Table 6). The results indicate that a commercial mitigation farm as well as an IMTA approach had rather a positive affect or no implications at all on the cultural ES.
These results show that an ESA can not only be beneficial for experts which have less or no experience with mussel cultivation but also be a good supplement for discussions of mussel cultivation. It is suitable to evaluate and discuss the perception of strengths and weaknesses of different mussel farm set-ups.

3.2.3. Expert-Based ESA Application in the Curonian Lagoon

The effects on the provisioning ESs were rated mostly positive by the expert group in Lithuania. Only the ES “Navigation and waterways” was rated slightly negative for both mussel farm applications (Table 7). The same was true for the assessment of the regulating ES. Only the ES “Oxygen provision” was assessed with a negative change (Beach mussel farm: mean value = −1; Commercial mitigation farm = −2). Additionally, the Lithuanian experts assessed that for the beach mussel farm, the ES “Pest control” would decrease slightly (mean value = −1).
Within the division cultural ES, the services “Recreation and water sports” were rated slightly negatively (mean value = −1) for both application scenarios. The experts also assessed that for the beach mussel farm application, the overall “Aesthetic experience” would change slightly negatively (mean value = −1). Opposite to this, the ESs “Experimental use”, “Scientific and educational”, and “Economic development” were rated positively for both application scenarios.
In comparison with the expert group in Denmark, the expert group in Lithuania did not show as much deviation in the assessment between the two scenarios, even though the scenarios were very contradictory (diff. in mean = ±1 or no change over all divisions).

3.2.4. Non-Expert-Based ESA Application in the Greifswalder Bodden

When non-expert stakeholders compared the mussel mitigation approach to floating wetlands, the floating wetlands received a slightly better rating in regulation and cultural ES provision (Table 8). The largest differences between the two ecological measures were in the cultural division. Floating wetlands are perceived as aesthetic landmarks, enriching the local recreation and tourism values of the region. This depicted a clear contrast to the mussel farm scenario, where the impact on the aesthetic experience was perceived negatively and entailed potential conflict.

3.2.5. Comparison between Different Assessment and Discussion Strategies

The application of the two assessment strategies—paper-based vs. web-based—showed that the web-based application could benefit the assessment speed as well as the level of engagement. During the web-based assessment, it was noticed that the visualization of the results in real time as well as a set time limit for responding forced participants to answer more rapidly. The instant display of ratings enabled different discussion strategies (e.g., after every single ecosystem service or ecosystem service division).
In contrast, during the paper-based assessment, the participants tended to overthink their ratings, increasing the total time of the assessment or skipping the assessment of single services. During the paper-based method, real-time visualization was hard to accomplish, disabling different discussion strategies. The display of the preliminary results was also timely, since the results had to be transferred to a computer and had to be visualized first.
The use of different discussion strategies has shown that the strategy of discussing each division individually (assessment and discussion of the provisioning ESs of a first scenario followed by the assessment and discussion of the provisioning ESs of the second scenario) was the most suitable to generate a common understanding (overall changes after the discussion: 26%) and led to few changes in the assessment of the second scenario (overall changes after the discussion: 8%).

4. Discussion

4.1. Participatory Mapping Approach

Participatory mapping approaches refer to a range of methodologies to capture spatially explicit data in a participatory way [41]. In the current study, we conducted very basic stakeholder-based participatory mapping in order to test its suitability for selection of internal mitigation measures for inner coastal waters in Germany, Poland, and Lithuania (Figure 1). The results showed that the participatory mapping approach that was conducted could be a cost-saving and easy tool to identify sites preferred by local stakeholders for possible internal mitigation measures. It could also provide information on what kinds of internal mitigation measures were desired by local stakeholders, and it could further help to identify potential conflict zones. Damastuti and de Groot [42] described participatory mapping as a tool for co-producing knowledge with local stakeholders, often in contrast to the mechanistic approaches of traditional Geographic Information Systems (GIS) analysis, which avoids social complexity and political negotiation. Therefore, this approach offers the advantage that local stakeholder knowledge and opinions are directly implemented within the decision-making and implementation process of new internal mitigation measures within the WFD.
Considering the findings from the participatory mapping, several stakeholders saw the need for sea-based mitigation measures (Table 4). The results indicate that most stakeholders were aware that supporting internal measures was very well required to support the recovery process of coastal waters, as already proposed by Duarte et al. [9]. However, the results also show that the individual approaches were perceived differently according to the stakeholders’ backgrounds as well as nationalities. When distinguishing between the individual workshops, it became apparent that the highest acceptance of EE measures was seen by German stakeholders, mostly including local governmental, non-governmental, and business representatives. However, if the stakeholder group consisted mainly of experts (scientists), EE and HE applications were favored in equal parts. Both stakeholder groups, however, avoided GE measures. Under GE measures, the most common method is the application of aluminum (Al) to remove phosphorus from the water column through precipitation and permanent burial [43]. While phosphorus precipitation by Al has already been successfully practiced in small lakes [44], there are significant knowledge gaps with regard to the brackish waters of the Baltic Sea [45,46]. In contrast to the results of the previous two workshops, it was surprising during the workshop in Klaipeda that the GE measures in particular were pinned, with a share of 33%.
Another aspect which became obvious was that even though the EE measures were pinned the most during all three workshops, the mussel mitigation approach was always pinned less compared with the measures involving macrophytes (Table 4). This was especially true for the workshop in Athens, Greece and Klaipeda, Lithuania. Within the Szczecin Lagoon (Poland) as well as in the Curonian Lagoon, mussel cultivation as a mitigation measure was only pinned once (Figure 4). Here, several assumptions are possible. On the one hand, it may be that mussel cultivation is generally viewed critically [47] as a measure for shallow inner coastal waters or because only the zebra mussel (Dreissena Polymorpha) and not the blue mussel (Mytilus spp.) can be cultivated in these waters.
In comparison with Poland and Lithuania, the stakeholders in Germany seemed to show a higher acceptance toward EE mitigation. However, it also has to be noticed that a share of the stakeholders in Germany preferred no measures at all.
The heterogeneous mapping results also show that this simplified approach alone was not sufficient enough to select and introduce internal mitigation measures in a targeted manner which could support the implementation of the WFD.

4.2. Expert- and Stakeholder-Based ESA Approach

Several studies have already shown that ecosystem service assessments can support stakeholder communication and policy implementation [29,30]. In our case, it can serve as a tool to visualize potential benefits and trade-offs and analyze patterns and processes at a regional level [25,42,48].
Our results have shown that, based on the stakeholder background, different assessment strategies can be beneficial. In the case of the expert-based assessment, the web-based assessment with the option to visualize the results in real time enabled new discussion strategies and could accelerate the duration of the assessment compared with the basic paper-based assessment. This was very well demonstrated when comparing the results from the conducted ESA in Denmark and Lithuania. The experts in Denmark, who were already familiar with the topic of mussel cultivation, still showed higher deviations for the impacts of a commercial mussel farm scenario compared with a quite similar IMTA scenario (Table 6), whereas the experts in Lithuania, consisting of scientists with a general background in marine science, showed only a little deviation, comparing the effects of two very contrasting scenarios (Table 7). Here, the chosen discussion strategy, which was to conduct the discussion after the assessment, seemed to not be beneficial.
Both expert groups agreed that a mussel farm which could run on a commercial level could benefit the selected provisioning, regulating, and cultural ESs around the mussel farm. Both groups mostly agreed on whether the scenario described would lead to an improvement or deterioration of the ES being assessed (Table 5). However, the degree of change differed in most cases. Some exceptions were the ESs “Oxygen provisioning” and “Burial of nutrients and organic matter”, which mirrors the general risks of mussel cultivation [21,49]. In both cases, the experts in Lithuania assessed a decline in the ESs, while the experts in Denmark determined a positive change. The differences in ratings can be attributed to a possible different understanding rather than that the scenarios were assessed in different systems (Skive Fjord, Denmark and Curonian Lagoon, Lithuania). Both systems are shallow and eutrophic [25,50]. While the experts in Lithuania possibly saw the overall threat of bio deposition and increasing dissolved nutrients [21,49], the experts in Denmark saw the benefits for the environment if a mussel mitigation farm acted as a nutrient sink [49,50].
While an ESA is appropriate for expert consultations, it does not seem to be usable for non-experts (e.g., local actors (governmental, non-governmental, or business actors)), since the number and description of ESs are too specific, and it would be too time-consuming to carry out [25]. Therefore, we tested a slimmed down version with reduced services (Table 8). Striking was that the results showed that the stakeholders rated the simplified ES “Nutrient regulation” equally for the beach mussel farm and the floating wetlands (Table 8). Here, the perception of the nutrient regulation capacity could be biased based on the scenario provided to the stakeholders. A floating macrophyte island of 1 ha would theoretically be able to remove a similar amount of phosphorus and nitrogen compared to a mussel farm of the same size. However, floating islands could never realistically be that large due to the negative shading effect on submerged vegetation. More than their impact on nutrient regulation, the stakeholders appreciated their potential role as biodiversity hotspots and a habitat for birds, insects, and aquatic fauna [51,52]. Those aspects seem more promising than their use purely for nutrient removal in eutrophicated waters, where the size limits the efficiency. This was also a debated topic during the discussions after the assessments.
A common disadvantage of the ESA is that the stakeholders have to evaluate prefabricated scenarios whose location is already determined. Preparing scenarios at a predefined location has the advantage that the scenario can be tailored to the location, but it lacks the possibility of including valuable experiences and perspectives from local stakeholders. Another potential weakness of this method might be that it requires a sufficient and diverse number of coastal stakeholders. If the number of coastal stakeholders is not sufficient or diverse enough, the decision-making process can be biased and result in lacking public acceptance after all. In order to have high participation of local stakeholders during the implementation process of new measures, a web-based, simplified ESA would be most beneficial. Its shorter duration and the anonymous voting system help to ensure effective participation.

4.3. Implementation of Different Assessment Approaches into the WFD

While former studies gave first insights into the potential usage of ESA for the implementation of water quality improvement measures and their use within the integrated coastal management processes [25,39,48], they lacked concrete information about the application within the WFD implementation cycle itself. Based on our results and the experience we created, we see the following possible applications of ESA and PM in the selection and implementation of possible measures as exemplary for the German WFD implementation cycle (Figure 5).
Depending on the different pathways, the selection of measures (1), or the implementation of measures (2) (Figure 5), we propose different assessment approaches. During the selection of measures, we suggest an expert-based ESA. In Germany, the selection of measures is organized on a federal level. Therefore, experts which have a profound understanding of the concerned aquatic systems and the potential effects of the measures are needed. The position is different when it comes to the implementation of sea-based measures and the participation of governmental, non-governmental, industry, or other local stakeholders. During the screening process, a stakeholder-based PM approach could be used to identify potential application and conflict areas, as well as the general acceptance of different potential sea-based measures. In this context, the simplified ESA could help to identify a stakeholder’s perception of sea-based measures and to identify misunderstandings. Furthermore, the holistic view on this measure can also visualize other advantages aside from nutrient reduction (e.g., benefits for biodiversity or economic benefits).
Public participation is not only a key element and a major challenge in the implementation of WFD in coastal waters but also in the other target water resources of the WFD [53]. Graversgard et al. 2017 [54], for example, showed that the engagement of local stakeholders during the planning of a river basin management plan resulted in better river basin management plan than without local stakeholders. Therefore, an adapted ESA as well as a PM can potentially be beneficial for the implementation and planning process for the other water resources targeted by the WFD.

5. Conclusions

Our study has shown that stakeholders’ views on sea-based mitigation measures differed based on their professional backgrounds or nationalities. In regard to EE measures, a comparison between different mussel mitigation scenarios showed that overall, the experts rated the effects of mussel mitigation on the selected ES positively. However, non-expert stakeholders seemed to prefer floating wetlands compared with a more effective mussel mitigation scenario. We have shown that an ESA designed for expert as well as for non-expert stakeholders and a PM approach can be valuable tools at different stages during the realization of the WFD. The tools can help to support the decision-making process during the selection of potential sea-based mitigation measures for the Program of Measures as well as during the implementation process. Especially during the implementation of measures, where stakeholder involvement is demanded, a combination of both approaches can be beneficial for revealing and clarifying spatial conflicts, stakeholder perceptions, as well as potential misinformation. A web-based approach can help enable new discussion strategies which can accelerate the duration of the assessment.

Author Contributions

Conceptualization, L.R., J.S., S.K. and G.S.; methodology, L.R., J.S. and S.K.; software, L.R. and J.S.; validation, L.R. and J.S.; formal analysis, L.R. and J.S.; investigation, L.R. and J.S.; resources, L.R., J.S. and S.K.; data curation, L.R., J.S. and S.K.; writing—original draft preparation, L.R.; writing—review and editing, L.R., J.S., S.K. and G.S.; visualization, L.R., J.S. and S.K.; project administration, G.S. All authors have read and agreed to the published version of the manuscript.

Funding

This research was financially supported by the project BONUS OPTIMUS (03A0020A). The project has received funding from BONUS (Art 185), funded jointly by the European Union’s Seventh Program for research, technological development, and demonstration and from Baltic Sea national funding institutions. Furthermore, it was partly funded by the project LiveLagoons (STHB.02.02.00-LT-0089/16). L.R. and J.S. were supported by the Doctorate Study program in Ecology and Environmental Sciences at Klaipeda University.

Institutional Review Board Statement

Not applicable.

Informed Consent Statement

Informed consent was obtained from all subjects involved in the study.

Data Availability Statement

The data presented in this study are available on request from the corresponding author. The data are not publicly available at the time of the submission of this paper due to ongoing further analyses.

Acknowledgments

We would like to thank René Friedland, who enabled the EU BONUS OPTIMUS project and took over the project management at the Leibniz Institute for Baltic Sea Research Warnemünde, which made this study possible in the first place. We would also like to thank Anna-Lucia Buer, who was also part of the EU BONUS OPTIMUS project and for her supporting work at several stakeholder workshops. We also thank all assessment and workshop participants for their contributions to this study.

Conflicts of Interest

The authors declare no conflict of interest. The funders had no role in the design of the study; in the collection, analyses, or interpretation of data; in the writing of the manuscript, or in the decision to publish the results.

References

  1. Selman, M.; Greenhalgh, S.; Diaz, R.; Sugg, Z. Eutrophication and Hypoxia in Coastal Areas: A Global Assessment of the State of Knowledge; WRI Policy Note; World Resources Institute: Washington, DC, USA, 2008; pp. 1–6. [Google Scholar]
  2. Rabalais, N.N.; Turner, R.E.; Díaz, R.J.; Justić, D. Global change and eutrophication of coastal waters. ICES J. Mar. Sci. 2009, 66, 1528–1537. [Google Scholar] [CrossRef]
  3. Geist, J.; Hawkins, S.J. Habitat recovery and restoration in aquatic ecosystems: Current progress and future challenges. Aquat. Conserv. Mar. Freshw. Ecosyst. 2016, 26, 942–962. [Google Scholar] [CrossRef]
  4. Bekkby, T.; Papadopoulou, N.; Fiorentino, D.; McOwen, C.J.; Rinde, E.; Boström, C.; Carreiro, S.M.; Linares, C.; Andersen, G.S.; Tunka Bengil, E.G.; et al. Habitat features and their influence on the restoration potential of marine habitats in Europe. Front. Mar. Sci. 2020, 7, 184. [Google Scholar] [CrossRef]
  5. HELCOM. State of the Baltic Sea—Second HELCOM Holistic Assessment 2011–2016; Baltic Sea Environment Proceedings 155; HELCOM: Helsinki, Finland, 2018. [Google Scholar]
  6. Doney, S.C. The growing human footprint on coastal and open-ocean biogeochemistry. Science 2010, 328, 1512–1516. [Google Scholar] [CrossRef] [PubMed] [Green Version]
  7. Bauwe, A.; Koch, S.; Kahle, P.; Lennartz, B. Nutrient stocks in soils and sediments might impair water quality for decades. Innov. Platf. 2021, 2, 228–231. [Google Scholar]
  8. Bartosova, A.; Capell, R.; Olesen, J.E.; Jabloun, M.; Refsgaard, J.C.; Donnelly, C.; Arheimer, B. Future socioeconomic conditions may have a larger impact than climate change on nutrient loads to the Baltic Sea. Ambio 2019, 48, 1325–1336. [Google Scholar] [CrossRef] [PubMed] [Green Version]
  9. Duarte, C.M.; Krause-Jensen, D. Intervention options to accelerate ecosystem recovery from coastal eutrophication. Front. Mar. Sci. 2018, 5, 470. [Google Scholar] [CrossRef]
  10. Boesch, D.F. Barriers and bridges in abating coastal eutrophication. Front. Mar. Sci. 2019, 6, 123. [Google Scholar] [CrossRef] [Green Version]
  11. Ritzenhofen, L.; Buer, A.L.; Gyraite, G.; Dahlke, S.; Klemmstein, A.; Schernewski, G. Blue mussel (Mytilus spp.) cultivation in mesohaline eutrophied inner coastal waters: Mitigation potential, threats and cost effectiveness. PeerJ 2021, 9, e11247. [Google Scholar] [CrossRef]
  12. Ministerial Declaration “Our Baltic’ Conference”. 2020. Available online: www.ec.europa.eu (accessed on 10 September 2021).
  13. Lindahl, O. Mussel Farming as an Environmental Measure in the Baltic. Final Report Project 2181, BalticSea 2020 Foundation. 2012. Available online: www.balticsea2020.org (accessed on 8 June 2021).
  14. Petersen, J.K.; Holmer, M.; Termansen, M.; Hasler, B. Nutrient extraction through bivalves. In Goods and Services of Marine Bivalves; Springer: Berlin/Heidelberg, Germany, 2019; pp. 179–208. [Google Scholar]
  15. Buer, A.L.; Maar, M.; Nepf, M.; Ritzenhofen, L.; Dahlke, S.; Friedland, R.; Schernewski, G. Potential and feasibility of Mytilus spp. farming along a salinity gradient. Front. Mar. Sci. 2020, 7, 371. [Google Scholar] [CrossRef]
  16. Holbach, A.; Maar, M.; Timmermann, K.; Taylor, D. A spatial model for nutrient mitigation potential of blue mussel farms in the western Baltic Sea. Sci. Total Environ. 2020, 736, 139624. [Google Scholar] [CrossRef]
  17. Kotta, J.; Futter, M.; Kaasik, A.; Liversage, K.; Rätsep, M.; Barboza, F.R.; Virtanen, E. Cleaning up seas using blue growth initiatives: Mussel farming for eutrophication control in the Baltic Sea. Sci. Total Environ. 2020, 709, 136144. [Google Scholar] [CrossRef]
  18. Petersen, J.K.; Hasler, B.; Timmermann, K.; Nielsen, P.; Tørring, D.B.; Larsen, M.M.; Holmer, M. Mussels as a tool for mitigation of nutrients in the marine environment. Mar. Pollut. Bull. 2014, 82, 137–143. [Google Scholar] [CrossRef]
  19. Timmermann, K.; Maar, M.; Bolding, K.; Larsen, J.; Nielsen, P.; Petersen, J.K. Mussel production as a nutrient mitigation tool for improving marine water quality. Aquac. Environ. Interact. 2019, 11, 191–204. [Google Scholar] [CrossRef] [Green Version]
  20. Dahlbäck, B.; Gunnarsson, L.Å.H. Sedimentation and sulfate reduction under a mussel culture. Mar. Biol. 1981, 63, 269–275. [Google Scholar] [CrossRef]
  21. Christensen, P.B.; Glud, R.N.; Dalsgaard, T.; Gillespie, P. Impacts of longline mussel farming on oxygen and nitrogen dynamics and biological communities of coastal sediments. Aquaculture 2003, 218, 567–588. [Google Scholar] [CrossRef]
  22. Pavlineri, N.; Skoulikidis, N.T.; Tsihrintzis, V.A. Constructed floating wetlands: A review of research, design, operation and management aspects, and data meta-analysis. Chem. Eng. J. 2017, 308, 1120–1132. [Google Scholar] [CrossRef]
  23. Colares, G.S.; Dell’Osbel, N.; Wiesel, P.G.; Oliveira, G.A.; Lemos, P.H.Z.; da Silva, F.P.; Machado, Ê.L. Floating treatment wetlands: A review and bibliometric analysis. Sci. Total Environ. 2020, 714, 136776. [Google Scholar] [CrossRef]
  24. McKindsey, C.W.; Archambault, P.; Callier, M.D.; Olivier, F. Influence of suspended and off-bottom mussel culture on the sea bottom and benthic habitats: A review. Can. J. Zool. 2011, 89, 622–646. [Google Scholar] [CrossRef] [Green Version]
  25. Schernewski, G.; Inácio, M.; Nazemtseva, Y. Expert based ecosystem service assessment in coastal and marine planning and management: A Baltic lagoon case study. Front. Environ. Sci. 2018, 6, 19. [Google Scholar] [CrossRef]
  26. Bouwma, I.; Schleyer, C.; Primmer, E.; Winkler, K.J.; Berry, P.; Young, J.; Vadineanu, A. Adoption of the ecosystem services concept in EU policies. Ecosyst. Serv. 2018, 29, 213–222. [Google Scholar] [CrossRef]
  27. Heink, U.; Hauck, J.; Jax, K.; Sukopp, U. Requirements for the selection of ecosystem service indicators—The case of MAES indicators. Ecol. Indic. 2016, 61, 18–26. [Google Scholar] [CrossRef]
  28. Schernewski, G.; Paysen, P.; Robbe, E.; Inácio, M.; Schumacher, J. Ecosystem service assessments in water policy implementation: An analysis in urban and rural estuaries. Front. Mar. Sci. 2019, 6, 183. [Google Scholar] [CrossRef] [Green Version]
  29. Grizzetti, B.; Lanzanova, D.; Liquete, C.; Reynaud, A.; Cardoso, A.C. Assessing water ecosystem services for water resource management. Environ. Sci. Policy 2016, 61, 194–203. [Google Scholar] [CrossRef]
  30. Vlachopoulou, M.; Coughlin, D.; Forrow, D. The potential of using the ecosystem approach in the implementation of the EU Water Framework Directive. Sci. Total Environ. 2014, 471, 684–694. [Google Scholar] [CrossRef]
  31. Levine, A.S.; Feinholz, C.L. Participatory GIS to inform coral reef ecosystem management: Mapping human coastal and ocean uses in Hawaii. Appl. Geogr. 2015, 59, 60–69. [Google Scholar] [CrossRef]
  32. Inácio, M.; Schernewski, G.; Nazemtseva, Y.; Baltranaitė, E.; Friedland, R.; Benz, J. Ecosystem services provision today and in the past: A comparative study in two Baltic lagoons. Ecol. Res. 2018, 33, 1255–1274. [Google Scholar] [CrossRef]
  33. Karstens, S.; Langer, M.; Nyunoya, H.; Čaraitė, I.; Stybel, N.; Razinkovas-Baziukas, A.; Bochert, R. Constructed floating wetlands made of natural materials as habitats in eutrophicated coastal lagoons in the Southern Baltic Sea. J. Coast. Conserv. 2021, 25, 1–14. [Google Scholar] [CrossRef]
  34. Vallely, K.; Gibson, P. Engaging students on their devices with Mentimeter. Compass J. Learn. Teach. 2018, 11, 1–6. [Google Scholar] [CrossRef]
  35. Taylor, D.; Saurel, C.; Nielsen, P.; Petersen, J.K. Production characteristics and optimization of mitigation mussel culture. Front. Mar. Sci. 2019, 6, 698. [Google Scholar] [CrossRef] [Green Version]
  36. Maar, M.; Larsen, J.; von Thenen, M.; Dahl, K. Site selection of mussel mitigation cultures in relation to efficient nutrient compensation of fish farming. Aquac. Environ. Interact. 2020, 12, 339–358. [Google Scholar] [CrossRef]
  37. Chopin, T.; Cooper, J.A.; Reid, G.; Cross, S.; Moore, C. Open-water integrated multi-trophic aquaculture: Environmental biomitigation and economic diversification of fed aquaculture by extractive aquaculture. Rev. Aquac. 2012, 4, 209–220. [Google Scholar] [CrossRef]
  38. Bi, R.; Zhou, C.; Jia, Y.; Wang, S.; Li, P.; Reichwaldt, E.S.; Liu, W. Giving waterbodies the treatment they need: A critical review of the application of constructed floating wetlands. J. Environ. Manag. 2019, 238, 484–498. [Google Scholar] [CrossRef] [PubMed]
  39. Karstens, S.; Inácio, M.; Schernewski, G. Expert-based evaluation of ecosystem service provision in coastal reed wetlands under different management regimes. Front. Environ. Sci. 2019, 7, 63. [Google Scholar] [CrossRef]
  40. Razinkovas-Baziukas, A.; Stybel, N.; Grigaitis, Ž.; Karstens, S.; Bielecka, M. Technical Monitoring Report. LiveLagoons Project. 2021. Available online: http://www.balticlagoons.net (accessed on 30 December 2021).
  41. Brown, G.; Fagerholm, N. Empirical PPGIS/PGIS mapping of ecosystem services: A review and evaluation. Ecosyst. Serv. 2015, 13, 119–133. [Google Scholar] [CrossRef]
  42. Damastuti, E.; de Groot, R. Participatory ecosystem service mapping to enhance community-based mangrove rehabilitation and management in Denmark, Indonesia. Reg. Environ. Change 2019, 19, 65–78. [Google Scholar] [CrossRef] [Green Version]
  43. Blomqvist, S.; Gunnars, A. Räddningsplan forö stersjön. (Rescueplan for the Baltic Sea). Kemivärlden Biotech. Med. Kem. Tidskr. 2008, 4, 28–30. [Google Scholar]
  44. Cooke, G.D.; Welch, E.B.; Peterson, S.; Nichols, S.A. Restoration and Management of Lakes and Reservoirs; CRC Press: Boca Raton, FL, USA, 2005. [Google Scholar]
  45. Spears, B.M.; Maberly, S.C. Lessons learned from geoengineering freshwater systems. Nat. Clim. Chang. 2014, 4, 935–936. [Google Scholar] [CrossRef]
  46. Conley, D.J.; Paerl, H.W.; Howarth, R.W.; Boesch, D.F.; Seitzinger, S.P.; Havens, K.E.; Likens, G.E. Controlling eutrophication: Nitrogen and phosphorus. Science 2009, 323, 1014–1015. [Google Scholar] [CrossRef]
  47. Nizzoli, D.; Welsh, D.T.; Viaroli, P. Seasonal nitrogen and phosphorus dynamics during benthic clam and suspended mussel cultivation. Mar. Pollut. Bull. 2011, 62, 1276–1287. [Google Scholar] [CrossRef]
  48. Robbe, E.; Woelfel, J.; Balčiūnas, A.; Schernewski, G. An impact assessment of beach wrack and litter on beach ecosystem services to support coastal management at the Baltic Sea. Environ. Manag. 2021, 68, 835–859. [Google Scholar] [CrossRef]
  49. Bergström, P.; Durland, Y.; Lindegarth, M. Deposition of shells modify nutrient fluxes in marine sediments: Effects of nutrient enrichment and mitigation by bioturbation below mussel farms. Aquac. Environ. Interact. 2020, 12, 315–325. [Google Scholar] [CrossRef]
  50. Holmer, M.; Thorsen, S.W.; Carlsson, M.S.; Kjerulf, P.J. Pelagic and benthic nutrient regeneration processes in mussel cultures (Mytilus edulis) in a eutrophic coastal area (Skive Fjord, Denmark). Estuaries Coasts 2015, 38, 1629–1641. [Google Scholar] [CrossRef] [Green Version]
  51. Huang, X.; Zhao, F.; Song, C.; Chai, Y.; Wang, Q.; Zhuang, P. Larva fish assemblage structure in three-dimensional floating wetlands and non-floating wetlands in the Changjiang River estuary. J. Oceanol. Limnol. 2020, 39, 721–731. [Google Scholar] [CrossRef]
  52. Calheiros, C.S.; Carecho, J.; Tomasino, M.P.; Almeida, C.M.R.; Mucha, A.P. Floating Wetland Islands Implementation and Biodiversity Assessment in a Port Marina. Water 2020, 12, 3273. [Google Scholar] [CrossRef]
  53. De Stefano, L. Facing the water framework directive challenges: A baseline of stakeholder participation in the European Union. J. Environ. Manag. 2010, 91, 1332–1340. [Google Scholar] [CrossRef]
  54. Graversgaard, M.; Jacobsen, B.; Kjeldsen, C.; Dalgaard, T. Stakeholder Engagement and Knowledge Co-Creation in Water Planning: Can Public Participation Increase Cost-Effectiveness? Water 2017, 9, 191. [Google Scholar] [CrossRef] [Green Version]
Figure 1. Overview of the study area. The different pictograms show in which countries ecosystem service assessments and participatory mappings were conducted. Furthermore, they indicate which countries already have experience with ecological measures like mussel cultivation or floating wetlands.
Applsci 12 01871 g001
Figure 2. Different ecological measures consisting of different mussel farm strategies (AC) and the example of an artificial floating wetland (D) (not to scale).
Applsci 12 01871 g002
Figure 3. Different scenarios and their sites (five-pointed star), which were assessed in different ESAs. (1) Two mussel farm scenarios in Danish coastal waters: (a) commercial mitigation farm in the Skive Fjord vs. (b) the IMTA approach in the Horsens Fjord; (2) two mussel farm scenarios in the Curonian Lagoon: commercial mitigation farm vs. beach mussel farm; and (3) beach mussel farm scenario vs. floating macrophyte islands in Greifswalder Bodden.
Applsci 12 01871 g003
Figure 4. Locations of the flags for potential installation sites of sea-based measures for nutrient removal which the participants pinned during the workshops in Stralsund, Germany (23 January 2018; symbol: circle), in Athens, Greece (22 March 2018; symbol: square), and in Klaipeda, Lithuania (24 May 2018; symbol: triangles). (A) German and Polish coastal waters, with focus on the Greifswalder Bodden and the Szczecin Lagoon. (B) Lithuanian coastal waters, with focus on the Curonian Spit.
Applsci 12 01871 g004
Figure 5. Flow chart of the planning and implementation process of the WFD in Germany and indication where ESA and a combination of PA and ESA could be beneficial to accelerating the selection and implementation of new mitigation measures.
Applsci 12 01871 g005
Table 1. Overview of workshops in which the participatory mapping approach was applied.
Workshop LocationDateWorkshop BackgroundTarget GroupNumber of ParticipantsScience BackgroundGovernment BackgroundBusiness BackgroundNGO Background
Stralsund, Germany
(PM1)
23 January 2018Stakeholder workshop on internal nutrient reduction measuresStakeholder3231%34%13%22%
Athens, Greece
(PM2)
22 March 20188th European Coastal Lagoons SymposiumStakeholder2290%5%0%5%
Klaipeda, Lithuania
(PM3)
24 May 2018Interreg South Baltic Annual EventStakeholder1650%25%0%25%
Table 2. Overview of Ecosystem service assessment workshops and applied scenarios and methods.
WorkshopsTarget GroupNo. of ParticipantsScenariosSitesAssessment ApproachNo. of ESsPlaceDateDiscussion Strategy
1Experts12Commercial MF vs. Beach MFCuronian LagoonPaper-based25Klaipeda, Lithuania27 September 2018After the assessment
2Stakeholders4Commercial MF vs. Beach MFCuronian LagoonPaper-based25Nida, Lithuania10 January 2018After the assessment
3Graduate Students15Commercial MF vs. Beach MFGreifswald BoddenWeb-based8Warnemünde, Germany7 January 2019After every single ES
4Experts11Commercial MF vs. IMTALimfjord; Horsens FjordWeb-based25Ranum, Denmark22 August 2019After every scenario
5Graduate Students5Commercial MF vs. Beach MFCuronian LagoonWeb-based25Klaipeda, Lithuania9 December 2019After every ES division
6Stakeholders16Beach MF vs. Floating IslandsGreifswald BoddenWeb-based8Stralsund, Germany11 September 2019After the assessment
7Graduate Students16Beach MF vs. Floating IslandsGreifswald BoddenWeb-based8Kiel, Germany12 October 2019After every single ES of the assessment
Table 3. Ecosystem service classes and the associated descriptions which were chosen for the ecosystem service assessment.
DivisionEcosystem Service ClassesDescription
ProvisioningWild plant outputsHarvest and number of species (e.g., algae) for consumption
Wild animal outputHarvest and number of species (e.g., fish) for consumption
AquacultureTotal and key market species landings (e.g., fish seafood)
Materials for processing and agricultureHarvested amount and value (fodder, fiber, seaweed, and fertilizer)
Physical and bioenergyAmount of abiotic and biotic energy resources (wind or wave energy, solar panels, and methane production)
Navigation and waterwaysShipping (international ferries and cruisers) and water-based local public transport
Harbors and maritime industriesAreas with sea access
Regulation and MaintenanceBurial of nutrients and organic matterSediment accumulation rate
Nutrient removalN-denitrification
Primary productivityNutrient and Chl.a concentration
Water transparencySecchi depth
Matter transformationWater residence time
Oxygen provision(Bottom) oxygen concentration (above 6 mg/L)
Pest controlPotentially harmful algae blooms and number of alien species
Nursery groundsSize and number of nursery areas
Habitat biodiversitySize and number of habitats
Mass stabilizationExtension of macrophyte habitats
Flood protectionBuffering capacity for high water levels, wave attenuation, and current reduction
CulturalBathing and sunbathingWater transparancy and shell accumulation
Recreation and water sportsWater sports and recreational activities like surfing, paddling, sailing, and angling
Aesthetic experienceNumber of seaside visitors looking for enjoyment provided by land and sea ecosystems
Attractiveness for seaside housingLength of shoreline, number of flats with a sea view or access, and floating houses
Experimental useParticipation in biota-related activities (bird watching and iconic species watching)
Scientific and educationalScientific and educational publications, documentaries, and exhibitions
Economic developmentNumber of jobs and amount of total income
Table 4. Amount of flags pinned for potential installation sites for different internal nutrient removal measures. The round brackets show the percentages per workshop, the square brackets show the percentage distribution across all workshops, and the curved brackets the total share of all measures pinned.
MeasureFlag ColorStralsund Workshop (PM1)Athens Workshop (PM2)Klaipeda Workshop (PM3)Total Amount
Macrophyte measure (EE)Green15 (50) [58]5 (31) [19]6 (40) [23]26 {44}
Mussel measure (EE)Blue9 (30) [69]2 (13) [15]2 (13) [15]13 {22}
Mechanical measures (HE)Yellow2 (7) [18]7 (44) [64]2 (13) [18]11 {19}
Geoengineering measures (GE)Red005 (33) [100]5 {9}
No measureWhite4 (13) [100]004 {7}
Sum 30141559
Table 5. Comparison of two ecosystem service assessments assessing the effects (changes) of large-scale commercial mitigation mussel farms based in Lithuanian and Danish coastal waters. The assessment was conducted by experts. The mean and median values were calculated based on the aggregated number of ratings.
Commercial Mitigation Farm (Lithuania)Commercial Mitigation Farm (Denmark)
Provisioning Ecosystem ServicesMeanMedianSt. Dev.MeanMedianSt. Dev.Diff. in MeanDiff. in Median
Wild plant outputs001.8111.011
Wild animal outputs221.2221.000
Aquaculture211.5331.522
Materials for processing and agriculture111.1111.200
Physical and bioenergy001.3000.300
Navigation and waterways−1−12.3−1−10.900
Harbors and maritime industries002.2111.311
Regulating Ecosystem ServicesMeanMedianSt. Dev.MeanMedianSt. Dev.Diff. in MeanDiff. in Median
Burial of nutrients and organic matter111.8−1−11.4−2−2
Nutrient removal122.0331.811
Primary productivity002.4−2−20.7−2−2
Water transparency 221.0331.311
Matter transformation111.3000.8−1−1
Oxygen provision−2−32.4111.434
Pest control002.5101.110
Nursery grounds111.8221.411
Habitat diversity221.9220.800
Mass stabilization111.7220.911
Flood protection101.4101.000
Cultural Ecosystem ServicesMeanMedianSt. Dev.MeanMedianSt. Dev.Diff. in MeanDiff. in Median
Bathing and sunbathing000.9221.222
Recreation and water sports−1−12.0001.511
Aesthetic experience001.6001.100
Attractiveness for seaside housing001.0001.200
Experiential use221.6102.0−1−2
Scientific and educational331.3221.7−1−1
Economic development221.1221.400
Table 6. Comparison of two mussel farm applications assessing the effects (changes) on ecosystem services. The mussel farm applications included an IMTA approach (Horsens Fjord) and a large-scale commercial mitigation mussel farm (Skive Fjord), both located in Danish coastal waters. The assessment was conducted by experts with mussel cultivation backgrounds. The mean and median values were calculated based on the aggregated number of ratings.
Commercial Mitigation Farm (Denmark)IMTA (Denmark)
Provisioning Ecosystem ServicesMeanMedianSt. Dev.MeanMedianSt. Dev.Diff. in MeanDiff. in Median
Wild plant outputs111.0111.000
Wild animal outputs221.0220.900
Aquaculture331.5440.911
Materials for processing and agriculture111.2221.311
Physical and bioenergy000.3000.300
Navigation and waterways−1−10.9−1−21.10−1
Harbors and maritime industries111.3111.000
Regulating Ecosystem ServicesMeanMedianSt. Dev.MeanMedianSt. Dev.Diff. in MeanDiff. in Median
Burial of nutrients and organic matter−1−11.4002.111
Nutrient removal331.8001.7−3−3
Primary productivity−2−20.7110.933
Water transparency 331.3101.1−2−3
Matter transformation000.8000.700
Oxygen provision111.4000.5−1−1
Pest control101.1−1−11.52−1
Nursery grounds221.4111.8−1−1
Habitat diversity220.8111.3−1−1
Mass stabilization220.9111.5−1−1
Flood protection101.0101.000
Cultural Ecosystem ServicesMeanMedianSt. Dev.MeanMedianSt. Dev.Diff. in MeanDiff. in Median
Bathing and sunbathing221.2001.4−2−2
Recreation and water sports001.5−1−11.3−1−1
Aesthetic experience001.1−1−11.2−1−1
Attractiveness for seaside housing001.2−1−11.4−1−1
Experimental use102.0001.2−10
Scientific and educational221.7331.911
Economic development221.4221.5−10
Table 7. Comparison of two mussel farm applications assessing the impacts on ecosystem services. The mussel farm applications are a beach mussel farm and large-scale commercial mitigation mussel farm both located in the Curonian Lagoon. The assessment was conducted by experts. The mean and median values were calculated based on the aggregated number of ratings.
Beach Mussel Farm (Lithuania)Commercial Mitigation Farm (Lithuania)
Provisioning Ecosystem ServicesMeanMedianSt. Dev.MeanMedianSt. Dev.Diff. in MeanDiff. in Median
Wild plant outputs001.8001.800
Wild animal outputs221.1221.200
Aquaculture111.0211.5−10
Materials for processing and agriculture110.9111.100
Physical and bioenergy101.4001.300
Navigation and waterways−1−11.1−1−12.310
Harbors and maritime industries001.5002.200
Regulating Ecosystem ServicesMeanMedianSt. Dev.MeanMedianSt. Dev.Diff. in MeanDiff. in Median
Burial of nutrients and organic matter111.6111.800
Nutrient removal111.8122.0−1−1
Primary productivity001.9002.400
Water transparency 231.0221.001
Matter transformation101.1111.3−1−1
Oxygen provision−1−22.2−2−32.401
Pest control−102.0002.500
Nursery grounds111.5111.800
Habitat diversity221.3221.900
Mass stabilization101.8111.70−1
Flood protection111.5101.401
Cultural Ecosystem ServicesMeanMedianSt. Dev.MeanMedianSt. Dev.Diff. in MeanDiff. in Median
Bathing and sunbathing111.7000.901
Recreation and water sports−1−22.4−1−12.00−1
Aesthetic experience−1−12.2001.6−1−1
Attractiveness for seaside housing001.8001.000
Experimental use221.4221.600
Scientific and educational331.2331.300
Economic development221.5221.100
Table 8. Comparison of a mussel farm application and floating wetland, assessing the impacts on ecosystem services. The mussel farm applications were a beach mussel farm and floating wetland, both located in Greifswalder Bodden. The assessment was conducted by local non-expert stakeholders. The mean and median values were calculated based on the aggregated number of ratings.
Beach Mussel Farm (Germany)Floating Wetlands (Germany)
Provisioning Ecosystem ServicesMeanMedianSt. Dev.MeanMedianSt. Dev.Diff. in MeanDiff. in Median
Wild food111.3110.810
Livestock and aquaculture220.9100.9−1−2
Crop plants000.2111.111
Regulating Ecosystem Services
Nutrient regulation111.0110.800
Water quality improvement210.8110.800
Biodiversity and habitats 211.2230.712
Cultural Ecosystem Services
Recreation and tourism0−11.5221.123
Landscape aesthetics−1−11.4211.022
Publisher’s Note: MDPI stays neutral with regard to jurisdictional claims in published maps and institutional affiliations.

