Article

Reducing the Total Product Cost at the Product Design Stage

1
Faculty of Economics and Management, University of Zielona Gora, 65-417 Zielona Gora, Poland
2
Department of Materials and Production, Aalborg University, 9220 Aalborg, Denmark
3
Department of Production Computerisation and Robotisation, Faculty of Mechanical Engineering, Lublin University of Technology, 20-618 Lublin, Poland
*
Author to whom correspondence should be addressed.
Appl. Sci. 2022, 12(4), 1921; https://doi.org/10.3390/app12041921
Submission received: 23 December 2021 / Revised: 2 February 2022 / Accepted: 10 February 2022 / Published: 12 February 2022

Abstract

:
Currently used decision support systems allow decision-makers to evaluate the product performance, including a net present value analysis, in order to enable them to make a decision regarding whether or not to carry out a new product development project. However, these solutions are inadequate to provide simulations for verifying a possibility of reducing the total product cost through changes in the product design phase. The proposed approach provides a framework for identifying possible variants of changes in product design that can reduce the cost related to the production and after-sales phase. This paper is concerned with using business analytics to cost estimation and simulation regarding changes in product design. The cost of a new product is estimated using analogical and parametric models that base on artificial neural networks. Relationships identified by computational intelligence are used to prepare cost estimation and simulations. A model of product development, production process, and admissible resources is described in terms of a constraint satisfaction problem that is effectively solved using constraint programming techniques. The proposed method enables the selection of a more appropriate technique to cost estimation, the identification of a set of possible changes in product design towards reducing the total product cost, and it is the framework for developing a decision support system. In this aspect, it outperforms current methods dedicated for evaluating the potential of a new product.

1. Introduction

The shorter product life cycles result in increasing product variety in contemporary businesses. Moreover, the time-limited new product development (NPD) and scarce resources force companies to manage NPD projects more carefully. Increasing competition and customers’ requirements impose continual product introductions on the market. Some studies of new product performance have shown that about two third fail within 2 years after launch, about 80% fail, and about 90% fail to return the cost of capital [1]. Product launch before competition, customer satisfaction, and controllable costs are prerequisites for the product success. If the total costs related to NPD, production, and after-sales service are unacceptable for decision-makers, then they can prefer to acquire information of feasible changes in product design that could reduce the costs involved in the whole product life cycle. The product design stage seems to be an effective way to fulfill market demands such as a shorter time to launch, product variety, and reduction of material and energy consumption. Consequently, the NPD process is one of the most important issues in today’s businesses.
The cost of an NPD project includes identifying customer preferences, generating ideas of a new product, its designing and testing. Prototype tests are usually a comprehensive process that requires the majority of the NPD budget. On the other hand, prototyping costs are slight (if not negligible) in comparison to the total cost of production [2]. The unit production cost is mainly related to materials, labor, and energy consumption. Nevertheless, the number of prototype tests affects product reliability, and finally, the costs of defective products in manufacturing and after-sales service. Poor reliability of a product can reduce customer satisfaction and enlarge the cost of warranty repairs. Therefore, the trade-off should be found between the NPD cost and costs related to manufacturing and after-sales service. These costs also depend on the quality of material used in manufacturing, including material density and strength. Consequently, the relationships between materials used, prototype tests, defective products, and costs are sought.
In the product design stage, analogical, and parametric techniques are mainly used to cost estimation [3]. Dependencies between variables can be recognized using parametric models that base on multiple regression analysis and computational intelligence techniques. These techniques include, among others, artificial neural networks and neuro-fuzzy systems that are successfully used in the field of production, marketing, distribution [4,5,6]. The use of these techniques in the context of NPD have been presented to forecasting new product success and cost estimation [7]. The contribution of this study is to present the use of business analytics, including computational intelligence techniques, to identify dependencies within materials parameters, number of prototype tests, defective products, and repairs in the warranty period. These dependencies affect costs in the whole product life cycle, from product design, through production process, to after-sales service.
Dependencies identified by computational intelligence techniques are used not only to cost estimation of a new product, but also to search for feasible variants of changes at the product design stage. These changes aim to reduce the total cost of a new product. Recognition of feasible changes requires the specification of variables, their domains and constraints, including the above-mentioned dependencies. The considered problem can be specified in terms of a constraint satisfaction problem (CSP) that can be solved using constraint programming (CP) techniques. CP provides effective search strategies that reduce time needed to solve a wide range of combinational problems. In the aspect of NPD, the CSP paradigm has been mainly used in the field of product design [8,9]. The use of CSP paradigm to cost estimation has been presented within the NPD cost, advertising cost, and unit production cost in [10]. This study develops previous research in the context of using the CSP paradigm to finding the trade-off between the cost of product development and the costs related to production and after-sales service. As a result, the contribution of this study is an extension of a cost estimation model towards involving the variables related to product design (e.g., material properties, prototype tests), production process (e.g., the number of defective products), and after-sales stage (e.g., the number of repairs in the warranty period). The cost of testing prototypes of a product increases directly in the number of tests, but at the same time, it can reduce the cost of defective products in manufacturing and after-sales service.
Currently used software solutions dedicated to planning an NPD project provide information of the predicted project cost [11,12]. However, if the company’s resources (e.g., the project budget, project team members) are scarce to manage an NPD project according to schedule, project managers may be interested in acquiring information about possible changes to complete the project within admissible resources. Moreover, the total cost of a new product can have an unacceptable level for top executives. Current software solutions do not support project managers in identifying feasible variants of project completion, for which the desired level of the cost is sought. The proposed approach provides foundations to develop a decision support system with the use of computational intelligence in order to build parametric estimation model and simulate a possibility of reducing the total product cost. The paper aims to elaborate an approach for estimating product cost and simulating its reduction through changes in the product design stage. The product cost refers to the whole life cycle of a product including product development, production, and after-sales service. Considering that the production cost usually constitutes the majority of the total product cost, this study mainly focuses on the production process, trying to identify changes at the product design stage that affect cost reduction in manufacturing.
Current methods of planning an NPD project use a procedural approach, in which an NPD model is built for a specific problem, and the process of designing the model ends when the structure of the model is sufficient to solve the problem. By contrast, in a declarative approach a single NPD model is developed, and it can be used to formulate various NPD-related decision problems [10]. A declarative representation of an NPD model provides a framework for applying effective techniques towards reducing the search space of possible solutions. This is particularly significant in the case of many decision variables with large domains which have to be involved in simulations. Using a declarative representation of an NPD model, decision-makers obtain more scenarios of feasible NPD project performance than they would if using traditional scenario analysis that includes the basic, optimistic and pessimistic variants. Moreover, decision-makers may acquire variants of NPD project performance which is something new and unexpected for them. This is particularly important in multi-project environments, where resources are shared [10].
This study develops previous research [7,10] towards using the declarative approach to search for changes in product design that could be reduced the total product cost. The novelty of this research is twofold: specifying a model of the NPD project and company’s resources as a set of variables and constraints, and designing a method of developing a decision support system dedicated to cost estimation and simulation of cost reduction. The proposed method uses computational intelligence techniques to identify complex relationships among data, and constraint programming to effectively search for possible solutions. As a result, the proposed approach outperforms others in the extent of combining analogical and parametric cost estimation, as well as simulation of cost reduction.
The paper is organized as follows: Section 2 presents a literature review, including description of the product design stage, the total product cost, and business analytics in product development. Section 3 describes problem specification in terms of a CSP and a method of cost estimation and identification of possible variants of cost reduction. The applicability of the proposed approach is illustrated in Section 4. Finally, conclusion and further research is presented in Section 5.

2. Literature Review

2.1. The Product Design Stage

Product design requires using specific methods to improve its efficiency, and consequently, reduce the cost of this stage. Conceptual design is the key factor in development of new products and redesign of existing products [13]. Generally, conceptual design refers to selecting an appropriate solution principle from various alternatives in order to link it to each product function component. Conceptual schemes are generated to satisfy design requirements towards combining solution principles for different function components without violating a set of constraints [14]. One of the most popular tools for conceptual design is morphological matrix. This tool involves many factors referring to task-related factors (e.g., complexity of product, and vagueness of initial engineering requirement) and decision-related factors (e.g., the expertise and diversity of design engineers, and the methods for aggregating judgments) [15]. Data and information for this phase come from experiences and subjective judgments of the design team and customer requirements regarding, for example, high reliability of a product.
Product conceptual design can be supported by matrix-based methods (e.g., quality function deployment, design structure matrix) and computer-based methods (e.g., genetic algorithms) [13]. Quality function deployment makes a framework for improving product design, among others, in the aspect of reducing project and product cost and time, and better communication of cross-functional teamwork, increasing customer satisfaction and market share [16]. The design structure matrix captures existence and strength of an interaction between design tasks or parts of a product [17]. Computer-based methods use computational intelligence and multi-agent systems to solve problems with the large size of the domain and frequently changing structure [18]. Big data analytics improves deficiency of other methods through using real data instead of predicted or simulated data, and consequently, it quantifies external and internal uncertainties in the product design process [19]. The use of big data analytics is growing for the better data-driven decision making [20]. Data analytics provide a cost-effective way to obtain users’ information of products that can be easily collected and used for product improvement [19]. This research develops predictive and prescriptive analytics for the product development process.
The product design phase begins the product life cycle, and consequently it affects other phases, including the impact on the material and energy consumption, unit production cost, and product price. The placement of product design in the product life cycle from a perspective of sustainable manufacturing is illustrated in Figure 1.
Sustainable manufacturing aims to obtain a trade-off between environmental, social, and economic dimensions to meet stakeholder requirements and achieve a competitive advantage [22]. An environmental dimension can be considered in terms of prevention of environmental damage, land conservation, emissions, and energy reduction. A social dimension concerns the relationship between stakeholders within and outside an enterprise. In turn, an economic dimension affects quality and productivity, delivery on time, innovation, and cost [23]. Assessment for the above-mentioned dimensions refers to environmental impact reduction, and it can be considered from an eco-efficiency perspective [24].

2.2. The Total Product Cost

Each phase of the product life cycle generates the costs related to product management. The cost of new product development includes market research, labor cost regarding team members’ salaries in the different phases of product development, material and energy used to manufacturing prototypes and product trial, their tests, as well as the cost of machine utilization, and external services, if any. Costs of production refer to job preparation, machine utilization, manufacturing, assembly, and quality assurance. The unit production cost includes costs related to material, labor, energy used in the production process, as well as overhead cost that can be assigned to a product. The sales and marketing costs contains advertising campaigns, shipping, and handling costs related to packing, carrying, and installation [25]. After-sales service is related to warranty costs, product remanufacturing, and product disposal, if any.
Figure 2 illustrates cost values in a typical product life cycle. At the beginning, there is only the cost related to product development. After product launch, production and marketing cost occur that usually depends on the sales volume. There is also the after-sales cost that can occur during product usage or after removal of the product from the market. It is worth noting that production and after-sales cost are much larger than the development cost.
The product designers are forced to obtain a trade-off between cost, product quality and functionality, and as a result, to develop a product by minimal cost and suitable customer satisfaction. This requires a proper cost product management in the phase of product design that is a techno-economic process [26]. Decisions in the design phase significantly affect product development and life cycle costs. Consequently, product design determines the majority of the manufacturing cost and product usage.
There are many methods dedicated to cost estimation and optimization of the total product cost and customer satisfaction. Cost estimation methods can be divided into four groups [27]: intuitive, analogical, analytical, and parametric. Intuitive methods use past experience of an estimator. Analogical methods estimate the cost of new products using similarity to previous products. Analytical methods estimate the cost of a product by decomposing product development into elementary tasks with known cost. In turn, parametric methods estimate the cost of a new product from parameters that significantly influence the cost. This research is concerned with parametric cost methods.
Cavalieri et al. [28] propose another classification of cost estimation methods that are categorized into analogy-based techniques, parametric models and engineering approaches. Analogy-based techniques are qualitative estimation methods based on an analysis of similarity between the new product and existing products. Parametric models include an analytical function of a set of variables which are usually related to some features of the new product (e.g., dimensions, materials used) and which are thought to have a significant impact on NPD project performance. Parametric estimation techniques may be based on regression analysis [29], artificial neural networks [10,30], fuzzy logic systems [31,32,33], or hybrid systems such as neuro-fuzzy systems [5,34] and genetic algorithms [35]. Engineering approaches are predicated on a detailed analysis of product features and the manufacturing process. For example, the cost of a new product is calculated in this approach as the sum of the resources used to design and produce each component of the product (e.g., raw materials, labor, equipment). As a result, the engineering approach is best used in the final phases of product development, in which the product and the manufacturing process are well defined [28].
Prasad et al. [36] have proposed a multi-objective optimization model that integrates the methodologies of quality function deployment, value engineering, and target costing. Their model is applied to optimize customer satisfaction and the total product cost using goal programming. Park et al. [37] have specified product attributes that can be used to estimate the product life cycle cost. A product attribute list includes, among others, durability, materials, performance, functionality, assemblability, price, product liability, distribution volume, and lifetime. They have used a feed-forward artificial neural network with backpropagation to estimate the maintenance cost in the usage phase. Artificial neural networks have also been successfully used to estimation of the NPD and unit production cost [10,38].

2.3. Business Analytics in Product Development

The goal of business analytics is to allow organizations to provide meaningful insight, support management decisions related to business performance, and finally, gain a competitive advantage [39,40,41]. Business analytics refers to the extensive use of data, acquired from different sources, statistical and quantitative analysis, explanatory and predictive models in order to drive decisions and actions to proper stakeholders [42]. Business analytics is mainly divided into three groups [41,43,44]: (i) descriptive analytics, answering to questions such as “What has happened?” and “Why did it happen?”; (ii) predictive analytics, answering to questions “What will happen?” and “Why will it happen?”; (iii) prescriptive analytics, answering to questions “What should we do?” and “Why should we do it?”. Descriptive and predictive analytics refer to pattern identification in the past and future, respectively. To identify relationships between variables, there are usually used statistical analysis (including linear regression, logistic regression, support vector regression), and machine learning (including artificial neural networks, decision trees, clustering-based heuristics). Prescriptive analytics suggest (prescribe) the best decision options in order to take advantage of the predicted future using large amounts of data. It can be considered from two perspectives of human intervention: decision support (e.g., by providing recommendations) and decision automation (e.g., by implementing the prescribed actions). To solve this task, it uses optimization algorithms, artificial intelligence techniques (including evolutionary computation, logic-based models), and simulations (including what-if scenarios, sensitivity analysis, risk assessment) in a probabilistic context in order to provide adaptive, automated, constrained, time-dependent, and optimal decisions [41,45].
New product development is related to many factors that affect its success or failure. These factors can refer to a product (e.g., its functionality, quality, innovativeness), a company (its development, top management support, access to resources), and a market (its saturation, the strength of competition, client attitudes). Business analytics can support decision-makers in evaluating the potential success of a new product, throughout identifying relationships between features of a product, company, and market, and their impact on the predicted sales revenue and cost of a new product. The use of big data analytics in determining product development success, including the aspect of data quality assessment is presented in [46]. Ali et al. [47] have investigated the impact of using big data analytics (including the aspect of management capability, technology capability, and business knowledge) on sustainable product development, and finally, on organizational performance. Jank et al. [48] use artificial neural networks to identify the relationships between product line and portfolio indicators (inputs, e.g., product performance, risk factor, lifecycle balance) and corporate objectives (outputs, e.g., profit, market penetration, customer satisfaction). They have chosen neural networks due to their properties (ability to predict future development by analyzing past datasets, explicit and precise predictions, adaptability to differently structured datasets) that are most suitable compared to other prescriptive analytics techniques [49]. Klein et al. [50] have proposed a model of using product usage information, product structure information, and engineering knowledge to support product development. They have used advanced analytics (machine learning and simulation models) to apply design automation for modifying CAD model, compute future values of time-series data items, associate groups of data items, identify recurring sequences, recognize, and compute relations between data items (regression analysis).

3. A Data-Driven Approach to Reducing the Total Product Cost

3.1. Problem Specification

The proposed approach allows the decision-maker to identify the prerequisites which must be fulfilled in the phase of project design and prototype tests to reduce the total cost of a new product. A number of admissible variants of the NPD project performance depends on domains of variables and constraints. Relationships between variables can be identified on the basis of previous experiences with similar NPD projects. As a result, parametric models can be used to evaluate the potential of a project (the cost and revenue of a new product), as well as to verify the existence of possible changes in the phase of project design and prototype tests towards reducing the total cost of a new product to the level accepted by the decision-maker.
The presented problem can be described throughout the specification of variables, their domains, and constraints. This research proposes the problem formulation in terms of CSP that offers significant flexibility within the addition/removal of variables or constraints, and consequently, a simultaneous recalculation towards finding a new set of available solutions, if there are any. A problem specified in a CSP consists of [51]:
(V, D, C)
where:
V is a finite set of n variables {V1, V2, …, Vn};
D is a finite set of discrete domains {D1, D2, …, Dn} related to variables V;
C is a finite set of constraints {C1, C2, …, Cm}.
Each constraint is treated as a predicate that can be seen as an n-ary relation defined by a Cartesian product D1 × D2 × … × Dn. The solution to the CSP is a vector (D1i, D2k, …, Dnj) related to the assessment of the values of each variable that satisfy all constraints C. In general, constraints may be specified using analytical and/or logical formulas [51].
The variables refer to the product life cycle and company’s resources. A set of variables and constraints has been defined according to the authors’ experience. Nevertheless, a literature analysis also indicates the similar specification [25,37,52]. To use a parametric approach to cost estimation (V1, V14, V15, V18), a few variables (V5, …, V13) are chosen for their relevance to the problem (including strong impact on the cost) and controllable features, i.e., a company can use them to identify a set of their values, which satisfy all constraints and reduce the total product cost. The following set of variables for estimating the product development, production, and after-sales cost has been specified:
V1—product development cost (in thousand €);
V2—production cost (in thousand €);
V3—after-sales cost (in thousand €);
V4—unit production cost (in €);
V5—number of employees involved in product design and prototype tests;
V6—duration of product design (in months);
V7—number of prototype tests;
V8—number of product components;
V9—amount of materials used to manufacture a unit of a new product;
V10—time needed to manufacture a unit of a new product;
V11—time needed to job preparation;
V12—number of workplace units in assembling and processing a new product;
V13—density of material used to manufacture a unit of a new product;
V14—material cost per unit of product;
V15—labor cost per unit of product;
V16—energy cost per unit of product;
V17—overhead cost per unit of product;
V18—warranty cost per unit of product;
V19—number of sold products (in thousands);
V20—number of defective products (in thousands);
V21—number of repairs in the warranty period;
V22—product price (in €);
V23—sales revenue of a new product (in thousand €).
There are the following constraints regarding the available quantity of resources in a company and technical parameters of a new product: the budget of a product development project (B, in thousand €), total number of employees involved in an NPD project (E), deadline of product launch into the market (D, in months), and margin of a new product (M). The set of constraints and relationships is as follows:
V1B
V5E
V6D
V22V4V17M
V1 = f(V5, V6, V7, V8)
V2 = (V4 + V17) ∙ (V19 + V20)
V3 = V18 ∙ V21
V4 = V14 + V15 + V16
V14 = f(V5, V6, V7, V8, V9, V13)
V15 = f(V5, V6, V7, V8, V10, V11, V12)
V18 = f(V5, V6, V7, V8, V13)
V23 = V19 ∙ V22
The model formulated as a CSP includes the technical parameters of a new product and company’s resources. The problem can be solved through finding the answers to the following questions:
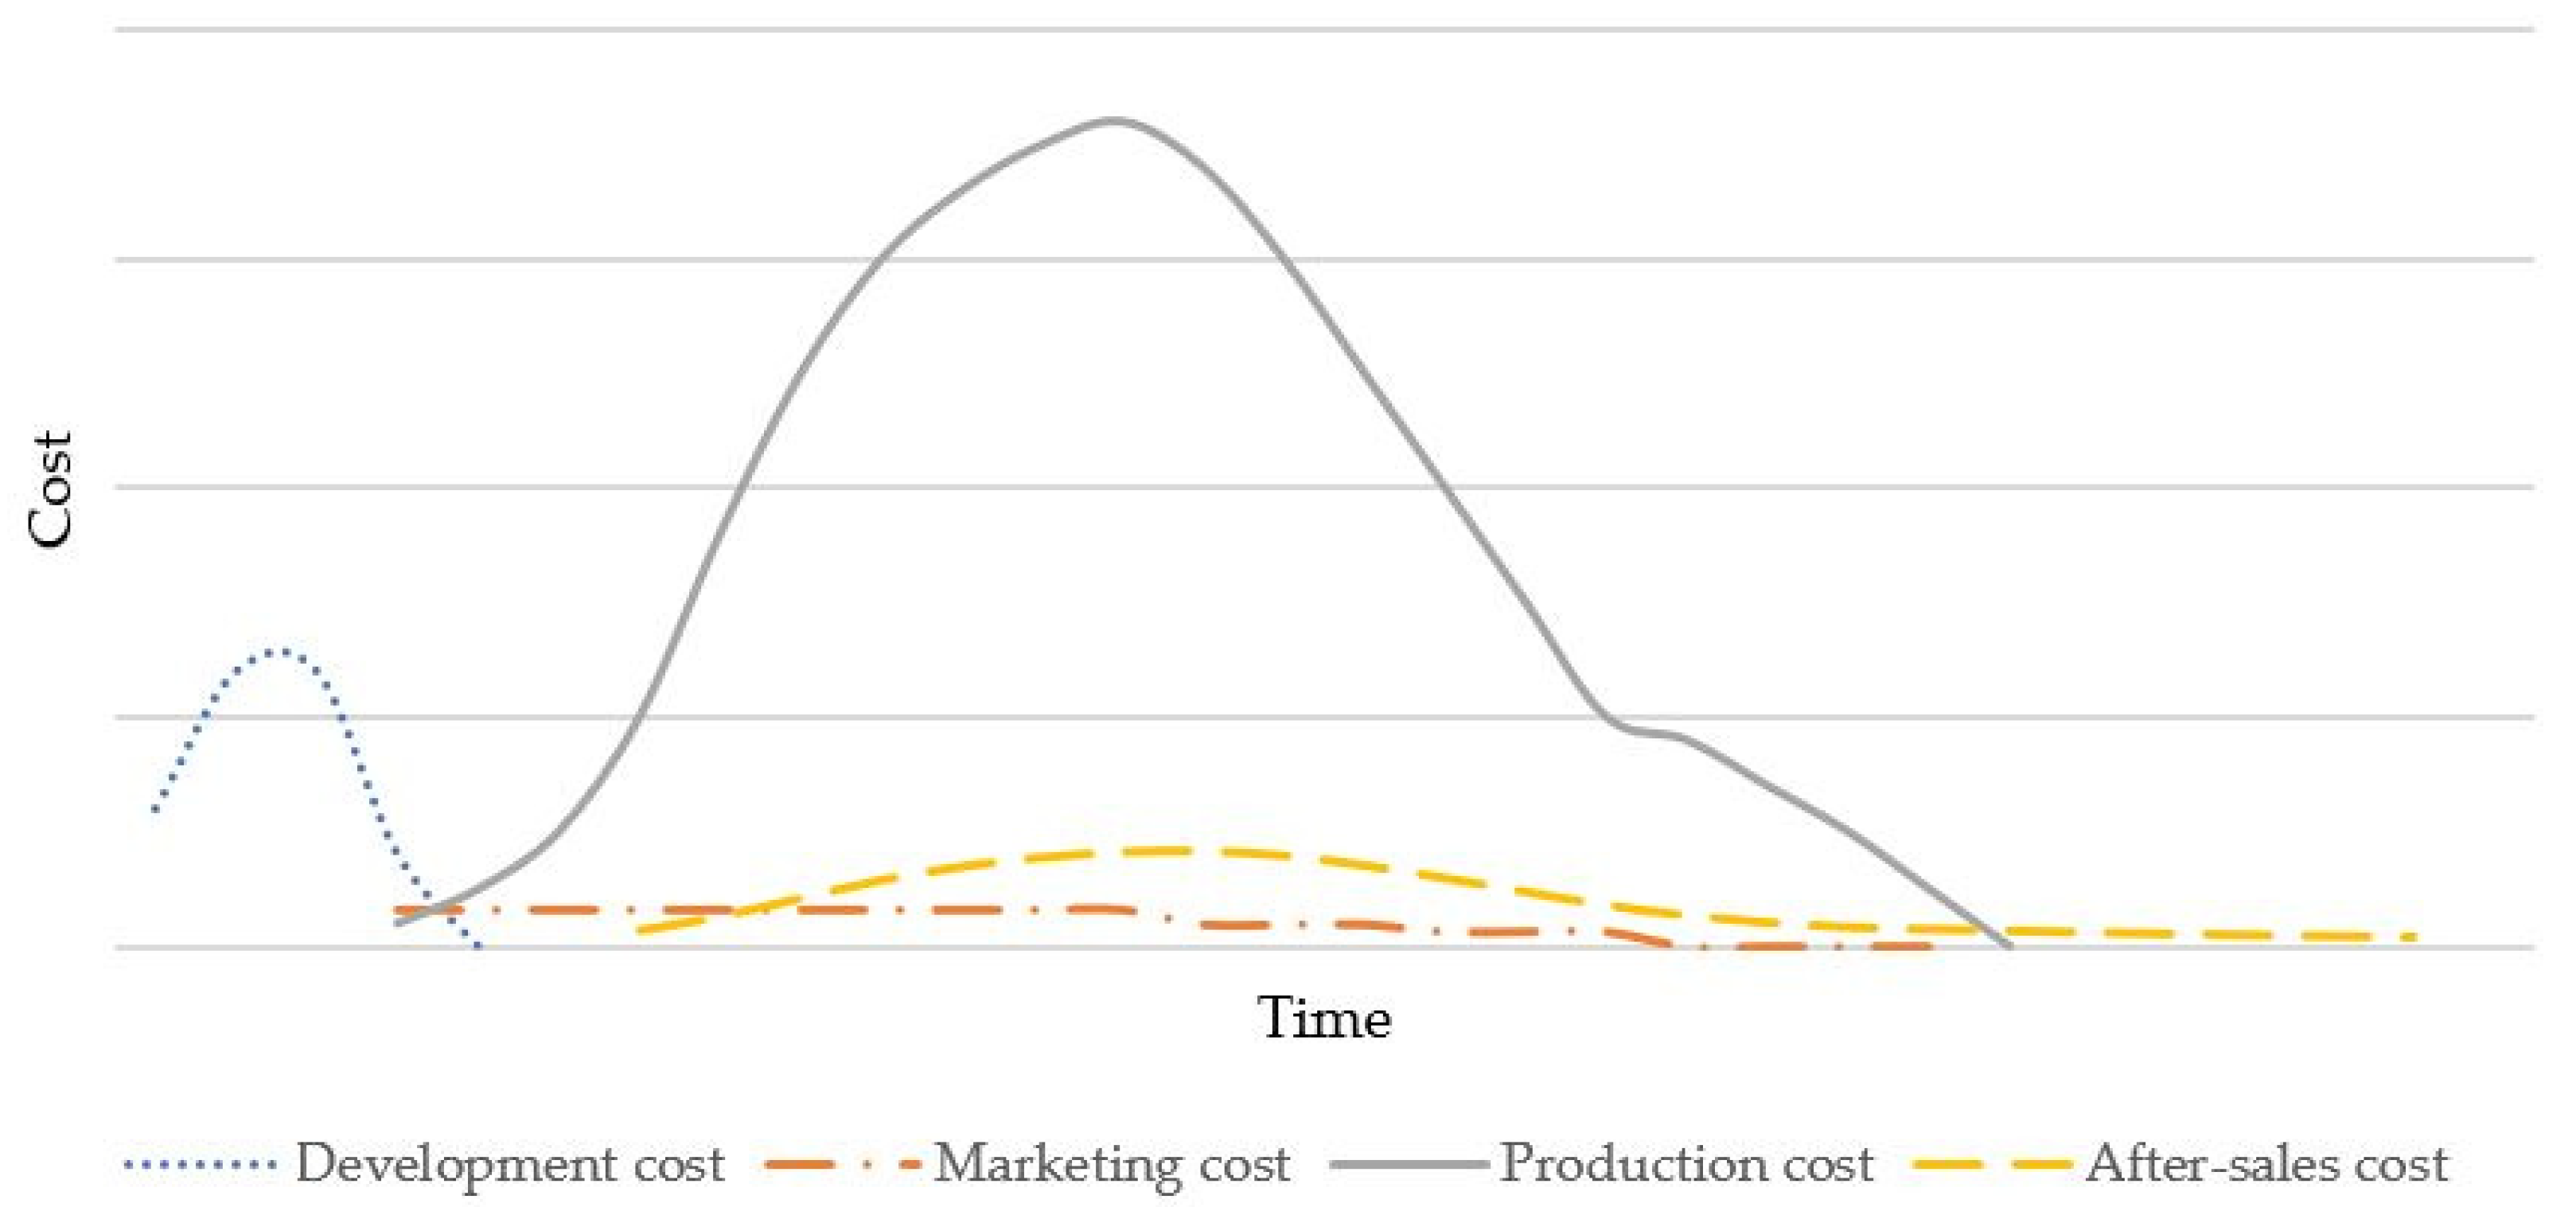
  • What is the total product cost (including product development, production, and after-sales cost)?;
  • What values should the variables have to reduce the total product cost?
The above-described problem can be specified as a CSP and effectively solved using CP techniques which include constraint propagation and variable distribution. Constraint propagation prunes the search space using constraints. Propagation techniques aim to achieve a certain level of consistency, and accelerate the search procedures to reduce the size of the search tree [51]. The declarative nature of CP is particularly useful in applications where it is enough to state what has to be solved without saying how to solve it [51]. The use of the CSP paradigm can also serve as a platform for specifying other problems (e.g., a project selection problem), and it is a well-suited framework for developing a decision support system.

3.2. A Method of Developing a Decision Support System

A proposed method includes four stages: (1) data collection from the previous NPD projects that are similar to a new project, (2) determination of estimation models, (3) use of these models to cost estimation, and (4) simulation towards finding changes in product design that allow to reduce the total product cost. Figure 3 illustrates a framework for the proposed decision support system that uses analogical and parametric models to estimate the cost and constraint programming to reduce the search space and verify the possibility of reducing the total product cost.
Data regarding products, their design, NPD project performance, sales, costs, etc., were stored in enterprise databases related to enterprise resource planning (ERP) system, computer-aided design (CAD), computer-aided engineering (CAE), computer-aided manufacturing or quality system. In the first stage, databases were considered as a potential source of useful information to evaluate the potential of a new product. Of course, a new product should be similar to past or existing products to obtain reasonable evaluations. Only these products were selected for analyis that were in the same product line as a new product, and that were the most similar products to a new product using the similarity value. The identification of the most similar product was especially useful in the case of finding a solution to the problem appeared in the phase of NPD. Case-based reasoning is widely used in product design, for example, in reducing time needed to NPD project completion [53]. The most similar products to a new product were retrieved from an enterprise database using the similarity function and similarity value that was calculated as the arithmetic average of similarity functions for all features. The similarity function was determined as follows:
s i m ( f i P , f i R ) = 1 | f i P f i R | max ( f i )
where s i m ( f i P , f i R ) —the similarity function of the i-th feature between the value of the new product f i P and the value of the retrieved product f i R .
In the next stage, dependencies were determined and used to cost estimation within product development, production, and after-sales service. The dataset was divided into learning and testing sets to verify the quality of estimation models. This study considered the use of parametric techniques, in which the cost was estimated using parameters that significantly affect the cost and they can be controlled by a company (e.g., the number of project team members, product components, and prototype tests). Relationships between variable are determined using back-propagation artificial neural networks (ANNs). ANNs are a powerful technique for solving complex approximation and classification problems. Their properties included high generalization capability, robust design, and ability to handle the incomplete data and to train and tune their parameters depending on a dataset and learning algorithm [5]. The use of ANNs offers advantages over ability to learn and identification of complex nonlinear relationships. The quality of the obtained results was compared using the mean absolute percentage errors. The cost was estimated using a more suitable model: analogical or parametric depending on the less error in the testing set.
The last stage of the proposed method refers to the simulation and searching for changes in product design towards reducing the total product cost. The size of the search space depends on the number of decision variables, their domains, and constraints that link variables and limit a set of admissible solutions. An exhaustive search always finds a solution if one exists, but its performance is proportional to the number of admissible solutions. Therefore, an exhaustive search tends to grow very quickly as the size of the problem increases, which limits its usage in solving many practical problems. As a result, there more effective methods are needed for the space search and identifying solutions, if any. This study proposed a constraint programming technique to efficiently solve the considered problem modeled in terms of a CSP.
Sensitivity analysis has been proposed in order to identify factors that have the strongest impact on the net present value (NPV). Companies are able to control their costs in a higher grade than sales revenue. As a result, this analysis allows the decision-maker to select the cost that significantly affects the NPV, production, and after-sales phase. An NPV analysis evaluates the present value of future inflows (V23) and outflows (V1, V2, V3). The NPV illustrates the sum of discounted cash flows (CF) received in t time periods at the interest rate r:
N P V = t = 0 n C F t ( 1 + r ) t
Sensitivity analysis allows decision-makers to assess the impact of sales- and cost-related factors on the NPV. The greater impact of costs on the NPV, the more important information for decision-makers, since small changes in costs can significantly improve the NPV.

4. An Example of Business Analytics for New Product Performance

An example aims to illustrate the use of the above-presented method towards supporting decision-makers at the early stage of NPD in obtaining cost estimation of a new product and simulations regarding possibilities of cost reduction. The product cost was critical factor in evaluating the potential of a new product, and selecting the most promising product for introducing on the market. The dataset used in the analysis referred to 32 past or existing products that are in the same product line as a new product. There were four output variables (V1, V14, V15, V18) related to costs of a new product. The values of input variables were retrieved from the NPD project specification (V5, , V7) and preliminary product specification (V8, , V13). The input variables were selected to parametric models of cost estimation, considering their significant impact on the specific cost and controllable features. For instance, the number of prototype tests was assigned by project managers, and the increase of prototype tests could boost the NPD cost; however, through product quality improvement it could also reduce the warranty cost, and finally, the total product cost. Decision-makers would be interested in obtaining answers to the question of directions of the most advantageous changes that can be carried out at the early stage of NPD and improve new product performance.

4.1. Descriptive Analytics

An analogical approach was based on the identification of the most similar previous products to a new product. Data stored in enterprise databases referred, among others, to material properties, such as material density and strength related to a specific part of a new product, its shape, weight, size, and material consumption. The use of CBR allowed us to not only identify the most similar past product to a new one, but also allowed a project team to retrieve a way of the problem solution that has taken place in the past similar situation, for example, for identifying the reason of failures in the manufacturing process, and possible ways that have been taken to reduce these failures in the past. This approach supports the user in selecting the most similar existing products to a new product, considering a database for products belonged to the same product line. Table 1 presents an example for calculating the similarity function (SF) and similarity value (SV) for the most similar past and new product.
SV = (93% + 92% + 88% + 93%)/4 = 91.5%
Similarity values are calculated for each product from the same product line as a new product. Table 2 illustrates the list of the most similar products that are ranked in the descending order according to their similarity values.
After selecting the most similar past product to a new one, the costs, sales volume, average price of a new product, etc., were forecasted at the same level as for the past product.

4.2. Predictive Analytics

Predictive analytics is concerned with identifying dependencies between variables related to the NPD project and products specification, and the specific cost (including the cost of NPD, material, production, and warranty per unit of product—V1, V14, V15, V18). These dependencies have been identified using feedforward artificial neural networks (ANNs). The data were divided into two sets—learning (25 cases) and testing (7 cases) to evaluate the quality of an estimating model. In this study, a multilayer ANN was trained using the back-propagation algorithm and weights optimized according to the Levenberg–Marquardt algorithm (LM) and gradient descent momentum with adaptive learning rate algorithm (GDX). The neural network structure was determined in an experimental way, via the comparison of errors in the learning and testing set for the different number of layers and hidden neurons. The mean absolute percentage errors (MAPEs) were calculated as the average of 50 iterations for an ANN structure reaching 50 hidden neurons. Experiments conducted for different number of hidden layers indicate the tendency to overfit the learning data and worse performance in predicting the cost compared to the use of one hidden layer of neurons. Therefore, the architecture of ANNs consists of one hidden layer of neurons. Moreover, the experiment results show that the increase of hidden neurons results in overfitting of an ANN model, and the optimal number of hidden neurons is between 20 and 25. Figure 4 illustrates the comparison of MAPEs calculated in the testing set using the parametric estimation technique (ANNs), analogical estimation technique (AET), and arithmetic average (AVG).
The ANNs trained according to the LM algorithm obtained the least MAPEs in the testing set for estimation models regarding the cost of material (V14), production (V15), and warranty (V18), whereas the ANNs trained according to the GDX algorithm for estimating the cost of NPD (V1). An ANN with the minimal MAPE was used to the specific cost estimation by providing the values of input variables to the trained ANN. The estimated cost of NPD was estimated at 192 thousand €, the cost of materials per unit of product reaches 12.5 €, production cost—42.7 €, and warranty—1.4 € per 1000 sold products. There was the two-year projected period of product life cycle, for which the total discounted cost of a new product reaches 1137 thousand €, and the NPV—420 thousand €.
Let us assume that the total product cost does not satisfy the decision-maker who wants to reduce the cost to 1100 thousand €. To solve this task, the problem is reformulated into the following question: Are there any values of input variables for which the expected total product cost is fulfilled?

4.3. Prescriptive Analytics

Prescriptive analytics consists of two parts using: (1) a constraint programming technique to identify a set of possible solutions; and (2) a sensitivity analysis for changes in the selected decision variables.

4.3.1. Identifying Possible Variants of Reducing the Total Product Cost

A set of possible variants is identified using a CP that specifies decision variables, their domains, and constraints, including dependencies between variables. These dependencies refer to, among others, the duration of product design, the number of prototype tests, density of materials, and the specific cost (V1, V14, V15, V18). In the previous subsection related to the predictive analysis, the phase of product design was evaluated at 5 months, the number of prototype tests on 80 cycles, and density of materials on 290 units. The domains of the selected variables to analysis are as follows: D6 = {5, 6, 7}, D7 = {80, 81, …, 100}, D9 = {250, 251, …, 290}. It is worth noting that the variables in the model are specified in a discrete manner to solve the above-described problem using variable distribution and constraint propagation embodied in constraint programming. Consequently, the domains consist of integer numbers and the simulation step is related to the increase of these numbers by one for each variable separately. The number of possible solutions depends on the number of variables, their granularity in domains, and constraints. For example, the granularity of V9 (the amount of material used for manufacturing a new product) is in grams. The decrease of granularity for this variable (specified in milligrams) results in a more extensive search space to find possible solutions. In this study, the domain of variable V9 has been set for the granularity, by which the constraint programming techniques can be smoothly used.
The above-described problem was implemented in Mozart/Oz software that includes the programming paradigms, such as logic, functional, imperative, object-oriented, concurrent, constraint, and distributed programming. The advantage of a CP is related to its components related to constraint and distributed programming which are able to effectively solve many practical problems, for example, timetabling and scheduling problems, including optimization problems in production and distribution [54,55].
The identified relationships indicate that the increase of duration of product design and number of prototype tests can, to some extent, reduce the number of defective products, and as a result, reduce the cost of production and warranty, and finally, improve the customer satisfaction and loyalty. The criterion of selecting the best variant is the total product cost (TC = V1 + V2 + V3).
Table 3 presents a few possible variants of changes in the values of variables, for which the total product cost is less than the desirable level.
The set of possible solutions informs the decision-maker about changes that can be made during the stage of product design towards reducing the costs in production and after-sales service.

4.3.2. A Sensitivity Analysis for Evaluating the Net Present Value

The sensitivity analysis investigates the impact of seven variables on the projected net present value (NPV) from a new product. These variables are related to the costs of a new product, its price, and the anticipated sales volume. The costs include the phases of NPD, production, and after-sales service. The unit production cost consists of costs related to materials, labor, and energy used in manufacturing.
Figure 5 presents the sensitivity analysis for the above-mentioned variables changed at 10%. The strongest change was related to product price, for which the decrease at 10% reduced the NPV at 41% or the increase at 10% improved the NPV at 41%.
Sales volume and product price depend on the market properties, mainly customers and competitors’ strength. As a result, companies may control their costs in a higher grade compared to sales revenue. Among costs, the most significant impact on the NPV has the cost of materials that is the main factor of the unit production cost.
Table 4 presents a 10% change in the unit production cost and its impact on the total NPV. The reduction of the unit production cost of 10% increase the NPV of 4.71%, if other parameters are unchanged.
The scenario analysis can be developed towards changes in more than one parameter (e.g., material cost, warranty cost, unit price, and sales volume), indicating then the cumulative impact of a few variables on the NPV.

5. Conclusions

The presented approach supports NPD decision-makers in evaluating the total cost of a new product using analogical and parametric estimation models. Parametric cost estimation is based on artificial neural networks that identify relationships between input and output variables. Input variables refer to a product and its manufacturing process, whereas output variables to costs, including NPD, material, labor, and warranty repairs. The identified relationships are used not only to cost estimation but also towards improving the process of designing product and manufacturing. Dependencies between the material density, material consumption or prototype tests can influence a number of defective products, affecting not only the NPD cost, but also the cost of manufacturing and after-sales service.
The relationships identified by computational intelligence techniques were used not only for cost estimation, but also to search for the possibility of changes in product design, by which the cost was reduced, or the target cost was reached. If the estimated total cost of a new product has an unacceptable level for decision-makers, then they can be supported by simulating feasible changes in product design that reduce the cost of production and warranty repairs. The proposed model encompasses the product specification and company’s resources, and it is formulated in terms of a constrain satisfaction problem that includes decision variables, their domains, and constraints. Problem solution requires searching for the values of variables (e.g., material properties and prototype tests), by which the total product cost is reduced. The use of the CSP paradigm serves as a well-suited framework for developing a decision support system.
An additional advantage of the proposed approach also refers to the possibility of specifying other problems in terms of a CSP. For instance, a project selection problem can be formulated as a CSP, by adding appropriate variables and constraints. If there are considered for developing a few NPD projects in more than one product line, then decision-makers may be supported in project selection using multicriteria decision analysis, including identification of weighting parameters for evaluation criteria. The selection of an optimal project portfolio of new products can depend not only on sales- and cost-related factors but also on the strategic management of a business. For example, a costly and time-consuming NPD project of creating innovation can be more advantageous for a company from the strategic perspective than less expensive product customization. However, it is worth noting that the majority of companies modify their existing products instead of developing them anew.
The use of parametric modeling requires collecting enough amounts of data related to similar products what can be seen as a limitation of the proposed approach. Moreover, the specification of several parameters to build and learn artificial neural networks, as well as the implementation of constraint programming techniques can be counted as other limitations. Future research directions refer to identification of the impact of a number of decision variables, their granularity, and constraints on the time needed to obtain solutions, and the effectiveness of using constraint programming techniques. Furthermore, future research could focus on adding non-financial criteria for evaluating the potential of a new product.

Author Contributions

Conceptualization, M.R.; methodology, M.R.; validation, M.R. and A.G.; formal analysis, M.R. and A.G.; investigation, M.R. and I.N.; resources, M.R. and I.N.; writing—original draft preparation, M.R., I.N. and A.G.; writing—review and editing, M.R., I.N. and A.G.; visualization, M.R. and I.N.; project administration, M.R. All authors have read and agreed to the published version of the manuscript.

Funding

This research received no external funding.

Conflicts of Interest

The authors declare no conflict of interest.

References

  1. Paczkowski, W.R. Deep Data Analytics for New Product Development; Routledge: London, UK, 2020. [Google Scholar]
  2. Rayna, T.; Striukova, L. From rapid prototyping to home fabrication: How 3D printing is changing business model innovation. Technol. Forecast. Soc. Change 2016, 102, 214–224. [Google Scholar] [CrossRef] [Green Version]
  3. Newnes, L.B.; Mileham, A.R.; Cheung, W.M.; Marsh, R.; Lanham, J.D.; Saravi, M.E.; Bradbery, R.W. Predicting the whole-life cost of a product at the conceptual design stage. J. Eng. Des. 2008, 19, 99–112. [Google Scholar] [CrossRef]
  4. Nielsen, P.; Banaszak, Z.; Bocewicz, G.; Janardhanan, M.N. Intelligent manufacturing/production systems: Modeling, algorithms, and optimization. Adv. Mech. Eng. 2018, 10. [Google Scholar] [CrossRef]
  5. Rajab, S.; Sharma, V. A review on the applications of neuro-fuzzy systems in business. Artif. Intell. Rev. 2018, 49, 481–510. [Google Scholar] [CrossRef]
  6. Zarandi, M.H.; Asl, A.A.; Sotudian, S.; Castillo, O. A state of the art review of intelligent scheduling. Artif. Intell. Rev. 2020, 53, 501–593. [Google Scholar] [CrossRef]
  7. Relich, M.; Nielsen, I. Estimating production and warranty cost at the early stage of a new product development project. IFAC-Pap. 2021, 54, 1092–1097. [Google Scholar] [CrossRef]
  8. Yannou, B.; Harmel, G. A comparative study of constraint programming techniques over intervals in preliminary design. In Proceedings of the International Design Engineering Technical Conferences and Computers and Information in Engineering Conference, Salt Lake City, UT, USA, 28 September–2 October 2004; pp. 189–198. [Google Scholar]
  9. Yang, D.; Dong, M. A constraint satisfaction approach to resolving product configuration conflicts. Adv. Eng. Inform. 2012, 26, 592–602. [Google Scholar] [CrossRef]
  10. Relich, M.; Świć, A. Parametric estimation and constraint programming-based planning and simulation of production cost of a new product. Appl. Sci. 2020, 10, 6330. [Google Scholar] [CrossRef]
  11. Kuster, J.; Huber, E.; Lippmann, R.; Schmid, A.; Schneider, E.; Witschi, U.; Wüst, R. Project Management Handbook; Springer: Heidelberg, Germany, 2015. [Google Scholar]
  12. Spalek, S. Data Analytics in Project Management; CRC Press: Boca Raton, FL, USA, 2018. [Google Scholar]
  13. Ma, H.; Chu, X.; Xue, D.; Chen, D. A systematic decision making approach for product conceptual design based on fuzzy morphological matrix. Expert Syst. Appl. 2017, 81, 444–456. [Google Scholar] [CrossRef]
  14. Kang, Y.; Tang, D. Matrix-based computational conceptual design with ant colony optimisation. J. Eng. Des. 2013, 24, 429–452. [Google Scholar] [CrossRef]
  15. Zhang, Z.; Chu, X. A new approach for conceptual design of product and maintenance. Int. J. Comput. Integr. Manuf. 2010, 23, 603–618. [Google Scholar] [CrossRef]
  16. Raharjo, H.; Brombacher, A.C.; Xie, M. Dealing with subjectivity in early product design phase: A systematic approach to exploit Quality Function Deployment potentials. Comput. Ind. Eng. 2008, 55, 253–278. [Google Scholar] [CrossRef]
  17. Eppinger, S.D.; Browning, T.R. Design Structure Matrix Methods and Applications; MIT Press: Cambridge, MA, USA, 2012. [Google Scholar]
  18. Barbati, M.; Bruno, G.; Genovese, A. Applications of agent-based models for optimization problems: A literature review. Expert Syst. Appl. 2012, 39, 6020–6028. [Google Scholar] [CrossRef]
  19. Afshari, H.; Peng, Q. Modeling and quantifying uncertainty in the product design phase for effects of user preference changes. Ind. Manag. Data Syst. 2015, 119, 1637–1665. [Google Scholar] [CrossRef]
  20. Obitko, M.; Jirkovský, V.; Bezdíček, J. Big data challenges in industrial automation. In Industrial Applications of Holonic and Multi-Agent Systems; Springer: Berlin/Heidelberg, Germany, 2013; pp. 305–316. [Google Scholar]
  21. Raoufi, K.; Haapala, K.R.; Jackson, K.L.; Kim, K.Y.; Kremer, G.E.; Psenka, C.E. Enabling non-expert sustainable manufacturing process and supply chain analysis during the early product design phase. Procedia Manuf. 2017, 10, 1097–1108. [Google Scholar] [CrossRef]
  22. Jasiulewicz-Kaczmarek, M.; Antosz, K.; Wyczółkowski, R.; Mazurkiewicz, D.; Sun, B.; Qian, C.; Ren, Y. Application of MICMAC, Fuzzy AHP, and Fuzzy TOPSIS for Evaluation of the Maintenance Factors Affecting Sustainable Manufacturing. Energies 2021, 14, 1436. [Google Scholar] [CrossRef]
  23. Jasiulewicz-Kaczmarek, M.; Żywica, P.; Gola, A. Fuzzy set theory driven maintenance sustainability performance model: A multiple criteria approach. J. Intell. Manuf. 2021, 32, 1497–1515. [Google Scholar] [CrossRef]
  24. Peralta, M.E.; Alcalá, N.; Soltero, V.M. Weighting with life cycle assessment and cradle to cradle: A methodology for global sustainability design. Appl. Sci. 2021, 11, 9042. [Google Scholar] [CrossRef]
  25. Niemann, J.; Tichkiewitch, S.; Westkämper, E. Design of Sustainable Product Life Cycles; Springer: Berlin/Heidelberg, Germany, 2009. [Google Scholar]
  26. Sharma, J. A cross-disciplinary approach to product development and design through quality function deployment, target costing and value engineering. Int. J. Product. Qual. Manag. 2012, 9, 309–331. [Google Scholar] [CrossRef]
  27. Wiecek, D.; Wiecek, D.; Kuric, I. Cost estimation methods of machine elements at the design stage in unit and small lot production conditions. Manag. Syst. Prod. Eng. 2019, 27, 12–17. [Google Scholar] [CrossRef] [Green Version]
  28. Cavalieri, S.; Maccarrone, P.; Pinto, R. Parametric vs. neural network models for the estimation of production costs: A case study in the automotive industry. Int. J. Prod. Econ. 2004, 91, 165–177. [Google Scholar] [CrossRef]
  29. Liu, H.; Gopalkrishnan, V.; Quynh, K.T.; Ng, W.K. Regression models for estimating product life cycle cost. J. Intell. Manuf. 2009, 20, 401–408. [Google Scholar] [CrossRef]
  30. Kumar, P.S.; Behera, H.S.; Kumari, A.; Nayak, J.; Naik, B. Advancement from neural networks to deep learning in software effort estimation: Perspective of two decades. Comput. Sci. Rev. 2020, 38, 100288. [Google Scholar] [CrossRef]
  31. Habibi, F.; Birgani, O.; Koppelaar, H.; Radenović, S. Using fuzzy logic to improve the project time and cost estimation based on Project Evaluation and Review Technique (PERT). J. Proj. Manag. 2018, 3, 183–196. [Google Scholar] [CrossRef]
  32. Ciesla, B.; Mleczko, J. Practical application of fuzzy logic in production control systems of engineer to order SMEs. Appl. Comput. Sci. 2021, 17, 17–25. [Google Scholar]
  33. Rudnik, K.; Bocewicz, G.; Kucińska-Landwójtowicz, A.; Czabak-Górska, I.D. Ordered fuzzy WASPAS method for selection of improvement projects. Expert Syst. Appl. 2021, 169, 114471. [Google Scholar] [CrossRef]
  34. Relich, M. Portfolio selection of new product projects: A product reliability perspective. Eksploat. I Niezawodn. Maint. Reliab. 2016, 18, 613–620. [Google Scholar] [CrossRef]
  35. Yassine, A.A.; Mostafa, O.; Browning, T.R. Scheduling multiple, resource-constrained, iterative, product development projects with genetic algorithms. Comput. Ind. Eng. 2017, 107, 39–56. [Google Scholar] [CrossRef]
  36. Prasad, K.D.; Subbaiah, K.V.; Rao, K.N. Multi-objective optimization approach for cost management during product design at the conceptual phase. J. Ind. Eng. Int. 2014, 10, 421–424. [Google Scholar]
  37. Park, J.H.; Seo, K.K.; Wallace, D.; Lee, K.I. Approximate product life cycle costing method for the conceptual product design. CIRP Ann. 2002, 51, 421–424. [Google Scholar] [CrossRef]
  38. Relich, M. Computational intelligence for estimating cost of new product development. Found. Manag. 2016, 8, 21–34. [Google Scholar] [CrossRef] [Green Version]
  39. Vidgen, R.; Shaw, S.; Grant, D.B. Management challenges in creating value from business analytics. Eur. J. Oper. Res. 2017, 261, 626–639. [Google Scholar] [CrossRef]
  40. Mikalef, P.; Pappas, I.O.; Krogstie, J.; Giannakos, M. Big data analytics capabilities: A systematic literature review and research agenda. Inf. Syst. E-Bus. Manag. 2018, 16, 547–578. [Google Scholar] [CrossRef]
  41. Lepenioti, K.; Bousdekis, A.; Apostolou, D.; Mentzas, G. Prescriptive analytics: Literature review and research challenges. Int. J. Inf. Manag. 2020, 50, 57–70. [Google Scholar] [CrossRef]
  42. Davenport, T.; Harris, J. Competing on Analytics: Updated, with A New Introduction: The New Science of Winning; Harvard Business Press: Harvard, MA, USA, 2017. [Google Scholar]
  43. Krumeich, J.; Werth, D.; Loos, P. Prescriptive control of business processes. Bus. Inf. Syst. Eng. 2016, 58, 261–280. [Google Scholar] [CrossRef]
  44. Sun, K.; Li, Y.; Roy, U. A PLM-based data analytics approach for improving product development lead time in an engineer-to-order manufacturing firm. Math. Model. Eng. Probl. 2017, 4, 69–74. [Google Scholar] [CrossRef]
  45. Bertsimas, D.; Kallus, N. From predictive to prescriptive analytics. Manag. Sci. 2020, 66, 1025–1044. [Google Scholar] [CrossRef] [Green Version]
  46. Aljumah, A.I.; Nuseir, M.T.; Alam, M.M. Traditional marketing analytics, big data analytics and big data system quality and the success of new product development. Bus. Process. Manag. J. 2021, 29, 1108–1125. [Google Scholar] [CrossRef]
  47. Ali, S.; Poulova, P.; Yasmin, F.; Danish, M.; Akhtar, W.; Usama Javed, H.M. How Big Data Analytics Boosts Organizational Performance: The Mediating Role of the Sustainable Product Development. J. Open Innov. Technol. Mark. Complex. 2020, 6, 190. [Google Scholar] [CrossRef]
  48. Jank, M.H.; Dölle, C.; Schuh, G. Product portfolio design using prescriptive analytics. In Congress of the German Academic Association for Production Technology; Springer: Berlin/Heidelberg, Germany, 2018; pp. 584–593. [Google Scholar]
  49. Kaushal, A.; Shukla, M. Comparative analysis to highlight pros and cons of data mining techniques-clustering, neural network and decision tree. Int. J. Comput. Sci. Inf. Technol. 2014, 5, 651–656. [Google Scholar]
  50. Klein, P.; van der Vegte, W.F.; Hribernik, K.; Klaus-Dieter, T. Towards an approach integrating various levels of data analytics to exploit product-usage information in product development. In Proceedings of the Design Society: International Conference on Engineering Design, Delft, The Netherlands, 5–8 August 2019; Cambridge University Press: Cambridge, UK, 2019; Volume 1, pp. 2627–2636. [Google Scholar]
  51. Banaszak, Z. CP-based decision support for project driven manufacturing. In Perspectives in Modern Project Scheduling; Springer: Boston, MA, USA, 2006; pp. 409–437. [Google Scholar]
  52. Ilhami, M.A.; Masruroh, N.A. A mathematical model at the detailed design phase in the 3DCE new product development. Comput. Ind. Eng. 2020, 146, 106617. [Google Scholar] [CrossRef]
  53. Ren, S.; Gui, F.; Zhao, Y.; Zhan, M.; Wang, W. An effective similarity determination model for case-based reasoning in support of low-carbon product design. Adv. Mech. Eng. 2020, 12. [Google Scholar] [CrossRef]
  54. Antosz, K.; Pasko, L.; Gola, A. The use of intelligent systems to support the decision-making process in lean maintenance management. IFAC Pap. 2019, 52, 148–153. [Google Scholar] [CrossRef]
  55. Sitek, P.; Wikarek, J. A multi-level approach to ubiquitous modeling and solving constraints in combinatorial optimization problems in production and distribution. Appl. Intell. 2017, 48, 1344–1367. [Google Scholar] [CrossRef] [Green Version]
Figure 1. Product life cycle from a perspective of sustainable manufacturing (source: adapted from [21]).
Applsci 12 01921 g001
Figure 2. Costs related to different phases of a typical product life cycle.
Applsci 12 01921 g002
Figure 3. A framework for the proposed decision support system.
Applsci 12 01921 g003
Figure 4. Comparison of MAPEs for estimation models.
Applsci 12 01921 g004
Figure 5. Tornado chart for changes in NPV.
Applsci 12 01921 g005
Table 1. Similarity functions between the past and new product.
FeaturefPfRSF
Number of components0.750.8293%
Product size0.660.7492%
Product weight0.540.6688%
Material consumption0.820.7593%
Table 2. A set of the most similar products.
ProductSV (%)NPD Cost (Thousands)Material CostProduction CostEnergy CostOverhead Cost
P200173091.518311.8343.592.2517.52
P220008189.82109.7737.902.2117.52
P200117589.115610.6347.182.3217.52
Table 3. A set of possible variants of reducing the total product cost.
Values of VariablesTC
V6 = 7, V7 = 98, V9 = 2901099.54
V6 = 7, V7 = 98, V9 = 2841098.83
V6 = 7, V7 = 99, V9 = 2881099.77
V6 = 7, V7 = 99, V9 = 2811099.05
V6 = 7, V7 = 100, V9 = 285
1100.00
V6 = 7, V7 = 100, V9 = 2781099.28
Table 4. Scenario proposal for changes in the unit production cost.
ScenarioUnit Production CostChange in CostTotal NPV (Thousand)Change in Total NPVChange in Total NPV (%)
Optimistic38.4−4.27439.819.84.71%
Basic42.70420.000%
Pessimistic47.04.27400.2−19.8−4.71%
Publisher’s Note: MDPI stays neutral with regard to jurisdictional claims in published maps and institutional affiliations.

