1. Introduction
Augmented reality (AR) is a promising technology that has generated a great deal of interest in the last decade. It is expected to become key to the next generation of mobile consumer electronics devices [
1]. AR-technology is based on the superimposition of a virtual image on the image of the real world and can be used for entertainment, education [
2], medicine [
3], defense technologies [
4], and in other spheres of life [
5]. Personal wearable AR-devices, among which AR-glasses are the most demanded, have the most stringent technical requirements [
6]: for comfortable use by a mass consumer, AR-glasses must have compact dimensions, a wide field of view (FOV), small weight and low cost, as well as high resolution and image quality [
7].
To date, the best performance in accordance with the above requirements is achieved through the use of AR displays on planar waveguides with integrated holographic or diffractive optical elements (HOEs/DOEs) [
8]. The principle of operation of such displays is as follows: light from an image generation system (for example, a microprojector) falls on the input DOE, diffracts on it into the volume of the planar waveguide, and the diffracted light propagates inside the planar waveguide under the conditions of total internal reflection (TIR); then, the light is alternately diffracted by at least two other DOEs, due to which it multiplies in two dimensions and is removed from the volume of the waveguide into the user’s eye. The models of the largest companies on the AR market work according to this principle, including Digilens [
9], Microsoft [
10], WaveOptics [
11], and others. The main disadvantage of such systems is associated with a fundamental limitation on the maximum FOV provided: since light propagates in the volume of the waveguide under TIR conditions, these conditions limit the angular size of the transmitted image [
12,
13]. This limitation depends on the refractive index (
n) of the optical system, which is typically 1.5.
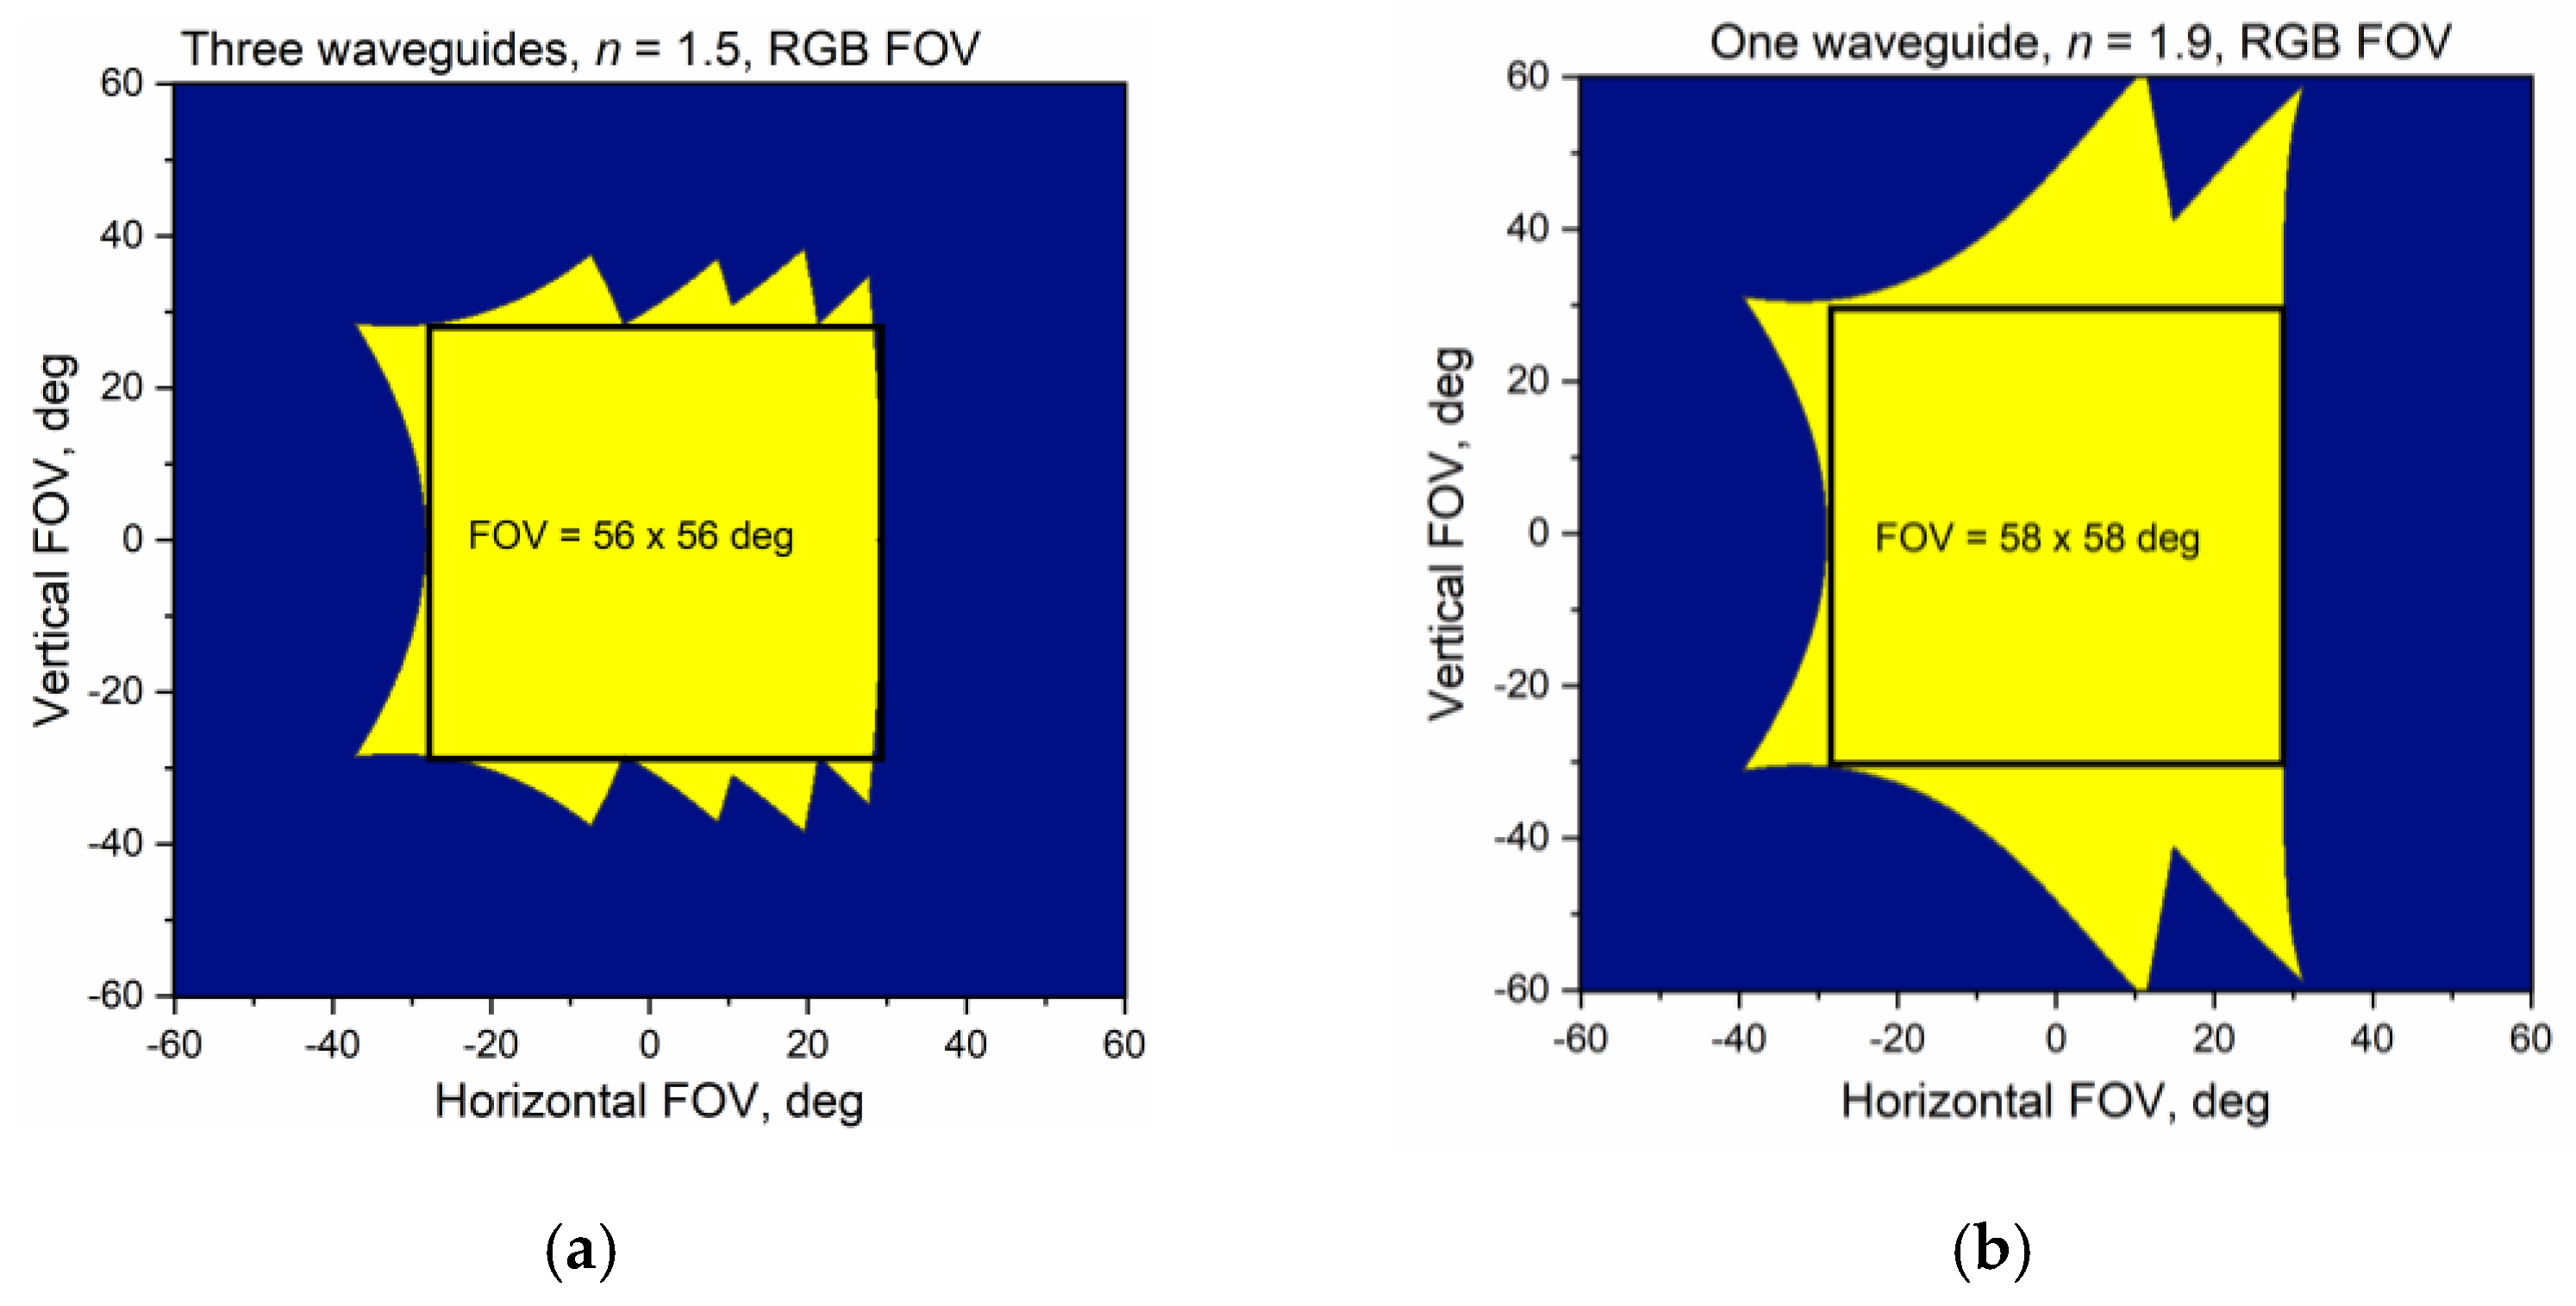
One of the most promising ways for increasing the field of view (FOV) of waveguide-based AR displays is to increase the refractive index of both the waveguide and the holographic material. Modeling comparison between refractive indices of 1.5 and 1.9 reveals that the red-green-blue (RGB) FOV reached with
n = 1.5 by three waveguides can be reached with
n = 1.9 by only one waveguide (
Figure 1) [
14].
Using high refractive index systems allows decreasing the thickness and weight as well as increasing the transparency and resolution of the AR display. While there are some existing glasses with refractive index of 1.9 for waveguides production, there are no holographic materials with such high refractive index.
One of the potential candidates for holographic material with high refractive index is chalcogenide glasses (ChGs) thin films, which are evaporated on the glass substrate. Chalcogenide glasses are semiconductor-based materials having photosensitive properties with refractive index modulation (Δ
n) up to 0.12. They can also be used for relief recording [
15,
16,
17,
18]. However, most of the ChGs compositions have high absorption (poor transparency) in blue wavelength range, which dramatically affects the resulted picture (
Figure 2).
It is possible to increase their transparency in the blue wavelength range through two ways. The first one is an optimization of the material composition. The other way of decreasing the losses is to decrease the ChG film thickness. The latter approach, however, has a drawback that is revealed in the efficiency loss. In the presented paper, the modeling of a single- and two-exposure HOEs diffraction efficiency depending on the ChG film thickness was carried out using rigorous coupled-wave analysis (RCWA) method. It allowed estimating desired parameters of ChG material for HOEs recording, namely material refractive index (>1.8 for single exposure and >2.1 for two exposure), material refractive index modulation (>0.1 for single exposure and >0.13 for two exposure), and material thickness (0.5–1 µm for single exposure and 1.65–2 µm for two exposure).
The number of Ge-S and As-S compositions have been synthesized and studied experimentally with the aim of using them for HOEs recording for augmented reality waveguide devices. Absorption spectra of these compositions were measured to detect their transparency in the blue wavelength range. Indeed, several newly synthesized Ge-S compositions demonstrated higher transparency as compared to traditional ChG materials, such as As-S. Then, relief and volume single-exposure gratings were recorded as well as their operation in periscope mode (in-coupling HOE–TIR-transmission through the waveguide–out-coupling HOE) was demonstrated. Diffraction efficiencies (DE) and recording kinetics of HOEs were measured. The former reached about 1% or less, wherein the recording exposures were high enough (several kJs).
Despite the fact that newly created compositions demonstrated rather weak holographic characteristics, the study showed that ChGs-based waveguides can provide FOV of >50 deg. That is why we consider that the present study is the basis for the future research and development of ChGs-based HOEs, and the proposed holographic materials are potentially suitable for AR applications.
2. Modeling Results
2.1. Efficiency-Thickness Modeling
At first, modeling was provided in RSoft software (version 2018.12) in order to find the acceptable ChGs thickness range for achieving proper diffraction efficiency of HOEs recorded in ChGs films.
Rigorous coupled-wave analysis method was used for the modeling [
19]. A stack of three materials was modeled, namely air, a thin layer of a ChG film, and a glass substrate. The dimension of the ChG segment in the
X direction was equal to one period of the simulated holographic grating (one period along
X was modeled). The stack was assumed to be periodically infinite in the
X direction, uniform in the
Y direction, and had finite dimensions in the
Z direction, which corresponded to the direction of incident light. The stack dimensions in the
Z direction were limited by the plane on which the incident wave was specified and the plane on which the diffracted wave was measured. The incident wave with
s-polarization propagated from the air towards the ChG film layer, while the diffraction response was measured in a glass substrate.
When modeling, the thickness of the ChG film layer and its refractive index varied in the ranges shown in the figures below. A sinusoidal distribution of the refractive index was set inside the film with the refractive index modulation Δn, which was also varied during the modeling in the ranges shown in the figures below. ChG film was considered optically isotropic and without absorption. Glass substrate was also considered without absorption; it had refractive index of 1.9, which was not changed during modeling.
Single-exposure modeling of two key parameters (maximum diffraction efficiency and a full width at half maximum (FWHM) of angular selectivity contour) for materials with different parameters was made. The variable parameters were as follows:
thickness (d): from 0.1 to 4 µm;
average refractive index (n0): from 1.8 to 2.2;
refractive index modulation (Δn): from 0.05 to 0.15.
At single-exposure modeling, a sinusoidal refractive index distribution profile was set inside the ChG film for each taken film thickness, n0 and Δn. The period of this profile along the X axis was chosen in such a way that a symmetrical FOV was introduced into the glass substrate from air; e.g., for 532-nm incident light and ChG refractive index n0 = 1.8, grating period along X axis was equal to 380 nm, and the TIR window was about 47 deg (from −23.5 to +23.5 deg). Here, it was assumed that the limitation on the FOV was set not by the refractive index of the glass but by ChG film refractive index. Then, the slant of the holographic planes of the grating relative to the Z axis was optimized to ensure location of the DE angular selectivity contour in the center of the FOV (symmetrically with respect to the center of the TIR window). This optimization was carried out numerically; a series of gratings with different slants of holographic planes was modeled, and finally, a specific slant was chosen at which the maximum of DE corresponded to normally incident light. Then this DE contour was processed by the in-house algorithm to obtain the values shown in the figures below.
The modeling results are depicted in
Figure 3.
Maximum DE depends dramatically on d and Δn but not so much on n0.
FWHM depends mostly on d, not much on n0, and does not depend on Δn.
To reach the minimal possible DE for output HOE (1%), the least possible d should be 0.25 µm for Δn = 0.15 and 0.9 µm for Δn = 0.05. To reach the minimal possible DE for input HOE (10%), the least possible d should be 0.9 µm for Δn = 0.15 and 2.9 µm for Δn = 0.05.
To fulfill the “TIR window” (which, in case of waveguide with n0 = 1.9, is 54 deg), d should be from 0.5 µm (for n0 = 1.8) to 0.65 µm (for n0 = 2.2).
We can make the following conclusions from the modeling results:
The desired HOE thicknesses range is from 0.5 to 1 µm. Less will be not selective enough (diffraction bleaches will start to occur), and more will be too selective (>2 exposures will be needed to fulfill the “TIR window”).
Until the waveguides with n0 > 1.9 are made, there is no need for material with n0 > 1.9 since it does not provide any huge benefits (the TIR window for waveguides with n0 = 1.8 is 50 deg).
The Δn = 0.05 can be enough for the output, but for effective input, it should be Δn > 0.1. Moreover, Δn parameter is the key one in terms of the performance increase.
It is necessary to make at least two exposures for each HOE since brightness uniformity will not be good enough with single exposure (for single exposure, the brightness fall will be about 50% on the edges and for two exposures, about 10%).
Correspondingly, the ChG material for HOE recording should have the following parameters:
n0 > 1.8 (1.9 is preferred; >1.9 is also considered but not necessary).
Δn > 0.1 (>0.15 is preferred). It is a key parameter.
d from 0.5 to 1 µm.
Ability to record multi-exposure HOEs.
2.2. Multi-Exposure Modeling
Next, modeling was made for a uniform filling of so-called TIR waveguide window (54 deg for waveguide with n = 1.9) with two reflection exposures in one layer of chalcogenide material in order to find its appropriate parameters. Two exposures are two reflection holograms with the same surface periods but different slant angles of their holographic planes inside the material.
We have chosen the following ranges of ChGs parameters for modeling:
average refractive index n0 from 1.9 to 2.2;
refractive index modulation (for both the exposures) Δn from 0.5 to 0.15;
thickness d from 0.8 to 3 µm.
Two exposures were modeled in a form of one gratings specified, in turn, as a function of two superimposed sines functions with the same period along the
X axis but different slant angles (relative to
Z axis). The modeling was carried out in the same way as the single exposure, but slant angles were optimized for two sub-gratings at the same time. Numerical optimization was carried out in order to have a symmetric FOV efficiency while having the best uniformity over the TIR window. For that, a series of gratings with different pairs of slant angles was modeled for each
n0, Δ
n, and
d parameters combination. The average efficiencies of the gratings were calculated then, and the grating with the least deviation from the average efficiency along the angular plane was chosen as the optimal one for this parameters combination. The results are presented in
Figure 4. The parameters of interest are diffraction efficiency and uniformity. The left graph illustrates the efficiency parameter by the value of maximal diffraction efficiency. The bunches of lines are distributed here by refractive index modulation, and within each bunch, different lines correspond to different average refractive index. The thing to point out is that efficiency depends more on the refractive index modulation. When we choose the minimal satisfying value of DE to be >10%, only thicknesses
d > 1.65 µm and refractive index modulation Δ
n > 0.13 fit this condition. The region where all these conditions are satisfied is highlighted by green rectangular in the left figure.
The right graph shows the uniformity by the value of average diffraction efficiency in the TIR window divided by maximal diffraction efficiency. The bunches of lines are distributed here by average refractive index, and within each bunch, different lines correspond to different refractive index modulation. The thing to point out is that uniformity depends more on the average refractive index. Here, we choose the minimal satisfying value of uniformity being >50% (to ensure the comfort of visual perception of the image). This condition gives us the large, blue, rectangular area in the right figure. When we correlate it with the condition on the thickness from the left part of the figure, we get a final region of satisfying parameters, highlighted by the red rectangular in the right graph. Here, only the average refractive index > 2.1 fits.
Thus, we can slightly correct ChG material parameters obtained in
Section 2.1. The optimal parameters concluded from this calculation are as follows:
average refractive index n0 > 2.1;
refractive index modulation (for both the exposures) Δn > 0.13;
thickness d from 1.65 to 2 µm.
3. Materials and Methods
In this study, we investigated three groups of the ChG samples. All of them were provided by Kurnakov Institute of General and Inorganic Chemistry of the RAS (Moscow, Russia).
The components of chalcogenide materials (99.999% purity) were sealed in evacuated (5 × 10
−3 Pa) quartz ampoules. Then, they were heated step by step to a temperature above melting point in a rocking furnace to ensure homogeneity of the melt. The melts were cooled and quenched to the room temperature using the switched-off furnace mode. Then, the ChGs thin films were prepared by thermal evaporation of the synthesized powders in vacuum chamber using Knudsen effusion cell. Residual pressure in the chamber was 10
−4 Pa. The temperature of glass substrates during evaporation did not exceed 50 °C. Scanning electron microscope with energy dispersive X-ray (EDXR) spectrometer was used for the microanalysis of fabricated thin films. The thicknesses of ChG films were controlled by the atomic-force microscope. Experimental results for the samples are divided into several following sections. In
Section 4.1, four samples of As
2S
3 compositions were tested for a holographic recording of volume and surface relief gratings. These are the most frequently used ChGs [
16,
20]. In
Section 4.2, volume and relief holograms were recorded in optimized ChG compositions. Several As-S and Ge-S samples were made and used for the investigation. All samples were in a form of 0.7–1-µm thickness films evaporated to glass substrates.
Holographic recording and the recording kinetics measurements were made either by standard two-beams recording scheme (
Section 4.1,
Section 4.2.1 and
Section 4.2.2) or using Lloyd interferometer recording setup (
Section 4.2.2, volume holograms) by DPSS and gas laser sources. Diffraction efficiency signal was controlled by laser diode irradiation of the sample during the recording and measurement of the diffracted signal. Features of the recording setups are shown below in corresponding figures.
4. Experimental Results and Discussion
The main emphasis in this work was placed on obtaining a practical (qualitative) result, namely synthesizing ChGs compositions with increased transmission in the blue spectral region, demonstrating possibility of recording volume and surface relief holographic gratings in such ChGs and their operation in the waveguiding mode. That is why, in the experiments described below, we did not vary refractive index modulation of the recorded holographic gratings according to model estimations made in
Section 2. Moreover, we did not obtain the experimental values of refractive index modulation, which could be determined from contours of DE angular selectivity.
Having such contours, RCWA method allows determining grating parameters, including refractive index modulation (and also grating thickness, the degree of attenuation of the refractive index modulation over the sample thickness for volume gratings, profile height for relief gratings). However, the measurement of the contours is a rather difficult task since the recorded high-frequency gratings are designed for diffraction in the total internal reflection mode [
21]. It means that their Bragg angle will either have a value close to slipping one, or the diffracted beam will not escape into the air from the substrate at all. Therefore, such an experiment should be carried out in the presence of immersion, but it is not within the scope of this work. The values of the refractive index modulation obtained by the modeling would be used in future work where they could be compared with the experimental ones.
4.1. Recordings on Common ChG Samples
Four samples of common As2S3 compositions were used for primary test recordings. These samples had strong absorption in blue spectral range, so the test recordings were made in order to provide red FOV. The samples had the following parameters: substrate refractive index, 1.7; ChG film refractive index, 2.2; ChG film thickness, 1 µm.
Holographic recording was made by standard two-beams recording scheme with 457-nm DPSS laser source, and linear polarized 650-nm laser diode was used to control the diffraction efficiency while recording (
Figure 5). Recording beams power density and polarization as well as ChG sample orientation could be changed throughout experiments.
Volume and surface non-slanted gratings were recorded by linear and circular polarized recording beams correspondingly, while the recording laser power density was 20 (for volume) and 120 mW/cm
2 (for surface). Beams polarization was chosen in accordance with [
20] to provide high grating DE. The period of the recorded gratings was set to 430 nm to transmit the red part of the FOV through the periscope system symmetrically. The resulted diffraction efficiency was 1% for olume non-slanted grating with the recording time
texp = 3 min and 10% for surface grating with the recording time
texp = 12 h. Photo of the surface grating is shown in
Figure 6.
To demonstrate periscope mode of holograms operation in waveguide devices (in-coupling HOE–TIR-transmission through the waveguide–out-coupling HOE), the recording of in-coupling/out-coupling HOEs system was carried out. The in-coupling surface relief hologram was recorded by circular polarized beams with total power density of 120 mW/cm
2 and 12-h exposition. Its diffraction efficiency reached 10%. The out-coupling volume hologram with diffraction efficiency of 1% was recorded with linear polarized light of the same power density during 30 s. The red image provided through the periscope system is presented in
Figure 7. From
Figure 7, it is seen that the image has good resolution and brightness. However, it is to be noted that only red and green colors can be transmitted through ChG glass-based holograms but not blue.
4.2. Chalcogenide Glasses with Optimized Compositions
4.2.1. The First Series of ChGs Samples
To increase blue color transmission through ChG, the first series of new samples with variety of compositions were produced: As
15S
85, As
12S
88, As
10S
90; Ge
20S
80, and Ge
24S
76. One As
2S
3 sample was used as reference one. Thickness of all samples was 700 nm; substrate glass thickness, 0.5 mm; substrate glass refractive index, 1.6. ChG film refractive index was ≥2.2. The photo of all samples is presented in
Figure 8.
Transmission spectra of these samples are shown in
Figure 9.
As it seen from
Figure 9, new samples have better transparency in blue range than the ChGs described in the previous section. Ge-S type compositions absorb light shorter than 450–440 nm; thus, such compositions should transmit blue light without significant loss and are suitable for AR purposes.
To check the photosensitivity of the suitable Ge-S samples, they were uniformly illuminated by 457-nm laser. After that, spectra of illuminated parts were measured again and compared with the initial spectra (
Figure 10). Measured spectra reveal that absorption edge of Ge-S type compositions shifts for about 25 nm to the shorter wavelengths after illumination, and illuminated regions became mostly transparent for human eye.
Using these newly created two Ge-S compositions, we recorded two volume holograms to form a periscope system. The recording parameters were as follows: recording wavelength, 457 nm; linear polarized beams; average power density, 100 mW/cm2; exposure time, 15–30 min; and period of the recorded gratings was set to 360 nm for symmetrically transmission the green part of the FOV through the periscope system Both the compositions of Ge-S type demonstrated similar dynamics and maximum diffraction efficiency of 1%.
Observing the image obtained, it is seen that blue light is well transmitted through the periscope system, and FOV is wide and limited only by substrate glass refractive index (
Figure 11). One of the main issues of the recorded periscope is its low efficiency. Several steps can be made to increase it, such as using shorter recording wavelength (i.e., 405 nm), slanted holographic gratings recording, sample thickness increase (up to several µm), and relief holograms recording.
4.2.2. The Second Series of ChGs Samples
In order to make ChGs samples more transparent in the blue spectral region and taking into account the recording results obtained in
Section 4.2.1, three new Ge-S compositions of chalcogenide glasses were synthesized (Ge
18S
82, Ge
25S
75, and Ge
30S
70). With previously used Ge
24S
76 and Ge
20S
80, they formed the second series of samples. These samples were characterized by a shift of fundamental absorption to the ultraviolet region of spectrum (
Figure 12). The thickness of all deposited ChGs films was about 1 μm, and the refractive index > 2.2.
Figure 12 shows possibility of synthesis a chalcogenide composites transparent in the visible range of the spectrum (red spectral range is not shown, but ChGs are highly transparent there).
However, the issue of holographic recording on the obtained samples was topical. To carry out holographic recording on these compositions, it was required to get into the absorption region of the material. In this regard, we used an ultraviolet (UV) 325-nm He-Cd laser for the recording. Verification of the possibility of recording volume holograms on chalcogenide composites started from registration of kinetic dependences of the holograms diffraction efficiency on the recording dose for all available samples. Kinetics of the hologram recording was studied in the Lloyd interferometer recording setup (
Figure 13).
We chose the Bragg angle of 10°; thus, the period of the recorded volume gratings was 935 nm.
s-Polarized recording beams were used, which did not affect the contrast of the interference pattern. Power density of the recording radiation was 230 µW/cm
2; thus, the exposure of 1 J/cm
2 could be achieved within just 137 s. Measurement of the kinetic dependences were carried out by 396-µW probing green light (
s-polarized 532-nm laser diode) during the recording process. Diffraction angle was 16.5° according to the Bragg law. Power measurements of transmitted and diffracted beams intensities were both done behind the sample. Recording kinetics for studied samples are presented in
Figure 14. It is to be noted that Ge
18S
82 sample was used as test one to choose the recording power density; that is why its DE was very low and is not shown in
Figure 14.
From
Figure 14, it is seen that the recording dynamics for Ge
25S
75 and Ge
30S
70 samples are much slower than for all others; however, these samples showed the highest diffraction efficiency. According to the kinetics trend, maximum efficiency can be expected in the range of 80–90 J/cm
2. Peak diffraction efficiency was not achieved due to extremely long exposure times. However, DE of 0.18% was measured at about 70 J/cm
2 exposure. In terms of recording time we see that sample Ge
25S
75 is the most sensitive to recording light among this set of samples.
It is also seen that the slower kinetics the higher peak diffraction efficiency, and the shift of the chalcogenide composite absorption edge to the ultraviolet wavelength region leads to a deterioration in the maximum diffraction efficiency of the recorded volume holograms (as it is seen from DE comparison of these samples and the ChGs from the first optimized compositions group,
Section 4.2.1).
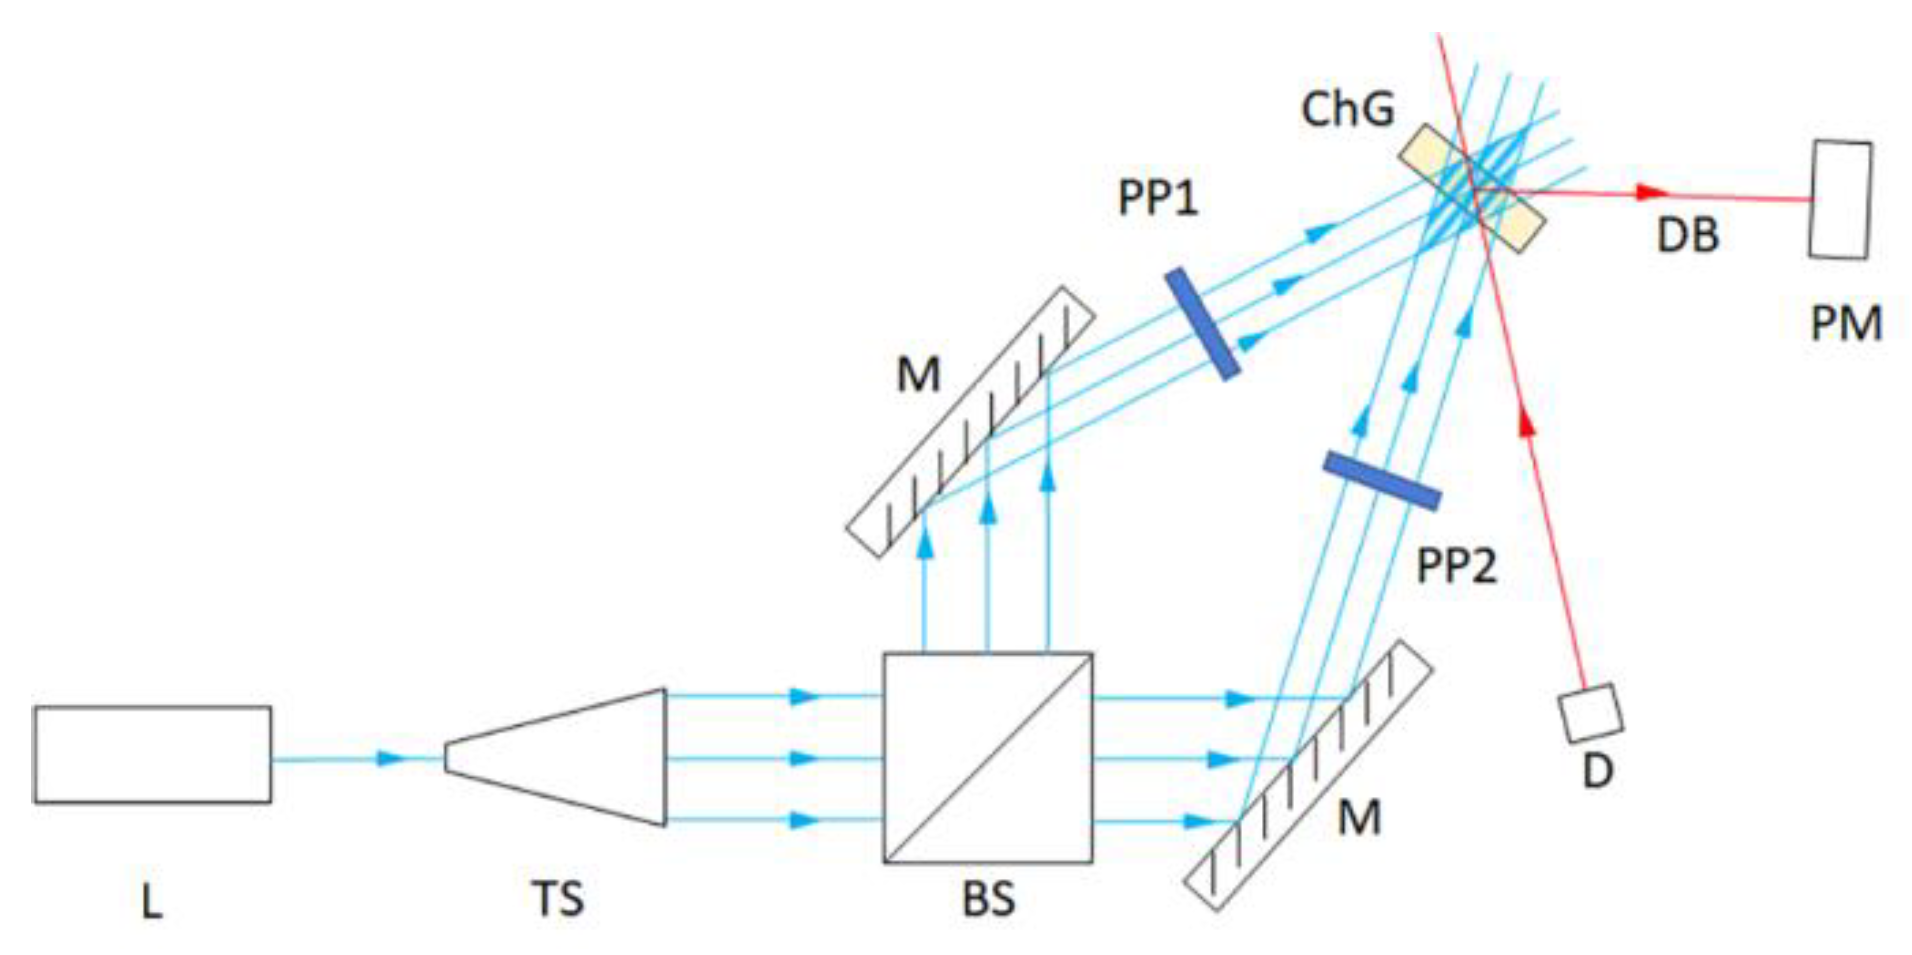
4.2.3. Relief Recording at the Second Series of ChGs Samples
It was known from previous publications (see, e.g., [
20]) that characteristic exposures for the relief gratings formation are in the range of kJ/cm
2. Therefore, this experiment required higher power densities than that for holographic recording of volume gratings. For the relief formation, the same UV laser (He-Cd, 325 nm) was used with +45°/−45° recording beams polarization configuration. Such orthogonally-polarized beams ensure low grating contrast but high surface relief grating modulation and DE [
20]. The need to rotate polarization of the recording beams restricted application of the Lloyd recording setup. Therefore, for this experiment, typical Michelson interferometer was assembled with nonpolarizing beam-splitting cube. Bragg angle was set again to about 10°; thus, the period of the relief grating should be the same as the period of above described volume gratings.
Figure 15 shows the scheme of the recording setup.
Power density at the sample was measured to be 2.1 W/cm2. Therefore, exposure of 1 kJ/cm2 could be achieved at 475 s. Efficiency of the grating was estimated with the same probing beam (s-polarized 532-nm laser diode, 396 µW). It should be noted that a part of a focused probing beam was coupled into the substrate plate and traveled away in the waveguide regime, thus leading to energy losses in the diffracted beam.
Relief gratings were successfully formed at all samples. Measurement of the DE was initiated after 1 kJ/cm
2 of the recording exposure was achieved. As it is seen from
Figure 16, four samples demonstrated nearly the same linear kinetics for the relief grating formation. However, sample Ge
30S
70 seemed to have nonlinear-growing kinetics. At 5 kJ/cm
2 almost all samples were able to achieve the same efficiency as that for the volume gratings.
4.2.4. Recording of Holographic Periscope System on GeS Sample
We made an attempt to record a holographic periscope system on Ge-S type samples. At first, the Ge
18S
82 sample from the second group of optimized samples was chosen for the recording due to its high transmission in blue spectral region (see
Figure 12). However, this sample showed low performance in recording volume gratings. Additionally, it was possible to record only one grating on the edge of the sample, while further attempts of the second grating recording failed due to high inhomogeneity of the sample. Only the Ge
24S
76 sample was uniform enough to record two volume gratings on the opposite edges of the sample for periscope system.
As a result, two gratings were recorded in Ge24S76 sample with diffraction efficiency of 0.1%. After a three-day break, efficiency dropped down to 0.08%. Distance between the gratings was approximately 3.5 cm.
Under the laser illumination, coupling of the light was seen through both gratings. However, strong decrease of the intensity was observed along the propagation, especially for blue light (
Figure 17).
We tested this periscope system in the wide range of incidence angles of the input light and wide range of laser power. Still, even with 200-mW laser power, no output was registered or observed by naked eye. From some angles of view, only output grating was visible due to the light scattering (
Figure 18). Thus, the attempt to verify the periscope system on Ge-S type samples was unsuccessful due to weak DE of holograms and sufficient medium absorption.
5. Conclusions
Within this work, chalcogenide films study was carried out both analytically and experimentally. Modeling allowed estimating the desired optical properties of ChGs to use them for HOEs/DOEs recording for AR-systems. Common and optimized compositions of ChGs films were synthesized, studied, and used for experimental investigation of volume and surface relief holographic gratings recording.
The study showed that the FOV provided by the ChGs-based waveguides can reach the values of >50 deg with proper substrate refractive index. It was also possible to reach high transparency in blue wavelength range by optimizing the ChG composition, while diffraction efficiency could be increased by means of relief recording. Thus, we consider that the proposed holographic materials are potentially suitable for AR applications.
However, the HOE recording in ChGs was extremely inefficient and unprofitable. Diffraction efficiencies reached only about 1% or less. The relief recording should have enormous exposure doses to obtain acceptable diffraction efficiency (several kJs). Moreover, the recording wavelength should be very carefully adjusted for each composition in order to be exactly at the edge of the composition absorption band. Such challenges reveal that the present study could be considered as the basis for the future research and development, which are needed before ChGs-based HOE waveguides can reach sufficient quality and efficiency.


 ,
, 