1. Introduction
Composite materials are extensively studied numerically and experimentally due to their increasing application in industry. Their behavior can be examined meticulously by incorporating multiscale methods that help achieving an in-depth understanding of the damage mechanisms. The transferring of information between scales allows for extracting the response of every material combination that consists of the microstructure and proceeding with the macroscale analysis, taking into account each phase’s behavior. Furthermore, mean field methods are computationally fast methods that allow for obtaining the full microstructural information for the entire simulation domain without the need to perform the modeling in such small scales. The combination of multiscale methods with fracture mechanics’ formulations permits the prediction of any damage mechanism that may appear in laminated composites under realistic constraints providing information with industrial relevance and value.
The mechanism of transverse cracking positions and delaminations in cross-ply composite materials is a well studied problem [
1,
2,
3]. The scale at which the composite material is modeled has a significant role in terms of the accuracy and the type of the damage mechanism that can be simulated. The smaller and more detailed the scale is, the more accurate the model will be and the more damage mechanisms that may be predicted. The governing damage mechanisms in a cross-ply Glass Fiber Reinforced Plastic (GFRP) loaded in uniaxial tension is the transverse cracking and the delaminations that could occur between the different oriented layers near the crack tips. There are different approaches and theories that can be applied to simulate cracks and delaminations successfully. In this study, a mesoscale and a microscale model are developed. The mesoscale approach is used in a dynamic explicit analysis along with rate dependent materials to predict the saturation of the transverse cracking and delaminations by using cohesive zone modeling techniques. The microscale approach is used to model the initiation of cracks and their propagation in a 3D cross-ply Representative Volume Element (RVE) using an extended finite element method (XFEM) in a quasi static analysis framework. The stress fields at the concentration areas around the crack tips of both methods are compared using strain concentration tensors to link the two scales.
In the existing literature, there are models that have been suggested concerning the simulation of interfacial properties. The most common and widely used approach is the XFEM [
4]. This method allows the modeling of discontinuities existing in the finite elements. Thus, it provides a tool for the insertion of matrix cracks independently of the mesh orientation. Despite the fact that most of the simulations of cracking initiation and propagation are performed using XFEM, this method has a limitation mainly imposed by the chosen analysis which has to follow the Implicit integration framework and not the Explicit. In the present mesoscale model, Explicit analysis is adopted where complex dynamic problems with contacts and large deformations can be solved. Another important fact introduced in the present investigation is the use of a cohesive interface instead of cohesive elements [
5] thus reducing the continuum shell elements of the model and avoiding the matching restrictions for the mesh of the adjacent layers.
In addition, homogenization theory was used to predict elastic properties for the multiphase materials instead of properties from literature or material databases. Homogenization methods and multi-scale analysis can easily be extended to the nonlinear regime [
6] for plasticity and damage to get a clear understanding about the inelastic response in the microstructure and observe which component of the composite has conceived damage. This multiscale modeling can be performed using a user defined material through a subroutine UMAT of ABAQUS usually coded in Fortran or coupling the solver with another multiscale modeling dedicated software [
3]. There are also other analytical and numerical homogenization schemes appropriate for continuous fiber reinforced composites such as Aboudi’s method of cells [
7] and FE-RVE homogenization schemes [
8,
9] with comparable results with the homogenization method used in this study [
10].
In the present work, a 3D mesoscale model was developed, regarding the layers of the laminate as a homogeneous, transversely isotropic medium and calculating their elastic properties using a two-step mean field homogenization methodology. The viscous effect of the matrix material during the homogenization strategy was taken into account. The interface between the [0/90]s layers is modeled with cohesive contacts. A finite number of cracks was placed at the 90
layers of the laminate assuming that their strength followed a Gaussian distribution, thus avoiding the development of uniform stress. This approach is different from the work by Fukunaga et al. [
11], where a Weibull distribution was used where a brittle behaviour for the 90
is assumed. The adopted methodology was preferred, among others, for computational stability. Four rows of elements were placed through the thickness of each ply so as to realistically model transverse cracking. By adopting this approach, the stress redistribution and the damage evolution process can be predicted and quantified.
2. Homogenization Procedure
2.1. Homogenization Method for Elastic Materials
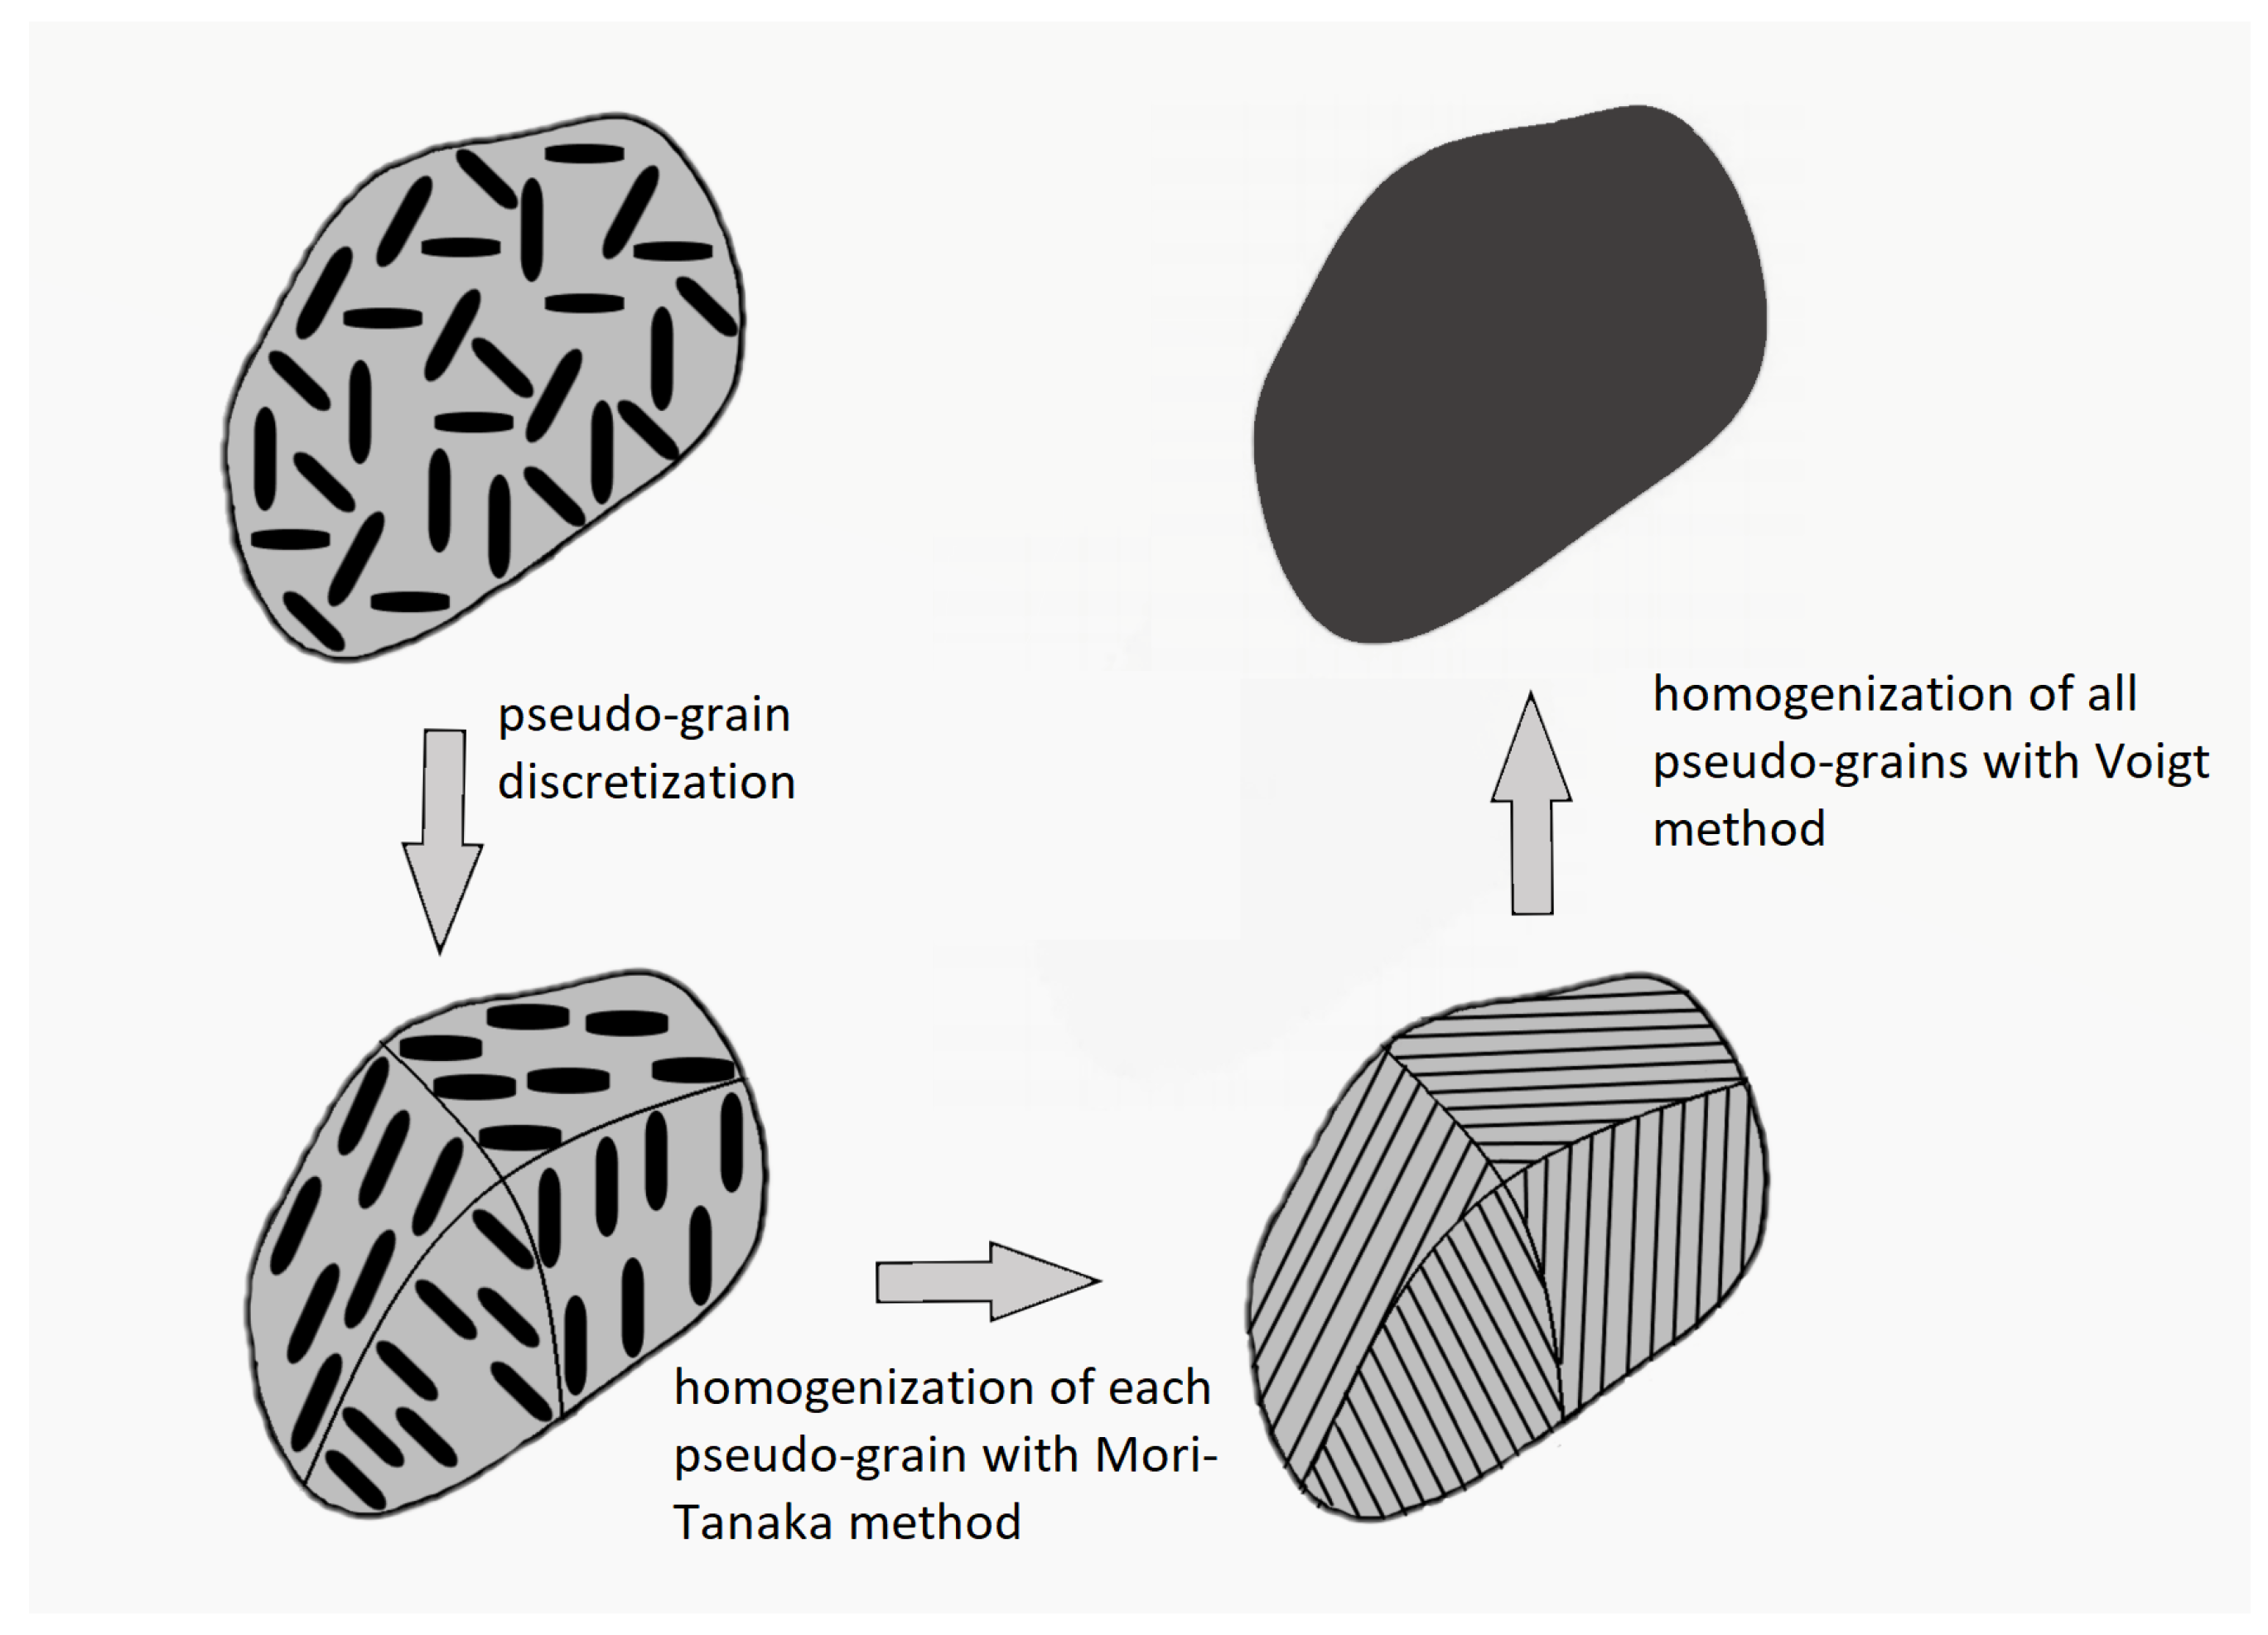
The elastic properties of the material are obtained using a two-step micromechanics homogenization algorithm. Firstly, all of the inclusion families were homogenized separately as a composite material with two phases following the Mori–Tanaka homogenization scheme [
12]. Secondly, all pseudo grains were homogenized to a single composite by adopting a Voigt homogenization approach, which is schematically depicted in
Figure 1 and in mathematical form can be described by
, where
is the homogenized stiffness tensor, and
is the stiffness tensor of the pseudo grain
i with volume fraction
. In case of a two-phase composite material such as a glass fiber reinforced polymer (GFRP) with unidirectional long fibers, the two-step method coincides with the simple Mori–Tanaka method. The homogenized stiffness tensor is given from the Mori–Tanaka formula:
where
stands for orientation averaging of fiber orientations, which can be ignored for aligned fibers. The quantities
,
are the stiffness matrices of the epoxy and the glass fibers, respectively. The volume fractions of the fiber and the matrix are denoted with
and
. In addition,
is the fourth order identity tensor, and
is the strain concentration tensor of the dilute solution defined as:
where
E is the Eshelby tensor that depends on the aspect ratio of the inclusion and the properties of the matrix material. The Eshelby tensor can be computed by using analytical solutions that have been developed for certain inclusion geometries and matrix materials. The general solution for inclusions of an arbitrary shape embedded in an isotropic matrix is described as follows:
where
The quantities involved are: the Poisson ratio
of the matrix,
are the three ellipsoid axes dimensions of the inclusions geometry, and
is the Kronecker’s delta and the numerical quantities
that are defined in terms of standard elliptic integrals and details can be found in [
12,
13].
The homogenization algorithm deals with the random orientations by performing orientational averaging using a fiber orientation tensor after retrieving a fourth order tensor using hybrid closure approximation [
14]. To calculate the effective properties of a continuous fiber reinforced composite, the ellipsoid principal dimension that corresponds to the fiber’s axis is much bigger than the other two axes’ dimensions:
and
.
2.2. Homogenization of Viscoelastic Materials
In the present study, the viscous effect of the matrix is manifested employing a viscoelastic homogenization scheme that takes into account prony series viscoelasticity. On the other hand, the glass fibers are considered as linear elastic for normal temperatures. The material model of the viscoelastic matrix medium follows the following constitutive equation:
where the stress (
) and strain (
) second order tensors are invoked,
is the relaxation tensor,
the viscoelastic (indicated by the ve superscript) strain rate tensor,
is the deviatoric part of the fourth order unit tensor, and
is the second order unit tensor. The juxtaposition symbol ⊗ represents the dyadic product. The prony series expression of the bulk and shear modulus is given by:
where
are the weights for the respective relaxation times
.
The relation
is the elastic analogous of Equation (
9) for isotropic materials in the Laplace–Carson domain. The quantities invoked
,
and
are the transformed stress, stiffness and strain tensor in the Laplace domain, while
s is the complex variable. This leads to a fictitious RVE in the Laplace–Carson domain [
15], and the homogenization results are expressed as functions of
s. Inevitably, an inverse Laplace–Carson transformation is required to calculate the results in the time domain [
16]. The prony series values for the viscoelastic homogenization are taken from the literature [
17].
3. Modeling a Cross Ply Composite Material [0/90]s
In the relevant literature, several micromechanical [
18,
19] or mesoscale [
20,
21,
22,
23,
24,
25,
26] approaches have been proposed. In this study, the material at each ply is a transversely isotropic material whose elastic properties were calculated with a Mori–Tanaka micromechanical formula based on Eshelby’s solution [
13], and the structural simulation follows a mesoscale approach. The material properties’ values used were the Young’s modulus of epoxy resin (5.5 GPa), glass fiber (73.1 GPa) and the respective Poisson’s ratio values were 0.395 and 0.18. The shape of the glass fibers having
= 0.63 is described by their aspect ratio, which was 10,000.
The total composite elastic properties after homogenization procedure are reported in
Table 1. The viscous effects’ contribution of the matrix material to the whole composite with respect to time can be seen in
Figure 2. The strength values, including Interlaminar Shear Strength (ILSS) for the homogenized GFRP material, are taken from the literature [
27].
In order to model the interfaces between the layers, cohesive contacts are used in a nonlinear analysis framework. The adoption of cohesive contacts dominated the alternative options of cohesive elements or XFEM. The cohesive elements approach has two undesirable effects. The first one is the significant increase of the total finite elements number, and the second one has to do with the meshing procedure of the different layers, which should discretized in a rather restrictive similar manner. As should be stressed, the XFEM approach cannot be used in the dynamic analysis framework with explicit integration. In the traction-separation model of ABAQUS, a linear elastic behavior is initially assumed followed by the initiation and evolution of damage. The elastic behavior is expressed in terms of an elastic constitutive matrix that relates nominal stresses to nominal strains across the interface. The maximum shear stress criteria are employed to model the failure at the contacts.
The model material geometry is represented by a domain between two adjacent cracks that is undamaged and has a 30 mm length. Every layer has a 0.25 mm thickness value and the composite is loaded uniaxially. Tabular data are employed for the incremental application of the strain up to a total value of 1.5% using a loading duration of 270 s. The geometry of the model is depicted in
Figure 3.
For the geometry mesh generation procedure, four rows of continuum shell elements along the thickness direction of each laminate were placed for higher accuracy, resulting in a total number of 96,000 continuum SC8R type shell elements.
The placement of a high number of potential cracks permits the successful prediction of random matrix cracking (
Figure 4). For every potential crack location, different strength values are attributed as non-uniform stresses are developed, as the latter would lead to the simultaneous failure for all interfaces at the cohesion zone.
The contacts’ strength follows a Gaussian distribution with a mean equal to the strength of the matrix and 15% standard deviation.
4. Results and Discussion
It should be pointed out that all the expected failure mechanisms appear in the present simulation study. Initially, the first transverse cracks are formed. As the loading continues, interfacial delaminations are evident. The existence of a shear lag zone ([
28,
29,
30]) is being revealed. In the sequel, the crack density simulation predictions are compared with existing experimental measurements. Finally, it is shown how the ILSS affects the delamination length and the total strength of the total composite material.
4.1. Delaminations and Shear Lag Zone
Cohesive zone modeling (CZM) provides a simulation pathway to model cohesion for interfaces with zero thickness. In the present study, it is used to simulate matrix cracking and delamination. As aforementioned, prior to damage, a linear elastic behavior is assumed in this traction separation model, which is valid. The aforementioned behavior is given by the following equation:
The quantities involved are the normal () and the two () shear tractions, respectively. The corresponding separations are . It is crucial to underline that the cohesive contact is an interaction and not a material property, which is thus interpreted differently from cohesive elements. Additionally, CZM necessitates a geometrical nonlinear analysis.
In
Figure 5, the calculated quantity
denotes the criterion for damage initiation for the quadratic contact stress. If
= 1, the criterion is fulfilled. It should be stressed that the
value cannot exceed 1 so as to specify damage evolution. For CZM, damage progression is manifested by the reduction of stiffness of the cohesive contacts, whereby, in the case of cohesive elements, damage propagation corresponds to stiffness degradation for the material itself. The present work is adopted based on energy criteria, following the analytical forms proposed by Benzeggagh and Kenane [
31]. The aforementioned forms are useful in cases where the critical energies become equal during separation along the two shear directions (
) and
with the quantities involved being the cohesive property parameter
, and
are respectively the required critical fracture energies for failure at the normal, the first and the second direction.
As the first cracks appear and the loading continues, almost immediately delaminations [
32] are initiated too. At the area over and under the tip of the cracks, stress concentration is observed. The cracked composite material and the extension of the delamination area around the cracks are depicted in
Figure 5.
The shear lag zone is apparent. In this zone, the normal tensile stresses are almost zero, while the shear stresses at the interface are high, and this constitutes the main reason for delamination appearance. As we move away from that zone, the exact opposite seems to happen; as the normal stresses are high, the next cracks of the composite will be far enough from an existing crack. The zone’s size strongly depends on the: (i) layer thickness, (ii) stiffness of the outer layers and the (iii) value of the interlaminar shear strength.
4.2. Comparison with Experiments
In the present section, comparisons with available experimental measurements [
33] are given. Due to strength stochasticity of the 90
C layers, there is a continuous transverse matrix cracking. Some representative screenshots during the analysis are presented in
Figure 6. Simulation predictions included in a crack density versus strain diagram are compared with experimental data and depicted in
Figure 7.
The initial cracking and cracking saturation occur for similar axial strain values for both experimental and simulation data. The standard deviation value of the distribution plays a significant role in the cracking density because it can lead to weaker or stronger contacts affecting the final crack density. It is worth mentioning that, in the simulation protocol, the load was applied at a constant strain rate through tabular data describing the strain values at the corresponding time of the analysis. Finally, from the two simulation curves of
Figure 7, it can be observed that the increase of the composite’s stiffness increases the crack density too.
For a strain value around 0.4%, the first crack develops and subsequently more cracks appear. In
Figure 6, where the second and third time steps are depicted, the total axial strain values are 0.5% and 0.8%, respectively, while, for axial strain around 1.2%, saturation of crack density takes place.
4.3. Mesh Sensitivity Analysis
In the framework of continuum mechanics, the stress–strain relations of a material define the constitutive model. In case of strain softening behavior of a material strain, localizations can appear, resulting in strong mesh dependency of the solution. As a result, mesh refinement can decrease the energy dissipation. To alleviate mesh dependency, the ABAQUS solver introduces a characteristic length in the formulations that is related to the size of the element and expresses the strain softening part as a stress displacement relation. Thus, the dissipated energy during damage is given per unit area and not per unit volume and is treated as a material property that is used to calculate the critical displacement for damage initiation. The above method is also consistent with the fracture mechanics concept of the critical energy release rate where it is also treated as a material parameter [
34].
The cross-ply composite model was solved for five different meshes to examine the mesh dependency having 8000, 45,144, 96,000, 208,306, and 352,688 continuum shell elements, respectively, and the results are shown in
Figure 8. It can be concluded for all four models that the cracking saturation occurs with the same number of cracks. The only result that significantly differentiates in coarse meshes and seems to stabilize as the mesh becomes finer is the mean delamination length (
Figure 9). This result is calculated as an average value from the sum of the delamination length of each crack divided by the number of cracks.
This can be attributed to the small number of elements which translates to a small number of integration points. Inevitably, the results are extrapolated to a larger but unnecessary area. This phenomenon disappears by using an adequate number of elements, which was higher than 45,000 elements for the specific geometry of the presented model. It should be stressed that, for the consistent and successful simulation of the crack profile, more than one row of elements are needed per layer of the composite material.
5. Crack Growth in Microscale Using Fracture Mechanics
As mentioned, XFEM is a popular method for the solution of quasi-static problems containing cracks and interfaces that are mesh independent. The solution is attainable with the enrichment of elements that are intersected by the discontinuity, using special shape functions to handle the singularities and local discontinuities around the crack.
In
Figure 10, a cross-ply composite RVE model (with characteristics as mentioned in
Section 3) is constructed and loaded in uniaxial tension that is applied through Dirichlet-type boundary conditions by using the strain results of the macroscale model. The cracking propagation simulated with XFEM is shown as the loading increases. In particular, as the crack propagates, the stress in the middle layer reduces while stress concentration in the crack tips is evident, in agreement with the macroscale model. In
Figure 11, the stress concentration values at the crack tips are compared against the simulation predictions of microscale and macroscale models.
However, the stress profiles cannot be directly compared due to the different representation scales. The macro model refers to the stress concentration upon a homogenized material and the micro model refers to the stress concentration upon the fiber. For their direct comparison, the stress in macro model needs to be localized using the stress concentration tensor of Hill’s [
35] theories, which invoke the following equations:
The quantities involved are the compliance tensors of the fiber (), the matrix () and the homogenized composite material M, is the volume fraction of the fiber, and is the Hill’s fiber stress concentration tensor. The stress concentration tensor connects the stress tensor of a constituent with that of the composite, making the direct comparison of the two models possible.
The maximum stress tensor of the homogenized material in the stress concentration area that occurred from the macro scale analysis in Voigt notation is = [1833.04 −51.04 −53.82 1.71 0.56 −8]. The von Mises stress of the fiber that occurred from the stress localization is 2958.3 Mpa, which is close to the prediction of the XFEM model around 2894 Mpa.
6. Conclusions
In this study, a model is proposed for the simulation of damage in cross-ply composite materials. The model incorporates shear-lag effect for the determination of the stress transfer and furthermore it adopts a semi-analytical homogenization procedure for the calculation of elastic and viscoelastic material properties based on the Mori–Tanaka and Voigt approaches. The homogenization algorithm can take into account random orientations by performing orientational averaging using the fibers’ orientation tensor. Random matrix cracking was simulated by placing a large number of possible cracks with their strength following a normal distribution and is modeled with a CZM technique. Mesh sensitivity analysis has been performed showing that cracking saturation occurs with the same number of cracks guaranteeing the consistency of computations. The production simulations revealed that all the anticipated damage mechanisms are evident. Initially, transverse cracks appeared and almost simultaneously made their presence clear delaminations at the interfaces near the crack tip. After the cracking initiation, stress redistributions were apparent. Overlapping stress field may be observed too, in the case where two adjacent cracks are in close proximity. Simulation predictions for the crack density as a function of strain are compared with available experimental data showing reasonable agreement. Finally, a cross-ply RVE model was created and loaded in uniaxial tension in a crack propagation analysis with XFEM. The stress concentrations around the crack tips are in agreement with the mesoscale model.
The proposed methodology with the proper modifications and additional development can be used towards the simulation of self-healing of materials and the authors work in that direction.
Author Contributions
Conceptualization, A.S.P.; methodology, E.T., L.N.G. and A.S.P.; software, E.T.; validation, E.T., L.N.G. and A.S.P.; formal analysis, E.T., L.N.G. and A.S.P.; investigation, E.T.; data curation, E.T. and L.N.G.; writing—original draft preparation, E.T. and L.N.G.; writing—review and editing, E.T., L.N.G. and A.S.P.; visualization, E.T.; supervision, L.N.G. and A.S.P. All authors have read and agreed to the published version of the manuscript.
Funding
This research received no external funding.
Institutional Review Board Statement
Not applicable.
Informed Consent Statement
Not applicable.
Data Availability Statement
The raw/processed data required to reproduce these findings cannot be shared at this time as the data also forms part of an ongoing study.
Conflicts of Interest
The authors declare no conflict of interest.
References
- Berthelot, J.M.; Le Corre, J.F. Modelling the transverse cracking in cross-ply laminates: Application to fatigue. Compos. Part B Eng. 1999, 30, 569–577. [Google Scholar] [CrossRef]
- Herraez, M.; Mora, D.; Naya, F.; Lopes, C.; Gonzalez, C.; Llorca, J. Transverse cracking of cross-ply laminates: A computational micromechanics perspective. Compos. Sci. Technol. 2015, 110, 196–204. [Google Scholar] [CrossRef]
- Tsivolas, E.; Gergidis, L.N.; Paipetis, A.S. Prediction of damage mechanisms of cross-ply composite materials using novel nonlinear multiscale methodologies. Model. Simul. Mater. Sci. Eng. 2021, 29, 085015. [Google Scholar] [CrossRef]
- Moes, N.; Dolbow, J.; Belytschko, T. A finite element method for crack growth without remeshing. Int. J. Numer. Methods Eng. 1999, 46, 131–150. [Google Scholar] [CrossRef]
- Shi, Y.; Pinna, C.; Soutis, C. Interface Cohesive Elements to Model Matrix Crack Evolution in Composite Laminates. Appl. Compos. Mater. 2014, 21, 57–70. [Google Scholar] [CrossRef]
- Ogierman, W.; Kokot, G. Homogenization of inelastic composites with misaligned inclusions by using the optimal pseudo-grain discretization. Int. J. Solids Struct. 2017, 113–114, 230–240. [Google Scholar] [CrossRef]
- Aboudi, J. Micromechanical Analysis of Composites by the Method of Cells. Appl. Mech. Rev. 1989, 42, 193–221. [Google Scholar] [CrossRef]
- Kassem, G.; Weichert, D. Micromechanical material models for polymer composites through advanced numerical simulation techniques. PAMM 2009, 9, 413–414. [Google Scholar] [CrossRef] [Green Version]
- Tsivolas, E.; Gergidis, L.N.; Paipetis, A.S. Computational Multi-Scale Modelling of Fiber-Reinforced Composite Materials. In Advances in Fracture and Damage Mechanics XVIII; Trans Tech Publications Ltd.: Stafa-Zurich, Switzerland, 2020; Volume 827, pp. 263–268. [Google Scholar]
- Pierard, O.; Friebel, C.; Doghri, I. Mean-field homogenization of multi-phase thermo-elastic composites: A general framework and its validation. Compos. Sci. Technol. 2004, 64, 1587–1603. [Google Scholar] [CrossRef]
- Fukunaga, H.; Chou, T.W.; Peters, P.; Schulte, K. Probabilistic Failure Strength Analyses of Graphite/Epoxy Cross-Ply Laminates. J. Compos. Mater. 1984, 18, 339–356. [Google Scholar] [CrossRef]
- Mura, T. Micromechanics of Defects in Solids; Martinus Nijhoff Publishers: Leiden, Belgium, 1988; p. 588. [Google Scholar]
- Eshelby, J.D. The Determination of the Elastic Field of an Ellipsoidal Inclusion, and Related Problems. Proc. R. Soc. Lond. Ser. A 1957, 241, 376–396. [Google Scholar]
- Advani, S.G.; Tucker, C.L. The Use of Tensors to Describe and Predict Fiber Orientation in Short Fiber Composites. J. Rheol. 1987, 31, 751–784. [Google Scholar] [CrossRef]
- Friebel, C.; Doghri, I.; Legat, V. General mean-field homogenization schemes for viscoelastic composites containing multiple phases of coated inclusions. Int. J. Solids Struct. 2006, 43, 2513–2541. [Google Scholar] [CrossRef] [Green Version]
- Schapery, R. A Simple Collocation Method for Fitting Viscoelastic Models to Experimental Data; GALCIT SM 61-32A; California Institute of Technology: Pasadena, CA, USA, 1962. [Google Scholar]
- Galuppi, L.; Royer-Carfagni, G. Laminated beams with viscoelastic interlayer. Int. J. Solids Struct. 2012, 49, 2637–2645. [Google Scholar] [CrossRef] [Green Version]
- Xia, Z.; Chen, Y.; Ellyin, F. A meso/micro-mechanical model for damage progression in glass-fiber/epoxy cross-ply laminates by finite-element analysis. Compos. Sci. Technol. 2000, 60, 1171–1179. [Google Scholar] [CrossRef]
- Mora, D.; Gonzalez, C.; Lopes, C.; Naya, F.; Llorca, J. Analysis of transverse cracking in unidirectional composite plies by means of computational micromechanics. In Proceedings of the 16th European Conference on Composite Materials, ECCM16, Seville, Spain, 22–26 June 2014. [Google Scholar]
- Lim, S.; Hong, C. Prediction of Transverse Cracking and Stiffness Reduction in Cross-Ply Laminated Composites. J. Compos. Mater. 1989, 23, 695–713. [Google Scholar] [CrossRef]
- Ghayour, M.; Hosseini-Toudeshky, H.; Jalalvand, M.; Barbero, E.J. Micro/macro approach for prediction of matrix cracking evolution in laminated composites. J. Compos. Mater. 2016, 50, 2647–2659. [Google Scholar] [CrossRef] [Green Version]
- Gorris, T.; Bernard, P.É.; Stainier, L. A study of transverse cracking in laminates by the Thick Level Set approach. Mech. Mater. 2015, 90, 118–130. [Google Scholar] [CrossRef] [Green Version]
- Mortell, D.; Tanner, D.; McCarthy, C. In-situ SEM study of transverse cracking and delamination in laminated composite materials. Compos. Sci. Technol. 2014, 105, 118–126. [Google Scholar] [CrossRef]
- Dharani, L.R.; Wei, J.; Ji, F.S.; Zhao, J.H. Saturation of Transverse Cracking with Delamination in Polymer Cross-Ply Composite Laminates. Int. J. Damage Mech. 2003, 12, 89–114. [Google Scholar] [CrossRef]
- Khokhar, Z.R.; Ashcroft, I.; Silberschmidt, V. Interaction of Matrix Cracking and Delamination in Cross-ply Laminates: Simulations with Stochastic Cohesive Zone Elements. Appl. Compos. Mater. 2011, 18, 3–16. [Google Scholar] [CrossRef] [Green Version]
- Garcia, I.; Mantic, V.; Blazquez, A.; Paris, F. Transverse crack onset and growth in cross-ply [0/90]s laminates under tension. Application of a coupled stress and energy criterion. Int. J. Solids Struct. 2014, 51, 3844–3856. [Google Scholar] [CrossRef] [Green Version]
- Kaddour, A.; Hinton, M.; Smith, P.; Li, S. Mechanical properties and details of composite laminates for the test cases used in the third world-wide failure exercise. J. Compos. Mater. 2013, 47, 2427–2442. [Google Scholar] [CrossRef]
- Nairn, J.; Hu, S. Micromechanics of damage: A case study of matrix microcracking. In Damage Mechanics of Composite Materials; Talreja, R., Ed.; Elsevier: Amsterdam, The Netherlands, 1994; pp. 117–138. [Google Scholar]
- Nairn, J. On the use of shear-lag methods for analysis of stress transfer in unidirectional composites. Mech. Mater. 1997, 26, 63–80. [Google Scholar] [CrossRef]
- Nairn, J. Matrix microcracking in composites. In Polymer Matrix Composites, Comprehensive Composite Materials; Talreja, R., Manson, J., Eds.; Elsevier Science: Amsterdam, The Netherlands, 2000; pp. 403–432. [Google Scholar]
- Benzeggagh, M.; Kenane, M. Measurement of mixed-mode delamination fracture toughness of unidirectional glass/epoxy composites with mixed-mode bending apparatus. Compos. Sci. Technol. 1996, 56, 439–449. [Google Scholar] [CrossRef]
- Carraro, P.A.; Novello, E.; Quaresimin, M.; Zappalorto, M. Delamination onset in symmetric cross-ply laminates under static loads: Theory, numerics and experiments. Compos. Struct. 2017, 176, 420–432. [Google Scholar] [CrossRef]
- Katerelos, D.T.G.; Paipetis, A.; Loutas, T.; Sotiriadis, G.; Kostopoulos, V.; Ogin, S.L. In situ damage monitoring of cross-ply laminates using acoustic emission. Plast. Rubber Compos. 2009, 38, 229–234. [Google Scholar] [CrossRef]
- ABAQUS. ABAQUS/CAE User’s Manual; ABAQUS: Pawtucket, RI, USA, 2012. [Google Scholar]
- Hill, R. Theory of mechanical properties of fibre-strengthened materials: I. Elastic behaviour. J. Mech. Phys. Solids 1964, 12, 199–212. [Google Scholar] [CrossRef]
| Publisher’s Note: MDPI stays neutral with regard to jurisdictional claims in published maps and institutional affiliations. |
© 2022 by the authors. Licensee MDPI, Basel, Switzerland. This article is an open access article distributed under the terms and conditions of the Creative Commons Attribution (CC BY) license (https://creativecommons.org/licenses/by/4.0/).


